Ý Ë³ ² · 2019-11-27 · from excluding hydro and cement-kiln additive fuel, and redefining 4...
TRANSCRIPT


참여연구진


<요 약>
1.
(Computable General Equilibrium: CGE)
.
,
.
(Renewable Portfolio Standards: RPS)
.
, 2008
.
( )
( ) .
2.
.
.

. 403
.
,
104 .
( )
.
( )
.
.
18 1 .
1 22
, ‧ 4
.
. (
) 30 ( 21 , 9 )
( ) 104 .
3.
,
.

, ,
.
( )
( )
.
.
, 1
1
.
,
.
.
. ,
2010
. ,
. ,
GTAP-E
.


ABSTRACT
1. Research Purpose
Input-output(IO) and computable general equilibrium(CGE) models
have been often used to evaluate the performance of renewable
energy(RE) policies. Nevertheless, comprehensive research has not
been conducted to extend the conventional IO table to show RE
industries explicitly. The IO table extended as such is essential for
the IO and CGE analyses of policies, for example, renewable
portfolio standards.
Thus this study made a renewable energy IO table, based on the
estimated transaction values of RE and the usual IO table for year
2008 published by the Bank of Korea(BOK). And the study
tabulated the sectoral calorific quantity flows of depletable and
renewable energy sources by the combined use of the extended IO
table and the energy balance(EB) for year 2008.
2. Summary of Research Results
A principal research issue with the extended IO table is to
disaggregate RE sectors from integrated ones of the conventional IO
table. This study utilized, for such purpose, disaggregation formulas

consistent with an IO structure, official financial statements of RE
companies, and some interview data when necessary.
The extended IO table was based on the basic and producer prices.
RE sectors were disaggregated from relevant integrated sectors at the
level of 403 basic sectors. The extended IO table reported in this
study was however inclusive of 104 industrial sectors where energy
ones were extracted from basic sectoral classification, and non-energy
ones from the mid-level division of industrial sectors.
A central research subject with the inter-industry energy flow table
is to select a method how energy sectors of the EB table are
combined with corresponding ones of the extended IO table. This
study reformulated the identity equation structure of the EB table to
derive the total calorific energy demand in conceptual accordance with
an IO structure. The total calorific energy demand was assumed to be
the control total in the study to estimate energy flows. This study used
the quantity supply of each RE source compiled by the Korea Energy
Management Corporation(KEMCO) due to the limited EB table.
This study dealt with 18 RE sources in forms of primary energy
among the total 22 sources of the KEMCO. The number was derived
from excluding hydro and cement-kiln additive fuel, and redefining 4
combustible waste sources as waste electricity and heat. The calorific
energy flow table was however reported by a size of 30 energy
sources(21 existing and 9 renewable ones) times 104 industries,
based on the basic and producer price IO tables.

3. Limitations of Results and Future Research Topics
Some limitations, that is, desirable improvements, are
acknowledged on analytical methods and results of this study.
Firstly, result tables of the study are not based on first-hand
survey data. In such cases, disaggregation formulas rely on the
proportion of output values. Thus, result tables of the study can be
improved when actual and first-hand survey data are available.
Secondly, primary-form RE consumption comparable with the EB
table is hardly estimated or inferred from the RE IO table of the
study where primary RE is not shown obviously as the industry.
Thirdly, combustible waste in itself was not taken into an IO
industry although it is recycled to produce RE. This limitation is
because it is difficult to represent such waste explicitly as an
industry in the usual IO table. Thus result tables of the study need
to be used carefully in view of relationship between waste generation
and recycling.
Finally, some future research topics are recommended in relation
to the subjects of the study. First, extended IO and energy flow
tables for year 2010 would be of great value since the BOK
publishes the 2010 IO table based on a full-scale survey. Second, an
augmented IO framework need to be developed treating waste itself
as an IO industry so that waste recycling can be represented properly
in the IO table. Third, the Korean portion of the GTAP-E data base
should be reviewed in detail for comparison with other studies since
it is used extensively.


제목 차례
1 1
1. 1
2. 2
3. 4
2 6
1. 6
2. 10
. 10
. 11
3. 19
4. 23
5. 30
6. 33
7. 36
3 ( ) 38
1. 38
2. 45
3. 52

4 56
1. 56
2. 56
3. 60
4. 65
5. 65
6. 66
7. 66
8. 66
5 68
1. 68
2. 70
3. 76
. 76
. 78
4. 79
6 81
1. 81
2. ( ) 98
. 10 ( + ) 99
. 10 103
. 10 106

3. ( ) 109
. 10 ( + ) 110
. 10 112
. 10 114
4. 116
. 116
. 119
7 126
129
< A> 134
< B> 160

표 차례
< 2-1> ( ), 2008 10
< 2-2> 12
< 2-3> , 2008 16
< 2-4> (2011) 3 18
< 2-5> ( ) 23
< 2-6> ( ) 24
< 2-7>
(2007 ) 35
< 3-1> 1 42
< 3-2> ( ) ([ 3-1] ) 44
< 3-3> 47
< 3-4> 51
< 4-1> 58
< 4-2> 59
< 5-1> 75
< 6-1> 82
< 6-2> ( + ) 99
< 6-3> 103
< 6-4> 106
< 6-5> 110
< 6-6> 111
< 6-7> 111

< 6-8> 112
< 6-9> 113
< 6-10> 113
< 6-11> 114
< 6-12> 115
< 6-13> 115
< 6-14> (2008 )
(403 ) 117
< 6-15> 120
< 6-16> ( ) (2008 ) 122
< 6-17> (2008 ) 123
< A-1> ( , )
140
< A-2> 141
< A-3> (gross) 144
< A-4> 144
< A-5> (net) 145
< A-6> (gross) , (net) , ,
146
< A-7> 150
< A-8> ( ) 153
< A-9> ( ) 156
< A-10> 156
< A-11> 157
< A-12> 157

< B-1>
( ) 162
< B-2>
( ) 165
< B-3> 168
< B-4> 169
< B-5> 172
< B-6> 175

그림 차례
[ 3-1] 39
[ 6-1] 124


제1장 연구개요
1.
2022 10%
(Renewable
Portfolio Standards: RPS)
. RPS (Feed-in Tariff:
FIT) .
,
.
‧
.
.
(Computable General Equilibrium: CGE)
, ,
.
,
.
CGE

, .
.
,
.
2006 .
2006 , ‧
. 2007
2005 5 , 2.9 .
,
. CGE
.
,
.
2.
,
,

,
.
.
.
.
( )
, .
,
.
, .
.
, ,
.
,
.
.
.
.

.
2008 .
.
.
(www.keei.re.kr)
, 6 4 .
,
.
.
,
,
.
.
,
,
.
3.
( )
.
.

, ,
. (
),
( ) .
.
.
(row) (column)
.
.
. .

제2장 연구자료 선행연구
1.
2005 ( ) (
) . 2008 (
) .
403 , 168
( ) 78 ( ) 28 ( )
. 403
(104 )
.
2008 ( , )
( , ) ,
.
2008 2005
. 2008
, 2008 .
(2010)
.
, , ,
.

,
.
.
.
(2005 , 2008 )
( , column) ( ,
row) .
,
. .
.
. .
( ) = +
( ) = + –
=
+ = (= )
, , (
) .
, ,

. ,
.
2008
.
① : , ,
② :
③ :(CT, control totals)
④
⑤
⑥
⑦ : GDP
⑧ ( )
⑨
(2007)
.
( - ) .
.

= - +
= +
= -
, ,
, , , ‧
.
, .
1995 , 2005 ( )
. 21
(2010 11 16 ) ( ) ‘
’ ‘ ’
. .

2.
(2009) 2008
(1 ) 240,752 toe .
58,176 toe , 182,576 toe
. 1 5,198 toe
5,858 toe 660
toe .
166,061 100,170 35,671 33,652 0 5,198 240,752
-39,842 -2,953 -15,906 -536 1,512 -451 -58,176
(
)0 0 110 -3,207 -78 0 -3,175
26,219 97,217 19,765 33,116 1,512 4,747 182,576
25,131 54,745 5,933 16,738 0 3,912 106,458
0 34,642 777 196 0 178 35,793
1,088 4,167 9,624 4,836 1,351 65 21,132
0 3,662 3,431 11,347 161 593 19,193
< 2-1> ( ), 2008
( : 1,000 toe)
: , (2009)

「 ‧ ‧ 」 25 (
)
‧
‧ ‧ .
‧
‧ . ‧ ‧
. 2 (
) .
,
, , , ,
‧
, ,
, , ,
‧ ‧
.
< 2-2>
. 2005 ,
2008 , , , , ,
2005 2008
.
.
2005 2008

. 2005
, , ,
. , 2008
.
2008 .
1999 2001 2003 2005 2007 2008
1,897,290 2,453,259 4,437,428 4,879,211 5,608,776 5,858,481
42,105 37,174 32,914 34,729 29,375 28,036
1,143 1,546 1,938 3,600 15,325 61,128
64,949 82,457 131,068 181,275 370,159 426,760
1,460 3,148 6,216 32,472 80,763 93,747
27,123 20,933 1,225,587 918,504 780,899 660,148
0 0 0 526 1,832 4,367
1,760,510 2,308,001 3,039,312 3,705,547 4,319,309 4,568,568
0 0 393 2,558 11,114 15,726
< 2-2>
( : toe)
: 2008 1 .2005 0.250toe/㎿h, 2007 0.215toe/㎿h
: , 2008 (2009).

2008
. 2008 1)
< 2-3> 22 .
22
.
( ) .
,
.
, , ,
.
.
, , , ,
.
, , , , .
.
‧
.
, ‧ ‧
. , ,
.
,
.
1) 1 TOE .

, 2)
( ) .
( , )
. ‧ .
,
.
.
( )
.
. , ,
.
‧
RDF(Refuse Derived Fuel) RPF(Refuse Plastic Fuel) .
.
,
.
.
,
2) (2007).

. .
.
.
.
,3) .
, .
, B-C .
.
.
.
.
.
, .
3) , , , , ,‧ ‧ ‧
.

2005 2008 ( )
(toe) 34,729 28,036 ‧ ‧
(㎿h) 14,399 284,315
(㎿h) 129,888 436,034
( )
(㎿h)715 302
(toe) 2,558 15,726 ‧ ‧
(G㎈)491,660 412,359
‧
(G㎈)0 133,200
( :㎿h)0 3,363
( )
(
)
( : G㎈)812 446,633
( :㎿h)129,595 412,996
( )
( : G㎈)102,292 311,963
< 2-3> , 2008

2005 2008 ( )
(T㎈)
4,771 6,384
( )( )
10,956 14,333
( )522 818
RDF/RPF
(G㎈)0 605,836
( )
( )32,191 36,536
, ,
(㎘)14,566 196,289
, ( ),
( )
( )4,392 3,870
(toe) 32,298 29,186, ,
( )
(T㎈)
3,351 5,681,
( )
(T㎈)3,028 3,069
,
( )B-C
(㎿h)2,103 20,310
, ,
< 2-3> , 2008 ( )
: .: (2009),

(2011) 22
.
IEA .
,
.
. ‘ 3 ’
,
. 3 IEA
, ,
, 4 .
< 2-4> .
(Natural Energy)
, , , , , ,
, ( )
(Waste Energy)
(Renewable Waste Energy: RWE)
, , RDF( ),
( )
(Non-renewable Wast Energy: NRWE)
, , ,
RDF/RPF( ), ( )
(New Energy),
(Clean Fossil
Fuels)
(IGCC), ,
GTL(DME)
< 2-4> (2011) 3

3. 4)
.
‧
.
( , 2000).
1
.
.
,
.
. ,
2008
( )
.
.
4) ( , ).

,
.
.
2008
22 . , , ,
, 5 . 5
.5)
.
2 , 1
. 11 ,
2 .
, 1 . 2
. .
, .
2 . 2
, .
5) , , RDF .

3 . 2008
.
, 2008
22% .
22%
.
.
, ,
.
( , ) (1 , 2 , 3
), 1 , ,
, .
.
( 4 )
403
.
. ( ), ,
, , ( ) 50%,
50%, 50% .6) 1 ‧ ‧
6) ,, 3 50% .

. , ( ,
), , , ( , ),
. , , ,
, ( ), , 50%, ,
, , , , , ,
, , , , , , (
) 50%, 50%, ( , ,
, , , ), , ( , ),
, .
, , , ,
.
.
, . FIT
7) FIT , ,
FIT .8)
, 1 , ,
, ,
.
7).
8).

4.
Wolsky(1984)
. Ferrer (2000) Wolsky
.
Ferrer .
,
. Ferrer n
3
.
3 3 4
,
. < 2-5> .
산업(상품) 최종수요총산출액
1 2 3 1 2
산업(상품)
1
2
3
부가가치1
2
총투입액
< 2-5> ( )

< 2-6> .
산업(상품) 최종수요총산출
1 2 3 4 1 2
산업(상품)
1
2
3
4
부가가치1
2
총투입액
< 2-6> ( )
( )
. ( )
* .
9)
9) ∀ .

Wolsky ( )
( ) .10)
( ) ,
(
) . (2-1)
.
(2-1)
, ,
.
10) 원문의 용어는 확장투입계수행렬 augmented technical coefficient matrix, 차별화
투입계수행렬 distinguishing technical coefficient matrix이다.

Ferrer , 3 4
(2-2) . (2-2)
.
(2-2) =
, ( )
Ferrer ( )
, (2-3)
.
(2-3) =

(2-2) (2-3)
, ,
. (2-1)
(2-4),
(2-5) (2-6) .
(2-4)
(2-5) ,
(2-6) ,
(2-6a)
(2-6b)
(2-6c)
( )
.11) (2-1)
(2-7) .
11) . (2-5)
.

(2-7) +
.
(input matrix column)
. ( ) (input matrix row)
,
( ) .12)
.
( / ) ,
12) ( ) .,
..

. ,
.
(2-8)
.13) (2-8)
, .
(2-8) +
,
.14)
.
4 .
. Wolsky Ferrer (2-7)
13) Wolsky Ferrer .14)
.

.
, 4 .
5. 15)
.
.
(2011) (2012), (2012)
. (2011)
.
.
.
(2012)
, 2009
.
.
15) ( , ),
.

, .
(2012) , ,
, ( ,
, , ) , ,
.
(2009) 27
.
.
内閣府 経済社会総合研究所(Economic and Social Research
Institute, ESRI) 2007 「総合的な経済エネルギー環境分析に合う
技術情報の整備のための研究」 .16)
1 ‘SNA ’ ,17) 2
‘SNA ’ . 1
. ,
, 2 6
GTAP(Global Trade Analysis Project)
. 2 (Solar Photovoltaics: Solar PVs),
, , (Carbon Capture and
Storage: CCS), ,
.
16) http://www.esri.go.jp/jp/archive/hou/hou040/hou031.html( 2012.11.1)17) SNA System of National Accounts .

.
松本‧本藤(Matsumoto and Hondo, 2011)
.
,
, 2005 ( 520 × 407)
. ( , , )
(import)
.
.
岡山大学(Okayama Univ), 南山大学(Nanzan Univ), 高知大学(Kochi
Univ) 株式会社エックス都 研究所(EX Research Institute) 18)
「環境‧地域経済両立型の内生的地域格差是正と地域雇用創出,その施策
実施に関する研究」
.
,
, ‘ ’
. ( , )
, .
.
18) http://www.exri.co.jp( 2012.11.2)

6.
(2005)
. 1975
2000 .
( ) .19)
2005
.
.
,
.
GTAP(Global Trade Analysis Project)
GTAP-E .20) GTAP 3
(IEA, International Energy Agency)
(Malcom , 1999). GTAP IEA
(EEB, Extended Energy Balance)
4 GTAP-E (Malcom ,
19) (supply(or make) table) ,.
20) https://www.gtap.agecon.purdue.edu/databases/v6/v6_doco.asp( 2012.11.5)

1999). GTAP-E
.
4 GTAP-E
Complainville (1998) .
( ) GTAP IEA EEB
(mapping) .
4 GTAP 8
5 6 Burniaux
(2002) McDougall (2006) .21) GTAP 7 8
GTAP-E
GTAP 6
. Birur(2008)
(biofuels) GTAP-E .
GTAP-E
.22)
.
GTAP-E 5
.
< 2-7> GTAP-E 8
21) https://www.gtap.agecon.purdue.edu/databases/v6/v6_doco.asp( , 2012.11.5)22) GTAP-E 8 113 /
.

. ,
. IEA
,
IEA (
, 2009). , IEA GTAP ,
GTAP-E IEA
. ,
,
.
1) IEA EB2) GTAP3)
4) TOE, 2007 418.0 369.3 370.9
CO2eq, 2007 495.8 - 424.7
1)2) IEA EB(Energy Balance) IEA 3) GTAP (version) 84) 1 (TPES) (TFC)
< 2-7> (2007 )

7.
‧ (CGE)
.
MIT EPPA(Emissions Prediction and Policy Analysis) Version 4
‧ , 23)
. ,
(Paltsev , 2005).
ICES(Inter-temporal Computable Equilibrium System) EU
20-20-20 .
, , .
. , ,
(Bosello , 2011).
GEM-E3(General Equilibrium Model for Economy–Energy–
Environment)24) (Directorates General)
. , , ,
(Capros , ).
(2010 )
.
.
‧ (2006) 2000
(SAM) . , ,
, , , , , 8
23) .24) http://ipts.jrc.ec.europa.eu/activities/energy-and-transport/gem-e3/( 2012.11.2)

. , , , , ,
, . (2010)
.
, CGE
‘ ’ ,
.
, ,
, .
.
EPPA
.
CGE
, .
CGE
.
,
, .

제3장 산업연 표의 신재생에 지 편제
작성(추정)
.
.
.
1.
1
. 1
,
.
1
. 1 2 2 .
1 ,25) ,
25) .
.

, .
1 1 , 1
, 1 , 1 .
1 (
)
.
, 1
.
[ 3-1]
: NRE (New and Renewable Energy) .
1
< 3-1> . , , ( ),
, 1 .

.
.
( ) . 1
.
. ,
.
( ‧ )
1 .
.
.26)
1
.
, .27)
.
.
,
26) , ,. 2 .
27) 2 2

.
.
.
.
.
.
.
‧ ( , , , )
96.5% , BD100 ( , 2010).
20:80
BD20 , 5:95 BD5 .
(BD100) .
,
.
.
, (1 ),
1 .
.
.
.

1 1 1
( )
-( )
( )
,( ),
( )
(50%),
(
)
( ),
( )
,
( )
,
( )( )
,
RDF/RPF
( )
COG
( )
< 3-1> 1

1 .
COG .
,
.
. .
1 ( )
,
. ,
. 1
, , , . 1
. 1
. ,
‘ ’ ‘ ’
, ‘ ’ .
‘ ’ ‘
’ .
1
. , 1
. ,
1 ‘ ’
1 .

1
( 1 )(Ⅰ)
( )(Ⅱ)
( 1 )(Ⅰ)
( )(Ⅱ)
( )
( 1 )
< 3-2> ( ) ([ 3-1] )
, 1
,
1 .

,
.
.
,
.
.
2.
2008
.
. (403 )
( ) (18 ) 1:1
.
.
( ) ,
. ‘
’ .
.
, , ( ),
( ), ( ), ( ), ( ),
( ), . ( ) ,

, , RDF/RPF 4
. ‧
,
1 . 9 ‧
, , ,
. ( )
‘ ’
.
( ) .
‘
’ .
.
.
.
( ), , ,
( ), ( ) . ( )
( ) 4 .
5 ‧ , ,
.
, , ‧
. , ‘
’ ( , ( ),

) ‘0’ ,
.
BD100
. (BD100)
BD5
2008 99.8% . BD5
BD100 ‘ ’ ,
. BD20
( ‧ ‧ ) , BD20
BD100 2008 0.2% , .
2008 2009
BD100
(㎘)
BD20 304(0.2%) 324(0.1%)
BD5 195,438(99.8%) 292,087(99.9%)
195,742 292,411
( /ℓ) 1,251 1,329
< 3-3>
: , (2010): ( ) .
,
,
. .

.
.
,
.
.
. ‘
’
.
,
.
( ) 1:1
,
.
B-C
. 50%( )
( )
. ,
.
.

,
. ,
.
.
‧ ,
.
, ,
.
( ) (
) .
.
,
.
‧ .
. ,
.
‧
. .
.
.
.

.
,
.
.
( )
. 2008
, 2005
.
,
.
‘ ’
.
. ,
.28)
22
, , <
3-4> .
28) ( ).

( )
( )
( )
( )
,
,
,
RDF/RPF
( )
( )
( ),
( )
< 3-4>

3.
. ,
.
‧ .
. ( - )
. ‘ ’
. .
.
= ‧ +
= + –
= +
= + ( × )
= × (1 + )
, ‧
.
(FIT)
.29)

.
. ,
‧ .
, ‘1 + ’
.30)
, , (
), .
( 10%)
. ‧
.
.31)
. ( ,
2009) ,
( , 2009)
.
.
.
. ( )
29) .
30) .
31) ( , 2010) ,(http://www.oils.or.kr, 2012.11.2) .

,
. 2008 , 2005
, ,
.
.
( , 2009)
.
,
. ,
. LNG
( )
.
,
.
COG ,
.
,
.
,
. 4
,
.
.
,

. , , , ‧
, .
.
.
‧ ( , )
, .
,
. ,
.
.
, ,
. ,
,
.

제4장 산업연 표의 신재생에 지산업
분리원칙 차
1.
.
1 .
1 . 3 2
, < 3-4> .
2.
.
3 3 .
2008
. ,
.

, ( ), (
), ( ), ( ), ( )
.
, 1
. ( ), ( ),
( ), ( )
(2008 ) .
,
.
2008 ( , 2009)
.32)
( ) 2008 (
, 2009) .
< 4-1>, < 4-2> .
32) ( ) (MWh) (, 2010) ,
, (kW)(MWh)
. ( ) ( ) (MWh) , ( )
( , 2009) (kW)(MWh) .

( )(toe) ( )
284,315MWh 24,451
: 27,025.36
: 27,029.63
436,034MWh 37,499
: 41,446.91
: 41,453.46
( ) 6,009MWh 517
: 571.18
: 571.27
( ) 3,363MWh 289
: 319.67
: 319.72
( ) 412,996MWh 35,518
: 39,257.05
: 39,263.25
( ) 358,729MWh 30,851
: 34,098.73
: 34,104.11
( ) 54,353MWh 4,674
: 5,166.51
: 5,167.32
( ) 5,726,995MWh 492,522
: 544,375.51
: 544,461.53
20,310MWh 1,747
: 1,930.55
: 1,930.86
< 4-1>
: 0.086toe/MWh

( )(toe) ( )
( ) 2,778,000Gcal 277,800: 114,666.48
: 117,960.08
280,360Gcal 28,036: 11,572.32
: 11,904.71
157,260Gcal 15,726: 6,491.16
: 6,677.61
( ) 446,633Gcal 44,663: 18,435.51
: 18,965.03
( ) 311,963Gcal 31,196: 12,876.78
: 13,246.64
196,289㎘ 177,642: 223,234.13
: 223,258.36
310,000㎘ 306,861: 217,845.45
: 218,027.50
: 7,561ton
: 61,928ton
: 69,489ton
: 3,176
: 26,010
: 29,186
: 6,261.09
: 51,281.13
: 57,542.21
: 6,434.71
: 52,703.19
: 59,137.90
147,271ton 41,236: 12,546.40
: 12,547.42
< 4-2>

3.
( ) 2
. 1 2 3 2 4 H
. 2 1
, .
, , , ,
1 .
.33)
,
.
(4 ) (
), ( )
(6 ) .
,
.34)
‘0’ (3 3 ).
33) 403 (1 , 2 , 3), 1 , ,
.(2 3 ).
34) 3 3.

. ( )
(<
3-1> ).
3 .
,
. , ,
.
.
(4 ), (
), 6 ,
(6 ) ,
(6 ) .
, .
. (4
) ( 403 )
.
, 1 .
1
H .
1

.
‘0’ .
,
.
( ) .
,
.
. ,
. , ,
.
. ( ), ( ), ( )
. ,
, ‘0’ . ,
.
. ( )
.
.
.
1

.
2 . ,
0.0578(‘
’ )
, ‘0’ .
(< 3-1> ),
.
.
2
.
3
, ,
.
.
, 1
2
.
,
.
,
. ( ),
( ), ( ) .

, ,
, ( )
.
1
.
( : 1 35)) , 5
‘0’
.
.
.
H
. H ,
.36)
,
. ,
, .
,
.
. , , ,
.
35) , ‘0.000,000,017,149,747,030’ .36)
.. H , .

4.
,
.
, /
.37)
.
3 ,
.
. ‘0’
,
.
5.
.
,
.
.
.
37) / .

, 3 3 3 .
6.
,
.
.
,
.
.
7.
(18 )
, ( ) .
( ) ,
.
8.
.

.
.
.
= +
= +
= ( ) -
=
=
= +
, = +
= +
= +
, .

제5장 에 지열량거래표의 작성원칙 차
1.
(CGE) ,
CGE
. ( )
.
.
,
. , 2005
.
, GTAP-E .
. .
, , .
.
. ,
.
.

,
, . , 38)
, .
.
, .
. , (row)
.
. ,
( ) ,
. ,
,
.
.
.
.
. ,
.
2008 , (1,000TOE)
.
38) http://kosis.kr/

2.
, 1
( 5-1 5-2 ).
(5-1) 1 (primary energy consumption)
= ( )
+ ( )
+ ( )
+ ( )
+ ( , )
+ (1 )
(5-2) (final energy consumption)
= 1 +
= 1
+ ( , )
+ ( , )
+ ( , [ ] )
+ ( )
.
(row)
. , ( )

.
.
.
(5-3) . (-)
.
(5-3) [ (row) ]
=
-
-
-
- ( )
- ( )
- ( )
- ( ‧ )
(5-3)
.
, .
,

.
, . ( )
,
.39) , ,
( ) .
, ( , , )
. , , ,
,
.
,
1 .
( , , ) 1
(860㎉/2150㎉) .
, .
,
.
39) ,
.. ,
.

1%
,
.
.
, ( ) .
. ,
( )
,40)
.
, ( )
.
.
,
( )
,41)
.
, 4
.
( ),
.
40) .41) 3) .

.
(row)
.
.
1 ,
(processing gain) .
(5-4) .
. ,
1
.42) ( )
,
.
(5-4) [ (row) ]
= ( )
+ ( )
+ ( )
+ ( )
42) IEA .IEA
, ..

+ ( )
+ ( )
+ ( (processing
gain) )
.
.
. < 5-1> 1
.
2008
1 TOE 240,752
TOE 182,576
1)TOE 337,021
TOE 337,021
1).
<표 5-1> 에 지 소비량 수 량

. ,
,43) 1
.
. , 1 kWh 2150kcal
860kcal . , 4
.
, 4
,
.
GTAP-E
. 2 6
GTAP-E IEA 1
.
3.
. ,
. ,
43) ,.

.
. 1
. .
.
, ‧
.
,
.
.
166 195 .
, ,
,
.
.
.
2
.

.
,
.
. , 2
,
. , ,44)
,
.
,
.
.
. ,
.
.
44) 2008 .21.15 TOE(
), 235.85 TOE( ),3.176( ) TOE( , 4 ) .

4.
,
.
. ,
. . ,
(row)
. , ,
. ,
.
, 1
.
.45)
. ,
45) ,1
.

.
.
,
. ,
,
, .
,
.
( ) ,
.
.
.
,
1
(4 ).
1 ( ) ,
( )
.

제6장 분리산업연 표 에 지열량거래표 요약46)
1.
403
.
18 , 403 ‘ ’
421 .47) 421×421
104
.48) 4 .
.
( ) ,
. 104
10 .
. , 421
104 , 10 .
2 3 .
4 .
46) . ,
.47) .48) ( )
(104 ) .

( )
1 1
12 2
3 3
4 (LNG) 4 (LNG)
5 5
2
6 6
7 7
8 8
9 9
10 10
11 11
12 12
13 13
14 14
15 15
16 16(5)
17 17
318 18
19 19
20 20(2)
21 21 4
< 6-1>

( )
22 22
5
23 23
24 ( )
24
25 ( )
26 ( )
27 ( )
28 ( )
29 ( )
25
30
31 ( ) 26
6
32
27
33
34 ( )28
35 ( )
36
29
7
37
38
30
39
< 6-1> ( )

( )
40
31 8
41
42
43
44
45
46
47
48
49
50
51
52
53
54
55
56
< 6-1> ( )

( )
57
32
8
58
59
60
61
62
3363
64
65
6634
67
68 35
69
3670
71
72
73
37
74
75
76
77
78
79
< 6-1> ( )

( )
80
38
9
81
82
83
84
85
86
39
87
88
89
90
91
4092
93
94
41
95
96
97
98
99
100
101
102
103
104
105
106
107
108
109
110
111
< 6-1> ( )

( )
112
42
9
113
114
115
116
117
118 43
119 44
120
45
121
122
123
124
125
126
127
128
129
130
131
132
133
134
46
135
136
137
138
139
140
141
142 ,
< 6-1> ( )

( )
143
47
9
144
145
146
147
148
149
48
150
151
152
153
154
155
49
156
157
158
159
160
161
162
163
164
50165
166
51
167
168
169
170
171
17252
173
< 6-1> ( )

( )
17453
9
175
176
54177
178
179
55180
181
182,
56
183
184
185
186
187
188
189
190 1
57191
192
193
58194
195
196 1
59197
198
199
60200
201
202
203
61204
205
< 6-1> ( )

( )
206
62
9
207
208
209
210
211
212
63213
214
215
64 1
216
217
218
219 ( )
220
221
222
223
224 1
225
651
226
227
228
229
230 1
231 1
2321
< 6-1> ( )

( )
233
66
9
234
235
236
237
238
239
240
241
242
243
244
67
245
246,
247
248
249
250
251
252
253
254
68
255
256
257
258
259
260
261
262
263
< 6-1> ( )

( )
264
69
9
265
266
267
268
269
270
271
272
70
273
274
275 (IC)
276
277
278
279
280 TV
71,
281
282 ‧
283
284
285
28672
287
288
73289
290
291
< 6-1> ( )

( )
292
74
9
293
294
295
296
297
298
75
299
300
301
302
303
304
305
76306
307
308
77
309
310
311
312
78313
314
315
79
316
317
318
319
320
321
< 6-1> ( )

( )
322 80
10
323
81324
325
326
82
327
328
329
330
331
332
333
334
335
336
337
338
339 83
340
341
84342
343
344
345
85
346
347
348
349
350
86351
352
< 6-1> ( )

( )
353
87
10
354
355
356
357
358
359
88
360
361
362
363
36489
365
366
90
367
368
369
370
371
372
91373
374
375 ( )
92376 ( )
377 ( )
378
< 6-1> ( )

( )
379
93
10
380
381
382
383
384
385
386
94387
388
389
390 95
391
392 ( )
96393 ( )
394 ( )
395 ( )
97396 ( )
397 ( )
398 ( )98
399 ( )
400 ( ) 99
401 ( )
402
100
403
404 ( )
405 ( )
406
407
408 ,
< 6-1> ( )

( )
409101
10
410
411102
412 ( )
413
103
414
415
416
417
418
419
104420
421
< 6-1> ( )

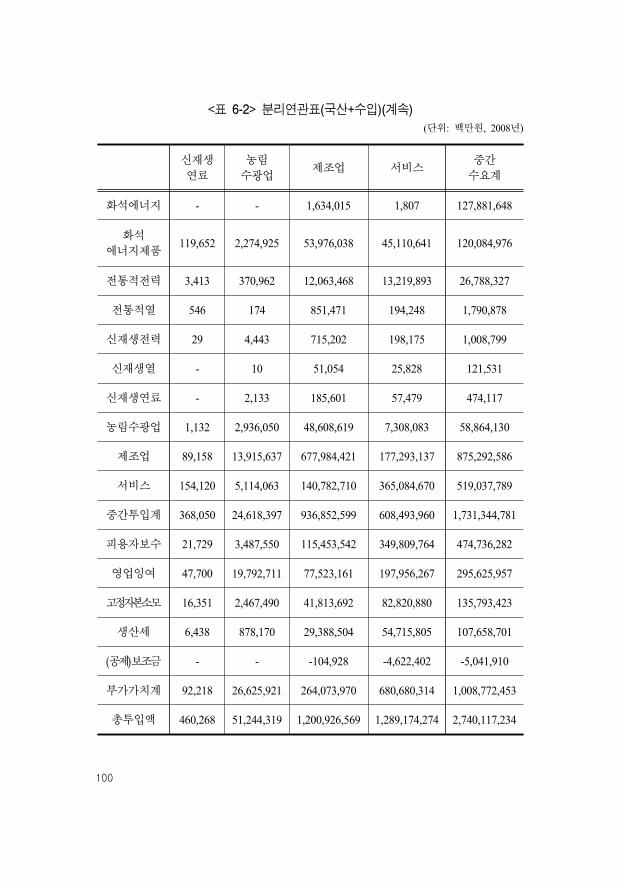
2. ( )
(104 )
.
.
,
. ,
.
.
.
,
.
.
10
. 104
.

- 119,342,576 6,510,189 393,061 - -
3,978 5,026,707 12,375,942 665,983 516,244 14,866
7,921 614,765 370,611 112,257 15,457 9,580
- 392,775 - 351,664 - -
100 52,482 8,935 29,216 195 21
- 23,560 - - - 21,079
5 228,501 392 - 6 -
3,309 6,508 45 158 149 78
58,359 3,415,147 2,423,864 31,479 65,975 15,409
76,307 4,024,535 3,539,174 88,663 130,144 43,403
149,979 133,127,556 25,229,154 1,672,482 728,169 104,435
211,677 2,132,433 3,235,245 201,567 166,854 15,922
185,425 952,472 -991,929 255,302 -115,317 20,166
41,170 2,532,535 5,491,628 286,826 300,193 22,657
2,526 21,433,866 1,130,710 70,572 26,536 5,574
( ) -170,468 -144,112 - - - -
270,330 26,907,194 8,865,654 814,267 378,266 64,319
420,309 160,034,750 34,094,808 2,486,749 1,106,435 168,754
< 6-2> ( + )
( : , 2008 )
- - 1,634,015 1,807 127,881,648
119,652 2,274,925 53,976,038 45,110,641 120,084,976
3,413 370,962 12,063,468 13,219,893 26,788,327
546 174 851,471 194,248 1,790,878
29 4,443 715,202 198,175 1,008,799
- 10 51,054 25,828 121,531
- 2,133 185,601 57,479 474,117
1,132 2,936,050 48,608,619 7,308,083 58,864,130
89,158 13,915,637 677,984,421 177,293,137 875,292,586
154,120 5,114,063 140,782,710 365,084,670 519,037,789
368,050 24,618,397 936,852,599 608,493,960 1,731,344,781
21,729 3,487,550 115,453,542 349,809,764 474,736,282
47,700 19,792,711 77,523,161 197,956,267 295,625,957
16,351 2,467,490 41,813,692 82,820,880 135,793,423
6,438 878,170 29,388,504 54,715,805 107,658,701
( ) - - -104,928 -4,622,402 -5,041,910
92,218 26,625,921 264,073,970 680,680,314 1,008,772,453
460,268 51,244,319 1,200,926,569 1,289,174,274 2,740,117,234
< 6-2> ( + )( )
( : , 2008 )

- - - - 2,415,374
25,852,209 - - - 97,471
7,331,466 - - - -704,530 - - - -98,063 - - - -47,223 - - - -38,854 - - - -
14,549,039 - 235,756 55,019 2,086,231 120,909,866 - 89,285,395 3,750,544 12,496,520 392,096,236 156,944,088 159,320,985 48,146,372 2,035,232 561,627,486 156,944,088 248,842,136 51,951,935 19,130,828
< 6-2> ( + )( )
( : , 2008 )
5,484 2,420,858 130,302,506 420,309
46,097,193 72,046,873 192,131,849 160,034,750
62,470 7,393,936 34,182,263 34,094,808 802 705,332 2,496,210 2,486,749 446 98,509 1,107,308 1,106,435
- 47,223 168,754 168,754 - 38,854 512,971 460,268
769,258 17,695,303 76,559,434 51,244,319 411,771,018 638,213,343 1,513,505,929 1,200,926,569 91,776,766 850,319,679 1,369,357,468 1,289,174,274 550,483,437 1,588,979,910 3,320,324,691 2,740,117,234
< 6-2> ( + )( )
( : , 2008 )

127,765,629 611,143 1,505,425 129,882,197 130,302,506
30,575,986 69,629 1,451,484 32,097,099 192,131,849
87,455 - - 87,455 34,182,263
9,461 - - 9,461 2,496,210
873 - - 873 1,107,308
- - - - 168,754
46,529 2,973 3,202 52,703 512,971
24,672,388 619,559 23,168 25,315,115 76,559,434
299,237,133 7,711,015 5,631,211 312,579,360 1,513,505,929
80,175,183 8,010 1 80,183,194 1,369,357,468
562,570,637 9,022,329 8,614,491 580,207,457 3,320,324,691
< 6-2> ( + )( )
( : , 2008 )

- 383,223 6,164 - -
3,460 3,476,691 11,711,935 525,959 509,728
7,921 613,322 370,607 112,257 15,457 - 392,775 - 351,664 0
100 52,482 8,935 29,216 195 - 23,560 - - -5 228,501 392 - 6
3,309 6,508 45 158 149 57,783 2,839,789 1,980,120 30,531 59,864 67,658 3,757,818 3,418,665 86,527 120,396 140,236 11,774,670 17,496,864 1,136,313 705,795
< 6-3>
( : , 2008 )
- - - 24,748 1,807
12,918 107,561 2,157,918 36,440,115 35,816,506
9,580 3,404 370,902 12,039,379 13,209,874 - 546 174 851,471 194,248
21 29 4,443 715,202 198,175 21,079 - 10 51,054 25,828
- - 2,133 185,601 38,633 78 1,131 2,445,827 27,124,530 6,474,488
14,945 32,299 13,024,578 477,054,155 150,916,183 42,357 143,463 4,833,205 129,441,525 319,045,355 100,977 288,434 22,839,191 683,927,780 525,921,096
< 6-3> ( )
( : , 2008 )

415,942 - - - -
90,762,792 23,564,636 - - -
26,752,704 7,279,634 - - -1,790,878 695,069 - - -1,008,799 97,190 - - -121,531 47,223 - - -455,271 4,997 - - -
36,056,223 12,789,374 - 223,593 55,019 646,010,247 89,984,561 - 46,289,631 2,954,781 460,956,969 371,034,509 156,944,088 158,296,073 48,134,101
1,264,331,356 505,497,193 156,944,088 204,809,297 51,143,901
< 6-3> ( )
( : , 2008 )
-1,117 5,484 4,367 420,309 420,309
-389,871 46,097,193 69,271,958 160,034,750 160,034,750
- 62,470 7,342,104 34,094,808 34,094,808 - 802 695,871 2,486,749 2,486,749 - 446 97,636 1,106,435 1,106,435 - - 47,223 168,754 168,754 - - 4,997 460,268 460,268
1,350,851 769,258 15,188,095 51,244,319 51,244,319 3,916,331 411,771,018 554,916,322 1,200,926,569 1,200,926,569
2,031,768 91,776,766 828,217,305 1,289,174,274 1,289,174,274
6,907,962 550,483,437 1,475,785,878 2,740,117,234 2,740,117,234
< 6-3> ( )
( : , 2008 )

- - - - 420,309
- - - - 160,034,750
- - - - 34,094,808
- - - - 2,486,749
- - - - 1,106,435
- - - - 168,754
- - - - 460,268
- - - - 51,244,319
- - - - 1,200,926,569
- - - - 1,289,174,274
- - - - 2,740,117,234
< 6-3> ( )
( : , 2008 )

- 118,959,353 6,504,025 393,061 -
518 1,550,015 664,007 140,024 6,516
- 1,443 4 - -- - - - -- - - - -- - - - -- - - - -- - - - -
576 575,358 443,744 948 6,111 8,649 266,717 120,509 2,136 9,748 9,743 121,352,886 7,732,289 536,169 22,375
< 6-4>
( : , 2008 )
- - - 1,609,267 -
1,948 12,091 117,007 17,535,923 9,294,135
- 9 60 24,088 10,019
- - - - -
- - - - -
- - - - -- - - - 18,846 - 0.12 490,223 21,484,089 833,595
464 56,859 891,059 200,930,266 26,376,954 1,046 10,657 280,858 11,341,185 46,039,315 3,458 79,616 1,779,206 252,924,818 82,572,864
< 6-4> ( )
( : , 2008 )

127,465,706 - - - -
29,322,184 2,287,573 - - -
35,623 51,832 - - -- 9,461 - - -- 873 - - -- - - - -
18,846 33,857 - - -22,807,907 1,759,665 - 12,163 -229,282,339 30,925,305 - 42,995,764 795,763 58,080,820 21,061,727 - 1,024,912 12,271 467,013,425 56,130,293 - 44,032,839 808,034
< 6-4> ( )
( : , 2008 )
2,416,491 - 2,416,491 129,882,197 -
487,342 - 2,774,915 32,097,099 -
- - 51,832 87,455 -- - 9,461 9,461 -- - 873 873 -- - - - -- - 33,857 52,703 -
735,380 - 2,507,208 25,315,115 -8,580,189 - 83,297,021 312,579,360 -
3,464 - 22,102,374 80,183,194 -12,222,866 - 113,194,032 580,207,457 -
< 6-4> ( )
( : , 2008 )

127,765,629 611,143 1,505,425 129,882,197 129,882,197
30,575,986 69,629 1,451,484 32,097,099 32,097,099
87,455 - - 87,455 87,455
9,461 - - 9,461 9,461
873 - - 873 873
- - - - -
46,529 2,973 3,202 52,703 52,703
24,672,388 619,559 23,168 25,315,115 25,315,115
299,237,133 7,711,015 5,631,211 312,579,360 312,579,360
80,175,183 8,010 1 80,183,194 80,183,194
562,570,637 9,022,329 8,614,491 580,207,457 580,207,457
< 6-4> ( )
( : , 2008 )

3. ( )
10
( + ),
. ,
, .
(4 5 )
. ,
.
,
1
.
, (TOE) .
0.00 0 , - 0
. 5
.
,
. ,
.
,
.
.

- 180503.86 37522.81 2319.01 - -
3.60 4227.83 20051.48 898.24 1380.79 14.93
8.15 630.89 381.10 114.48 15.91 9.76
- 984.03 - 881.03 - -
0.12 48.94 10.05 26.51 0.23 0.02
- 55.48 - - - 49.64
0.01 185.02 0.55 - 0.01 -
< 6-5>
( : TOE, 2008 )
- - 5767.04 6.60 226119.32
81.78 2396.68 72531.23 43111.68 144698.25
3.50 382.36 12390.76 13615.08 27552.00
1.37 0.43 2133.20 486.65 4486.72
0.03 5.15 677.72 223.60 992.35
- 0.02 120.23 60.83 286.21
- 3.00 261.22 75.44 525.25
< 6-5> ( )
( : TOE, 2008 )

- - - - 4230.63 19.93 4250.56
25153.98 - - - 348.13 41110.60 66612.71
7599.83 - - - - 64.22 7664.05
1765.07 - - - - 2.01 1767.08
113.59 - - - - 0.52 114.10
111.21 - - - - - 111.21
29.68 - - - - - 29.68
< 6-6>
( : TOE, 2008 )
230369.89 1487.12 - - - 228882.77 230369.89
211310.96 175975.42 - - - 35335.53 211310.96
35216.05 35126.72 - - - 89.34 35216.05
6253.80 6230.10 - - - 23.70 6253.80
1106.45 1105.44 - - - 1.01 1106.45
397.42 397.42 - - - - 397.42
554.93 528.92 - - - 26.01 554.93
< 6-7>
( : TOE, 2008 )

- 1353.05 18.44 - - -
3.14 3176.82 19038.75 750.17 1373.55 12.80
8.15 629.48 381.10 114.48 15.91 9.76
- 984.03 - 881.03 - -
0.12 48.94 10.05 26.51 0.23 0.02
- 55.48 - - - 49.64
0.01 185.02 0.55 - 0.01 -
< 6-8>
( : TOE, 2008 )
- - 90.43 6.60 1468.52
74.66 2293.33 50899.51 34303.57 111926.30
3.49 382.30 12367.14 13605.25 27517.06
1.37 0.43 2133.20 486.65 4486.72
0.03 5.15 677.72 223.60 992.35
- 0.02 120.23 60.83 286.21
- 3.00 261.22 66.14 515.95
< 6-8> ( )
( : TOE, 2008 )

- - - - -1.33 19.93 18.60
23061.63 - - - -123.10 41110.60 64049.12
7545.43 - - - - 64.22 7609.65
1741.37 - - - - 2.01 1743.38
112.58 - - - - 0.52 113.09
111.21 - - - - - 111.21
12.97 - - - - - 12.97
< 6-9>
( : TOE, 2008 )
1487.12 1487.12 - - - - 1487.12
175975.42 175975.42 - - - - 175975.42
35126.72 35126.72 - - - - 35126.72
6230.10 6230.10 - - - - 6230.10
1105.44 1105.44 - - - - 1105.44
397.42 397.42 - - - - 397.42
528.92 528.92 - - - - 528.92
< 6-10>
( : TOE, 2008 )

- 179150.81 37504.38 2319.01 - -
0.46 1051.01 1012.72 148.07 7.24 2.13
- 1.42 0.004 - - -
- - - - - -
- - - - - -
- - - - - -
- - - - - -
< 6-11>
( : TOE, 2008 )
- - 5676.62 - 224650.81
7.12 103.36 21631.73 8808.11 32771.95
0.01 0.06 23.62 9.83 34.93
- - - - -
- - - - -
- - - - -
- - - 9.30 9.30
< 6-11> ( )
( : TOE, 2008 )

- - - - 4231.96 - 4231.96
2092.36 - - - 471.23 - 2563.58
54.40 - - - - - 54.40
23.70 - - - - - 23.70
1.01 - - - - - 1.01
- - - - - - -
16.71 - - - - - 16.71
< 6-12>
( : TOE, 2008 )
228882.77 - - - - 228882.77 228882.77
35335.53 - - - - 35335.53 35335.53
89.34 - - - - 89.34 89.34
23.70 - - - - 23.70 23.70
1.01 - - - - 1.01 1.01
- - - - - - -
26.01 - - - - 26.01 26.01
< 6-13>
( : TOE, 2008 )

4.
(www.keei.re.kr) .
.49)
3 , (
)
.
.
.50)
.
2 1
.
.
.
49) ., (row) ‘ ( )’
( ) . , ‘ ’(column) ‘ ( )’ 2009
0 .50) .

,
. ( ), , ,
. .
( )
.
( ), ( )
. < 6-14>
.
-
( )1,696,179,203
- - -35,165,578
( )1,731,344,781 1,731,344,781 0
474,736,282 474,736,282 0295,625,957 295,625,957 0135,793,423 135,793,423 013,605,193 107,658,701 94,053,508
( ) -115,353 ( ) -5,041,910 -4,926,557
( )919,645,502 1,008,772,453 89,126,951
( )2,650,990,283 2,740,117,234 89,126,951
< 6-14> (2008 ) (403
)
: (2010)

,
( ), , ,
.
,
( ) .
,
.
( ) .
( ) .
/ ( )
. ( )
.
3
4
.51)
.
.52)
51) ,
..
52) , .
.

.
.
.
.
.
,
. ,
.
,
.
. < 6-15>
( ) .
.
,
( ) .

1
a1 a2 A
b1=a1+t1 b2=a2+t2 B=A+T
<표 6-15> 기 가격과 생산자가격 기 거래액과 배분구조
1) t1, t2 , T . 2) a1, a2 , A . 3) b1, b2 , B .
1
, .
, .
(1) , .
( ) .
(1) ( )
.
( )
.
,
.
2008

. < 6-16>
( ) .
B/A(%) [ -
] [ ]
. , ,
.
< 6-17> B/A(%) [
- ] [
] .
( , , ) ,
. ,
B/A(%) 27% .
.
. ,
, ,
.
.

( TOE, A) ( TOE, B)
B/A
(%)
5,184.0 11.5 0.2
59,383.0 0.0 0.0
127,576.2 0.7 0.0
(LNG) 33,950.4 23.3 0.1
707.8 0.3 0.0
18,868.9 22.6 0.1
40,560.9 0.5 0.0
2,895.7 415.0 14.3
4,854.6 24.4 0.5
2,221.9 125.5 5.6
16,320.2 4,148.1 25.4
15,216.1 317.7 2.1
8,061.4 430.6 5.3
1,574.2 22.5 1.4
3,974.6 11.9 0.3
369.5 14.9 4.0
15,737.8 520.0 3.3
9,798.8 382.7 3.9
2,339.0 0.5 0.0
26,015.9 445.6 1.7
4,582.2 139.0 3.0
24.5 0.0 0.0
37.5 0.0 0.0
71.8 0.0 0.0
494.3 0.1 0.0
204.3 6.2 3.0
32.2 1.1 3.4
55.8 1.7 3.0
484.5 0.7 0.1
41.3 0.6 1.5
401,639.3 7,067.6 1.8
<표 6-16> 에 지열량의 산업( 간수요)부문별 배분차이(2008년)
1) A . 2) B
.

( TOE, A) ( TOE, B)
B/A
(%)
24.7 3.9 15.6
772.0 0.0 0.0
137.0 0.7 0.5
(LNG) 3,616.7 23.3 0.6
426.8 34.8 8.2
281.1 0.0 0.0
2,240.5 0.4 0.0
8,952.2 3,089.2 34.5
10,705.0 42.9 0.4
2,083.1 220.0 10.6
22,700.9 5,765.3 25.4
7,355.5 115.9 1.6
2,577.3 295.0 11.4
1,408.7 13.4 1.0
2,188.2 6.1 0.3
108.9 5.2 4.8
4,156.9 180.5 4.3
3,183.6 147.4 4.6
0.0 0.0 0.0
10,200.6 322.4 3.2
1,671.6 95.6 5.7
0.0 0.0 0.0
0.0 0.0 0.0
0.0 0.0 0.0
0.0 0.0 0.0
73.5 4.3 5.8
11.6 0.7 5.8
20.1 1.2 5.8
0.0 0.0 0.0
29.2 0.5 1.8
84,925.6 10,368.7 12.2
<표 6-17> 에 지열량의 최종수요 부문별 배분차이(2008년)
1) A . 2) B
.

, ( ) (1)
( ) [ 6-1]
.
.
. 1/4 3
, . 3/4
4 ,
, , .
0.8
0.6
0.4
0.2
0
0.2
0.4
0.6
0.8
1
1.2
1.4
40 20 0 20 40 60 80
(%p)
( TOE)
[그림 6-1] 휘발유제품의 간수요부문별 배분 특성
1) . 2) ( (1) ). 3) 3 ,
. 4) 4 ,
, , .

.
. ,
( )
.
.

제7장 맺음말
(CGE)
.
, .
(RPS)
.
, 2008
.
( )
( ) .
.
.
( )
.
( )
.

.
,
.
, ,
.
( )
( )
.
.
, 1
1
.
,
.
.
. , 2010
. ,
. , GTAP-E

.

참고문헌
, , , 2000.
, Ⅱ, , 2010.
, “ 2009
”, , 8(1), 2012, pp.8-17.
, “ ”, ( ) , 2010.
, , ,
06-10, 2006.
,
, , 2011.
, , 2009.
, , 05-01,
2005.
, 2009 , 2009.
, 2008 , 2009.
, ,
, 2009.
, 2009 , 2009.
, 2009 , 2010.
, , , 2009.
, , , 2010.

, , 2009.
, 2010 ,
2012.
, 2005 , 2008.
, 2008 , 2010.
, , 2007.
, , 2010.
, 2008 , 2009.
Birur, Dileep K., Thomas W. Hertel, and Wallace E. Tyner1, Impact
of Biofuel Production on World Agricultural Markets: A
Computable General Equilibrium Analysis, GTAP Working Paper
No. 53, Department of Agricultural Economics, Purdue
University, 2008.
Bosello, Francesco, Lorenza Campagnolo, Fabio Eboli, Ramiro Parrado
and Elisa Portale, A more ambitious EU target on GHG
emissions: macro-economic impacts through a CGE analysis,
2011 INTERNATIONAL ENERGY WORKSHOP, Stanford
University, July 6-8, 2011.
Burniaux, Jean-Marc, Robert A. McDougall, and Truong P. Truong,
"Chapter 17 - An Energy Data Base for GTAP," Global Trade,
Assistance, and Production: The GTAP 5 Data Base edited by
Betina V. Dimaranan, and Robert A. McDougall, Center for
Global Trade Analysis, Purdue University, 2002.

Capros, P., Kouvaritakis N., Paroussos L., Karkatsoulis P.,
Fragkiadakis K., Van Regemorter D., Zaporozhets V., Gharbi Q.,
Le Mouel P. and Delkis K., MOdel Development for the
Evaluation of Lisbon Strategies-Description of GEM-E3 model
improvements, undated, http://ipts.jrc.ec.europa.eu/activities/
energy-and-transport/gem-e3/( 2012.11.2)
Complainville, C., and D. van der Mensbrugghe, Construction of an
Energy Database for GTAP V4: Concordance with IEA Energy
Statistics, OECD Development Centre, April 1998.
Ferrer, G. and R. U. Ayres, "The impact of remanufacturing in the
economy," Ecological Economics 32, 2000, pp. 413-429.
Malcom, G., and T. P. Truong, The Process of Incorporating Energy
Data into GTAP, Draft GTAP Technical Paper(DRAFT FOR
COMMENT ONLY), Nov. 1, 1999.
McDougall, Robert A., and Huey-Lin Lee, "hapter 17 - An Energy
Data Base for GTAP," Global Trade, Assistance, and Production:
The GTAP 6 Data Base edited by Betina V. Dimaranan, Center
for Global Trade Analysis, Purdue University, 2006.
Paltsev, Sergey, John M. Reilly, Henry D. Jacoby, Richard S. Eckaus,
James McFarland, Marcus Sarofim, Malcolm Asadoorian and
Mustafa Babiker, The MIT Emissions Prediction and Policy
Analysis (EPPA) Model: Version 4, Report No. 125, August 2005
United Nations, Handbook of Input-Output Table Compilation and
Analysis, 1999.

Wolsky, A.M., "Disaggregating input–-output models," Review of
Economics and Statistics. 66, 1984, pp. 283-291.
岡山大学‧南山大学‧高知大学‧株式会社エックス都 研究所, 平成23年度
環境経済の政策研究 環境‧地域経済両立型の内生的地域格差是正と
地域雇用創出, その施策実施に関する研究, 終研究報告書, 2012
(http://www.exri.co.jp)
宮沢建一, 1996, 「産業連関分析入門( )」, 経済学入門シ
リーズ, 日本経済新聞社
経済社会総合研究所(Economic and Social Research Institute, ESRI), 総
合的な経済エネルギー環境分析に合う技術情報の整備のための研究,
2007(http://www.esri.go.jp/jp/archive/hou/hou040/hou031.html)
総務省産業連関技術委員会, 2010, 平成17年(2005 ) 産業連関表第21号資
料1-1「基礎価額表示による産業連関表に関する試算について(
)」
総務省政策総括官(統計基準担当) 統計基準‧産業連関表‧調査技術担当統計
審査官室第22号, 2010, 産業連関表技術委員会資料2(
2), 2010 12 14
松本直也‧本藤裕樹, “拡張産業連関表を利用した再生可能エネルギー 入
の雇用効果分析”, 日本エネルギー学会誌(Journal of Japan Institute
of Energy), 90(3), 2011, pp.258~267
http://dart.fss.or.kr/( )
http://kosis.kr/( )

http://www.oils.or.kr( , 2012.11.2)
https://www.gtap.agecon.purdue.edu/databases/v6/v6_doco.asp(
2012.11.5)

<부록 A> 신재생 산업연 표 작성원칙 련 해외사례1)
1. 2)
.
①
,
.
.
‘ - ’ ‘
’ .
‘ - ’ . ‘ - ’
,
1) ( , ).
2) 総務省産業連関技術委員会(2010), 総務省政策総括官(統計基準担当) 統計基準․産業連関表․調査技術担当統計審査官室第22号(2010)

.
‘ ’ . ‘
’
.
,
.
.
.
②
.
= × ÷ (1 + )
. ①
.
= × ( × (1 - ))
÷ ( ( × (1 - 3))) )
3) .

.
‧
‧ , .
. ‧ (
)
.
( ) 1
,
.
.
.
.
① ( )
,
.
.
② 国税庁( )
(activity base)

38
. 2005 ( 17 ) 総務省政
策総括官( ) ‘ (本
社等の活動実体調査)’
, 2010 ( 23 ) ‘
- (経済センサスー活動調査)’
.
③
(
) .
, .
GDP .
.
.
④
2 ‧
.
.

(
) ‘TVA( )
’ 8 1 ‘
’ .4)
INSEE(National Institute of Statistics and Economic Studies)5)
‘TVA ’
,
, TVA
.
(activity)
‘ : × (activity) ’
.
(activity) .
4) TVA ‘ ’, TVA .
.5) www.insee.fr/en/default.asp( 2012.11.1)

Eurostat ‘Eurostat Manual of Supply, Use and Input-Output
Tables’ ‧
. ‧ .
(Basic prices including a transformation to purchasers'
prices), (Purchasers' prices),
(Basic prices) .7)
‧ (Product technology
assumption) .8)
(Valuation matrices) . (Valuation
matrices) ‧ ( , , ) ‧
( , ,
(Non-deductible VAT)) .9)
6) epp.eurostat.ec.europa.eu/portal/page/portal/eurostat/home/7) ‘Eurostat Manual of Supply, Use and Input-Output Tables’, P.298) ‘Eurostat Manual of Supply, Use and Input-Output Tables’, P.309) ‘Eurostat Manual of Supply, Use and Input-Output Tables’, P.296

A B C( )
A 210 210 105 0 315 0 840
B 63 315 42 0 315 0 735
C 105 105 210 0 210 0 630
3 2 4 0 1 0 10
437 98 256 10
22 5 13 0
840 735 630 10
< A-1> ( , )
A B C
A 1 1 2 0 4
B 2 1 2 1 6
C 0 0 0 0 0
-3 -2 -4 -1 -10
2. ( ) ( )
.
< A-1> .

( )
( )
1990 gross 12
1995 gross 12
2000 gross 38
2005 gross 38
: 1(2012 5 22 )
< A-2>
A B C( )
A 211 211 107 0 315 -4 840
B 65 316 44 0 316 -6 735
C 105 105 210 0 210 0 630
0 0 0 0 0 10 10
437 98 256 10
22 5 13 0
840 735 630 10
: 1(2012 5 22 ), (2010)
( 3%, 5%)
. 1989 4 1 . 1990
, . 1995
.

[ A-1]
,
.
.
3 . ①
(gross) , ②
( ), ③
,
(net) . 1990
1995
.
[ A-1]
: 1(2012 5 22 )

① (gross)
「 (gross) ( )」 .
‧
, ( )
(< A-3> ).
②
,
.
「 」 (<
A-4> ).
③ (net)
「 (net) 」 .
a.
, (
)
b.
(< A-5> )

A B C D E
A 800 800 -300 500
B 900 900 100 1000
C 1000 1000 100 200 1300
D 30 70 100 900 300 400 1700
E 100 100 200 400 100 700
30 800 1000 1100 70 3000 1300 500 700 -300 5200
470 200 300 600 630 2200
500 1000 1300 1700 700 5200
: () .
: 1(2012 5 22 )
< A-4>
A B C D E
A 824 824 -309 515
B 927 927 100 1027
C 1030 1030 103 200 1333
D 31 72 103 927 309 400 1739
E 103 103 206 412 103 721
31 824 1030 1133 72 3090 1339 515 700 -309 5335
470 200 300 600 630 2200
14 3 3 6 19 45
515 1027 1333 1739 721 5335
1. , 3% (1995) .
2. , , ,「 1.03 = (gross)」 .
: 1(2012 5 22 )
< A-3> (gross)

A B C D E
A 800 800 24 -309 515
B 900 900 27 100 1027
C 1000 1000 30 103 200 1333
D 30 70 100 3 927 309 400 1739
E 100 100 200 6 412 103 721
30 800 1000 1100 70 3000 90 1339 515 700 -309 5335
1 24 30 33 2 90
470 200 300 600 630 2200
14 3 3 6 19 45
515 1027 1333 1739 721 5335
1. , 3% (1995) .
2. . 3.
. 4.
.: 1(2012 5 22 )
< A-5> (net)
1(2012 5 22
) 「2011年表の消費税の扱いに関する論点整理(2011
)」
“ ” .

·
( )
(gross) ◯ ◯ ◯ × ◯
◯ ◯ ◯ × ×
(net) ◯ × ◯ × ◯
◯ × ◯ × ×
- × × ◯ × -
× × × ◯ ×
: ◯ .: (総務省産業連関技術委員会, 2012)
< A-6> (gross) , (net) , ,
( , , )
, .
4 (① (gross)
, ② (net) , ③ , ④ ) .
( , ,
) ,
. (gross)
,
.

3. ( )
(= )
,
.
(
) .
(net) ( )
, .
1995 ( 7 )
(Control Total)
,
. .
宮沢(1996)
.
, ( , ) .
.
,
( ) .

.
, , , ,
,
.
. ,
.
, , , , ,
, , ,
.
.
,
.
,
.
.
10) 2005 ( 17 ) ( ) 3(http://www.stat.go.jp/data/io/005index.htm)

, ,
, (都道府
県) ,
.
. ,
, ,
‧ ,
.
1/2 .
「 」 「 」
. ,
< A-7>
.
11) ‧
12) (総務省産業連関技術委員会, 2010)

.
.
,
.
.
.
① :
.
② : ①
, , (
) .
③ ①, ②
,
.
.
( )
( )
( )
( ) ( )
1/2
.
.
: (総務省産業連関技術委員会, 2010)
< A-7>

「1121-01, -011 」
.
① 2005 ( 17 ) 2004 ( 16 )
× 1/4 + 2005 ( 17 ) × 3/4
.
② ①
, .
: (総務省産業連関技術委員会, 2010)
③ ②
.
: (総務省産業連関技術委員会, 2010)

④ ③
.
,
.
: (総務省産業連関技術委員会, 2010)
,
, ②, ③ ④
.
.
,
.

< A-8> ( )
: (総務省産業連関技術委員会, 2010)
( )
.
,
.
‘ ’
, . ,
‘ ’
‘ ’ .
.
1
( , , 1

) .
1
.
2011
.
府省庁( ) 2010
(WG) . 2011
.
2012 3 ‧SNA WG 2011
.
( ) 13)
.
,
.
.
.
,
.
13) 21 ( 22 11 16 ) 1-2

4. ‧ ( )
宮沢(1996) 1 1
, 1
2 .
,
.
. .
,
.
,
. ‧
.
(Stone) .
‧ ( ) ( A )
, ( B ) ,
.
‧ A B
. .

A B
A 90 90
B -1060
(10+50)50
100 50 150
90 50 150
: 宮沢(1996) II-7
< A-9> ( )
.
① A B B
. (Transfer)
.
A B
A 10 90 100
B 60 60
100 50 150
10060
(10+50)150
: 宮沢(1996) II-7
< A-10>
② A
A .
.
③
B
. .

A B
A 90 90
B -1060
(10+50)
60
(10+50)
9060
(10+50)150
9060
(10+50)150
: 宮沢(1996) II-7
< A-12>
A B
A100
(10+90)
100
(10+90)
B 50 50
100 50 150
100
(10+90)50 150
: 宮沢(1996) II-7
< A-11>
. A B
, B A
.
.
A B
A
A
B . B
‘ B ’ ‘ ’(

A , B ,
0 ) A
B B
B
, ( ) .
A B
, B A
. B A
B A
B
.
‧ .
A B
.
,
.
, .
.
1960
, 1960

( ) ( )
( ) . SNA
.
1990 1985 ‧
「 ‧ 」
, .

<부록 B> 신재생 산업연 표 련 해외 연구사례14)
1. 経済社会総合研究所
内閣府 経済社会総合研究所(Economic and Social Research
Institute, ESRI) 2007 12 「総合的な経済エネルギー環境分
析に合う技術情報の整備のための研究( ‧ ‧
)」 .
1 “SNA ”
, 2 “SNA
” . 2 (Photovoltaic, PV),
, , ‧ (CCS),
,
.
経済社会総合研究所(Economic and Social Research Institute, ESRI)
.
. 2 .
, .
14) ( , ).

.
.
.
‧
( ) , ( )
.
+ - .
2000 ,
.
,
.
,
, ,
‧ ( )
. ,
, ‧
,
.
, ,
‧ ‧ ,
+ .

< B-1> (
)
: (内閣府 経済社会総合研究所, ESRI, 2007)

< B-1> (
) ( )
: (内閣府 経済社会総合研究所, ESRI, 2007)
,
+ . ‧
, ‧ ‧ ‧

, ‧ .
,
, ’
+ .
< B-1>
.
.
< B-2>
.
‧
.
.
.
, ,
,
.
.
‧ .
.
.

< B-2> (
)
: (内閣府 経済社会総合研究所, ESRI, 2007)

< B-2> (
) ( )
: (内閣府 経済社会総合研究所, ESRI, 2007)
< B-2>
, (-)
.
.
, ‧ - -
.
, - .
‧ .

‧ ,
+ .
+ .
2. 松本‧本藤
松本‧本藤(Matsumoto and Hondo, 2011)
.
,
, 2005 ( 520 407)
. ( , , )
(import)
.
3 ,
5 8 .
,
, .
(blade) ,
(tower) , (nacelle) , ,
.

< B-3> . 2005
90% . 2005
1500 kW
2006
2,000 kW
.
Photovoltaic Wind Turbine
Generation capacity(kW) 3.5 2000
Capacity factor(%) 1.2 20
Self consumption(%) 0 5
Life time(year) 20 20
Price(million yen) 1.3 193
: 松本‧本藤(2011)
< B-3>
松本‧本藤(2011)
8 ,
.
1 , 3 ( , ,
) . ,
, , LNG , .

221101 Plastic products221101 Plastic products
Blade of wind turbine
262201 Steel pipes and tubes262201 Steel pipes and tubes
Tower of wind turbine
301103 Turbines301103 Turbines
Nacelle of wind turbine
342109 Other electrical devices and
parts
324109 Other electrical devices and parts
Photovoltaic cell
411101
411102
Residental
construction(wooden)
Residental
construction(non-wooden)
411101
411102
Residental construction(wooden)
Residental construction(non-wooden)
Installation of PV
413209 Other civil engineering and
construction
413209 Other civil engineering and construction
Construction of wind turbine
511101 Electricity
511101Electricity
Electricity(nuclear power)Electricity(coal fired power)Electricity(oil fired power)Electricity(natural gas fired
power)Electricity(water power, evc)
Electricity(photovoltaic power)
Electricity(wind power)
5111041 Private power generation 511104 Private power generation
: 松本‧本藤(2011)
< B-4>

.
8 ,
, , ,
.
, , ‧ ( ),
.
.
‧
.
‧
.
.
4 2
,
. 2
.
.15)
‧ (NEDO)
.
15) 90% ,
( , ).

.
.
.
. ,
( ) (1) .
(1)
, ( )
. (2)
( ) ( )
,
.
(2)

.
,
. 2005
( ), ( )
.
1 .
2006~2008 .
( / )
Photovoltaic 0.0058
Installation of PV 0.0386
Electricity(photovoltaic power) 0.0038
Blade of wind turbine 0.0279
Tower of wind turbine 0.0255
Nacelle of wind turbine 0.0138
Construction of wind turbine 0.0949
Electricity(wind power) 0.0163
: 松本‧本藤(2011)
< B-5>
< B-5> .
.

3. 岡山大学
岡山大学(Okayama Univ)‧南山大学(Nanzan Univ)‧高知大学(Kochi
Univ)‧株式会社エックス都 研究所(EX Research Institute)16)( 岡
山大学 , 2012) 「環境‧地域経済両立型の内生的地域格差是正と地
域雇用創出,その施策実施に関する研究」
.
, ,
「 」 .
( , ) ,
.
CO2 ,
.
.
,
.
CO2 credit .
CO2 credit
. CO2 credit
(activity base )
16) www.exri.co.jp

.
credit .
CO2 credit CO2 credit
. CO2 credit CO2 credit
3
. credit , ,
(CO2 ), , ( ,
) offset provider
.
credit‧service .
credit credit‧service CO2 credit
(CO2 , , ,
, , credit ) ( ) , CO2 credit
. credit
2 . ①
credit (
) .
,
credit (
)
credit . ②
offset credit credit
,

.
1 2 3 CO2
credit
credit
(
)
(
)
1 2 3 A B C
1 1 0 0
2 2 0 0
3 3 0
A 0 0 0 0 0 0
credit B 0 0 0 0 0 0 0 0
credit C 0 0 0 0 0 0 0 0
: 岡山大学‧南山大学‧高知大学‧株式会社エックス都 研究所(2012), II-2-1
< B-6>
(A) ( )
‧ ( ) .
( ) ( ) .
CO2 credit (B) CO2 credit‧service
( ) credit ,

( ) . credit
,
credit .
credit
.
credit
,
.
credit .
credit ‧
.
.
credit ( ) ( )
credit , credit ( )
. credit
, (移出) credit ,
(credit service)
. credit
fraction k
.
CO2 credit‧service (C) 3
, credit
.

.
19 (2007 ) (4 )
. 近畿‧中四国(Kinki‧Chushikoku) ,
12 (2000 ) 大阪府(Osaka) (3 , 大
阪府( ), 近畿(Kinki), ) .
①
.
CO2 .
(大阪府(Osaka)-中四国(Chushikoku))
( , ) ,
, ( ,
, ),
, .
4 (大阪府(Osaka), 近畿(Kinki), 中四国(Chushikoku),
) ( ) .
. , (

) .
(
) .
②
.
( )
.
4 (大阪府(Osaka), 近畿(Kinki), 中四国
(Chushikoku), ) 「05 ‧ ‧ 」
,
.
( ) ( )
.
( )
.
(2005 ( 17 ) , 総務省( ))

( )
.
, ‧
.
(300 km ) .
.
( ) ( )
( ) .
( ) ( )
( ) 4 ( ‧ ‧ )
.
( ) ( )
.
.
‧ ‧ ,
, 大阪(Osaka)
近畿(Kinki) 0.996, 近畿(Kinki) 中四国
(Chushikoku) 0.994, 中四国(Chushikoku)
0.998 . 0.991~0.998
. ‧

(2005 ( 17 )
, 総務省( )) ‧
.
.
,
.
.
. (=
− )
.

現
< >
,
, 2009.
, , 2005.
: CES
, , 2002.
現
2012-03
2012 12 29
2012 12 31
․
- 132
: (031)420-2114(代) : (031)422-4958
1992 12 7 7
( ) I&D (02)3486-6791
ⓒ 2012 ISBN 978-89-5504-399-0 93320
* . 값 7,000원
