© 2014 the pfm group do banks want your money? pfm asset management llc 4350 n. fairfax drive,...
TRANSCRIPT

© 2014 The PFM Group
Do Banks Want Your Money?
PFM Asset Management LLC4350 N. Fairfax Drive, Suite 580Arlington, VA 22315703.741.0175www.pfm.com
Presented byNelson L. Bush, Managing Director
Treasurers’ Association of Virginia85th Annual Conference
June 23, 2015

© 2014 The PFM Group
2
2
A. Challenges for Public Depositors
B. What can you do now?
Outline
PFM Asset Management LLC

© 2014 The PFM Group
Fun in the Sun UniversityIntro to PFM
3
Challenges for Public Depositors
PFM Asset Management LLC

© 2014 The PFM Group
How Did We Get Here?
• Excessive on- and off-balance sheet leverage
• Erosion of the banking system’s capital base
• Insufficient liquidity in the banking system exposed
• Large credit losses
• Loss of confidence in the solvency and liquidity of the banking system
• Lack of available credit
• Government “bail-outs”
4PFM Asset Management LLC

© 2014 The PFM Group
5
5
Banks Have Excess Cash1
98
0
19
83
19
86
19
89
19
92
19
95
19
98
20
01
20
04
20
07
20
10
20
13
50%
60%
70%
80%
90%
100%
110%More loans than deposits
More deposits than loans
Loan to Deposit Ratio – Commercial Banks in the US1980 – 11/2014
Source: www.federalreserve.gov
PFM Asset Management LLC
© 2014 The PFM Group
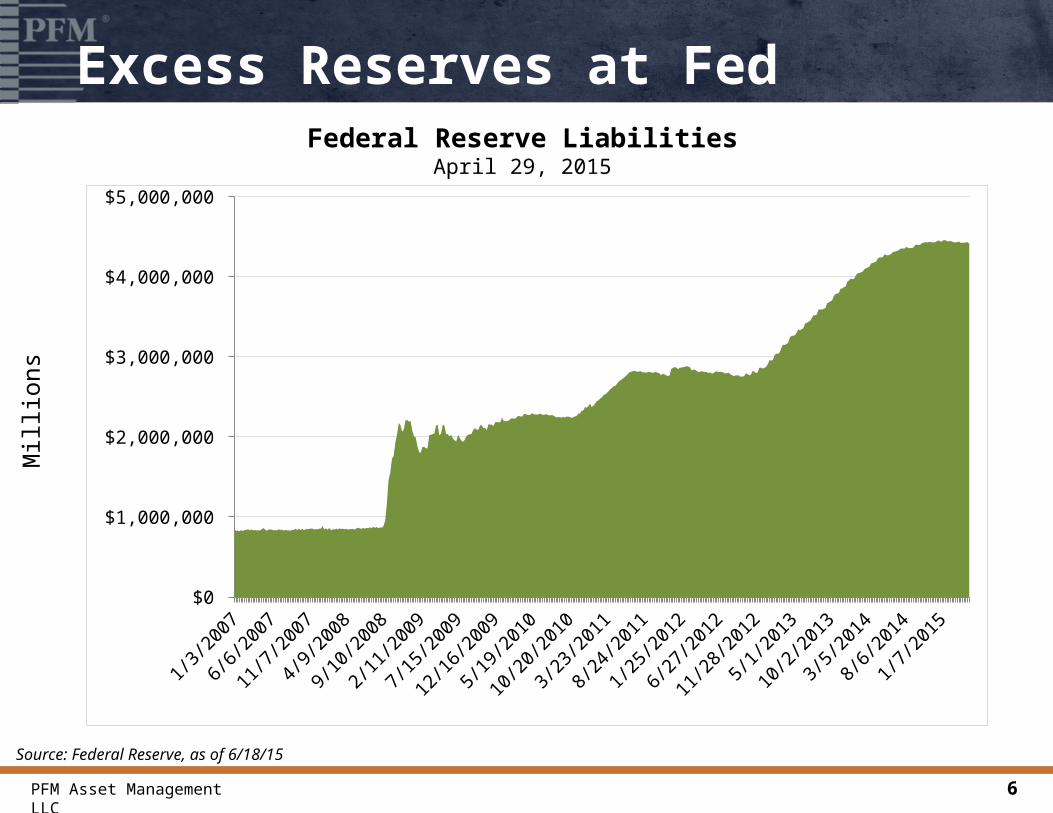
Excess Reserves at Fed
Source: Federal Reserve, as of 6/18/15
Mill
ions
Federal Reserve LiabilitiesApril 29, 2015
6
Jan-0
7
Jul-0
7
Jan-0
8
Jul-0
8
Jan-0
9
Jul-0
9
Jan-1
0
Jul-1
0
Jan-1
1
Jul-1
1
Jan-1
2
Jul-1
2
Jan-1
3
Jul-1
3
Jan-1
4
Jul-1
4
Jan-1
5$0
$1,000,000
$2,000,000
$3,000,000
$4,000,000
$5,000,000
PFM Asset Management LLC

© 2014 The PFM Group
Cost of Collateralization
• Indirect cost to own low-yielding securities
• Administrative cost to pledge and monitor collateral
• Pledging collateral costs banks15 – 25 basis points in yield*
7
*Source: ABA Banking Journal 95, no 11 (2003)
PFM Asset Management LLC

© 2014 The PFM Group
FDIC Assessments
• Fees increased in 2011 to replenish FDIC Deposit Insurance Fund
• Assessments vary by bank
– Rates from 0.07% - 0.45%
• Fees applied to net assets
• Some banks charge extra fees to depositors
8
*Source: Federal Deposit Insurance Corp.
PFM Asset Management LLC

© 2014 The PFM Group
9
9
• Produced by Bank for International Settlements
The Basel Accords
Basel I1988
Focused on credit risk
Created the credit default swap
Basel II2004
Initiated 3 Pillars
Minimum Capital Requirements
Supervisory Review Process
Market Discipline
Basel III2010
Response to 2008 Financial Crisis
Strengthens Basel II Pillars
Stringent Credit, Liquidity and Leverage Rules
PFM Asset Management LLC

© 2014 The PFM Group
10
10
• Most complete overhaul of capital standards since Basel I in 1989
• Includes changes required by Dodd-Frank • Applies to all banks with over $500 million
in assets :– National banks– State member and non-member banks– U.S. bank holding companies – State and Federal savings associations– Savings and loan holding companies
U.S. Implementation of Basel III
PFM Asset Management LLC

© 2014 The PFM Group
Rules and Timing Vary by Bank Size
Source: Davis Polk (many details are omitted from this visual overview)* As of June 30, 2014
U.S. Global
Systemically Important Banks
U.S. Bank Holding Companies
with ≥ $250 billion in assets or ≥ $10 billion in
foreign exposures
U.S. Bank Holding Companies
with ≥ $50 billion in assets
U.S. Bank Holding Companies
with > $10 billion in assets
U.S. Bank Holding Companies Except those with < $500 million in assets
Selected List of GSIBs
• Bank of America
• Bank of New York Mellon
• Barclays
• Citigroup
• Goldman Sachs
• JP Morgan Chase
• Morgan Stanley
• Santander
• State Street
• Wells Fargo
11PFM Asset Management LLC
© 2014 The PFM Group
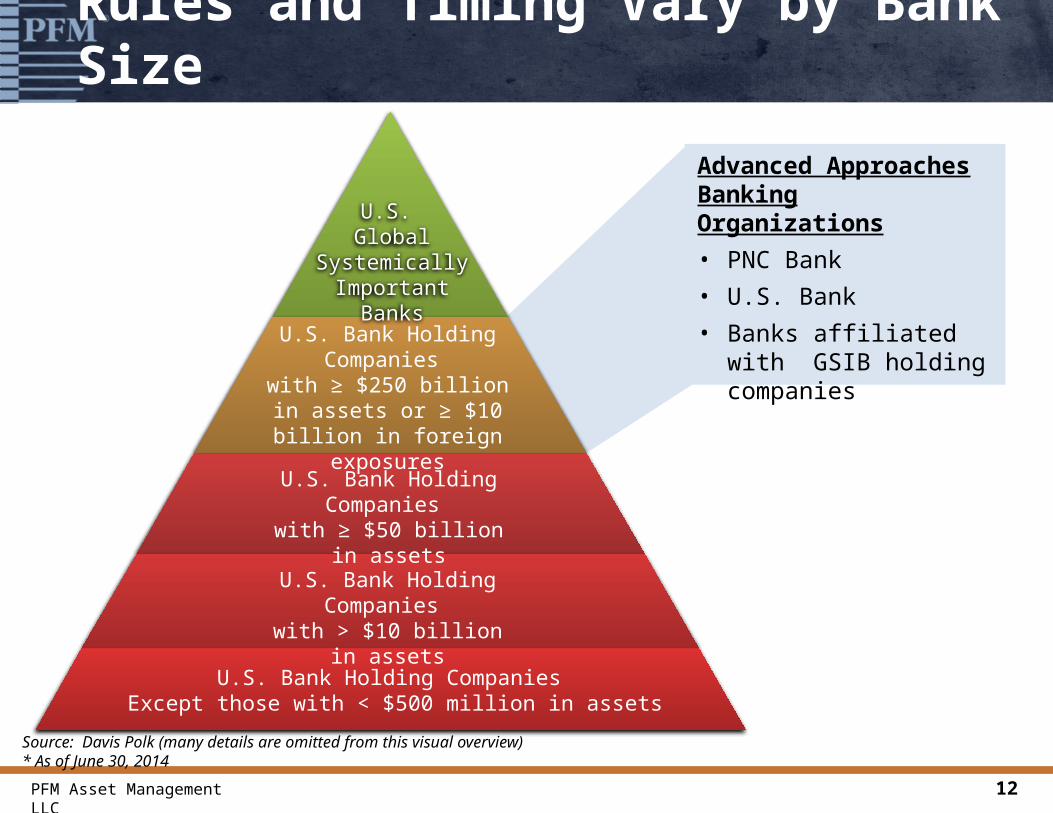
Rules and Timing Vary by Bank Size
U.S. Global
Systemically Important Banks
U.S. Bank Holding Companies
with ≥ $250 billion in assets or ≥ $10 billion in
foreign exposures
U.S. Bank Holding Companies
with ≥ $50 billion in assets
U.S. Bank Holding Companies
with > $10 billion in assets
U.S. Bank Holding Companies Except those with < $500 million in assets
Advanced Approaches Banking Organizations
• PNC Bank
• U.S. Bank
• Banks affiliated with GSIB holding companies
12
Source: Davis Polk (many details are omitted from this visual overview)* As of June 30, 2014
PFM Asset Management LLC

© 2014 The PFM Group
Rules and Timing Vary by Bank Size
U.S. Global
Systemically Important Banks
U.S. Bank Holding Companies
with ≥ $250 billion in assets or ≥ $10 billion in
foreign exposures
U.S. Bank Holding Companies
with ≥ $50 billion in assets
U.S. Bank Holding Companies
with > $10 billion in assets
U.S. Bank Holding Companies Except those with < $500 million in assets
Assets Over $50 Billion
• Bancwest
• BB&T
• BBVA Compass
• Citizens
• Fifth Third
• Huntington
• KeyCorp
• M & T
• Northern Trust
• Regions
• Santandar
• Suntrust
• TD Bank
13
Source: Davis Polk (many details are omitted from this visual overview)* As of June 30, 2014
PFM Asset Management LLC

© 2014 The PFM Group
14
14
• To limit the build-up of leverage
• Reduction in repo volume (10 – 15% expected)– Lower rates– Reduced market liquidity– Higher yields on fixed income securities
Leverage Restrictions
Source: Barclays Research, Leverage Ratio, An Attack on Repo, August 2013
Tier 1 Capital
Exposure Values (Assets & Off Balance Sheet Items)
_> 3%
PFM Asset Management LLC

© 2014 The PFM Group
15
15
• Final U.S. rules released September 3, 2014• The Liquidity Coverage Ratio (LCR)
• High Quality Liquid Assets– U.S. Treasuries, 100%– GSEs, 85%– High grade corporates and exchange traded equity,
50%
Liquidity Standards
High Quality Liquid Assets
Total Net Cash Outflows_> 100%
PFM Asset Management LLC
© 2014 The PFM Group
Impact of Liquidity Requirements
• Retail and “operational wholesale” deposits more valuable
• High quality, liquid assets are precious
• Liquid reserves needed for undrawn commitments
• Desire for longer-term funding
16PFM Asset Management LLC

© 2014 The PFM Group
Fun in the Sun UniversityIntro to PFM
17
What can you do now?
PFM Asset Management LLC

© 2014 The PFM Group
Take Action
• Talk to your banks about changes they are making now and what they expect to do in the future
• Ask if the bank will offer higher rates on time deposits or term CDs
• Enter into bank contracts that lock in prices and/or limit fee increases
• Consider using compensating balances
• Talk to multiple banks about your needs
• Be open to new banking partners
18PFM Asset Management LLC

© 2014 The PFM Group
For Your Consideration
• Bank financial decisions are influenced by regulation
• Banks still take deposits…
• …but desire for deposits varies
• Most banks are still very interested in operating accounts…
• …but are less interested in “excess” deposits
• Many financial institutions are selective
– Services offered
– Markets served
– Client relationships
19PFM Asset Management LLC

© 2014 The PFM Group
This presentation is only intended for institutional and/or sophisticated professional investors. This material is intended for informational purposes only and should not be relied upon to make an investment decision, as it was prepared without regard to any specific objectives, or financial circumstances. It should not be construed as an offer or to purchase/sell any investment. Any investment or strategy referenced may involve significant risks, including, but not limited to: risk of loss, illiquidity, unavailability within all jurisdictions, and may not be suitable for all investors. To the extent permitted by applicable law, no member of the PFM Group, or any officer, employee or associate accepts any liability whatsoever for any direct or consequential loss arising from any use of this presentation or its contents, including for negligence. This material is not intended for distribution to, or use by, any person in a jurisdiction where delivery would be contrary to applicable law or regulation, or it is subject to any contractual restriction. No further distribution is permissible without prior written consent.
PFM Disclaimer
The views expressed within this material constitute the perspective and judgment of PFM at the time of distribution and are subject to change. Any forecast, projection, or prediction of the market, the economy, economic trends, and equity or fixed-income markets are based upon current opinion as of the date of issue, and are also subject to change. Opinions and data presented are not necessarily indicative of future events or expected performance. Information contained herein is based on data obtained from recognized statistical services, issuer reports or communications, or other sources, believed to be reliable. No representation is made as to its accuracy or completeness.
20PFM Asset Management LLC