© 2014 hdr, inc., all rights reserved. a colorado springs mpo pilot implementation study network...
TRANSCRIPT

© 2014 HDR, Inc., all rights reserved.
A Colorado Springs MPO Pilot Implementation Study
Network Robustness Index (NRI) Application to Security Critical Link Identification and 2040 RTP Project Prioritization
15th Transportation Research Board National Transportation Planning Applications ConferenceMay 17 – 21, 2015 Atlantic City, New JerseyPerformance Evaluation Session: May 20, 2015 Wednesday: 1:30 PM – 3:00 PM
Authors:Maureen Paz de Araujo, HDRMary Lupa, Parsons BrinckerhoffKen Prather, PPACGCraig T. Casper, PPACG
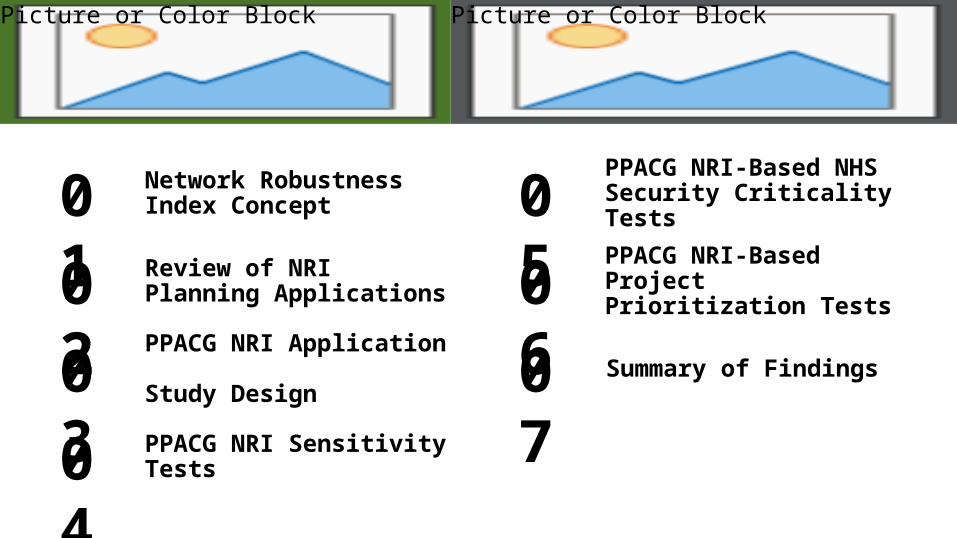
05 PPACG NRI-Based NHS Security Criticality Tests
06 PPACG NRI-Based Project Prioritization Tests
07 Summary of Findings
01 Network Robustness Index Concept
02 Review of NRI Planning Applications
03 PPACG NRI Application Study Design
04 PPACG NRI Sensitivity Tests
Picture or Color BlockPicture or Color Block
Picture or Color BlockPicture or Color Block0
1
Network Robustness Index Concept
𝑁𝑅𝐼 𝑎=𝐶𝑎−𝐶
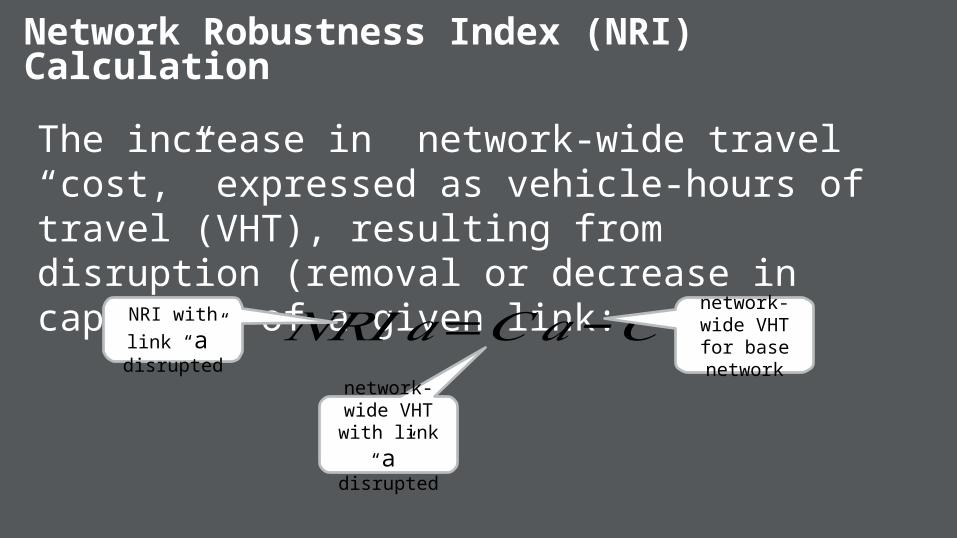
The Network Robustness Index (NRI)The NRI is calculated as the increase in network-wide travel “cost,” represented as vehicle-hours of travel (VHT), that result from disruption (removal or decrease in capacity) of a given link. The Network Robustness Index for disruption of link a (NRIa) is calculated as:
where: the total network “cost” with all links present (C) and the total network cost with link a disrupted (Ca) are calculated by equation (1) and equation (2), respectively as:
(1) (2)
and where: ti = the travel time across link i in minutes per tripxi = the flow of link I at user equilibriumI = the set of all links in the network
The increase in network-wide travel “cost,” expressed as vehicle-hours of travel (VHT), resulting from disruption (removal or decrease in capacity) of a given link:
Network Robustness Index (NRI) Calculation
𝑁𝑅𝐼 𝑎=𝐶𝑎−𝐶network-wide VHT with link
“a” disrupted
network-wide VHT for base network
NRI with link
“a” disrupted
The Network Robustness Index (NRI)The NRI is calculated as the increase in network-wide travel “cost,” represented as vehicle-hours of travel (VHT), that result from disruption (removal or decrease in capacity) of a given link. The Network Robustness Index for disruption of link a (NRIa) is calculated as:
where: the total network “cost” with all links present (C) and the total network cost with link a disrupted (Ca) are calculated by equation (1) and equation (2), respectively as:
(1) (2)
and where: ti = the travel time across link i in minutes per tripxi = the flow of link I at user equilibriumI = the set of all links in the network
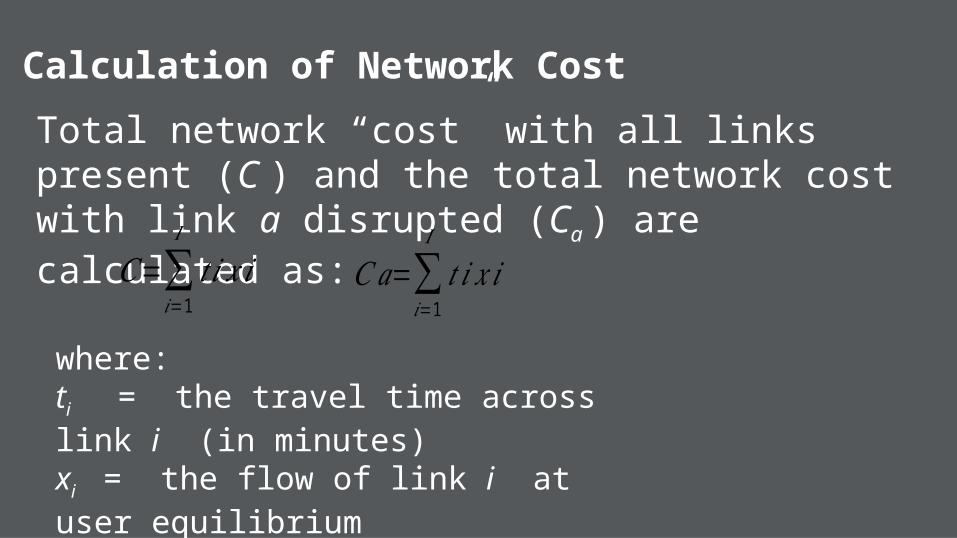
Total network “cost” with all links present (C ) and the total network cost with link a disrupted (Ca ) are calculated as:
Calculation of Network Cost
where:ti = the travel time across link i (in minutes) xi = the flow of link i at user equilibriumI = the set of all links in the network
𝐶=∑𝑖=1
𝐼
𝑡 𝑖 𝑥 𝑖 𝐶𝑎=∑𝑖=1
𝐼
𝑡 𝑖𝑥 𝑖
Picture or Color BlockPicture or Color Block0
2
Review of NRI Planning Applications

NRI Applications by Research Organizations
Relevant Studies 2006 - McMaster University Center
for Spatial AnalysisNetwork Robustness Index: A New Method for Identifying Critical Lengths and Evaluating Performance of Transportation Networks
2010 - University of Vermont Transportation Research CenterApplication of the Network Robustness Index to Identifying Critical Road-Network Links in Chittenden, Vermont
NRI APPLICATIONS BY RESEARCH ORGANIZATIONS
ORGANIZATION YEAR
KEY ELEMENTS
Center for Spatial Analysis at McMaster University
D. M. Scott, D. Novak, L. Aultman-Hall, F. Guo
2006
• Shifts focus from localized impacts system-wide impacts
• Goal to yield system-wide benefits
• Applies travel time metrics vs. V/C ratio metrics
• Focuses on methodology• Uses small networks to test
theory and results
University of Vermont Transportation Research Center
J. Sullivan, D. NovakL. Aultman-Hall,
2010
• A complete application of peak and daily NRI processing to full network
• Used data from Chittenden County MPO
• Used automated “tool” within TDM software to expedite processing

Picture or Color BlockPicture or Color Block0
3
PPACG NRI Application Study Design
• PPACG Region Size – Population: 600,0000• PPACG Model Run Time – 2 to 3 hours• PPACG Model Staff – 1-person plus consultants• Network Size – 12,300+ Links
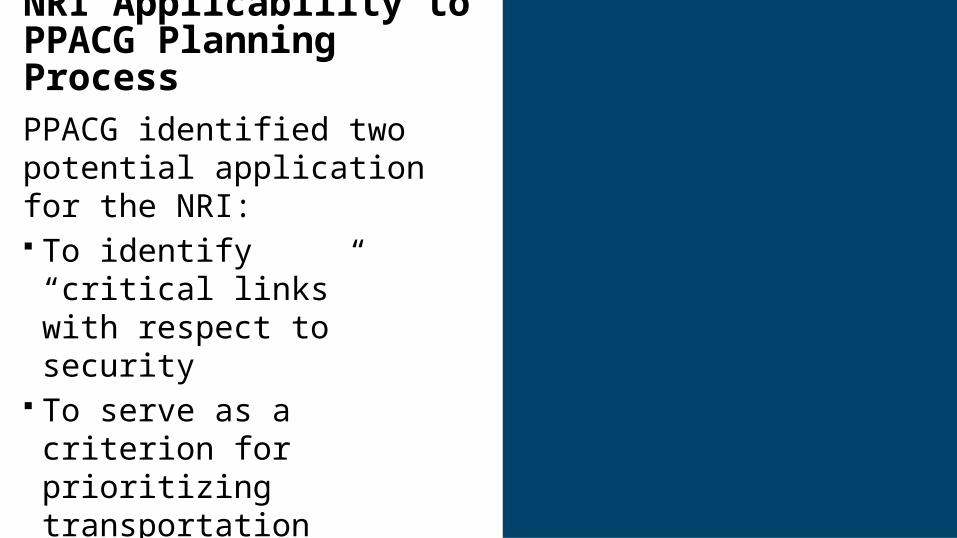
NRI Applicability to PPACG Planning ProcessPPACG identified two potential application for the NRI: To identify “critical links” with
respect to security To serve as a criterion for
prioritizing transportation system investments
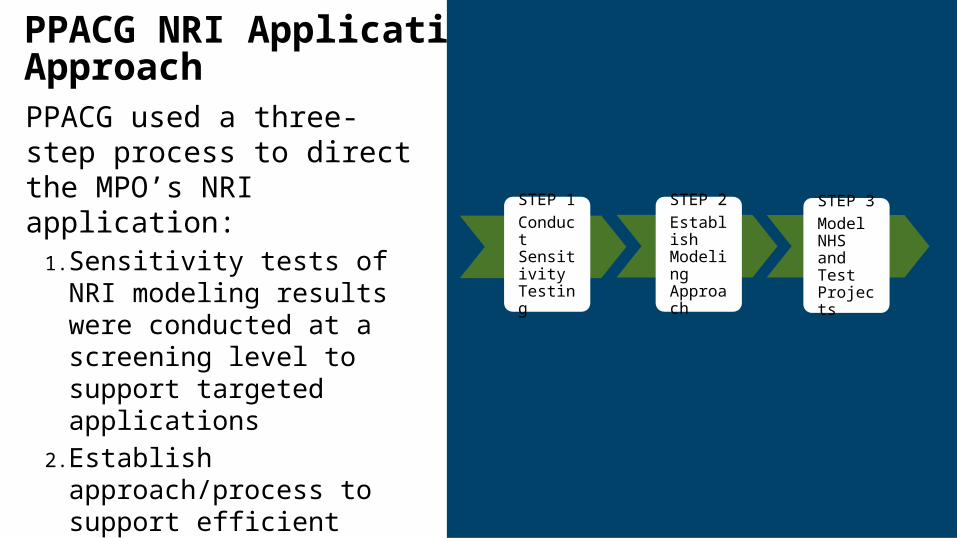
PPACG NRI Application Approach PPACG used a three-step process to direct the MPO’s NRI application:
1. Sensitivity tests of NRI modeling results were conducted at a screening level to support targeted applications
2. Establish approach/process to support efficient application at a system-wide level
3. Conduct model runs to screen for security criticality and to support project-level investment prioritization
STEP 1Conduct Sensitivity Testing
STEP 2Establish Modeling Approach
STEP 3Model NHS and Test Projects

NHS Identified for Screening AnalysisAs for the MPO Congestion Management Process, PPACG evaluated system security criticality for the National Highway System. The NHS provided a smaller, established high-level network for security criticality screening consistent with the approach used by the MPO for Congestion Management.
PPACG National Highway System Facilities
Interstate System Routes Other NHS Routes STRAHNET Routes MAP-21 NHS Principal Arterials Non-NHS Street Network

Picture or Color BlockPicture or Color Block0
4
PPACG NRI Sensitivity Tests
NRI Sensitivity Tests
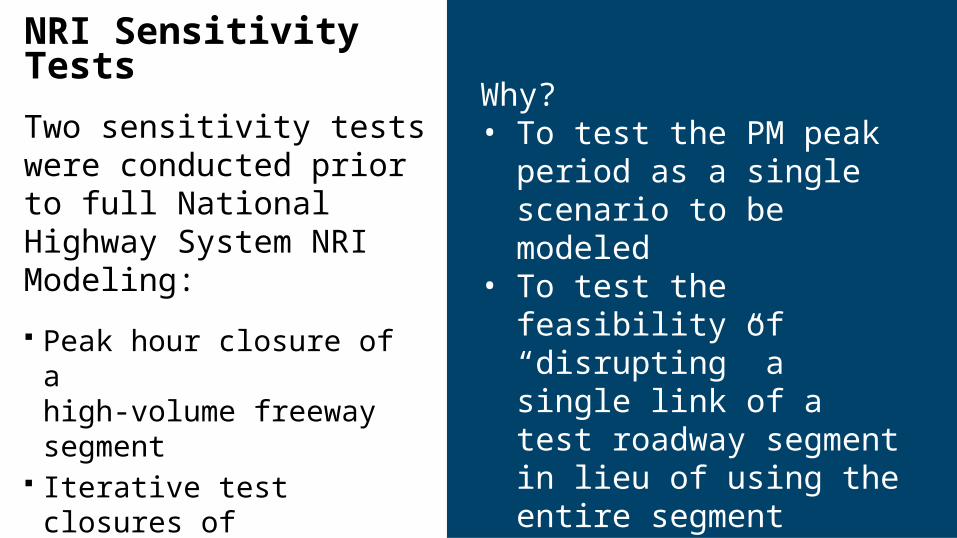
Two sensitivity tests were conducted prior to full National Highway System NRI Modeling:
Peak hour closure of a high-volume freeway segment
Iterative test closures of alternative major arterial segments
Why?• To test the PM peak period as a
single scenario to be modeled• To test the feasibility of
“disrupting” a single link of a test roadway segment in lieu of using the entire segment
• To test the importance of location and connectivity of the single segment to be disrupted
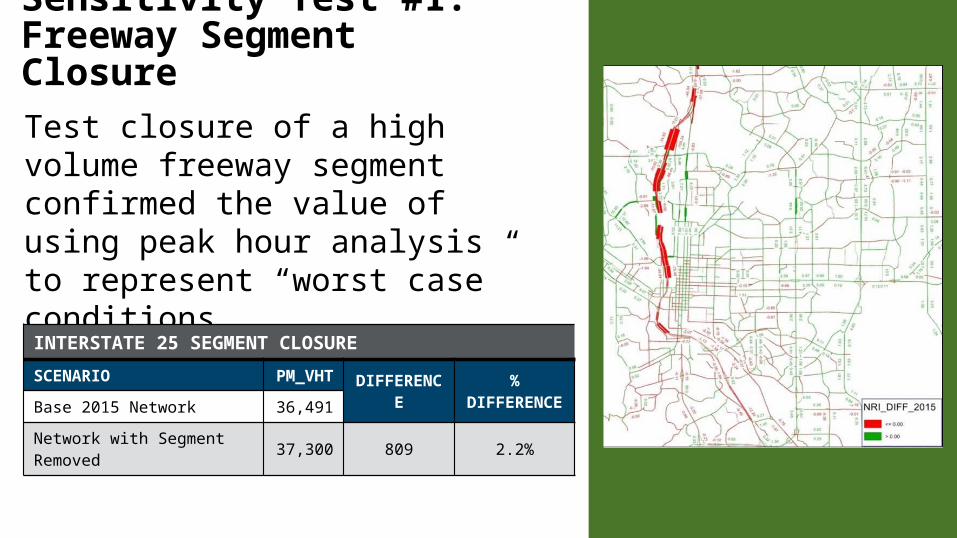
Test closure of a high volume freeway segment confirmed the value of using peak hour analysis to represent “worst case” conditions.
Sensitivity Test #1:Freeway Segment Closure
INTERSTATE 25 SEGMENT CLOSURE
SCENARIO PM_VHT DIFFEREN
CE
% DIFFERENC
EBase 2015 Network 36,491
Network with Segment Removed
37,300 809 2.2%
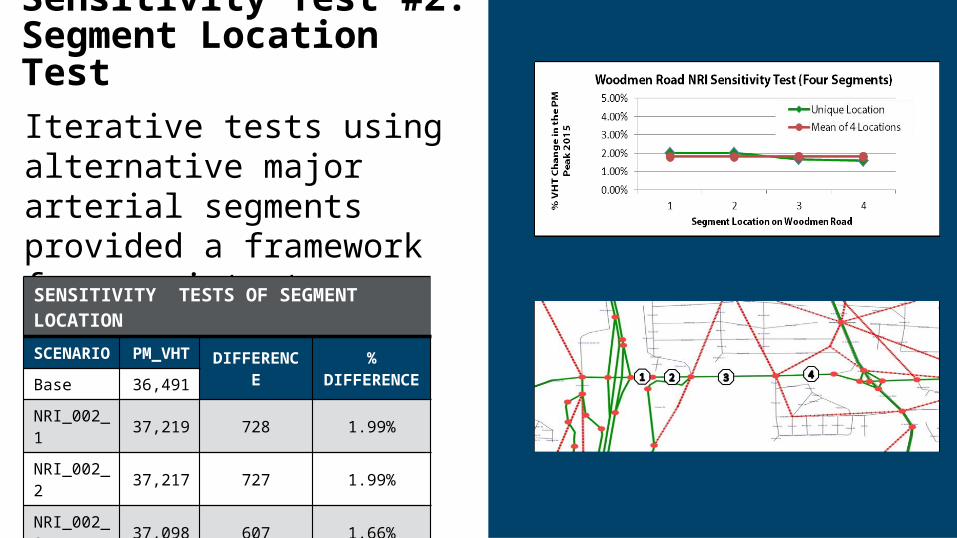
Iterative tests using alternative major arterial segments provided a framework for consistent selection of closure segments.
Sensitivity Test #2:Segment Location Test
SENSITIVITY TESTS OF SEGMENT LOCATION
SCENARIO
PM_VHT DIFFEREN
CE
% DIFFEREN
CEBase 36,491
NRI_002_1
37,219 728 1.99%
NRI_002_2
37,217 727 1.99%
NRI_002_3
37,098 607 1.66%
NRI_002_4
37,069 578 1.58%
Average 37,151 660 1.81%
Picture or Color BlockPicture or Color Block0
5
PPACG NRI-Based NHS Security Criticality Tests
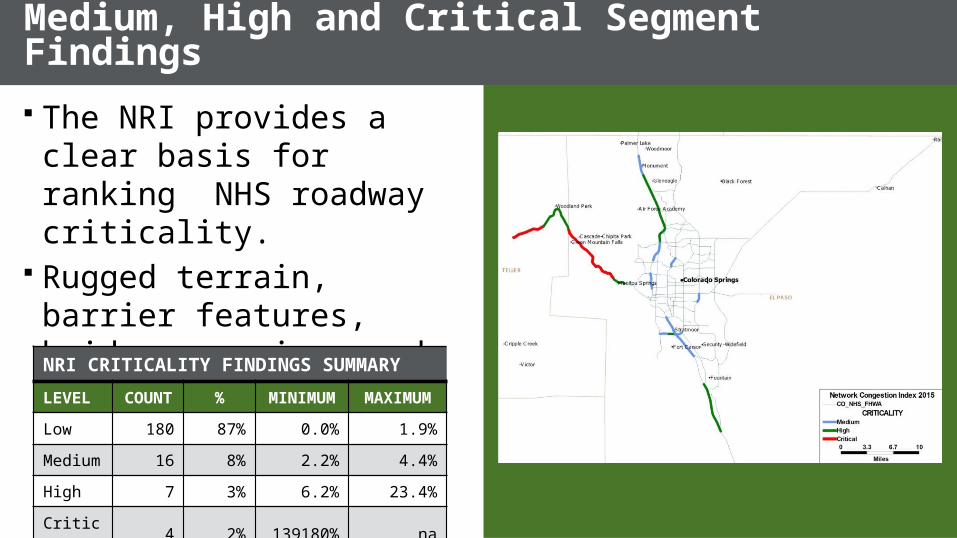
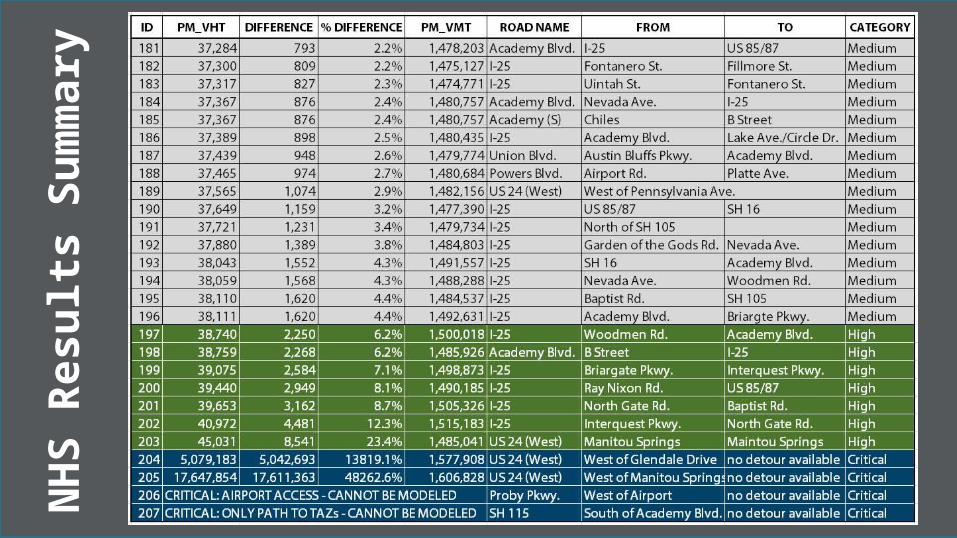
The NRI provides a clear basis for ranking NHS roadway criticality.
Rugged terrain, barrier features, bridge crossings and network redundancy are often factor in facility criticality.
Medium, High and Critical Segment Findings
NRI CRITICALITY FINDINGS SUMMARY
LEVEL COUNT
% MINIMUM
MAXIMUM
Low 180 87% 0.0% 1.9%
Medium
16 8% 2.2% 4.4%
High 7 3% 6.2% 23.4%
Critical4 2%
139180%
na
NH
S R
esu
lts
Su
mm
ary

Picture or Color BlockPicture or Color Block0
6
PPACG NRI-BasedProject Prioritization Tests

NRI Project Screening Findings
The following 2040 RTP projects were screened using the NRI: Project #1 - Centennial Extension
Addition of a two-mile completion segment to an existing arterial roadway
Project #2 - Woodmen Road Widening Widening 1.5-mile long segment of a 4-lane arterial to 6 lanes
Project #3 - I-25 Widening Addition of one lane in each direction to the most congested segment of I-25
FIRST PASS 2040 RTP PROJECT COMPARISON USING NRI
SCENARIO
PM_VHT
DIFF % DIFF
PM_VMT
DIFF % DIFF
2015 Base36,491
1,472,063
Test 136,394 (97) -0.27% (466)
-0.03%
Test 235,066
(1,425)
-3.90%(22,40
4)-
1.52%
Test 335,365
(1,126)
-3.-8%(24,46
8)-
1.66%
Picture or Color BlockPicture or Color Block0
7Summary of Findings

NRI provides assessment of highway improvement value in terms of time savings
NRI provides a clear basis for identification of security critical highway segments
There is potential to link NRI scores at the project level to scoring and portfolio optimization
Key Findings
Questions?
Picture or Color Block Picture or Color Block
Picture or Color Block