© 2013 john wiley & sons, ltd, accounting for managers, 1ce, ch 7 1
TRANSCRIPT

© 2013 John Wiley & Sons, Ltd, Accounting for Managers, 1Ce, Ch 7 1

CHAPTER 7
Inventory
Management
© 2013 John Wiley & Sons, Ltd, Accounting for Managers, 1Ce, Ch 7 2
Learning Objectives How are inventories presented on a company’s financial
statements? How does the flow of inventory costs differ between a
manufacturing and a merchandising company? What are the various methods used to value inventory?
How are these methods applied in practice? What are the benefits and challenges of just-in-time (JIT)
inventory management? Why are inventory management practices important in
controlling costs of inventory?
© 2013 John Wiley & Sons, Ltd, Accounting for Managers, 1Ce, Ch 7 3

Introduction to Inventory
Goods bought or manufactured for resale but unsold Timing difference between production capacity and
customer demand Cost includes all costs of purchase or manufacture to
bring inventory to its present location and condition On a company’s statement of comprehensive income,
the cost of inventories is recorded as “Cost of goods sold” and on the statement of financial position, it is reported under current assets as “Inventory.”
4© 2013 John Wiley & Sons, Ltd, Accounting for Managers, 1Ce, Ch 7

Inventory for a Merchandising Company
© 2013 John Wiley & Sons, Ltd, Accounting for Managers, 1Ce, Ch 7 5
Cost of Goods Sold: Merchandising Company

Inventory for a Merchandising Company
© 2013 John Wiley & Sons, Ltd, Accounting for Managers, 1Ce, Ch 7 6
Statement of Comprehensive Income
Statement of Financial Position

Inventory for a Merchandising Company
© 2013 John Wiley & Sons, Ltd, Accounting for Managers, 1Ce, Ch 7 7
The Flow of Costs in Purchasing

Inventory for a Manufacturing Company
Inventory types
1.Raw materials – unprocessed goods
2.Work in process – uncompleted goods
3.Finished goods – manufactured or purchased and ready for sale
8© 2013 John Wiley & Sons, Ltd, Accounting for Managers, 1Ce, Ch 7

9© 2013 John Wiley & Sons, Ltd, Accounting for Managers, 1Ce, Ch 7
Inventory for a Manufacturing CompanyCost of Goods Manufactured: Manufacturing Company

10© 2013 John Wiley & Sons, Ltd, Accounting for Managers, 1Ce, Ch 7
Inventory for a Manufacturing Company
Cost of Goods Sold Statement: Manufacturing Company
11© 2013 John Wiley & Sons, Ltd, Accounting for Managers, 1Ce, Ch 7
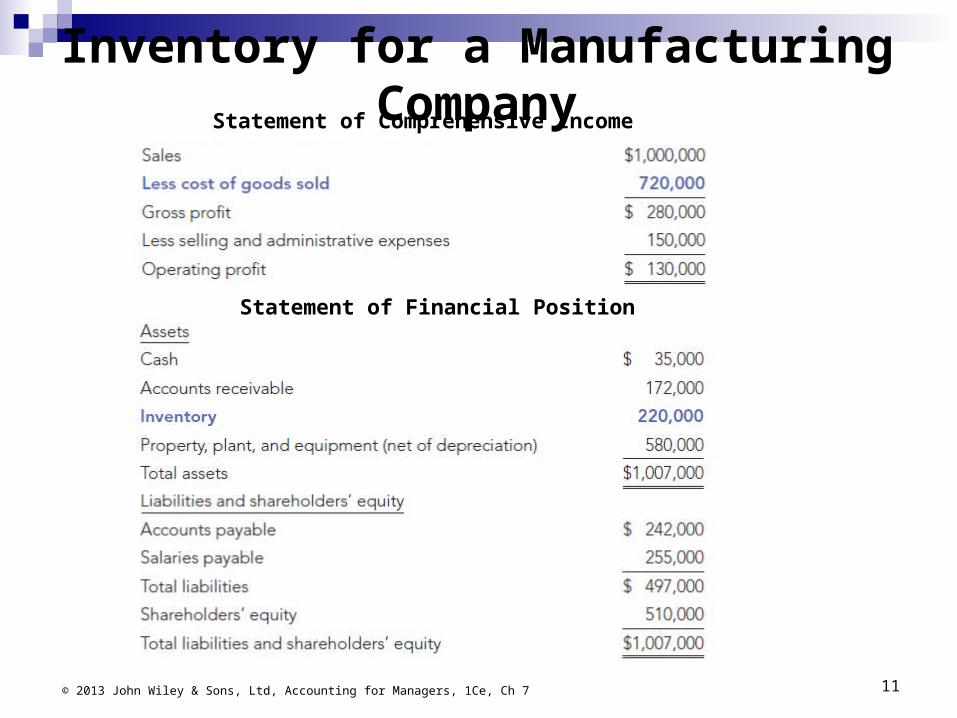
Inventory for a Manufacturing CompanyStatement of Comprehensive Income
Statement of Financial Position

12© 2013 John Wiley & Sons, Ltd, Accounting for Managers, 1Ce, Ch 7
Inventory for a Manufacturing Company
The notes to the financial statements would show a breakdown of the valuation of inventory in the current assets section of the statement of financial position.

13© 2013 John Wiley & Sons, Ltd, Accounting for Managers, 1Ce, Ch 7
Inventory for a Manufacturing Company
The Flow of Costs in Manufacturing

Valuation of Inventory Lower of cost or net realizable value (NRV) Individually purchased inventory
Purchase cost is used to value the inventory and the cost of goods sold when the inventory is sold
Similar/undifferentiated products (bulk) Weighted average cost FIFO (first in, first out)
14© 2013 John Wiley & Sons, Ltd, Accounting for Managers, 1Ce, Ch 7
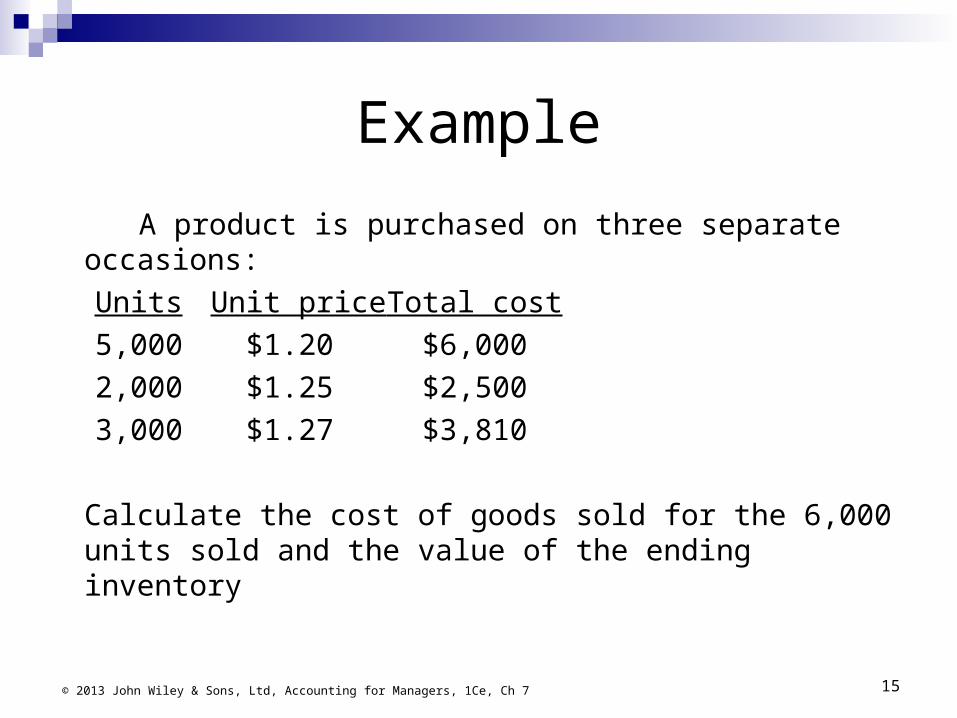
Example
A product is purchased on three separate occasions:
Units Unit price Total cost
5,000 $1.20 $6,000
2,000 $1.25 $2,500
3,000 $1.27 $3,810
Calculate the cost of goods sold for the 6,000 units sold and the value of the ending inventory
15© 2013 John Wiley & Sons, Ltd, Accounting for Managers, 1Ce, Ch 7

Weighted Average Method for Merchandising Companies
Units Unit price Total cost
5,000 $1.20 $6,000
2,000 $1.25 $2,500
3,000 $1.27 $3,810
10,000 $12,310
The weighted average cost is $12,310/10,000 = $1.231 per unit.
The cost of goods sold is 6,000 @ $1.231 = $7,386
The value of the ending inventory is 4,000 @ $1.231 = $4,924
Total cost $7,386 + $4,924 $12,310 16© 2013 John Wiley & Sons, Ltd, Accounting for Managers, 1Ce, Ch 7
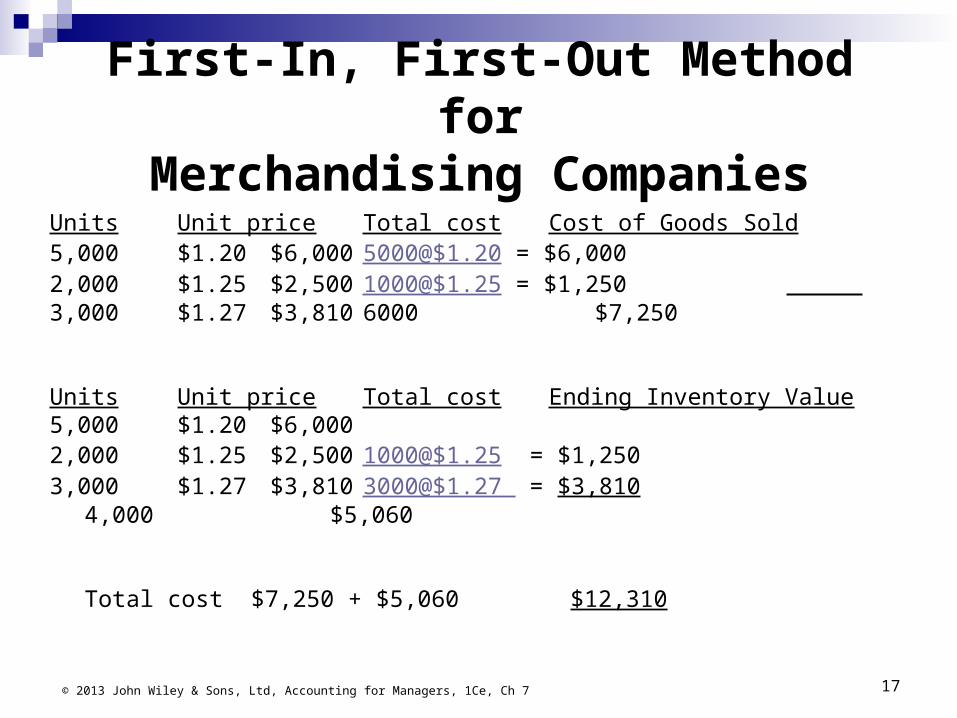
First-In, First-Out Method forMerchandising Companies
Units Unit price Total cost Cost of Goods Sold5,000 $1.20 $6,000 5000@$1.20 = $6,0002,000 $1.25 $2,500 1000@$1.25 = $1,2503,000 $1.27 $3,810 6000 $7,250
Units Unit price Total cost Ending Inventory Value5,000 $1.20 $6,0002,000 $1.25 $2,500 1000@$1.25 = $1,2503,000 $1.27 $3,810 3000@$1.27 = $3,810
4,000 $5,060
Total cost $7,250 + $5,060 $12,310
17© 2013 John Wiley & Sons, Ltd, Accounting for Managers, 1Ce, Ch 7
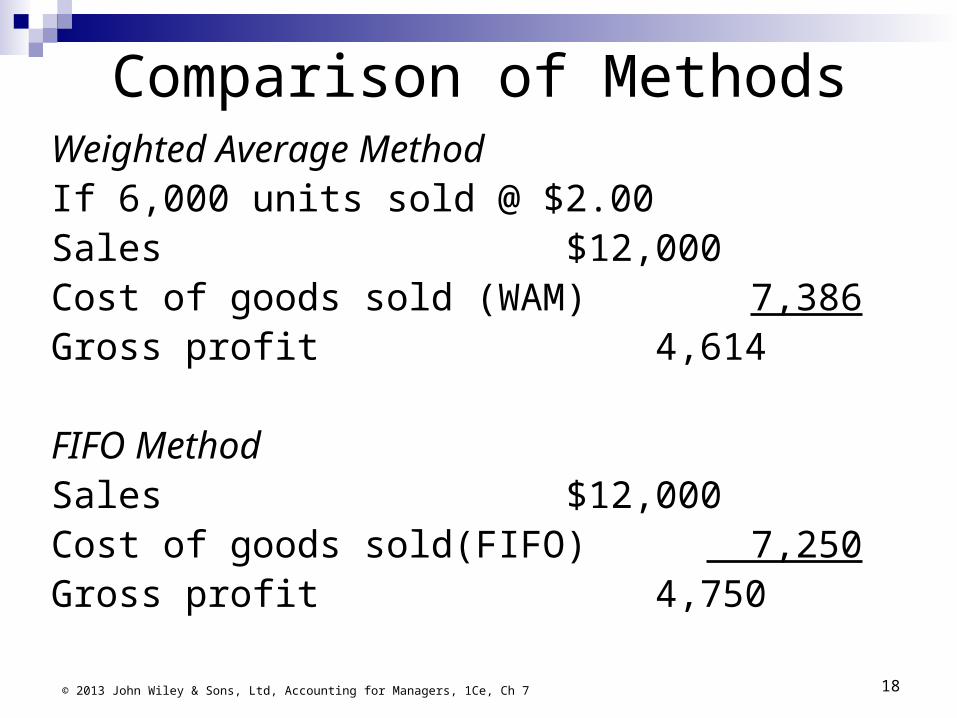
Comparison of MethodsWeighted Average MethodIf 6,000 units sold @ $2.00Sales $12,000Cost of goods sold (WAM) 7,386Gross profit 4,614
FIFO MethodSales $12,000Cost of goods sold(FIFO) 7,250Gross profit 4,750
18© 2013 John Wiley & Sons, Ltd, Accounting for Managers, 1Ce, Ch 7

Net Realizable Value (NRV)
NRV is the potential proceeds of sale of inventory, less any costs of disposal
If the NRV is lower than the recorded cost, the inventory item should be recorded at NRV
19© 2013 John Wiley & Sons, Ltd, Accounting for Managers, 1Ce, Ch 7

Methods of Costing Inventoryin Manufacturing
Custom Unique, single products
Batch A quantity of the same goods produced at the
same time ( a production run) Continuous (Process Costing)
Continuous production process of the same, indistinguishable goods
20© 2013 John Wiley & Sons, Ltd, Accounting for Managers, 1Ce, Ch 7
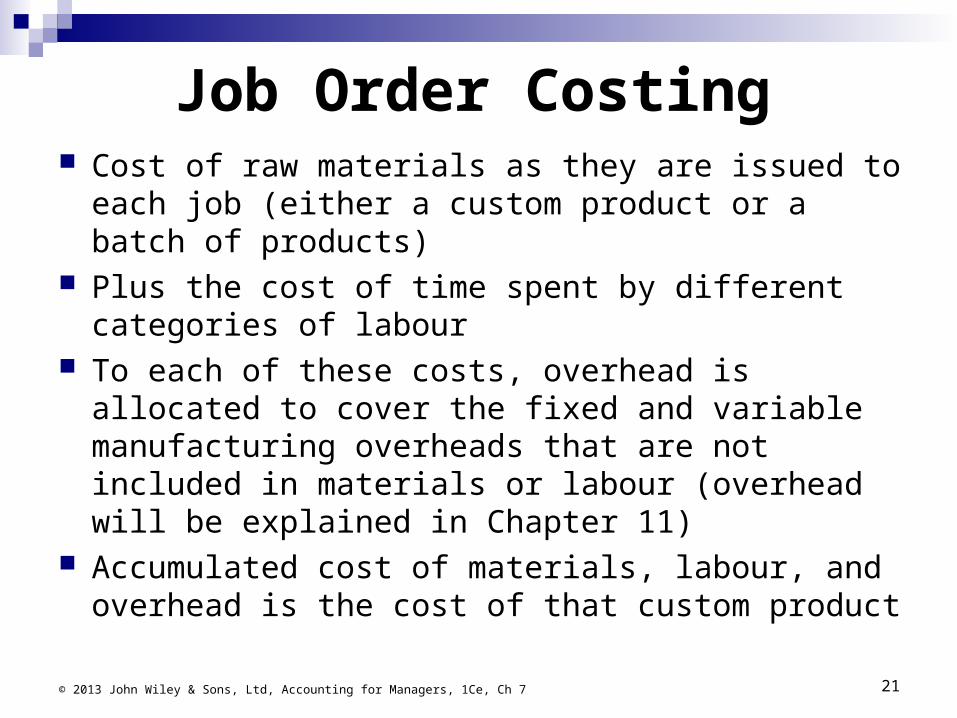
Job Order Costing Cost of raw materials as they are issued to each job
(either a custom product or a batch of products) Plus the cost of time spent by different categories of
labour To each of these costs, overhead is allocated to
cover the fixed and variable manufacturing overheads that are not included in materials or labour (overhead will be explained in Chapter 11)
Accumulated cost of materials, labour, and overhead is the cost of that custom product
21© 2013 John Wiley & Sons, Ltd, Accounting for Managers, 1Ce, Ch 7
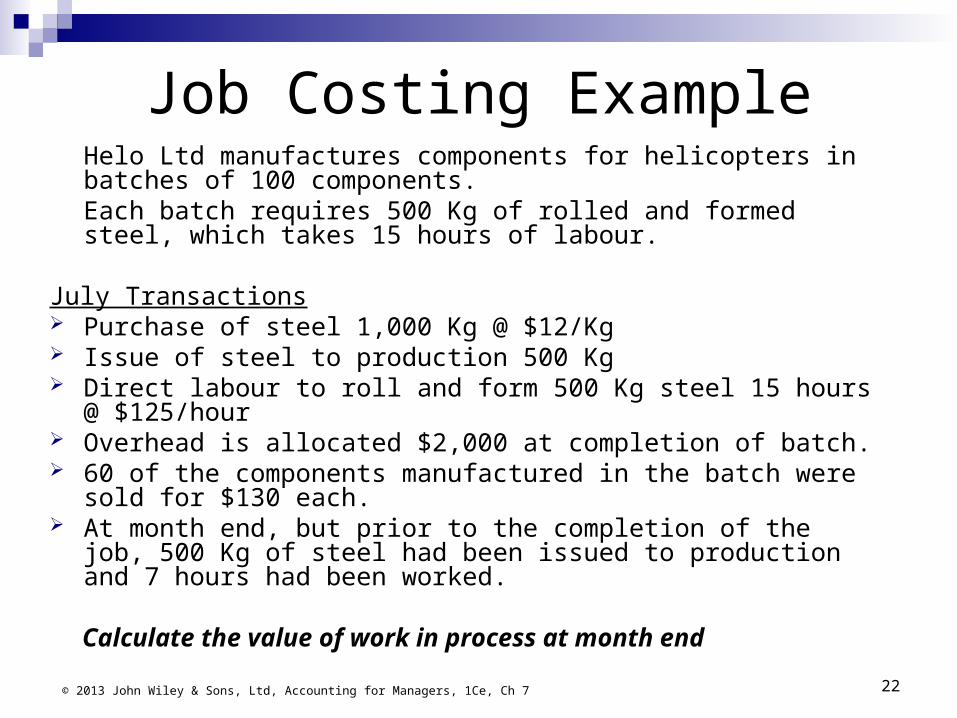
Job Costing ExampleHelo Ltd manufactures components for helicopters in batches of 100 components. Each batch requires 500 Kg of rolled and formed steel, which takes 15 hours of labour.
July Transactions Purchase of steel 1,000 Kg @ $12/Kg Issue of steel to production 500 Kg Direct labour to roll and form 500 Kg steel 15 hours @ $125/hour Overhead is allocated $2,000 at completion of batch. 60 of the components manufactured in the batch were sold for
$130 each. At month end, but prior to the completion of the job, 500 Kg of steel
had been issued to production and 7 hours had been worked.
Calculate the value of work in process at month end
22© 2013 John Wiley & Sons, Ltd, Accounting for Managers, 1Ce, Ch 7

Work in Process
Materials: Steel 500 Kg @ $12/Kg = $6,000
Labour: 7 hours @ $125 875
Work in progress $6,875
© 2013 John Wiley & Sons, Ltd, Accounting for Managers, 1Ce, Ch 7 23
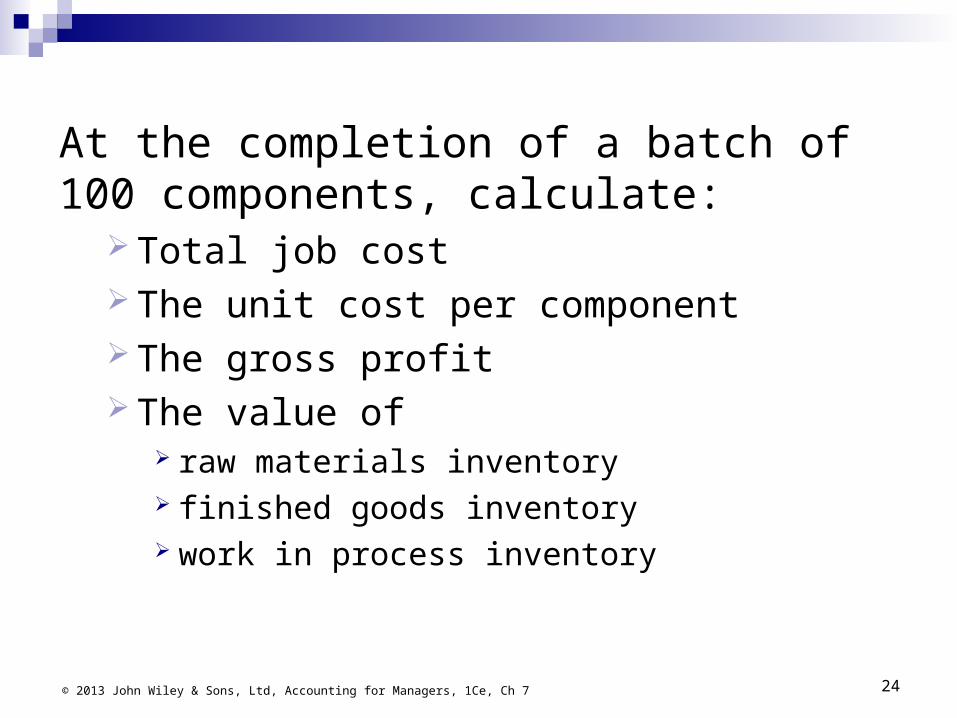
At the completion of a batch of 100 components, calculate:
Total job cost The unit cost per component The gross profit The value of
raw materials inventory finished goods inventory work in process inventory
24© 2013 John Wiley & Sons, Ltd, Accounting for Managers, 1Ce, Ch 7

Materials: Steel 500 Kg @ $12/Kg $6,000Labour: 15 hours @ $125 1,875Overhead 2,000
Total job cost $9,875
Cost per component ($9,875/100) $98.75
Sales income (60 @ $130) = $7,800 Cost of sales (60 @ $98.75) = $5,925 Gross profit is $7800 - $5925 = $1,875
Finished goods inventory (40 @ $98.75) = $3,950 Raw materials inventory 500 Kg of steel @ $12/Kg = $6,000
(purchased 1000Kg less used 500Kg)Total inventory $9,950
There is no Work in progress as the job is complete
25© 2013 John Wiley & Sons, Ltd, Accounting for Managers, 1Ce, Ch 7
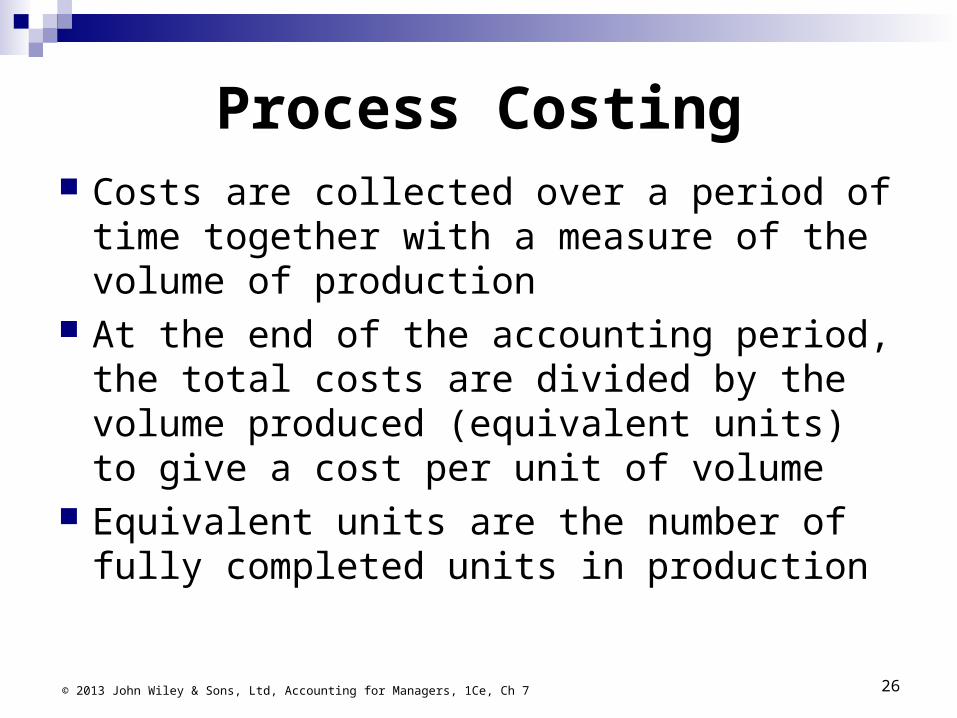
Process Costing Costs are collected over a period of time
together with a measure of the volume of production
At the end of the accounting period, the total costs are divided by the volume produced (equivalent units) to give a cost per unit of volume
Equivalent units are the number of fully completed units in production
© 2013 John Wiley & Sons, Ltd, Accounting for Managers, 1Ce, Ch 7 26
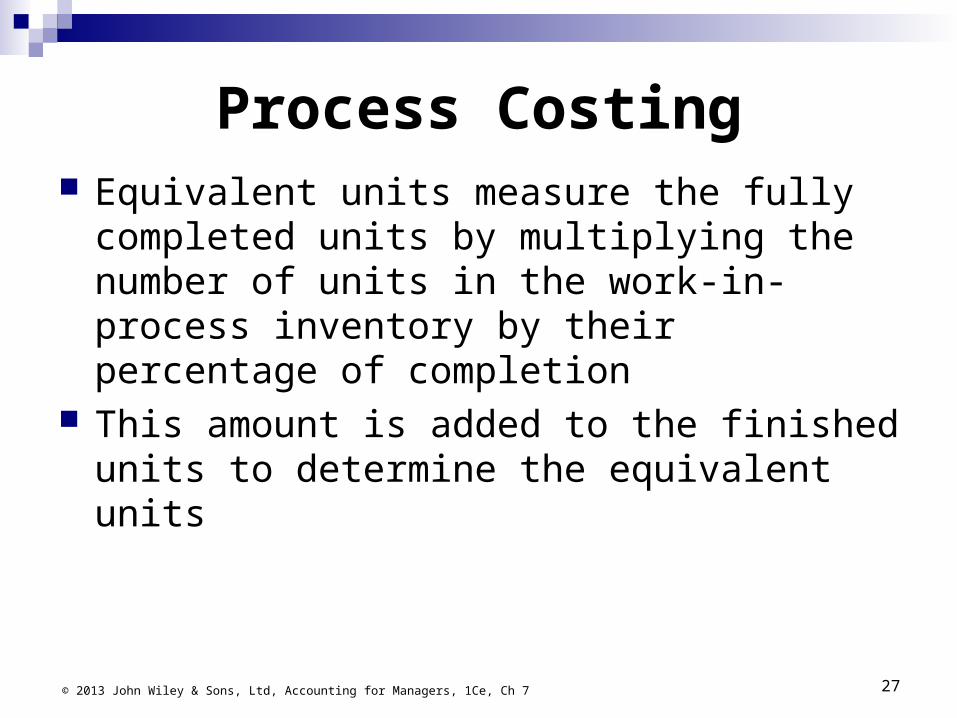
Process Costing Equivalent units measure the fully completed
units by multiplying the number of units in the work-in-process inventory by their percentage of completion
This amount is added to the finished units to determine the equivalent units
© 2013 John Wiley & Sons, Ltd, Accounting for Managers, 1Ce, Ch 7 27

Either the weighted average method or the first-in, first-out (FIFO) method can be used to calculate inventory costs for process costing.
Under both methods, it is necessary to complete three steps:
1. Determine the number of units completed.
2. Calculate the equivalent units in work in process and the cost per equivalent unit.
3. Assign the cost to finished goods and ending WIP inventory
© 2013 John Wiley & Sons, Ltd, Accounting for Managers, 1Ce, Ch 7 28
Process Costing

Note: In process costing examples, unless you are advised otherwise, materials are assumed to be added at the beginning of the process, and conversion costs are added uniformly throughout the process.
29© 2013 John Wiley & Sons, Ltd, Accounting for Managers, 1Ce, Ch 7
Material added Conversion costs applied uniformly
Beginning of process
End of process

Process Costing with Partially Completed Units – Weighted Average
Kazoo produces oils on a process basis during a month Opening work in progress 7,000 units:
55% completed Materials $12,000 and conversion costs $30,000.
12,000 units commenced production during the month. Closing work in progress 4,000 units, 75% complete. Cost of materials issued to production during the month
was $140,000. Conversion costs for production during the month were
$80,000.
30© 2013 John Wiley & Sons, Ltd, Accounting for Managers, 1Ce, Ch 7
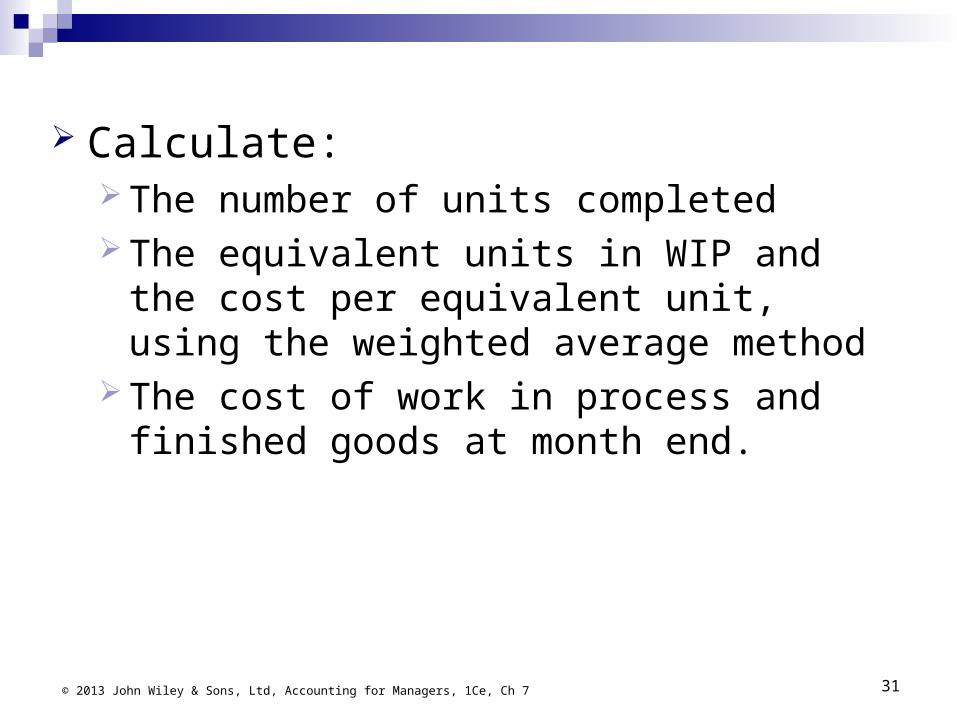
Calculate: The number of units completed The equivalent units in WIP and the cost per
equivalent unit, using the weighted average method
The cost of work in process and finished goods at month end.
31© 2013 John Wiley & Sons, Ltd, Accounting for Managers, 1Ce, Ch 7

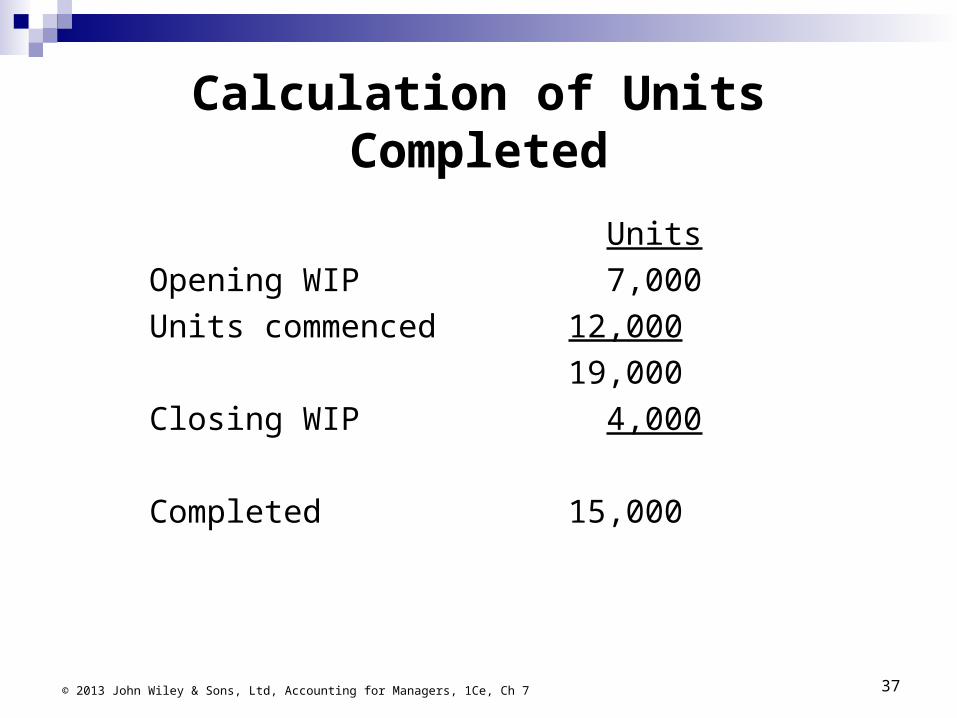
Calculation of Units Completed
Units
Opening WIP 7,000
Units commenced 12,000
19,000
Closing WIP 4,000
Completed 15,000
32© 2013 John Wiley & Sons, Ltd, Accounting for Managers, 1Ce, Ch 7

Calculation of Equivalent Units and Cost per Unit
Opening WIP $
Cost for month $
Total $ Completed units
WIP Equivalent
units
Total equivalent
units
Cost per equivalent
unit $ Material 12,000 140,000 152,000 15,000 4,000 19,000 $8.000 Conversion 30,000 80,000 110,000 15,000 *3,000 18,000 $6.111 Total $42,000 $262,000 $14.111
* 4,000 units, 75% complete at end of month = 3,000 equivalent units
33© 2013 John Wiley & Sons, Ltd, Accounting for Managers, 1Ce, Ch 7

Assignment of Costs
Work in progress:
Materials 4,000 @ $8 $32,000
Conversion 3,000 @ $6.111 $18,333
$50,333
Finished goods:
15,000 units @ $14.111 $211,666
Total costs $262,000*
* Materials $12,000 + $140,000 + Conversion $30,000 + $80,000
© 2013 John Wiley & Sons, Ltd, Accounting for Managers, 1Ce, Ch 7 34

Process Costing with Partially Completed Units – First-in First-Out
(FIFO)Kazoo produces oils on a process basis during a month Opening work in progress 7,000 units:
55% completed Materials $12,000 and conversion costs $30,000.
12,000 units commenced production during the month. Closing work in progress 4,000 units, 75% complete. Cost of materials issued to production during the month
was $140,000. Conversion costs for production during the month were
$80,000.
35© 2013 John Wiley & Sons, Ltd, Accounting for Managers, 1Ce, Ch 7

Calculate: The number of units completed The equivalent units in WIP and the cost per
equivalent unit, using the FIFO method The cost of work in process and finished
goods at month end.
36© 2013 John Wiley & Sons, Ltd, Accounting for Managers, 1Ce, Ch 7
Calculation of Units Completed
Units
Opening WIP 7,000
Units commenced 12,000
19,000
Closing WIP 4,000
Completed 15,000
37© 2013 John Wiley & Sons, Ltd, Accounting for Managers, 1Ce, Ch 7

Calculation of Equivalent Units and Cost per Unit
Opening WIP $
Cost for month $
Beginning WIP
completed
Completed units
Ending WIP
Equivalent units
Total equivalent
units
Cost per equivalent
unit $
Material 0 140,000 0 8,000 4,000 12,000 $11.6667 Conversion 0 80,000 *3,150 8,000 **3,000 14,150 $5.6537 Total $42,000 220,000 $17.3207
* 7.000 units, 55% complete, 45% added in current month: 7,000 x 45% = 3,150
** 4,000 units, 75% complete at end of month = 3,000 equivalent units
38© 2013 John Wiley & Sons, Ltd, Accounting for Managers, 1Ce, Ch 7
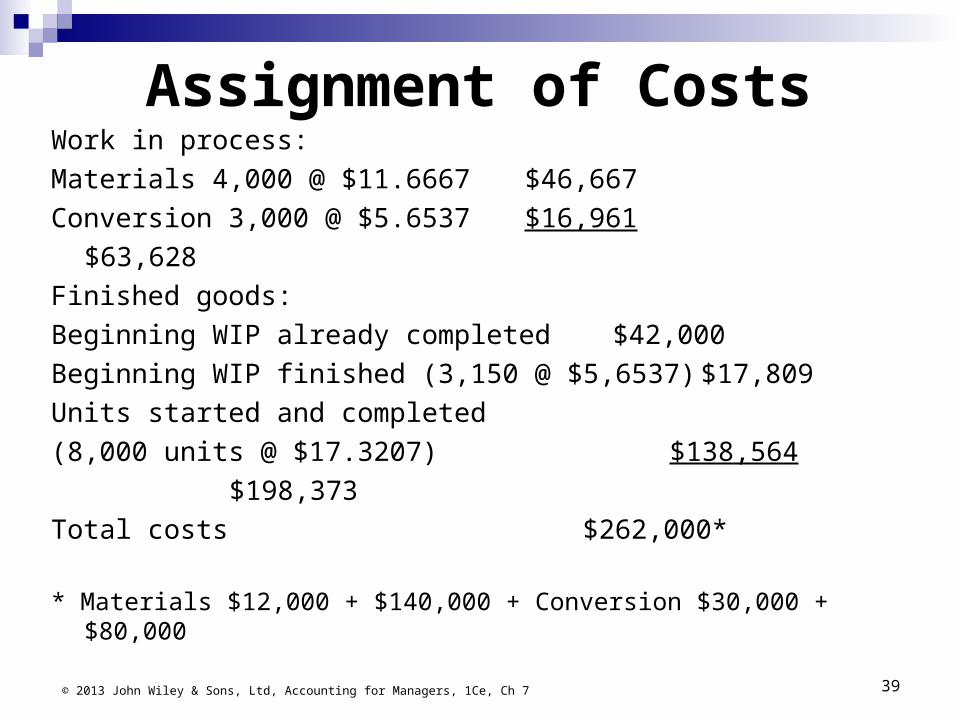
Assignment of CostsWork in process:
Materials 4,000 @ $11.6667 $46,667
Conversion 3,000 @ $5.6537 $16,961
$63,628
Finished goods:
Beginning WIP already completed $42,000
Beginning WIP finished (3,150 @ $5,6537) $17,809
Units started and completed
(8,000 units @ $17.3207) $138,564
$198,373
Total costs $262,000*
* Materials $12,000 + $140,000 + Conversion $30,000 + $80,000
© 2013 John Wiley & Sons, Ltd, Accounting for Managers, 1Ce, Ch 7 39
Valuation of Inventory forService Companies
Professional service firms also have inventories.
Accountants and lawyers are examples of firms with large work-in-process inventories, covering work carried out on behalf of clients but not yet invoiced.
© 2013 John Wiley & Sons, Ltd, Accounting for Managers, 1Ce, Ch 7 40

Just-In-Time Inventory Management
Maintain minimal inventories (as close to zero as possible) to reduce inventory carrying costs, such as storage and materials handling costs, and to reduce the cost of obsolescence
Advantages Cost savings Improved customer and employee satisfaction Improved quality Disadvantages Inability to predict demand Strong reliance on suppliers
© 2013 John Wiley & Sons, Ltd, Accounting for Managers, 1Ce, Ch 741

Backflush Costing Transfers the cost of materials from suppliers, along
with conversion costs, to finished goods inventory when production of finished goods is complete (the trigger point)
The Flow of Costs in Backflush Costing
42© 2013 John Wiley & Sons, Ltd, Accounting for Managers, 1Ce, Ch 7
Long-Term Contract Costing Large units produced over longer periods Percentage of completion Revenues and gross profit are recognized in the
applicable periods of production, not when production has been completed.
The costs incurred in reaching the relevant stage of completion are then matched with income
43© 2013 John Wiley & Sons, Ltd, Accounting for Managers, 1Ce, Ch 7

Architects certificate as to stage of completion
Progress payments by customer Retention value
44© 2013 John Wiley & Sons, Ltd, Accounting for Managers, 1Ce, Ch 7
Long-Term Contract Costing

Long-term Contract Costing Example
Macro Builders has entered into a 2 year contract to construct a building. Contract price is $1.2 million, Expected cost of construction of $1 million.
After 1 year, the following costs have been incurred:
Material delivered to site $500,000Salaries and wages paid 130,000Overhead costs 170,000
Certification of value of work completed is $600,000. Macro estimates cost of $250,000 to complete over and above the costs already incurred.
Calculate:
The anticipated profit on the contract The amount of profit that can be considered to have been earned to
date.
45© 2013 John Wiley & Sons, Ltd, Accounting for Managers, 1Ce, Ch 7
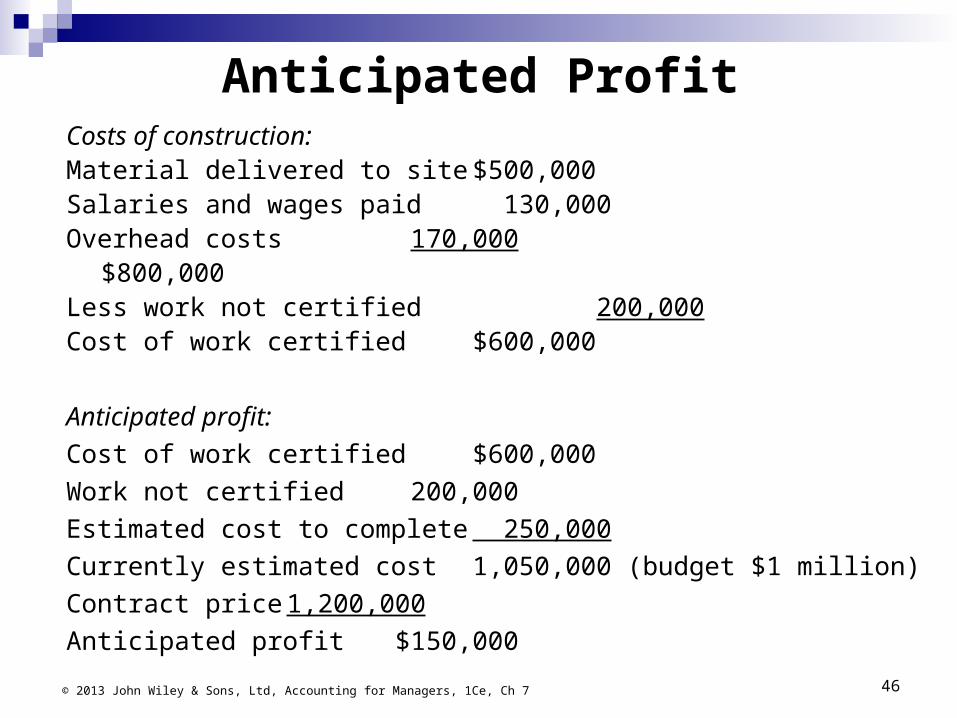
Anticipated ProfitCosts of construction:Material delivered to site $500,000Salaries and wages paid 130,000Overhead costs 170,000
$800,000Less work not certified 200,000Cost of work certified $600,000
Anticipated profit:
Cost of work certified $600,000
Work not certified 200,000
Estimated cost to complete 250,000
Currently estimated cost 1,050,000 (budget $1 million)
Contract price 1,200,000
Anticipated profit $150,000© 2013 John Wiley & Sons, Ltd, Accounting for Managers, 1Ce, Ch 7 46
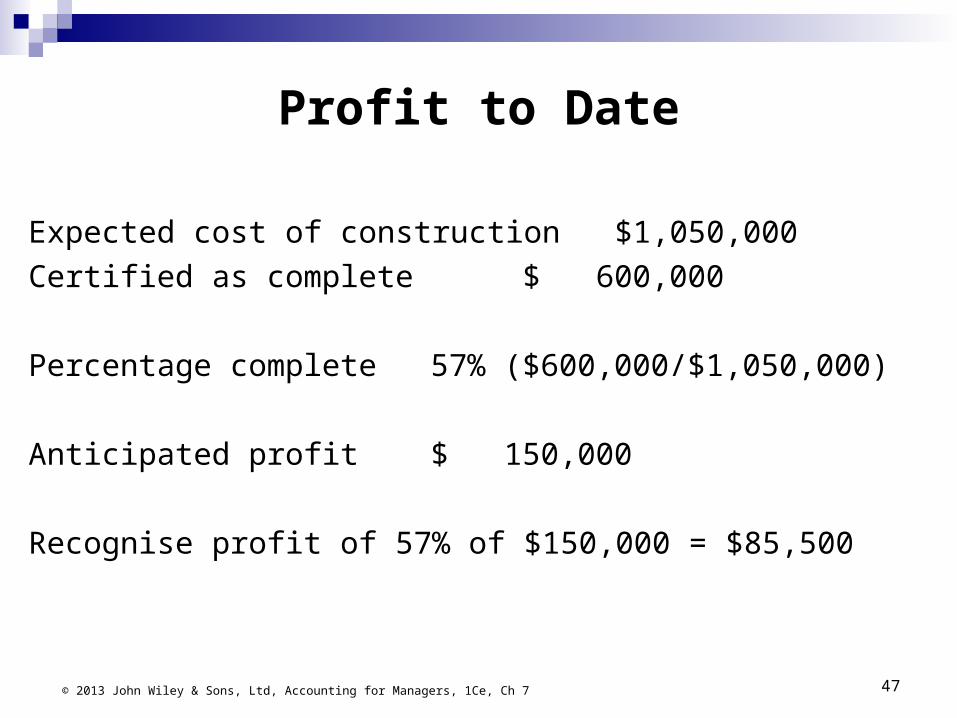
Profit to Date
Expected cost of construction $1,050,000
Certified as complete $ 600,000
Percentage complete 57% ($600,000/$1,050,000)
Anticipated profit $ 150,000
Recognise profit of 57% of $150,000 = $85,500
© 2013 John Wiley & Sons, Ltd, Accounting for Managers, 1Ce, Ch 7 47

Inventory Management Objective is to optimize the levels of inventory
Reduce costs associated with ordering and carrying inventories
Ensuring there is enough inventory on hand to meet consumer demand
Costs associated with ordering and carrying inventory
1. Ordering costs
2. Carrying costs.
3. Stockout costs.
48© 2013 John Wiley & Sons, Ltd, Accounting for Managers, 1Ce, Ch 7
Economic Order Quantity and Lead Times
Economic order quantity (EOQ) Determine the levels of inventory that will
reduce costs while meeting demand Lead time
Time between when an order is placed with a supplier and when it is needed
Safety stock an amount of extra stock that is kept on hand
to cover any unexpected increases in demand© 2013 John Wiley & Sons, Ltd, Accounting for Managers, 1Ce, Ch 7 49

Economic Order Quantity
© 2013 John Wiley & Sons, Ltd, Accounting for Managers, 1Ce, Ch 7 50
Calculated using the following formula

Conclusion
Several methods of calculating the value of inventory and cost of goods sold
How inventories are reported on the financial statements for a company
Looked at the two main methods of costing inventories, job costing and process costing
A method of long-term contract costing Benefits and challenges of using just-in-time (JIT)
inventory management practices Economic order quantity can be used to optimize
inventory costs.
51© 2013 John Wiley & Sons, Ltd, Accounting for Managers, 1Ce, Ch 7