© 2013 by hanfei tuo. all rights reserved
TRANSCRIPT

© 2013 by Hanfei Tuo. All rights reserved
FLASH GAS BYPASS
- A WAY TO IMPROVE DISTRIBUTION OF ADIABATIC
TWO-PHASE REFRIGERANT FLOW IN HEADERS OF
MICROCHANNEL EVAPORATORS
BY
HANFEI TUO
DISSERTATION
Submitted in partial fulfillment of the requirements
for the degree of Doctor of Philosophy in Mechanical Engineering
in the Graduate College of the
University of Illinois at Urbana-Champaign, 2013
Urbana, Illinois
Doctoral Committee:
Professor Predrag S. Hrnjak, Chair
Professor Anthony M. Jacobi
Professor Clark W. Bullard
Professor Yuanhui Zhang
Professor José M. Corberán
ii
Abstract
This work presents an experimental and numerical study of flash gas bypass (FGB) method as
a way to solve the existing problem of distribution of two phase adiabatic flow in headers of parallel
flow evaporators, of typically microchannel design. Three main issues that will be explored in this
thesis are: 1) separation of vapor-liquid refrigerant immediately after an expansion device in a
compact T-junction and design options to enhance its performance; 2) effects of bypassing the flash
vapor and header pressure drop induced flow maldistribution on heat transfer performance of
microchannel evaporators; 3) periodic reverse vapor flow in microchannel evaporators used in A/C
systems. These three issues were part of a project to improve distribution by separation of vapor
prior to reaching inlet to each channel.
In the first part, experimental work is performed to study vapor-liquid refrigerant separation in vertical
impact T-junctions using R134a and R410A as working fluids. Inlet flow rate and quality are varied in the
range of 10 - 35 g/s and 10 - 25% with an intention for application in A/C systems with cooling capacities
about 1.5 to 6 kW. Flow patterns in the T-junction separator are identified and characterized. It is found that
liquid separation efficiency strongly depends on the flow pattern right above the impact region (junction).
The efficiency deteriorates dramatically when mist turns into churn flow regime, with increasing inlet flow
rate and/or quality. Then, five design modifications on the baseline T-separator are explored: inlet inclination
angle, dual-inlet as pre-separation, inlet tube diameter, cross-sectional shape and location with respect to the
vertical tube. The objective is to avoid or at least delay transition from mist to churn flow by reducing and
changing the direction of liquid phase inertia force, and decreasing liquid and vapor force interaction.
In the second part, effects of FGB on system performances are experimentally investigated by
implementing FGB method into an R134a A/C system with a single-pass microchannel evaporator.
Compared to the baseline A/C system with the identical components and operating at the same compressor
speed, FGB increased the cooling capacity and COP by up to 18% and 7%, respectively. For the case of
matched cooling capacity with the baseline larger COP improvements were achieved in FGB system. Two
main benefits of FGB approach were identified: 1) improved refrigerant distribution; 2) reduced refrigerant-
side pressure drop. To systematically explore FGB effects, parametric analysis based on an experimentally
validated evaporator model is performed with emphasis on pressure drop and heat transfer. Flow
maldistribution induced by header pressure drop is found to be an issue. Results reveal that the outlet header
pressure drop should be limited below approximately 30% of the entire evaporator pressure drop, to keep
capacity degradation within 3%.
The last part work presents the phenomenon of periodic reverse flow and associated boiling fluctuation
iii
found in experiments with a parallel microchannel evaporator. A simultaneous flow visualizations and
measurements reveal that synchronized oscillations of the evaporator inlet pressure and pressure drop are
related to this phenomenon. Three potential impacts of flow reversal on evaporator performance are
identified. Then, venting reversed vapor method is incorporated in existing FGB system. An experimental
comparison of the system with new approach to a FGB system revealed that the vapor venting provided a
5% increase of cooling capacity and 3% of COP when operated at identical test conditions, while the
maximum COP improvement was approximately 12% at matched capacities. In addition, the periodic reverse
vapor flow is characterized and quantified through this method. Both its average flow rate and oscillation
amplitude increase with average heat flux, while the oscillation period is reduced. Compared with total
refrigerant flow rate supplied to the evaporator, average reverse vapor flow is in the range 2% to 8% at the
conditions explored. Flow visualization within one of microchannels in the evaporator infers that the
microchannel repeats the transient flow patterns with two stages: liquid rewetting stage, and transient annular
evaporating/dewetting stage. The decrease in oscillation period with heat flux is mainly due to the shortened
time interval for the annular film evaporating/dewetting stage.

iv
To my wife Rong Shi

v
ACKNOWLEDGEMENTS
First, I would like to thank my wife Rong Shi for her constant support and
encouragement throughout my doctoral studies. Without her sacrifices and love, this
dissertation would not have been possible.
I would like to express my great gratitude to my advisor Professor Predrag S. Hrnjak
for his guidance and tremendous support throughout my doctoral studies. His trust and
encouragement makes my doctoral work possible and productive; his energy and
enthusiasm to the science and work set me an excellent example about what a great scientist
should look like, and this has been and will continue to influence me along with my lifetime.
I would like to express my many thanks to the members of my dissertation committee,
Professor Clark W. Bullard, Professor Anthony Jacobi, Professor Yuanhui Zhang, and
Professor José M. Corberán for their insightful comments and suggestions.
I am also greatly thankful for the support provided by the Air Conditioning and
Refrigeration Center (ACRC) at the University of Illinois at Urbana-Champaign and many
industrial sponsors.
The research work in this dissertation would be achieved without the great help from
many former and current members of the Professor Hrnjak research group and many other
colleagues at graduate schools. Thanks, Stefan Elbel, Chad Bowers, Scott Wujek, Steffen
Peuker, Augusto Zimmermann, Gustavo Pottker, Allen Milosevic, Yang Zou, Huize Li.
They gave my valuable assistance in many ways.
Finally, I would like to express my thanks to my family and many other friends I met
at the University of Illinois at Urbana-Champaign.

vi
TABLE OF CONTENTS
List of Figures…………………………………………………………………………………………………………………………….ix
List of Tables…………………………………………………………………………………………………………………………....xv
Nomenclature……………………………………………………………………………………………………………………………xvi
Chapter 1 Introduction ................................................................................................................. 1
1.1 Background ..................................................................................................................... 1
1.2 Structure of the dissertation ............................................................................................. 3
Chapter 2 Literature review ......................................................................................................... 5
2.1 Maldistribution in microchannel evaporator ................................................................... 5
2.1.1 Unequal quality at each tube inlet ........................................................................... 5
2.1.2 Header-induced flow maldistribution ...................................................................... 8
2.1.3 Periodic reverse flow in microchannels ................................................................. 11
2.2 Potential options to uniformize refrigerant distribution ................................................ 13
2.2.1 Conventional method to improve quality uniformity ............................................ 13
2.2.2 Flash gas bypass approach ..................................................................................... 16
2.3 Vapor-liquid refrigerant separation in T-junction ......................................................... 17
2.3.1 Classification of T-junctions ................................................................................. 18
2.3.2 Vapor-liquid flow in T-junctions in open literature .............................................. 20
2.4 Periodic reverse flow and boiling fluctuations .............................................................. 23
Chapter 3 Vapor-liquid refrigerant separation in a vertical impact T-junction separator .......... 32
3.1 Introduction ................................................................................................................... 32
3.2 Experiment setup and measurements ............................................................................ 33
3.2.1 Facility ................................................................................................................... 33
3.2.2 Uncertainty analysis .............................................................................................. 36
3.3 Results of baseline T-junction separators ...................................................................... 37
3.3.1 Theoretical analysis of particle separation ............................................................ 37
3.3.2 Flow pattern at the inlet of the T-junction ............................................................. 40
3.3.3 Effect of the separation load .................................................................................. 45
3.3.4 Mist flow to churn flow transition ......................................................................... 48
3.3.5 Correlation for mist to churn flow transition in vertical impact T-junctions ......... 50
3.3.6 Bubble separation region at the downward branch tube in the T-junction ............ 52
3.4 Design options to enhance vapor-liquid separation ....................................................... 55
3.4.1 Overview of flow patterns in T-separators ............................................................ 55
3.4.2 Effect of angle of inclination of inlet tube ............................................................. 58
vii
3.4.3 Effect of pre-separation ......................................................................................... 59
3.4.4 Effect of the diameter ratio (Di/Do) ....................................................................... 61
3.4.5 Effect of the shape of inlet tube ............................................................................. 63
3.4.6 Effect of the inlet tube locations: centered vs. tangential ...................................... 65
3.5 Summary and conclusions ............................................................................................. 66
Chapter 4 Effect of flash gas bypass approach on R134a A/C system with a microchannel evaporator… .................................................................................................................................. 69
4.1 Introduction ................................................................................................................... 69
4.2 Experimental apparatus and methods ............................................................................ 70
4.2.1 Experimental facility ............................................................................................. 70
4.2.2 Data reduction and uncertainty analysis ................................................................ 75
4.3 Experiment results ......................................................................................................... 78
4.3.1 Charge determination test ...................................................................................... 78
4.3.2 System performance at the fixed compressor speed .............................................. 79
4.3.3 FGB first benefit: improved refrigerant distribution ............................................. 82
4.3.4 FGB second benefit: reduced evaporator pressure drop ........................................ 85
4.3.5 Maximum COP enhancement at the matched cooling capacity ............................ 86
4.4 FGB effects on the performances of microchannel evaporators ................................... 89
4.4.1 Refrigerant side heat transfer coefficient ............................................................... 89
4.4.2 Refrigerant side pressure drop ............................................................................... 91
4.5 Summary and conclusions ............................................................................................. 93
Chapter 5 Header pressure drop induced flow maldistribution in parallel flow microchannel evaporators... ................................................................................................................................. 94
5.1 Introduction ................................................................................................................... 94
5.2 Microchannel evaporator model .................................................................................... 95
5.2.1 Model description .................................................................................................. 95
5.2.2 Experimental facility ............................................................................................. 97
5.2.3 Model validation .................................................................................................... 98
5.3 Results and discussions ............................................................................................... 100
5.3.1 Distribution profile in the microchannel evaporator ........................................... 100
5.3.2 Explore options to improve flow distribution ...................................................... 101
5.4 Experimental validation ............................................................................................... 108
5.5 Summary and conclusions ........................................................................................... 110
Chapter 6 Periodic reverse flow and boiling fluctuations in microchannel evaporators .......... 111
6.1 Introduction ................................................................................................................. 111

viii
6.2 Experimental facility ................................................................................................... 112
6.3 Experimental results .................................................................................................... 115
6.3.1 Flow regime and boiling fluctuations in DX cycle .............................................. 115
6.3.2 Flow regime and boiling fluctuations in FGB cycle ............................................ 120
6.3.3 Effect of heat flux on periodic reverse vapor flow .............................................. 126
6.3.4 Impacts of reverse flow on evaporator performances.......................................... 130
6.4 Revised flash gas bypass method ................................................................................ 132
6.4.1 Overall system performance comparison ............................................................ 132
6.4.2 Improved refrigerant distribution ........................................................................ 136
6.4.3 Reduced evaporator pressure drop ...................................................................... 138
6.4.4 Temperature and pressure oscillations ................................................................ 139
6.4.5 Characteristics of the periodic reverse vapor flow .............................................. 141
6.5 Summary and conclusions ........................................................................................... 147
Chapter 7 Visualization and measurement of periodic reverse flow and boiling fluctuations . 149
7.1 Introduction ................................................................................................................. 149
7.2 experiment setup and measurements ........................................................................... 150
7.2.1 Facility ................................................................................................................. 150
7.2.2 Flow visualization in microchannels ................................................................... 151
7.2.3 Determination of the electric heating power ....................................................... 154
7.3 Results ......................................................................................................................... 156
7.3.1 Transient flow patterns in each visualization section .......................................... 156
7.3.2 Flow pattern at the entry section (S-1) ................................................................ 156
7.3.3 Flow patterns in the middle section (S-2, S-3, S-4) ............................................. 161
7.3.4 Transient flow visualization at the inlet header ................................................... 165
7.4 Discussion ................................................................................................................... 169
7.4.1 Transient flow patterns in the entire channel ....................................................... 169
7.4.2 Effects of ambient conditions on the reverse flow dynamics .............................. 171
7.5 Summary and conclusions ........................................................................................... 173
References ................................................................................................................................... 175
Publications generated in this study ............................................................................................ 184
ix
LIST OF FIGURES
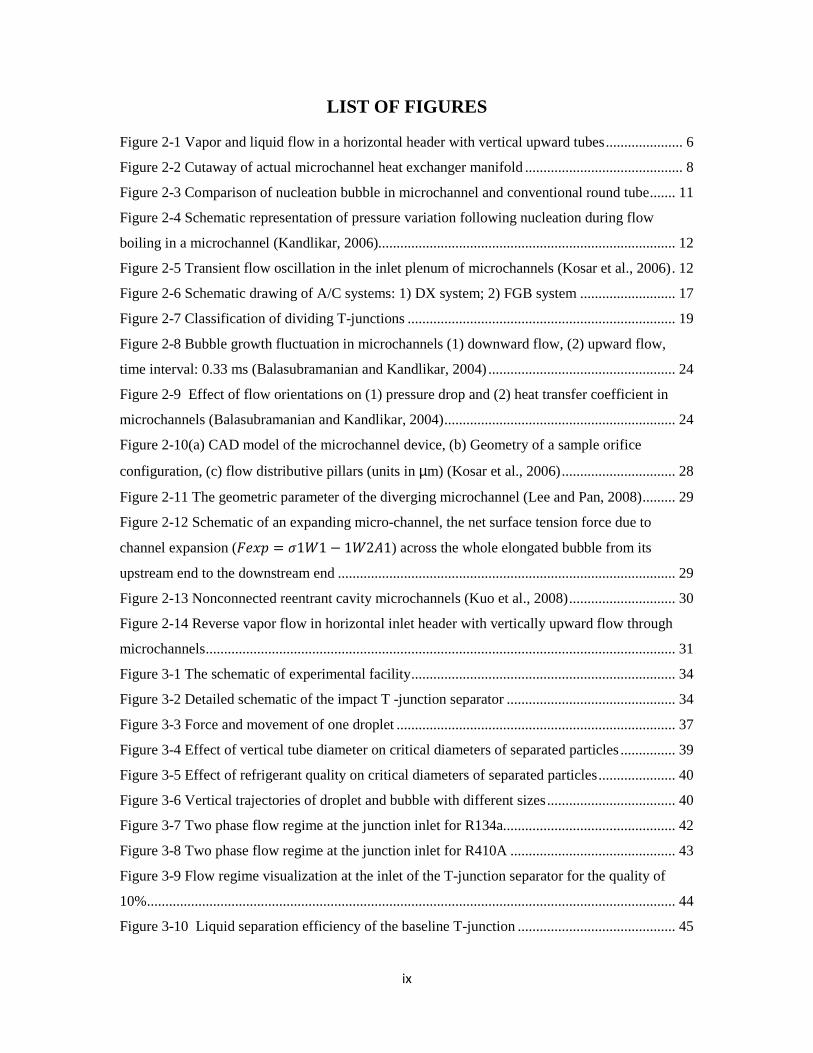
Figure 2-1 Vapor and liquid flow in a horizontal header with vertical upward tubes ..................... 6
Figure 2-2 Cutaway of actual microchannel heat exchanger manifold ........................................... 8
Figure 2-3 Comparison of nucleation bubble in microchannel and conventional round tube ....... 11
Figure 2-4 Schematic representation of pressure variation following nucleation during flow
boiling in a microchannel (Kandlikar, 2006)................................................................................. 12
Figure 2-5 Transient flow oscillation in the inlet plenum of microchannels (Kosar et al., 2006) . 12
Figure 2-6 Schematic drawing of A/C systems: 1) DX system; 2) FGB system .......................... 17
Figure 2-7 Classification of dividing T-junctions ......................................................................... 19
Figure 2-8 Bubble growth fluctuation in microchannels (1) downward flow, (2) upward flow,
time interval: 0.33 ms (Balasubramanian and Kandlikar, 2004) ................................................... 24
Figure 2-9 Effect of flow orientations on (1) pressure drop and (2) heat transfer coefficient in
microchannels (Balasubramanian and Kandlikar, 2004) ............................................................... 24
Figure 2-10(a) CAD model of the microchannel device, (b) Geometry of a sample orifice
configuration, (c) flow distributive pillars (units in µm) (Kosar et al., 2006) ............................... 28
Figure 2-11 The geometric parameter of the diverging microchannel (Lee and Pan, 2008) ......... 29
Figure 2-12 Schematic of an expanding micro-channel, the net surface tension force due to
channel expansion (���� = �1�1 − 1�2�1) across the whole elongated bubble from its
upstream end to the downstream end ............................................................................................ 29
Figure 2-13 Nonconnected reentrant cavity microchannels (Kuo et al., 2008) ............................. 30
Figure 2-14 Reverse vapor flow in horizontal inlet header with vertically upward flow through
microchannels ................................................................................................................................ 31
Figure 3-1 The schematic of experimental facility ........................................................................ 34
Figure 3-2 Detailed schematic of the impact T -junction separator .............................................. 34
Figure 3-3 Force and movement of one droplet ............................................................................ 37
Figure 3-4 Effect of vertical tube diameter on critical diameters of separated particles ............... 39
Figure 3-5 Effect of refrigerant quality on critical diameters of separated particles ..................... 40
Figure 3-6 Vertical trajectories of droplet and bubble with different sizes ................................... 40
Figure 3-7 Two phase flow regime at the junction inlet for R134a............................................... 42
Figure 3-8 Two phase flow regime at the junction inlet for R410A ............................................. 43
Figure 3-9 Flow regime visualization at the inlet of the T-junction separator for the quality of
10% ................................................................................................................................................ 44
Figure 3-10 Liquid separation efficiency of the baseline T-junction ........................................... 45

x
Figure 3-11 Flow separation regime at fixed inlet quality 15% and varied mass flow rates for
R134a............................................................................................................................................. 45
Figure 3-12 Comparison of flow regimes at �= 30 g/s, xin = 19% and �= 20 g/s, xin = 25.5%
....................................................................................................................................................... 48
Figure 3-13 Mist to churn flow transition boundaries for T-junctions with Di =8.7 mm Do = 18.3
mm ................................................................................................................................................. 49
Figure 3-14 Liquid separation efficiency at mist and churn flow patterns .................................... 50
Figure 3-15 Proposed correlations of churn flow transition for vertical impact T-junctions ........ 52
Figure 3-16 Bubble penetration depth as a function of the inlet mass flow rate and quality ........ 54
Figure 3-17 Bubble penetration region at the same inlet quality 20% but different mass flow rates
(darker bubble-liquid mixing region indicating denser bubbles) .................................................. 54
Figure 3-18 Bubble penetration region at various inlet qualities but the same mass flow rate 25 g/s
....................................................................................................................................................... 55
Figure 3-19 Overview of flow patterns in a vertical impact T-junction ........................................ 56
Figure 3-20 Effect of inlet angle of inclination on liquid separation efficiency, 30 g/s ................ 58
Figure 3-21 Flow separation at varied angles of inclination for �= 30 g/s and xin =15%......... 58
Figure 3-22 Illustration of pre-separation at the first junction ...................................................... 59
Figure 3-23 Effect of pre-separation on liquid separation efficiency ............................................ 60
Figure 3-24 Comparison of flow patterns at main junctions with and without pre-separation
for�= 35 g/s and xin =15% ........................................................................................................ 61
Figure 3-25 Effect of diameter ratio on the liquid separation efficiency ...................................... 62
Figure 3-26 Comparison of the flow pattern in T-junctions with different diameter ratios at the
inlet condition of 35 g/s, and 15% ................................................................................................. 62
Figure 3-27 Illustration of the liquid blockage on the flow area for the upward vapor flow ........ 63
Figure 3-28 Effect of cross section shape of the inlet tube on the liquid separation efficiency .... 64
Figure 3-29 Flow pattern at the T-junction with different inlet tube shapes at condition of 35 g/s
and 20% ......................................................................................................................................... 64
Figure 3-30 Effect of inlet location on the liquid separation efficiency ........................................ 66
Figure 3-31 Flow pattern at the T-junction with different inlet locations at 35 g/s and 20% ........ 66
Figure 4-1 Schematic drawing of the A/C system test facility ...................................................... 71
Figure 4-2 Photograph of the experimental facility ....................................................................... 71
Figure 4-3 Fin/tube cross section view of single slab and pass microchannel evaporator ............ 72
Figure 4-4 Electronic expansion valve and swash-plate compressor used in this study ............... 73
Figure 4-5 Microchannel condenser used in this study ................................................................. 73

xi
Figure 4-6 Detailed layout of evaporator section with flash gas bypass approach........................ 74
Figure 4-7 Infrared camera used to measure evaporator surface temperature ............................... 75
Figure 4-8 Air and refrigerant side cooling capacities .................................................................. 77
Figure 4-9Determination of the optimal refrigerant charge (a) DX mode; (b) FGB mode ........... 79
Figure 4-10 Cooling capacity and COP in FGB and DX modes at the same compressor speed .. 80
Figure 4-11 Refrigeration cycles in FGB and DX modes at the same compressor inlet superheat
of 15 ºC and a fixed compressor speed .......................................................................................... 81
Figure 4-12 Suction pressure elevation and the evaporator pressure drop reduction at various
compressor inlet superheats ........................................................................................................... 81
Figure 4-13 Comparison of measured evaporator surface temperatures in DX and FGB modes at
the same compressor speed ........................................................................................................... 83
Figure 4-14 Comparison of distribution rating parameter φin DX and FGB modes at the same
compressor speed .......................................................................................................................... 84
Figure 4-15 Evaporator pressure drop in FGB and DX modes at the same compressor speed ..... 86
Figure 4-16 Maximum COP improvement at the matched cooling capacity ................................ 87
Figure 4-17 Refrigeration cycles in FGB and DX modes for a compressor inlet superheat of 15ºC
and at the matched capacity ........................................................................................................... 88
Figure 4-18 Refrigerant mass flow rate and refrigerant-side pressure drop across the evaporator
for FGB and DX models at the same capacity .............................................................................. 89
Figure 4-19 Reduction of refrigerant side heat transfer coefficient (FGB vs. DX)as a function of
refrigerant mass flux and quality ................................................................................................... 91
Figure 4-20 Reduction of overall evaporator UA value (FGB vs. DX)as a function of refrigerant
mass flux and quality ..................................................................................................................... 91
Figure 4-21 Refrigerant-side pressure drop reduction (FGB vs. DX) as a function of mass flux
and quality ..................................................................................................................................... 92
Figure 5-1 Schematic drawing of flow paths in microchannel evaporator .................................... 95
Figure 5-2 Configurations of evaporator inlet/outlet and ∆P measurement in FGB mode ........... 98
Figure 5-3 Comparison of predicted and experimental cooling capacity of the microchannel
evaporator ...................................................................................................................................... 99
Figure 5-4 Comparison of predicted and measured evaporator pressure drops (∆Pevap – overall
pressure drop across the evaporator; ∆Pohd –pressure drop along the outlet header) .................... 99
Figure 5-5 Comparison of predicted and measured evaporator surface temperatures ................ 100
Figure 5-6 Detailed distribution profile among parallel microchannel tubes .............................. 101

xii
Figure 5-7 Liquid distribution among parallel channels as a function of outlet header diameter Dhd
..................................................................................................................................................... 103
Figure 5-8 Variation of normalized cooling capacity and pressure drop ratio with outlet header
diameter ....................................................................................................................................... 104
Figure 5-9 Evaporator surface temperature profiles at different outlet header diameters ........... 104
Figure 5-10 Liquid flow rate distribution as a function of microchannel diameter Dh ............... 106
Figure 5-11Variation of normalized cooling capacity and pressure drop ratio with microchannel
size ............................................................................................................................................... 106
Figure 5-12 Illustration of pressure drop effect on evaporator performance ............................... 107
Figure 5-13 Evaporator surface temperature profiles at a fixed bulk exit superheat of 5 °C ...... 107
Figure 5-14 Effect of the evaporator aspect ratio on the cooling capacity and the pressure drop
ratio .............................................................................................................................................. 108
Figure 5-15 Comparison of surface temperature profiles of two different microchannel
evaporators .................................................................................................................................. 109
Figure 6-1 The detailed layout of the evaporator section ............................................................ 114
Figure 6-2 Flow regime at the inlet header in DX cycle at 35ºC/35 ºC condition ...................... 117
Figure 6-3 Temporal variation of the evaporator pressure drop and inlet/outlet pressures in DX
cycle at 35ºC/35 ºC condition ...................................................................................................... 119
Figure 6-4 Flow regime at the inlet header in FGB cycle at 35ºC/35 ºC condition .................... 120
Figure 6-5 Periodic oscillation of vapor-liquid interface and reverse vapor flow (zone 3) ......... 121
Figure 6-6 Variation of evaporator inlet/outlet pressures and pressure drops in FGB cycle at
35ºC/35 ºC condition ................................................................................................................... 123
Figure 6-7 Evolution of the inlet pressure and synchronized flow regime at the inlet header .... 125
Figure 6-8 Schematic illustration of temporal evolution of periodic reverse flow ...................... 126
Figure 6-9 Pressure drop amplitude spectrum under different air inlet conditions ..................... 129
Figure 6-10 Variation of the dominant oscillation frequency as a function of average heat flux 129
Figure 6-11 Illustration of temporal liquid maldistribution due to oscillating liquid interface in
FGB cycle .................................................................................................................................... 132
Figure 6-12 Comparison of A/C system performances in three operating cycles at the fixed
compressor speed ........................................................................................................................ 134
Figure 6-13 Maximum COP improvement when matching the cooling capacity ....................... 135
Figure 6-14 Comparison of the three cycles in p-h diagram ....................................................... 135
Figure 6-15 Evaporator surface temperature profiles in three cycles under 27/27 °C condition 137
Figure 6-16 Comparison of the flow regime at the inlet header in FGB and FGBR cycles ........ 137

xiii
Figure 6-17 Evaporator pressure drops in three operating cycles ............................................... 138
Figure 6-18 Temporal oscillations of evaporator surface temperatures of microchannel tube ... 139
Figure 6-19 Comparison of inlet pressure oscillations in FGB and FGBR cycles as a function of
average heat flux ......................................................................................................................... 141
Figure 6-20 Temporal oscillations of measured pressures and vented vapor flow rate at
35°C/35°C condition ................................................................................................................... 142
Figure 6-21 Relationship between average heat flux and mass flux at the microchannel tubes . 144
Figure 6-22 Variations of average vented vapor flow rate and its oscillation amplitude with
average wall heat flux .................................................................................................................. 145
Figure 6-23 Ratio of the vented vapor flow rate to total inlet flow rate ...................................... 146
Figure 6-24 Oscillation period of the vented reverse vapor flow rate ......................................... 146
Figure 7-1 Detailed setup of the evaporator test section ............................................................. 150
Figure 7-2 Transparent glass tube for flow pattern visualization ................................................ 152
Figure 7-3 Frequency and amplitude spectrums of evaporator pressure drops corresponding to
synchronized flow visualizations at different sections at 35/35 °C conditions ........................... 153
Figure 7-4 Repeatability of measured evaporator pressure drops and oscillation amplitudes
corresponding .............................................................................................................................. 154
Figure 7-5 Infrared images of the aluminum microchannel evaporators and the glass tube ....... 155
Figure 7-6 Temporal variations of ∆Pevap corresponding to synchronized flow pattern in S-1 ... 158
Figure 7-7 Transient flow patterns during one oscillation cycle at section S-1 .......................... 158
Figure 7-8 Bubble dynamics in the reverse flow ......................................................................... 161
Figure 7-9 Temporal variations of pressure drop corresponding to synchronized flow pattern in S-
2 ................................................................................................................................................... 162
Figure 7-10 Transient flow patterns during one oscillation cycle in S-2 .................................... 163
Figure 7-11 Temporal variations of evaporator pressure drop corresponding to synchronized flow
pattern in section S-3 ................................................................................................................... 163
Figure 7-12 Transient flow patterns during one oscillation cycle in S-3 .................................... 164
Figure 7-13 Temporal variations of pressure drop corresponding to synchronized flow pattern in
S-4 ............................................................................................................................................... 164
Figure 7-14 Transient flow patterns during one oscillation cycle in S-4 .................................... 165
Figure 7-15 Temporal oscillation of the evaporator pressure drop corresponding to the
synchronized visualization of the reverse flow near the tube entry ............................................. 167
Figure 7-16 Transient flow pattern at the entry of the transparent tube (red arrow denotes flow
direction) ..................................................................................................................................... 168

xiv
Figure 7-17 Schematic microchannel frame sequence of the periodic reverse flow and transitional
flow patterns. ............................................................................................................................... 171
Figure 7-18 Average oscillation period τp,avg as a function of average heat flux qavg on the
microchannel evaporator ............................................................................................................. 172
Figure 7-19 Time period for each transient stage in one complete oscillation cycle (τ1 and τ2 being
respectively liquid refilling stage and annular/dewetting stage) ................................................. 173

xv
LIST OF TABLES
Table 2-1 Summary of previous works on two-phase flow in T-junctions ................................... 21
Table 2-2 Summary of previous works on reverse flow and boiling fluctuations ......................... 25
Table 2-3 Summary of methods explored to suppress boiling oscillations in microchannels ....... 26
Table 3-1 Operating cycle configurations with different valve setups .......................................... 36
Table 4-1 Microchannel evaporator geometry .............................................................................. 72
Table 4-2 Infrared camera specification ........................................................................................ 75
Table 4-3 Operating conditions ..................................................................................................... 75
Table 4-4Measured uncertainties .................................................................................................. 77
Table 5-1 Geometric parameters of #1 (baseline) and #2 (new) microchannel evaporator ........ 109
Table 6-1 Operating cycle configurations with different valve setups ........................................ 114
Table 6-2 Operating conditions ................................................................................................... 115

xvi
NOMENCLATURE
As heat transfer area (m2)
Ac cross sectional area (m2)
A∆P pressure drop fluctuation amplitude (kPa)
COP coefficient of performance (-)
D tube diameter (mm)
Dh microchannel size (mm)
Dhd header diameter (mm)
∆hfg latent heat of vaporization (kJ·kg-1)
Δ�� ���,��� oscillation amplitude of reversed vapor flow (g·s-1)
∆P pressure drop (kPa)
f frequency (Hz)
F frame rate (frame·s-1)
Fc compressor torque (N·m)
Fr Froude number (-)
h specific enthalpy (kJ·kg-1)
hc heat transfer coefficient (W·m-2·°C-1)
g gravity acceleration (m·s-2)
G mass flux (kg·m-2·s-1)
k pressure loss coefficient (-)
Lt total tube length (m)
�� mass flow rate (g·s-1)
p Image pixel (pixel)

xvii
P pressure (kPa)
q heat flux (kW·m-2)
Q cooling capacity (kW)
t time (s)
T temperature (ºC)
U velocity (m·s-1)
VC compressor speed (rpm)
WC compressor power (kW)
x refrigerant quality (-)
Xtt Lockhart-Martinelli parameter (-)
Greek
α, β,γ spatial orientation angle of T-junction (º)
η separation efficiency (-)
θ inclination angle of inlet tube of T-junction (º)
µ dynamic viscosity (Pa·s)
ρ Refrigerant density (kg·m-3)
τ oscillation period (s)
τ1 liquid rewetting period (s)
τ 2 transient film evaporating/dewetting period (s)
φ distribution rating parameter (-)
Subscripts
air/a indoor air side
avg average

xviii
b bottom outlet of T-junction
con flow contraction
DX direct expansion mode
e/evap microchannel evaporator
ero evaporator exit
exp flow expansion
FGB flash gas bypass mode
FGBR revised flash gas bypass mode
HX heat exchanger
ihd inlet header of microchannel evaporator
in/i inlet
liq/l liquid phase
mat matched capacity
ohd outlet header of microchannel evaporator
out/o outlet
ref refrigerant side
sup,Cp superheat at compressor inlet
t top outlet of T-junction
tot total
vap/v vapor phase
vav bypass valve

1
Chapter 1 INTRODUCTION
1.1 BACKGROUND
Compact cross-flow heat exchangers with flat multi-port microchannel tubes and
folded louvered fins are widely used in a variety of applications, particularly in evaporators
for automotive air conditioning systems and recently in residential and other applications.
Compared to conventional round tube plain-fin heat exchangers, the advantage of
microchannel heat exchangers (MCHXs) can be summarized as follows:
• Higher overall heat transfer coefficient with improved thermal hydraulic
performance
• Lower refrigerant inventory due to reduced internal volume of the microchannel
tubes in the heat exchangers
• More compactness (high ratio of the effective heat transfer area over the coil
volume)
• Lower cost and weight due to lesser amount of aluminum alloy used for heat
exchanger
In generally, microchannel heat exchangers have multiple microchannel tubes in
parallel connected by two manifolds, in order to keep the pressure drop across the heat
exchanger within a reasonable range and to maximize the overall heat exchanger
performance. This parallel flow structure causes the difficulty of feeding the same quantity

2
of refrigerant flow into each microchannel tube. This problem is especially serious for the
use of evaporators where the refrigerant at the inlet is two-phase at certain quality which
depends upon the operating conditions. Non-uniform distribution (maldistribution) will
cause dry out at the tubes receiving lesser liquid mass flow rate and/or higher vapor inlet
quality by superheating the refrigerant vapors due to smaller enthalpy change for cooling
effect. This can result in poor utilization of the heat transfer area since compared to two
phase region, the superheating area has 1) much lower single phase refrigerant heat transfer
coefficient; 2) smaller refrigerant-air side heat transfer temperature difference.
The direct consequence is the evaporator cooling capacity will be decreased, or very
often, system operation will reduce the evaporating temperature to enlarge the temperature
different and to compensate the poor utilization of the heat transfer area. Thus, compressor
power consumption will increase. Both ways will degrade A/C system COP. In heat pump
application, the reduction of the evaporating temperature may cause uneven frost growth
on the air-side louver fins, since the fin temperature in the two phase region is much lower
than that in the superheated region. Moreover, there is a possibility that the compressor
may be flooded by liquid refrigerant which is not fully evaporated in the evaporator, and
this occurrence is highly undesirable from the concern of the compressor reliability.
In a direct expansion A/C system, a good distribution is certainly that the refrigerant be
distributed according to the head load on each branch or pass in order to achieve a uniform
vapor quality at the outlet header and to realize efficient utilization of the heat transfer
surface area. In past decades, many scholars performed extensive study to gain in-depth
understanding of refrigerant flow distribution and thus attempted to propose solutions to
this problem. However, no generic method exists to serve as a design tool to predict the

3
two-phase flow distribution at given header-tube structures and flow conditions. This
limited knowledge is partially because of the complexities of two-phase flow behavior and
the many interdependent variables that influence such a flow. Naturally, the proposed
solutions based on this limited understanding beg further study and verification.
The scientific merit of this research is a fundamental understanding of flash gas bypass
method to improve the refrigerant distribution in parallel flow microchannel evaporators
and related heat transfer and flow dynamics in the inlet header and microchannel tubes.
Three typical causes responsible for refrigerant maldistribution and their impact on
evaporator performances are investigated both experimentally and numerically. Another
goal of this thesis are to characterize periodic reverse flow in microchannel evaporators.
1.2 STRUCTURE OF THE DISSERTATION
In addition to the introductory chapter, this dissertation is organized in 6 chapters.
Chapter 2 presents a literature review about previous work carried out in refrigerant
maldistribution and solutions for improvement, two-phase flow division and separation in
T-junctions, reverse flow and boiling fluctuations. Chapter 3 presents experimental study
of liquid vapor refrigerant separation in a vertical impact T-junction separators. Chapter 4
presents experimental and numerical investigation of flash gas bypass method on an R134a
air-conditioning system using a microchannel evaporator, and further FGB method on
evaporator thermal hydraulic performance is analyzed. In Chapter 5, effect of header
pressure drop on the flow maldistribution in parallel flow microchannel evaporators is
investigated based on an experimentally validated model. A further parametric analysis is
performed to generalize a design criterion to limit the header pressure drop on the

4
evaporator performance. Chapter 6 characterizes the periodic reverse flow and associated
boiling fluctuations in microchannel evaporators and identifies the three major impacts on
the evaporator performance. Then, a revised flash gas bypass method with venting the
reversed vapor flow is proposed. Chapter 7 presents a simultaneous visualization and
measurement of periodic reverse flow in microchannel evaporators. Transient flow pattern
alternation along one microchannel is characterized.

5
Chapter 2 LITERATURE REVIEW
This chapter presents a state-of-the-art review of the most relevant literature related to
the topics of this dissertation. The literature review includes four sections: 1) refrigerant
maldistribution in microchannel heat exchanger; 2) Potential options to improve refrigerant
distribution; 3) separation of two-phase flow after expansion; and 4) reverse vapor flow
and boiling fluctuations.
2.1 MALDISTRIBUTION IN MICROCHANNEL EVAPORATOR
2.1.1 UNEQUAL QUALITY AT EACH TUBE INLET
The unequal quality of two-phase refrigerant entering each tube will cause dry out at
the sections of lesser liquid mass flow rate by superheating the refrigerant vapors due to
the smaller enthalpy change for the cooling effect. The quality maldistribution is mainly
due to the inherent nonhomogeneousity of vapor and liquid flow in the dividing manifold.
Vapor and liquid refrigerant have different densities and therefor inertia force in two phase
flow such that their tendencies to branch out of the header into parallel tubes differs from
each other. In addition, gravitational force intends to separate liquid and vapor phase,
resulting in non-homogenous flow regime in the header. For instance, in a horizontal
header with vertical upward branch tubes, as shown in Figure 2-1, vapor phase with a
lighter density and lower inertia flows predominantly through the branch tubes near the
inlet, while liquid flows through the branch tubes near the downstream header. The
6
stratified flow regime with vapor and liquid refrigerant present on the upper and lower
portion of the header further causes the quality maldistribution.
Figure 2-1 Vapor and liquid flow in a horizontal header with vertical upward tubes
Two-phase flow distribution in a header-parallel tube structure has been extensively
studied by many scholars in the past decades.
Peng et al. (2002) experimentally investigated two phase R134a refrigerant distribution
in a horizontal dividing header with five vertical downward branch tubes. For the first time,
two-phase flow regimes in the header were visualized and mapped as a function of inlet
refrigerant mass flux and quality. A preliminary attempt was made to find a relationship
between the flow regime and two-phase distribution in the dividing header, but was not
very successful due to the complex nature of the topic investigated.
Bowers et al. (2006) reported distribution results in two shapes (rectangular and circular)
of dividing headers with parallel microchannel tubes. It was found that the shorter inlet
length provides the most consistently uniform distribution with an optimum protrusion
depth near one half. Flow visualization results suggested that the liquid phase of the
refrigerant will be more uniformly distributed when the flow is not separated and in a
homogenous type regime.
Cho and Cho (2004) studied mass flow rate distribution and vapor-liquid phase
separation of R-22 in multi-microchannel tubes under adiabatic condition. Among the test
parameters, the orientation of the dividing header was found to have the most significant

7
effect on the flow distribution and horizontal header showed better distribution
characteristics than the vertical header. However, this conclusion may be only valid at the
experiment conditions explored in their work and this particular observation begs further
study of the orientation effects.
Vist and Pettersen (2004) reported two-phase distribution of R134a refrigerant in a
horizontal circular header for both upward and downward orientations of the circular
branch tubes. Little influence on the distribution results was observed when changing the
total mass flux, or the head load on the evaporator section compared to the inlet quality.
Hwang et al. (2007) studied R410A refrigerant distribution in a horizontal header with
total 30 parallel microchannel tubes upward orientated. Their results indicated that liquid
distribution was strongly affected by the header inlet location and for the side-inlet location
the distribution appeared to be consistently better than that for the end-inlet location in the
range of operating conditions investigated. The effect of the tube pitch seemed to be
insignificant.
Yang and Hrnjak (2010) for the first time reported and visualized R410A refrigerant
distribution in a vertical intermediate header with feeding refrigerant flow upward. The
major application was for a microchannel heat exchanger with a two-pass design used in
residential A/C systems operating in the reverse heat pump mode. The refrigerant quality
investigated was up to 0.95. It showed that liquid distribution was in a strong function of
total mass flux, inlet quality and the flow regimes.
Kim et al. (2012) investigated R134a refrigerant distribution in a round header-ten flat
tube downward flow configuration. They found that at low mass flux or quality vertical

8
inlet gave the best flow distribution, followed by normal and then parallel inlet. As mass
flux or quality increases, the optimum configuration became to normal inlet configuration.
Overall, two-phase refrigerant maldistribution due to the uneven quality at tube inlets
is very complicated and to date there is no generic method or empirical correlations to
predict the distribution of the two-phase mixtures. In fact, many variables act together: 1)
geometric factors (manifold orientation, manifold inner diameter, tube protrusion, location
and direction of the evaporator inlet, etc. 2) operating conditions, such as refrigerant mass
flux and quality in the manifold, evaporating temperature, etc.
2.1.2 HEADER-INDUCED FLOW MALDISTRIBUTION
In microchannel heat exchangers, hundreds of parallel ports are typically fed from a
cylindrical header as shown in Figure 2-2. This will inevitably bring about additional
pressure drops, including friction, pressure gain/loss related with deceleration/acceleration
flow, local pressure loss due to the protrusion of tubes inward the header. Consequently,
the driving pressure differential experienced by the all branch tubes will not be the same
and may be significantly different from each other in certain cases, which in turn will
causes maldistributed refrigerant mass flow rate.
Figure 2-2 Cutaway of actual microchannel heat exchanger manifold
9
In past works, effects of header pressure drop on the flow distribution were extensively
studied for single-phase flow but major applications were limited in microchannel heat sink
and thermal solar collector, and the fluid investigated is water for most cases. Two critical
effects need to be emphasized in the header effect study: inertia and friction. As to inertia,
Bernoulli principle indicates that the pressure gain corresponds to a deceleration of fluid
along the length of the dividing header due to the outlet flow in the previous branches. On
the other hand, combining headers experience the pressure reduction as multiple streams
from branches converge and consequently main stream accelerates along the combining
header. In regard to friction, it leads to the pressure drop along the longitudinal direction
of both headers.
Choi et al. (1993) found that the geometry of a header especially area ratio (defined as
ratio of the total channel cross-sectional area to the dividing flow header cross-sectional
area) impact significantly the coolant distribution at a low Reynolds number flow. He also
pointed out that friction and momentum (inertia) both determined the pressure variations
in both dividing and combining headers. Later, Kim et al. (1995) studied 2-D steady state
laminar water flow in three kinds of headers (rectangular, triangular, and trapezoidal). It
was found that as Reynolds number increased the liquid distribution became worse because
of stronger inertia effect.
Wang and Yu (1989) studied dividing and combining headers for solar collectors. They
proposed a discrete mathematical model describing the single phase flow performance in
two flow arrangements (parallel and reverse). It was found that flow distribution was more
uniform in the reverse arrangement for the dividing header but worse for the combining
header due to the short circuit effect.

10
Ghani et al. (2011) numerically investigated the effect of header sizes, geometric shape
(aspect ratio), and operating characteristics (mass flow rate and flow direction in headers)
in order to vary flow uniformity within a hybrid photovoltaic/thermal solar collector. Their
simulation results recommended that: 1) a header to riser pipe ratio of 4:1 was ideal value;
2) parallel flow arrangement was generally preferred however reserve type may be
employed for pipe arrays with an aspect ratio greater than one.
Yin et al. (2002) for the first time systematically measured single-phase pressure drops
inside the complex headers and parallel circuits of a microchannel heat exchanger (CO2
gas cooler). Some typical local pressure drop coefficients such as port inlet contraction,
exit expansion and tube protrusion loss were determined based on conventional Idelchik’s
hydraulic equations (1994).
Kulkarni et al. (2003) for the first time quantified design tradeoffs associated with
refrigerant maldistribution caused by header pressure drops in microchannel evaporators
through a simulation model. Their focus was limited in the dividing header and generalized
that refrigerant mass flux should be high enough to avoid gravity-induced liquid-vapor
stratification and quality maldistribution, yet low enough to maintain near-uniform driving
pressure differentials seen by the parallel circuits. For the case of typical R410A
microchannel evaporator, the dividing header pressure gradient was recommended to be
limited to approximately 10% of the in-tube pressure drop, to keep heat exchanger capacity
degradation below 5%. However, their work ignored the outlet (combining) header effect
on flow maldistribution. It can be deduced that uniformity of the tube pressure drop is
mainly subjected to the outlet header which has a much higher pressure drop than the inlet
header. This is because: 1) greater tube-protrusion loss coefficient (Yin et al. 2002); 2)

11
refrigerant is vapor after evaporation, having lower density but much higher velocity than
refrigerant in the inlet header.
2.1.3 PERIODIC REVERSE FLOW IN MICROCHANNELS
Microchannel diameter used in A/C or refrigeration system evaporators is typically
around 1 mm or less. Bubble nucleation and following dynamic movement in channels is
quite different from that in an ordinary tube used in conventional tube-fin evaporators. In
microchannel, nucleation bubble can easily grow up to a size comparable to the channel
hydraulic diameter. Further bubble growth becomes confined by the channel, only
expanding in a longitudinal direction along the channel in a form of elongated bubble, as
shown in (Figure 2-3).
Figure 2-3 Comparison of nucleation bubble in microchannel and conventional round tube

12
Figure 2-4 Schematic representation of pressure variation following nucleation during flow
boiling in a microchannel (Kandlikar, 2006)
Figure 2-5 Transient flow oscillation in the inlet plenum of microchannels (Kosar et al., 2006)
Such rapid bubble nucleation as well as confined expansion may introduce a pressure
spike in the flow which may overcome the inertia of the incoming flow and the pressure in
the inlet header, which in turn cause trailing edge of the bubble expanding upstream, i.e. a
reverse flow (Figure 2-4). However, this phenomenon seldom occurs in a large
conventional tube, since the local high pressure generated by a single bubble is confined to
a small region of the channel and can hardly affect the global pressure distribution and the
bulk flow dynamics (Kuo and Peles, 2008). Kew and Cornwell (1997) proposed a
threshold of the bubble growth confinement based on the dimensionless number called
Confinement number Co (Eqn. 2-1), and set the threshold at Co = 0.5.

13
( ) 2L G h
Cog d
σρ ρ
=−
(2-1)
Meanwhile, inlet header serves as a buffer tank, providing significant compressible
volume upstream of the heated microchannel tubes. Such volume will temporally retain the
backflow vapor discharged from microchannels, as shown in Figure 2-5. When forward
flow is re-established, reverse vapor and liquid flow will be re-distributed among parallel
microchannels. Very likely, liquid flow distribution with the presence of reverse vapor
would be non-uniform (Qu and Mudawar, 2004; Balasubramanian and Kandlikar, 2005).
In addition, the dynamic boiling fluctuation will be sustained by interactions between tube
vapor generation and the upstream compressible volume (Bergles and Kandlikar, 2005).
Previous work related to this phenomenon will be summarized and discussed in a following
section.
2.2 POTENTIAL OPTIONS TO UNIFORMIZE REFRIGERANT
DISTRIBUTION
As refrigerant maldistribution is experienced to be one of the major issues for degrading
performance of microchannel evaporators and its wide application in air-condition and
refrigeration system, many efforts have been made to improve refrigerant distribution.
2.2.1 CONVENTIONAL METHOD TO IMPROVE QUALITY UNIFORMITY
Most attempts focus on improving two-phase or uneven quality maldistribution in the
dividing headers, since this type of maldistribution is complicated in natural, and may
significantly reduce evaporator performance.

14
Conventional methods have relied on structural modification of dividing headers by
adding baffles, distributors, or other geometry-specific remedies. The underlying
mechanism behind this idea is to create and maintain a homogenous two phase flow while
preventing separated flow regime induced by gravitational and inertial forces.
Peng and Hrnjak (2004) presented a novel method for improving the flow distribution
in dividing headers of evaporators by using plain orifice and pressure swirl as expansion
devices. A homogeneous mist or quasi-mist flow was created, through atomization, in the
form of fine liquid droplets well mixed in vapor flow. Typical range of the atomized droplet
size measured in their experiment was about 50 um~ 200um as a function of inlet mass
flow rate and quality. However, the plain orifice provided poorer distribution due to the
dominance of the front pooling effect; whereas the distribution results for the swirl
atomizer inlet indicate somewhat a positive sign of improvement. But they suggested
reducing the spray angle in swirl atomizers can further improve distribution because the
large spray angle may cause liquid re-circulation and front pooling effect.
Marchitto et al. (2008) followed the similar method by combined use of orifices at the
inlet of the multiple channels and nozzles at the distributor inlet, and improved water-air
two-phase distribution occurring in a cylindrical horizontal header supplying 16 vertical
channels for upward flow. Their results indicated that improved distribution was strongly
dependent on orifice diameter, presence and geometry of an inlet nozzle and the specified
range of gas and liquid inlet superficial velocities.
Shi et al. (2010) experimentally compared the performances of microchannel
evaporators with different manifold structures, i.e. 7 deflector designs in the inlet/outlet
manifold, and 5 flow hole arrangements in the return manifold. Among the eight sample

15
evaporators tested, the maximum difference of the cooling capacity operating under the
same condition was reported to be up to about 32%. Their results demonstrated the
importance of properly designed distribution device to achieve good distribution. On the
other hand, it may be difficult to generalize the design of the manifold structures in wider
operating conditions due to the limited test results and insufficient fundamental knowledge.
Dshida and Hrnjak (2008) investigated the effect of refrigerant maldistribution in a
multi-pass outdoor microchannel heat exchanger (MCHX) on the heating performance of
a residential mini-split type A/C and heat pump system. Results showed that refrigerant
maldistribution in the 4-pass MCHX tested caused up to about 25% COP reduction
compared to the same system using the baseline round tube plain fin heat exchanger. An
effort to improve refrigerant distribution was made such that the MCHX was modified into
a single-pass design and refrigerant flow was divided into eight smaller flows with a
conical distributor before entering the header. But it was not very successful and only 5%
COP improvement was obtained upon the worst case.
Although industrial companies have introduced and patented many different versions
of distributors, evidence of improved but not perfect distribution has not yet appeared in
the open literature due to the proprietary nature of the design details and data. Considering
the trial-and-error design procedure and a lack of in-depth understanding of two-phase flow
behavior in modified headers, good distribution may not be achieved by one specific
distribution device for a wide range of operating conditions.

16
2.2.2 FLASH GAS BYPASS APPROACH
Contrary to conventional methods which mixes vapor-liquid refrigerant in a
homogenous flow pattern, an alternative approach is to feed only liquid refrigerant into
microchannel evaporators, since vapor refrigerant has an insignificant contribution to
cooling effects and adversely causes liquid maldistribution among parallel tubes.
Based on this idea, Beaver et al. (1999) proposed a flash gas bypass (FGB) approach
and demonstrated superior performance over a conventional direct expansion (DX) R744
residential A/C system. Elbel and Hrnjak (2003) implemented FGB approach into
transcritical CO2 Environmental Control Unit (ECU) and adopted a step motor valve to
control the pressure drop of the bypass line and thus the liquid level in the flash gas tank.
Figure 2-6 compares schematic system configurations of typical DX and FGB systems.
FGB system is very similar to conventional liquid recirculation or overfeed refrigeration
systems but has totally different purpose as proposed here. The liquid overfeed or also
known as pump recirculation system designs intends to thoroughly wetted evaporator
surface and thus achieve optimum heat transfer performance. It is widely used in low
temperature multi-evaporator systems, more popular with ammonia refrigerant.
In this case, FGB approach is to separate and bypass flash vapor generated during the
expansion process by a flash gas separator and therefore feed the evaporator with only
liquid refrigerant. Beaver et al. (1999) reported up to 20% COP increment while
maintaining the same capacity over the baseline DX system. Elbel and Hrnjak (2004)
identified three major benefits of FGB approach in transcritical R744 A/C systems: 1)

17
reducing pressure drop across the microchannel evaporator; 2) increasing the local CO2
boiling heat transfer coefficient; 3) and improving the refrigerant distribution.
Figure 2-6 Schematic drawing of A/C systems: 1) DX system; 2) FGB system
2.3 VAPOR-LIQUID REFRIGERANT SEPARATION IN T-
JUNCTION
To make the concept of flash gas bypass (FGB) method even more attractive for
practical applications it essential to have a high efficient and compact flash gas separator
with objective to be eventually integrated in some other component such as evaporator.
Compact design would reduce the refrigerant inventory and spatial requirements, while the
high separation efficiency would assure the proper function of FGB system.
Typical separators used in A/C or refrigeration systems are either oil separators
(incorporated after the compressor discharge, on the high pressure side) or suction
accumulators (low pressure receivers, located just before the compressor). They are

18
characterized by lower liquid separation loads (typically up to 5% liquid by mass) as
opposed to flash gas separators, which have much higher liquid loads (typically 75 – 90%
liquid bypass). In addition, the system performance is extremely sensitive to pressure drop
in suction accumulators, lees in oil separators and not at all in flash gas separators.
Milosevic and Hrnjak (2010) proposed the use of vertical impacting T-junction as flash gas
separators and conducted preliminary experimental study in the liquid separation
performance of a basic type vertical T-junction. Tuo and Hrnjak (2012) further explored
geometric effects of the T-junction separators on liquid separation efficiency. The vertical
tube of T-junction separators has an elongated and cylindrical shape, very similar to the
headers of the typical microchannel evaporators. Such similarity makes the integration of
the separator and evaporators possible in later stage, therefore achieving compact design.
2.3.1 CLASSIFICATION OF T-JUNCTIONS
T-junctions may be used either to combine two inlet streams into one outlet stream
(combining T) or to divide one inlet stream into two outlet streams (dividing T). When
vapor-liquid mixture encounters a dividing T-junction maldistribution is inevitable, i.e.,
the qualities in the outlets are different. Severe two phase maldistribution can result in all
of the liquid exiting from one outlet and alternatively at other conditions all the vapor may
leave from the same exit. However, this maldistribution may be desirable in cases where
the tee is used as a separator. According to orientation of inlet flow with respect to outlet
flows, there are two distinct types of T junctions: run type and impact type T-junctions as
shown in Figure 2-7.

19
Figure 2-7 Classification of dividing T-junctions
The run type is that inlet branch is in the same direction as one of the outlet branches;
the impact type is that two outlet branches are in opposite directions and inlet flow
impinges to the junction of outlet branches. To be generic, three angles α, β, and γ can be
used to define the spatial orientation of T-junction with respect to three rotation axis (x, y,
and z). It should be pointed out that downward gravity is in the negative z-axis, so the
rotation around the z-axis has no effect on flow distribution in dividing T-junctions.
Therefore, the angle γ is left out for spatial definition in this paper. In addition, the
geometry of the T is defined by the angle θ which defines the deviation of the branch tube
away from the perpendicular direction regarding to the straight tube, and diameters of inlet
di and two outlets do1 and do2.

20
2.3.2 VAPOR-LIQUID FLOW IN T-JUNCTIONS IN OPEN LITERATURE
A number of investigations have been performed on two-phase flow split at T- or Y-
junction using air-water mixture or steam-water mixture. Table 2-1 summarizes some of
previous publications in two-phase flow distribution in various types of T-junctions. In
literatures, many scholars have extensively studied two-phase flow distribution behavior
in various T-junctions. One objective is to find ways to avoid flow maldistribution, while
in recent cases great interests is to quantify vapor-liquid separation in T-junctions which
could be used as separators.
Most of works in the past focused on investigating phase separation and enhancement
methods in various run type T-junctions. Wren and Azzopardi (2004a) studied effect of
insert within a horizontal run type T-junction on the phase split. Depending on the
approaching flow patterns and insert direction, inserts were seen either enhance the partial
phase separation or promote a more equal flow split between the two outlets. While,
altering the angle of cut at the top of the insert from 45º to 30º had little to no effect on the
flow split. Bevilacqua et al. (2000) proposed various “comb configurations’ of simple T-
and Y-junctions in series. All the branch arms of all the junctions are orientated in vertically
upwards in order to enhance vapor extraction from two-phase flow. Wren and Azzopardi
(2004b) compared separation performance of two combined run T-junctions with upward
and downward branches to a single one. Results revealed that the inclusion of a reduced-
diameter T-junction, downstream of the first junction, reduced the gas fraction drawn
through the down branch of the second junctions. In addition, the distance between two T-
junctions has negligible effect on separation performance for stratified and annular flow
patterns at the inlet.

21
Table 2-1 Summary of previous works on two-phase flow in T-junctions
Run type T-junction
Authors α β Di
[mm]
Do1
[mm]
Do2
[mm] Fluid pair Inlet flow pattern
Seeger et al. (1986)
±90º, 0º 0º 50 Air-water,
steam-water
Dispersed bubble, slug, stratified, annular
Shoham et al. (1987)
0º 0º 51 Air-water Stratified-wavy, annular
Mudde et al. (1993)
90º 0º 230 100 Air-water Stratified-smooth, stratified-wavy, bubbly
Marti and Shoham(1997)
‒40º~20º 0º 50.8 25.4 Air-water Stratified-wavy
Stacey et al. (2000)
0º 0º 5 Air-water Annular
Das et al. (2005) 0º 0º 5 Air-water Stratified
Margaris (2007) 90º 0º 203 52 Air-water Stratified
Azzopardi and Whalley (1982)
0º ‒90º 32 6.35, 12.7, 19
Air-water Bubbly, churn, annular
Azzopardi (1994) 0º ‒90º 125 Air-water Annular
Mak et al. (2006) 0º ‒90º 5 Air-water Slug, annular
Tae and Cho (2006)
0º ±90º 11.3 4.95, 8.12, 11.3
R22,R134a,
R410A
Churn, annular
Impact type T-junction
Azzopardi et al. (1986,1987)
0º ‒90º 318 Water-air
Churn, annular
El-Shaboury et al., (2007)
0º 0º 37.8 Water-air
Stratified,
stratified-wavy,
annular
Hwang et al. (1989)
0º 0º 380 Water-air
Bubbly,
bubbly-stratified
Mohamed et al.,
(2011, 2012) 0º~90º 0º 13.5
Water-air
Stratified,
wavy,
annular
Milosevic and Hrnjak (2010)
90º 0º 8.7 18.3 R134a Developing two-phase flow
Tuo and Hrnjak (2012)
90º 0º 8.7 13.4, 18.3 R134a Developing two-phase flow

22
Baker et al. (2008) performed initial study on the transient dynamics and system
response when transient two-phase flow enter such a pair of T-junctions. It was found that
separated flow response to changes in the liquid inlet flow rate lasts in a longer time period
than for responses due to changes in the gas inlet flow rate. To prevent gas take-off through
the liquid outlet and maximize separation performance, Baker et al. (2007) employed an
automatic valve control strategy to regulate the liquid level in the downward branch of the
T-junction and found that valve control strongly depends on the inlet flow patterns.
Very limited open publications presented vapor-liquid separation in impact T-junctions
(Milosevic and Hrnjak, 2010; Tuo and Hrnjak, 2012a; Mohamed et al., 2011, 2012),
nevertheless this type of junction seems attractive especially for the case when potential
objective is integration of separator in the header of the evaporator in vapor compression
systems. Mohamed et al. (2012) investigated the capability of a single impact T-junction
to perform as a full phase separator for air-water two phase flow. Flow phenomena near
the limiting conditions were observed and a simple correlation based on the phenomenon
of liquid entrainment in small upward branches was developed. Both experimental and
model data confirmed that the outlet inclination angle (β) at 90º resulted in the widest
operating conditions at full separation of air and water phases. Milosevic and Hrnjak (2010)
directly investigated R134a vapor and liquid separation in an impact type T-junction with
vertical outlets (α = 90º). Then, Tuo and Hrnjak (2012) explored several design options to
enhance liquid separation in baseline T-junction.

23
2.4 PERIODIC REVERSE FLOW AND BOILING FLUCTUATIONS
Most previous work focused on periodic reverse flow and its impact on microchannel
heat sink for application of electronic cooling. Related work is summarized in Table 2-2.
Wu and Cheng (2003) found the temporal alterative appearance of two-phase flow and
single-phase liquid flow, and regarded out-of-phase oscillations of pressures and mass
fluxes as the cause for sustained instability. Brutin et al. (2003 and 2004) demonstrated that
the presence of the buffer tank upstream the channel aggregates flow reversal and pressure
drop oscillation with greater amplitude and lower frequency for n-pentane boiling in a
single minichannel (Dh=889 µm). Hetsroni et al. (2005 and 2006) observed periodic
wetting and rewetting boiling in triangular microchannel heat sink. The period between
successive cycles of reversal flow includes four time intervals, and the dimensionless
period decreases with increasing the boiling number. Chang and Pan (2007) observed
bubble slug oscillating growth leading to instances of reverse flow in 15 parallel
microchannels (Dh=83.9 µm), and suggested that the magnitude of the pressure drop
oscillations can be used as an index for the appearance of reverse flow. Balasubramanian
and Kandlikar (2004) visualized bubble growth fluctuations in 6 parallel microchannels
(Dh=333 µm) at different orientations. They observed more violent backward flow in the
vertical downward case than horizontal and vertical upward flow since buoyancy force
facilitates bubble upward movement (Figure 2-8). Consequently, pressure drop is highest
but heat transfer coefficient is the lowest in downward flow case, and they attributed this
degradation to flow maldistribution caused by severe vapor reversal (Figure 2-9).

24
Figure 2-8 Bubble growth fluctuation in microchannels (1) downward flow, (2) upward flow,
time interval: 0.33 ms (Balasubramanian and Kandlikar, 2004)
Figure 2-9 Effect of flow orientations on (1) pressure drop and (2) heat transfer coefficient in
microchannels (Balasubramanian and Kandlikar, 2004)

25
Table 2-2 Summary of previous works on reverse flow and boiling fluctuations
Author/Year Fluid and ranges of
G (kg/m2s) &q (kW/m2)
Channel shape, size (Dh), numbers (C#)
Fluid inlet & exit states
Reverse flow reported
Brutin et al. (2003)
n-Pentane G=125-475; q=200-700
Rectangular (S), Dh=889µm
In: Subcooled, Exit: x=20%-40%
Yes
Brutin and Tadrist, (2004)
n-Pentane G=95.8-2258; q=15.7-125.6
Rectangular (S), Dh=889µm
In: Subcooled; Exit: x=0-1.0
No
Wu and Cheng, (2003)
Water G = 144 – 251; q = 9.6 – 155
Trapezoidal, Dh=158.8,82.8µm
#CH = 8,15
In: Subcooled Exit: No superheat
No
Wu and Cheng, (2004)
Water G = 112 – 146; q = 20 – 2400
Trapezoidal, Dh=186µm #CH = 8
In: Subcooled Exit: x<16%
No
Balasubramanian and Kandlikar (2004, 2005)
Water G = 112 – 120; q = 208 – 316
Rectangular Dh = 333 µm
#CH = 6
In: Subcooled Exit: No superheat
Yes
Qu and Mudawar (2004)
Water G = 134.9 – 400.1;
q = 208 – 316
Rectangular Dh = 349 µm
#CH = 6
In: Subcooled Exit: x<15%
Yes
Lee and Mudawar (2005)
R134a G = 127 – 654; q=316 – 938
Rectangular Dh=349µm
#CH = 6
In: xin =0.1%-25% Exit: xout=49%-superheat
No
Xu et al. (2005) Water/Methanol G = 20 -1200; q = 130 - 392
Rectangular Dh = 436 µm
#CH = 26
In: Subcooled Exit: No superheat
No
Hetroni et al., (2005)
Water G=95-340; q=80-330
Triangular Dh=129 µm #CH = 13,21
In: Subcooled Exit: low x (<10%)
Yes
Hetsroni et al., (2006)
Water, Ethanol G = 28.5 – 1267; q = 50.7 – 365
Triangular Dh=100,130,220 µm
#CH = 13,21,26
In: Subcooled Exit low x (<8%)
Yes
Chang and Pan (2007)
Water G = 22 -110;
q = 7.86 – 95.5
Rectangular Dh = 86.3µm
#CH = 15
In: Subcooled Exit: No superheat
Yes
Huh et al. (2007)
Water G = 170 – 360 q = 200 – 530
Rectangular (S) Dh = 103.5µm
In: Subcooled Exit: No superheat
No
Kuo and Peles (2009)
Water G = 86 – 520
q = 200 – 1600
Rectangular Dh = 223 µm
#CH = 5
In: Subcooled Exit: No superheat
No
Zhang et al. (2009)
Water/HFE-7100 G = 5 – 345;
q = 30-44
Rectangular Dh=100,220,337 #CH =100,40,25
In: Subcooled Exit: No superheat
No
Barber et al., (2010)
FC-72 G= 32; q=4.26
Rectangular (S), Dh=889µm
In: Subcooled Exit: No superheat
Yes
Bogojevic et al. (2011)
Water G = 72.2 – 433.3;
q=178 – 445
Rectangular Dh=194µm #CH = 40
In: Subcooled Exit: No superheat
Yes

26
Table 2-3 Summary of methods explored to suppress boiling oscillations in microchannels
Methods Author/Year Fluid and conditions
G (kg/m2s) &q (kW/m2) Channel shape, size (Dh),
numbers #CH) Main features
Inlet restrictors or
orifices
Qu and Mudawar
(2004)
Water G = 134.9 – 400.1;
q = 208 – 316
Rectangular Dh = 349 µm
#CH = 6
Upstream throttling valve
Kosar et al. (2006)
Water G=115–389; q=90–6140
Rectangular, Dh=227µm #CH = 5
Four inlet orifices with different length
and width
Kandlikar et al. (2006)
Water G = 120;
q = 298 – 308
Rectangular, Dh=333µm #CH = 6
51% and 4% of MC cross-sectional area
Park et al. (2009)
R134a, R236fa, R245fa G = 200 – 2000;
q = 0 – 1800
Rectangular, Dh=837,315µm #CH = 20,29
Two orifices: Circular (300 µm); Rectangular (200×765 µm)
Agostini et al. (2008)
R236fa G = 30 – 1880; q = 250 – 2200
Rectangular Dh = 122 µm #CH = 134
Rectangular orifices (500×67 µm)
Expanding channels
Lee and Pan (2008)
Water G = 209 – 625; q = 117 –361
Rectangular Dh = 33.3 µm
#CH = 1
Diverging angle of 0.183°
Lee et al. (2010)
Water G = 48.5;
q=22 – 23.5
Rectangular Dh=353µm #CH = 48
Double channel area at downstream by combining two
channels
Lu and Pan(2008)
Water G = 99 –297; q = 238 – 246
Rectangular Dh = 120 µm
#CH = 10
Diverging angle of 0.5°
Lu and Pan (2009)
Water G=198;
q=241 – 244
Triangular Dh=120 µm #CH = 10
Diverging angle of 0.5° + 25 cavities (20-
22 µm)
Artificial nucleation
cavities
Kuo and Peles (2008)
Water G = 86 – 520 q = 0 – 210
Rectangular Dh = 223 µm
#CH = 5
Nonconnected and interconnected
reentrant cavities on the sidewalls
Zhang et al. (2005)
Water m = 0.02 ml/min;
Q = 0 – 2.7 W
Rectangular Dh=27–171
Notches( 4 µm, on side wall) + cavities
(4-8 µm, on the bottom)
Kandlikar et al. (2006)
Water G = 120;
q = 298 – 308
Rectangular, Dh=333µm #CH = 6
Artificial nucleation sites (5 – 30 µm)
Kosar et al. (2005)
Water G = 41 – 302; q=280 – 4450
Rectangular Dh=227µm #CH = 5
7.5 µm wide reentrant cavities on the
sidewalls
Seed bubble
Liu et al. (2010)
Methanol G = 100 – 1100;
q = 0 – 374
Triangular Dh=100 µm
#CH = 5
Seed bubble created by microheater at f=
10, 100, 1000 Hz
Xu et al. (2009) Acetone
G = 377.9 – 897.6; q = 439 – 939.9
Rectangular Dh = 100 µm
#CH = 5
Seed bubble created by microheater at f=
10, 100, 1000 Hz Han and
Shikazono (2011)
Water G = 169 – 254 q = 72 – 584
Rectangular (S) Dh = 497µm
Air injection with varied flow rates

27
Some researchers have presented approaches for reducing reverse vapor flow and
stabilizing flow boiling in microchannels, as summarized in Table 2-3. So far, methods
explored would be divided in four groups: 1) raising inlet and system pressure by placing
inlet area restriction of the microchannels (Qu and Mudawar, 2004; Kosar et al., 2005 and
2006; Kuo et al., 2008; Kandlikar et al., 2006; Agostini et al., 2008); 2) using expanding
channels with diverging cross-section design in which the steep pressure gradient near the
inlet helps resist the reverse vapor flow (Lee and Pan, 2008; Lee et al., 2010; Lu and Pan,
2008; Lu and Pan, 2009); 3) reducing the wall superheat and decelerating bubble growth
rate by fabricating artificial nucleation sites on the channel walls (Kuo and Peles, 2008;
Zhang et al., 2005; Kandlikar et al., 2006; Kosar et al., 2005); 4) it was also found that flow
boiling can be stabilized by actively generating initial seed bubbles to reduce wall
superheat required for bubble nucleation, either by injecting additional gas or adding pulse
voltage signal (Liu et al., 2010; Xu et al., 2009; Han and Shikazono, 2011).
Qu and Mudawar (2004) identified severe pressure drop instability and mild parallel
channel instability in 21 parallel microchannels. They found that severe pressure drop
instability can be suppressed by throttling the flow upstream of the heated channels. Kosar
et al. (2006) studied the effect of the inlet restrictors with four different lengths on
stabilizing flow boiling instability in five parallel rectangular microchannels. Their results
reveal that the flow oscillation suppression by placing inlet restrictors is well correlated
with a dimensionless pressure drop multiplier (M) and the heat flux corresponding to the
onset of unstable boiling increases asymptotically with M. Agostini et al. (2008) confirmed
that inlet orifices effectively removed boiling instability of refrigerant R236fa in a 137
parallel microchannel heat sink.
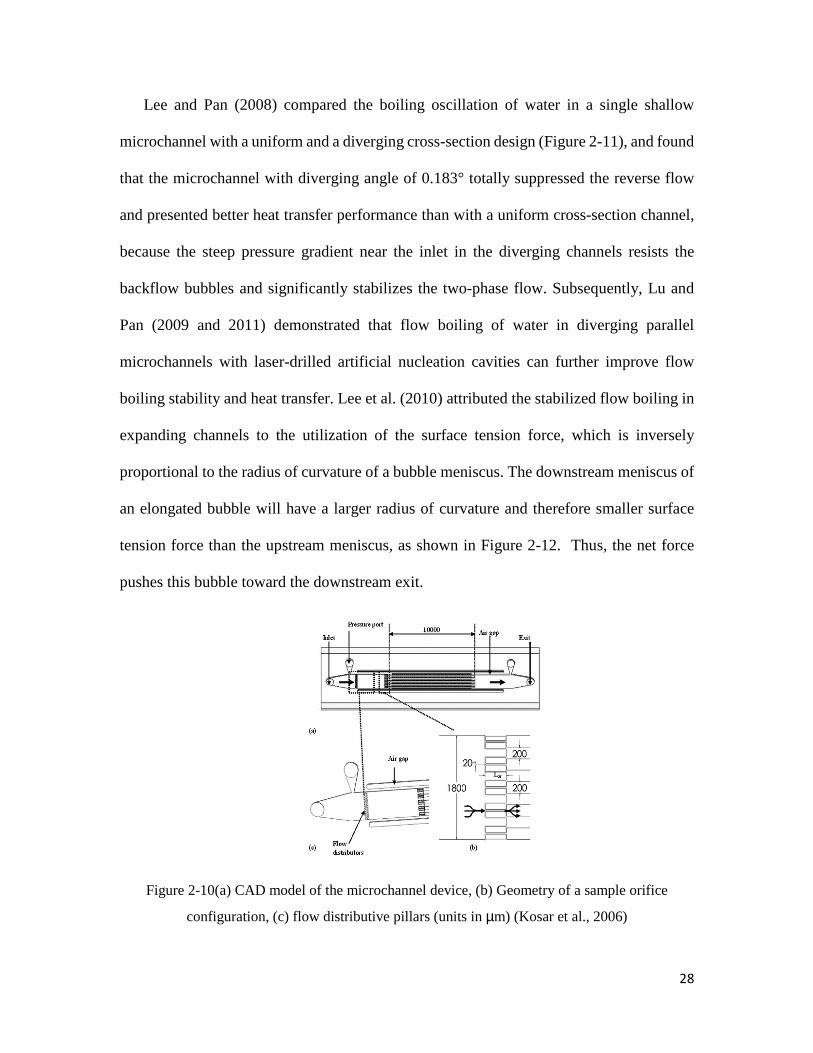
28
Lee and Pan (2008) compared the boiling oscillation of water in a single shallow
microchannel with a uniform and a diverging cross-section design (Figure 2-11), and found
that the microchannel with diverging angle of 0.183° totally suppressed the reverse flow
and presented better heat transfer performance than with a uniform cross-section channel,
because the steep pressure gradient near the inlet in the diverging channels resists the
backflow bubbles and significantly stabilizes the two-phase flow. Subsequently, Lu and
Pan (2009 and 2011) demonstrated that flow boiling of water in diverging parallel
microchannels with laser-drilled artificial nucleation cavities can further improve flow
boiling stability and heat transfer. Lee et al. (2010) attributed the stabilized flow boiling in
expanding channels to the utilization of the surface tension force, which is inversely
proportional to the radius of curvature of a bubble meniscus. The downstream meniscus of
an elongated bubble will have a larger radius of curvature and therefore smaller surface
tension force than the upstream meniscus, as shown in Figure 2-12. Thus, the net force
pushes this bubble toward the downstream exit.
Figure 2-10(a) CAD model of the microchannel device, (b) Geometry of a sample orifice
configuration, (c) flow distributive pillars (units in µm) (Kosar et al., 2006)
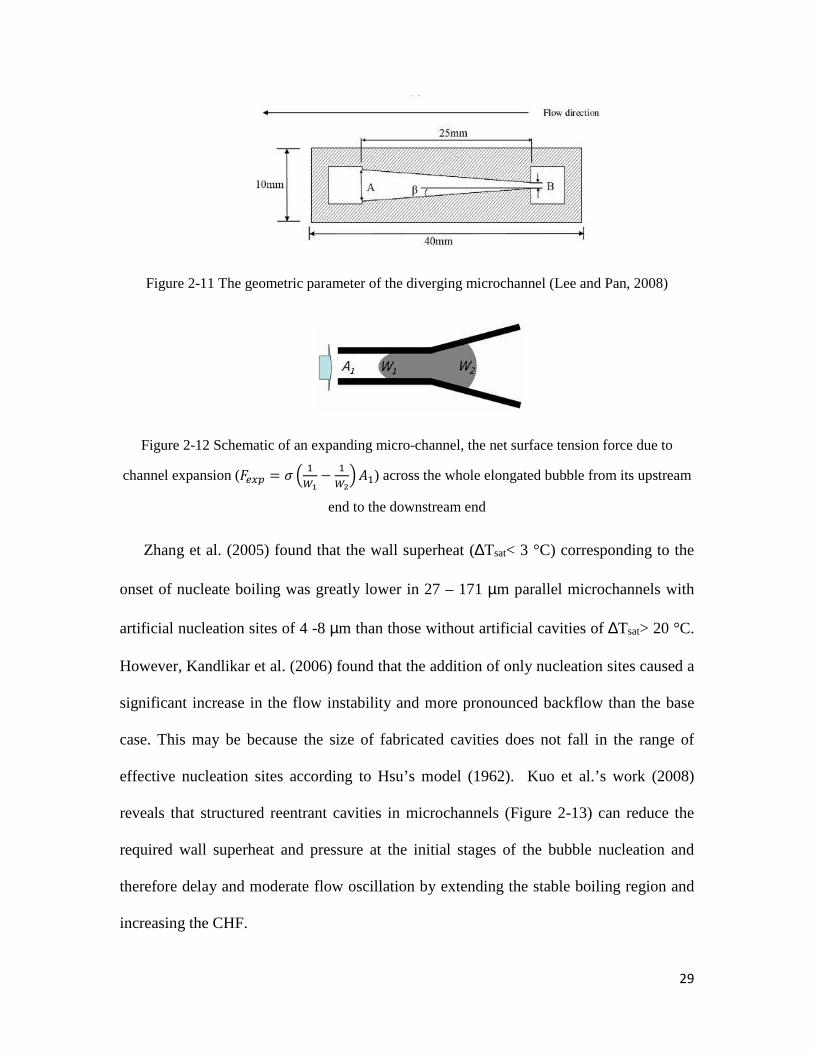
29
Figure 2-11 The geometric parameter of the diverging microchannel (Lee and Pan, 2008)
Figure 2-12 Schematic of an expanding micro-channel, the net surface tension force due to
channel expansion (���� = � � �
��
−�
��
��) across the whole elongated bubble from its upstream
end to the downstream end
Zhang et al. (2005) found that the wall superheat (∆Tsat< 3 °C) corresponding to the
onset of nucleate boiling was greatly lower in 27 – 171 µm parallel microchannels with
artificial nucleation sites of 4 -8 µm than those without artificial cavities of ∆Tsat> 20 °C.
However, Kandlikar et al. (2006) found that the addition of only nucleation sites caused a
significant increase in the flow instability and more pronounced backflow than the base
case. This may be because the size of fabricated cavities does not fall in the range of
effective nucleation sites according to Hsu’s model (1962). Kuo et al.’s work (2008)
reveals that structured reentrant cavities in microchannels (Figure 2-13) can reduce the
required wall superheat and pressure at the initial stages of the bubble nucleation and
therefore delay and moderate flow oscillation by extending the stable boiling region and
increasing the CHF.

30
Figure 2-13 Nonconnected reentrant cavity microchannels (Kuo et al., 2008)
Although reverse vapor flow and options for suppression have been extensively
explored, those knowledge were not found applicable for A/C systems, since heat transfer
and flow conditions in microchannel evaporators used in A/C or refrigeration system are
significantly different from those microchannel heat sinks. The heat flux is usually
controlled constant (up to about 1000 kW/m2) that is significantly higher than in
evaporators of refrigeration and A/C systems. Flow starts with subcooled liquid at the inlet
ending up with very low quality at exit in order to maintain two phase flow regime with
high heat transfer coefficient in entire microchannels, while A/C and refrigeration systems
are typically with superheat control and therefore refrigerant at the evaporator exit is very
often in superheated vapor flow. Water is used in most experiments as the coolant and it
has different thermophysical properties from typical refrigerants of R134a and R410A,
such as vapor/liquid density, latent heat of vaporization, surface tension, and etc.
To the best knowledge of authors’, no study or even indication of such phenomena like
reverse flow in refrigeration and A/C microchannel evaporators were found in open
literature. Recently, Bowers et al. (2012) reported reverse flow in a microchannel
evaporator used for a R410A residential A/C system operating in a direct expansion (DX)

31
mode, as shown in Figure 2-14. In addition, those methods studied in literature to suppress
the reverse flow and boiling oscillation usually involves in very sophisticated
microfabrication process and inevitably increases pressure drop across microchannels
dramatically. They would be too much complicated and even unrealistic to implement in
microchannel evaporators used for refrigeration and A/C systems. In addition, there was
no study to characterize and quantify the periodic reverse vapor flow from the heated
microchannels. This would be very important information to further investigate the
mechanism and impact of the flow boiling fluctuations induced by the periodic reverse
vapor flow in microchannels.
Figure 2-14 Reverse vapor flow in horizontal inlet header with vertically upward flow through
microchannels

32
Chapter 3 VAPOR-LIQUID REFRIGERANT
SEPARATION IN A VERTICAL IMPACT T-JUNCTION
SEPARATOR
3.1 INTRODUCTION
This chapter presents results from experimental study of vapor and liquid refrigerant
separation in vertical impact T-junctions using R134a and R410Afor application in but not
limited to vapor compression systems with flash gas bypass method. Inlet flow rate and
quality are varied in the range of 10 - 40 g/s and 10 - 25%. Flow patterns in the T-junction
separator are identified and characterized. It is found that liquid separation efficiency
strongly depends on the flow pattern right above the impact region (junction). The
efficiency deteriorates dramatically when mist turns into churn flow regime, with
increasing inlet flow rate and/or quality. In addition, five design options to enhance vapor-
liquid separation performance are explored: inlet inclination angle, dual-inlet as pre-
separation, inlet tube diameter, cross-sectional shape and location with respect to the
vertical tube. The objective is to avoid or at least delay transition from mist to churn flow
by reducing and changing the direction of liquid phase inertia force, and decreasing liquid
and vapor force interaction.

33
3.2 EXPERIMENT SETUP AND MEASUREMENTS
3.2.1 FACILITY
The schematic drawing of the experiment facility for study of T-junction separator
performance is shown in Figure 3-1. It primarily consists of a test section, i.e. a vertical
impacting T-junction, an accumulator tank, vapor and liquid flow mass flow meters (MFl
and MFv), an electric heater, a plate condenser and a tube-tube heat exchanger as a
subcooler, a refrigerant receiver and a variable-speed refrigerant diaphragm pump. The
diaphragm pump is used to supply the desired mass flow rate for the working refrigerant
circuit with a certain discharge pressure. The refrigerant flow rate in a subcooled state is
measured in the pump discharge line by the Coriolis-type mass flow meter MFl. An electric
heater controls refrigerant state before the expansion valve and therefore the refrigerant
quality prior to the test section. System pressures and temperatures are measured by
pressure transducers (P) and T-type thermocouples (T). Vapor and liquid refrigerant are
separated in the T-junction (test section). It is made from transparent PVC tube to provide
flow visualization and its detailed sketch is shown in Figure 3-2. The vertical part has a
total length of 400 mm, and inner diameter of 13.4 and 18.3 mm. The horizontal inlet with
an inner diameter of 8.7 mm is connected to the vertical part at its center location. A needle
valve is directly connected to the inlet branch tube with intention to simulate an expansion
valve and configuration in a real A/C system. A high-speed CCD camera was used to
visualize the flow patterns in T-junctions at a recording speed of 1000 fps.

34
Figure 3-1 The schematic of experimental facility
Figure 3-2 Detailed schematic of the impact T -junction separator
The inlet refrigerant quality is calculated based on the heat input and refrigerant
enthalpy before the heater, as following:

35
2 1in
Qh h
m= +
& (3-1)
2 l
inv l
h hx
h h
−=−
(3-2)
Where �� ��and Q are the inlet mass flow rate and electrical heat input, hv and hl are the
saturated vapor and liquid enthalpy, respectively.
The vapor-liquid two phase flow exiting from the top outlet was directed to a collection
tank at downstream where the mixtures were perfectly separated and then measured.
Volume of liquid refrigerant collected in the tank over a certain period is measured
resulting in a time-averaged mass flow rate. Meanwhile, vapor mass flow rate separated
from the collection tank is measured by the Coriolis-type flow meter MFv downstream of
the collection tank.
When the T-junction is used as a flash gas separator in a flash gas bypass air-
conditioning system only liquid refrigerant from the bottom outlet should be supplied into
the evaporator. At the same time no liquid should be carried out by the upward vapor flow
to the suction line. Two separation efficiencies for vapor and liquid flow would be used to
evaluate the performance of T-junction separators. They are defined as the ratio of fluid
flow rate at the designated outlet to the total fluid supplied to the inlet of the T-junction.
Specifically, designated outlets are top and bottom outlets for vapor and liquid refrigerant,
respectively. They are defined as following equations:
, ,
,
1(1 )
l b l tl
l i in in
m m
m m xη = = −
−& &
& &
(3-3)
, ,
,
v t v tv
v i in in
m m
m m xη = =
& &
& &
(3-4)

36
Where �� �,� and �� �,� denote the liquid refrigerant mass flow rates at the bottom and
top outlets, �� �,� is the vapor mass flow rate at the top outlet. xin is the refrigerant quality
right after the throttling valve.
Imperfect liquid separation (liquid entrainment in upward vapor flow) would reduce
cooling capacity and may flood the compressor when no internal heat exchanger is used or
if the quantity of liquid entrained exceeds the capacity that the internal heat exchanger. For
this reason, in experiments presented in this paper the vapor separation efficiency was
always maintained at 100% because of this particular application (no vapor exiting from
liquid outlet), and thus the liquid separation efficiency ηl is used as only index to evaluate
the separator performance.
3.2.2 UNCERTAINTY ANALYSIS
The accuracy of sensors are reported in Table 2. The maximum values of measurement
uncertainty for refrigerant inlet quality xin and liquid separation efficiency ηliq are estimated
around ±2% and ±3%, respectively and is presented with bars.
Table 3-1 Operating cycle configurations with different valve setups
Measurement Unit Accuracy Pressure kPa ±3.56
Temperature ºC ±0.5 Mass Flow Rate g/s ±0.1% F.S.
Heat Input W ±10 (0.5% F.S) Liquid Level in
Accumulator tank mm ±2
Time s ±2

37
3.3 RESULTS OF BASELINE T-JUNCTION SEPARATORS
3.3.1 THEORETICAL ANALYSIS OF PARTICLE SEPARATION
Important forces acting on dispersed particles (droplet or bubble) in a continuous
flowing fluid are gravitational force (FG), buoyancy force (FB), and drag force (FD). In a
vertical impact T -junction, liquid and vapor refrigerants are desired to be separated toward
bottom and top outlets, respectively. Thus, those forces and directions acting on one droplet
in upward vapor refrigerant flow are shown in Figure. The resultant of these forces causes
acceleration and motion of the droplet in the direction of the net force. Two important
concepts are of importance for sizing and designing separators: terminal velocity, the
velocity at which the vertical component of the drag force exactly counteracts the net
gravitational and buoyancy forces; critical size of droplets, the droplet diameter at which
the resultant forces are balanced at the corresponding terminal velocity. If droplet size is
smaller than the critical size or upward vapor velocity is lower than the terminal velocity,
the corresponding droplet will be separated. Otherwise, it will be entrained by upward
vapor flow.
Figure 3-3 Force and movement of one droplet

38
Three primary forces can be expressed as:
3
4
3 2G l
dF gπ ρ =
(3-5)
3
4
3 2B v
dF gπ ρ =
(3-6)
2
21( )
2 2D D v l v
dF C u uπ ρ = −
(3-7)
Where ul and uv are droplet and upward vapor velocities; d is droplet diameter; CD is
drag force coefficient.
Mathematically, the critical droplet size dl,cr can be determined as following:
2
,
( )3
4 ( )D v l v
l crl v
C u ud
g
ρρ ρ
−=−
(3-8)
Similar method would be applied to derive the critical bubble size dv,cr:
2
,
( )3
4 ( )D l l v
v crl v
C u ud
g
ρρ ρ
−=−
(3-9)
Such simplified analysis is based on following assumptions: 1) particle is in a perfectly
spherical shape by neglecting deformation; 2) particle has no impact on the flow field of
primary fluid; 3) particle has a zero initial velocity. Figure 3-4and Figure 3-5show critical
diameters of droplets and bubbles as a function of separation load and vertical tube
diameter. At the same condition, critical droplet size is greater than bubble size, indicating
that separating liquid droplet is more difficult than separating vapor bubble.
In reality, vapor and liquid refrigerant enters the vertical tube of T-junction with certain
initial velocities. Such initial velocities usually depend on the flow condition, inlet flow
pattern, and splashing on the vertical wall. Thus, droplets and bubbles that should be

39
separated have initial velocities. Their trajectories, especially in vertical direction may vary
significant under different conditions and are critical to determine the length of the T-
junction separator. Figure 3-6 depicts the vertical trajectories of particles with different
sizes at a given operating condition. Initial vertical velocity is equal to that at junction inlet
based on inlet conditions and void fraction correlation by Graham et al. (1998). Clearly,
the larger droplet requires shorter separation time but reaches a higher location due to its
greater inertia force compared to the smaller droplet. Comparing to a bubble with the same
diameter, droplet requires a much longer separation distance and time for the same reason.
From above theoretical analysis, separating droplets is more sensitive to operating
conditions and T-junction geometries and more difficult compared to separating bubbles.
However, it should be noted that those results are based on a simplified theoretical analysis.
In reality, flow behavior will be more complex. But, such analysis still provides some basic
ideas regarding reasonable size of a T-junction operating on the specified conditions.
(a) droplet (b) bubble
Figure 3-4 Effect of vertical tube diameter on critical diameters of separated particles
10 15 20 25 30 35 400
0.25
0.5
0.75
1
1.25
1.5
1.75
2
15 mm
20 mm
25 mm
Crit
ical
Dro
plet
Dia
met
er [m
m]
Refrigerant Mass Flow Rate [g/s]
xin=15%
R134a
10 15 20 25 30 35 400
0.25
0.5
0.75
1
1.25
1.5
1.75
2
Refrigerant Mass Flow Rate [g/s]
Crit
ical
Bub
ble
Dia
met
er [m
m]
15 mm
20 mm
25 mm
xin=15%
R134a

40
(a) droplet (b) bubble
Figure 3-5Effect of refrigerant quality on critical diameters of separated particles
(a) droplet (b) bubble
Figure 3-6 Vertical trajectories of droplet and bubble with different sizes
3.3.2 FLOW PATTERN AT THE INLET OF THE T-JUNCTION
Figure 3-7 and Figure 3-8show observed two-phase flow patterns for R134a and
R410A at the junction inlet in two types of flow regime maps:1) the widely used two-phase
flow pattern map for fully developed flow by Thome and Hajal (2003)and 2) map for
developing flow by Bowers and Hrnjak (2009) for a tube diameter of 8.7 mm and at an
axial distance downstream the expansion device of 155 ~ 215 mm. The difference between
these two maps are following. The former is based on fully developed two-phase flow
which is typically recorded after a relatively long development section, about 3 m
according to the experimental setup in Thome and Hajal’s work (2003). However, like
10 15 20 25 30 35 400
0.5
1
1.5
2
2.5
10%
20%
30%
Refrigerant Mass Flow Rate [g/s]
Crit
ical
Dro
plet
Dia
met
er [m
m] Dbd = 20 [mm]
R134a
10 15 20 25 30 35 400
0.1
0.2
0.3
0.4
0.5
10%
20%
30%
Refrigerant Mass Flow Rate [g/s]
Cri
tical
Bub
ble
Dia
met
er [m
m] Dbd = 20 [mm]
R134a
0 0.2 0.4 0.6 0.8 10
30
60
90
120
150
Time [s]
Dro
plet
Ver
tical
Tra
ject
ory
[mm
]
0.5 [mm]
1 [mm]
2 [mm]
Dcr = 347 [µm]
min = 30 g/sxin = 15%Dbd = 20 mmDin = 8.7 mm
0.0 1.0x10⁻³ 2.0x10⁻³ 3.0x10⁻³-0.5
-0.4
-0.3
-0.2
-0.1
0
Time [s]
Bub
ble
Ver
tical
Tra
ject
ory
[mm
]
0.5 [mm]
1 [mm]
2 [mm]
Dcr = 357 [µm]
min = 30 g/sxin = 15%Dbd = 20 mmDin = 8.7 mm

41
many other typical refrigeration or A/C systems, the flow distance between the expansion
device and T-junction is relatively short (0-0.3m) for the purpose of compact design. Two
phase refrigerant flow unlikely has sufficient flow development section to reach fully
developed regime. The map by Bowers and Hrnjak (2009)is based on the adiabatic
developing two phase flow along a horizontal pipe. The flow regimes were found in a
strong function of flow distance after expansion device in addition to inlet quality and mass
flux, and correspondingly evolve in four consecutive stages along flow direction: well
mixed (homogenous region), separating, separated but still developing, and finally
developing regions. Detailed flow regimes in transition stages were identified and
described, including droplet/annular/stratified, bubble/stratified, and etc.
Recorded flow pattern for data points with various inlet mass fluxes but the same
quality of 10% are shown in Figure 3-9.For the case of low flow rate, 10 g/s, the observed
flow pattern at the junction inlet seems to be smooth stratified or stratified-wavy, which
agrees well with the both flow maps. As the flow rate increases, the typical intermittent
flow, i.e. slug or plug flow as indicated by the map for fully developed flow is not clearly
observed. Instead, the most frequently observed patterns are bubble/stratified which is
characterized by a noticeable liquid layer present on the bottom of the tube with a large
section of the tube above this layer being filled with bubbles. Sometimes, a cluster of liquid
droplets and ligaments are present in the core of vapor flow above bubbles and liquid layer.
This is because bubbles and droplets created in the expansion requires need longer time
and flow distance to coalesce into the vapor flow or deposit into the bottom liquid layer,
respectively. Overall, observed flow patterns at the junction inlet appears to agree better
with the developing two-phase flow map in the relatively high mass flux condition.

42
a) Flow regime map for developed flow (Thome and Hajal, 2003)
b) Flow regime map for developing flow map (Bowers and Hrnjak, 2009) for L = 155 ~ 215
mm as in the facility
Figure 3-7 Two phase flow regime at the junction inlet for R134a

43
a) Developed flow map (Thome and Hajal, 2003)
b) Developing flow map (Bowers and Hrnjak, 2009) for L = 155 ~ 215 mm as in the facility
Figure 3-8 Two phase flow regime at the junction inlet for R410A
To facilitate the vapor-liquid separation in the vertical tube, separated flow regime is
preferred, which is characterized by a distinct and stable liquid/vapor interface and liquid
and vapor flowing at the bottom and top portion of the tube respectively. Thus, the length
of the horizontal tube of the T-junction is chosen about 200 mm, which is recommended

44
by Bowers and Hrnjak (2009) as a minimum length for flow pattern change from the
homogenous to the separated but developing flow pattern.
(a) R134a
(b) R410A
Figure 3-9 Flow regime visualization at the inlet of the T-junction separator for the
quality of 10%
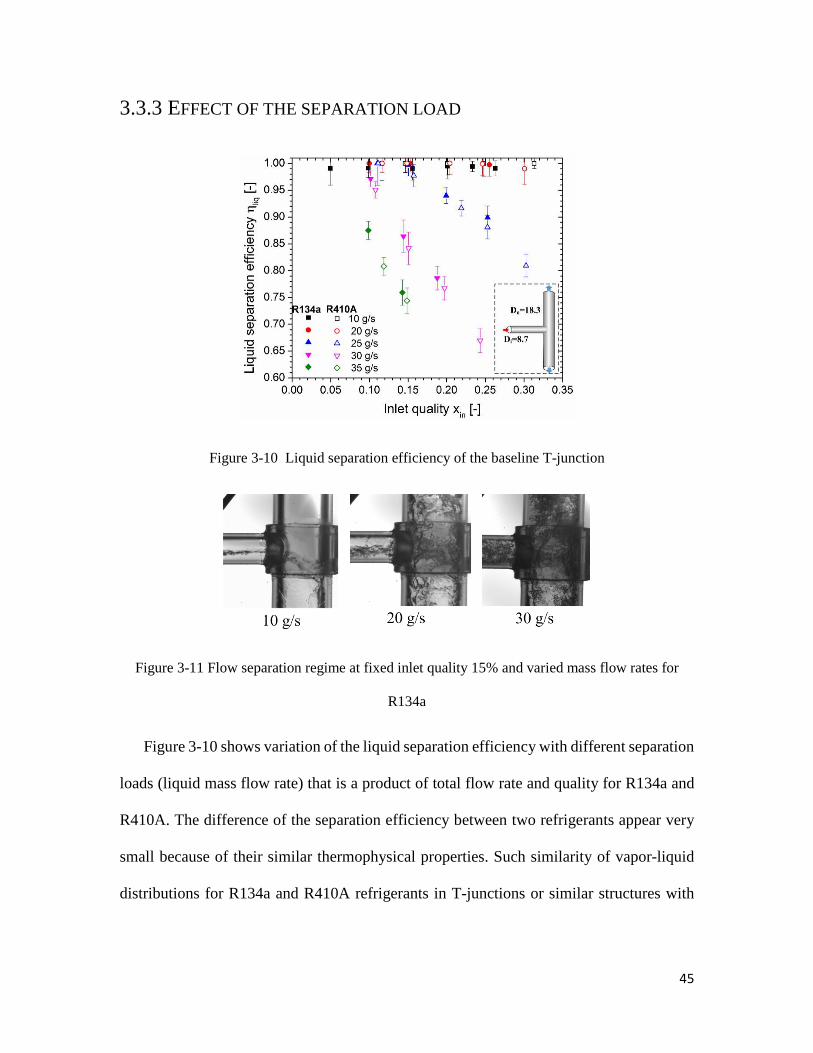
45
3.3.3 EFFECT OF THE SEPARATION LOAD
Figure 3-10 Liquid separation efficiency of the baseline T-junction
Figure 3-11 Flow separation regime at fixed inlet quality 15% and varied mass flow rates for
R134a
Figure 3-10 shows variation of the liquid separation efficiency with different separation
loads (liquid mass flow rate) that is a product of total flow rate and quality for R134a and
R410A. The difference of the separation efficiency between two refrigerants appear very
small because of their similar thermophysical properties. Such similarity of vapor-liquid
distributions for R134a and R410A refrigerants in T-junctions or similar structures with

46
multiple parallel tubes and one dividing manifold was found by many other authors (Tae
and Cho, 2006; Jin, 2006; Zou and Hrnjak, 2010; Zou and Hrnjak, 2013a and 2013b).
Generally, the separation efficiency decreases with an increase of inlet mass flow rate
and/or quality due to higher liquid and vapor flow velocities at the T-junction. The inlet
vapor and liquid velocities are calculated based on empirical void fraction correlation
proposed by Graham et al. (1999) and inlet conditions. Typically, higher velocity causes
much stronger liquid inertial force and the vapor phase drag force, both of which
contributes to the liquid entrainment to the top outlet as both of them are opposite to the
downward gravity force. After incoming liquid jet impinges on the vertical tube, it intends
to divert in both upward and downward directions. The quantity in each direction mainly
depends on the relative magnitude of inertial to gravity forces (see Figure 3-11). The vapor
phase drag force essentially determines the eventual quantity of liquid entrained to the top
outlet.
Figure 3-11 shows the flow visualization at the junction at various inlet mass flow but
fixed quality of about 15% for R134a. At a low flow rate of only 10 g/s, liquid refrigerant
enters the junction at a relatively low velocity about 1.0 m/s and therefore low inertial force.
Violent liquid jet impingement is not yet observed, since the gravity is dominant over the
inertial force, pulling down the liquid jet to the bottom outlet in an undisturbed pattern. As
flow rate is increased to 20 g/s, liquid jet with a higher velocity (1.3 m/s) impinges the
inner wall of the vertical tube. Some portion of the incoming liquid is initially diverted
upward against gravity, but later it falls down again, which creates a liquid film
recirculation region right above the junction. This is because the local upward vapor flow
(1.9 m/s) is insufficient to carry over such liquid further towards the top outlet, against

47
downward gravity force. Thus, in these cases the liquid separation is still relatively high,
and especially insensitive to change of the refrigerant inlet mass flow rate and quality, as
can be seen in Figure 8. When the refrigerant flow rate further increases to 30 g/s, liquid
separation efficiency deteriorates dramatically down to about only 85%. A significant
amount of incoming liquid flow spreads at the junction and upward after hitting the tube
wall. The vapor flow has a higher velocity (average 2.4 m/s) so it entrains greater amount
of liquid present at and above the junction towards the top outlet compared to the case of
relatively low inlet mass flow.
Beyond certain inlet mass flow rate, the separation efficiency deteriorates noticeably
with the quality (see Figure 3-10). That trend can be explained by comparing the flow
regime at the top branch of the T-junction as shown in Figure. At relatively low mass flow
rate of 20 g/s, the liquid phase is entrained by vapor flow mainly as dispersed droplets. The
liquid separation efficiency depends on the quantity and size of liquid droplets present at
the junction. Although the smaller droplets would be easier to be entrained, they carry
insignificant liquid mass, and therefore the liquid separation efficiency is still relatively
high and insensitive to inlet quality. As mass flow rate increases inertial forces generate
stronger splashing resulting in more numerous and larger droplets along with thicker film
mowing upwards. At even higher mass flow rate (about 30 g/s), a churny and highly
agitated two-phase mixture is formed which strongly recirculates right above the junction.
In this case the entrained liquid is mainly in the form of bulk, churny ligament like structure.
It is no surprise that the efficiency degrades dramatically. Thus, the performance (liquid
separation efficiency) strongly changes when the flow regime just above the junction alters
from the mist flow pattern to churny flow.

48
Two conditions are required to form churny flow: 1) sufficient liquid flow from
splashing present above the junction; 2) sufficient upward vapor flow to hold up the liquid
and eventually carry it over towards the top outlet. Particularly, the first one may exacerbate
the second as the churny mixture layer will block the flow area for the upward vapor flow,
and thus increase the local velocity and the phase interaction. To avoid churn flow
condition and maintain relative good separation performance, the design options of T-
junctions should provide conditions to eliminate or at least reduce either of above two
conditions.
Figure 3-12 Comparison of flow regimes at �� ��= 30 g/s, xin = 19% and �� ��= 20 g/s, xin = 25.5%
3.3.4 MIST FLOW TO CHURN FLOW TRANSITION
As it is shown that separation efficiency is very sensitive in transition from mist to
churn flow, a special set of experiments with following procedure was conducted to explore
that region. For each data point, the inlet mass flow rate is maintained constant, then the
upper limit is obtained by slowly increasing the inlet quality until churny liquid refrigerant
is being built up on the top branch. Similarly, for determining the lower bound of transition,
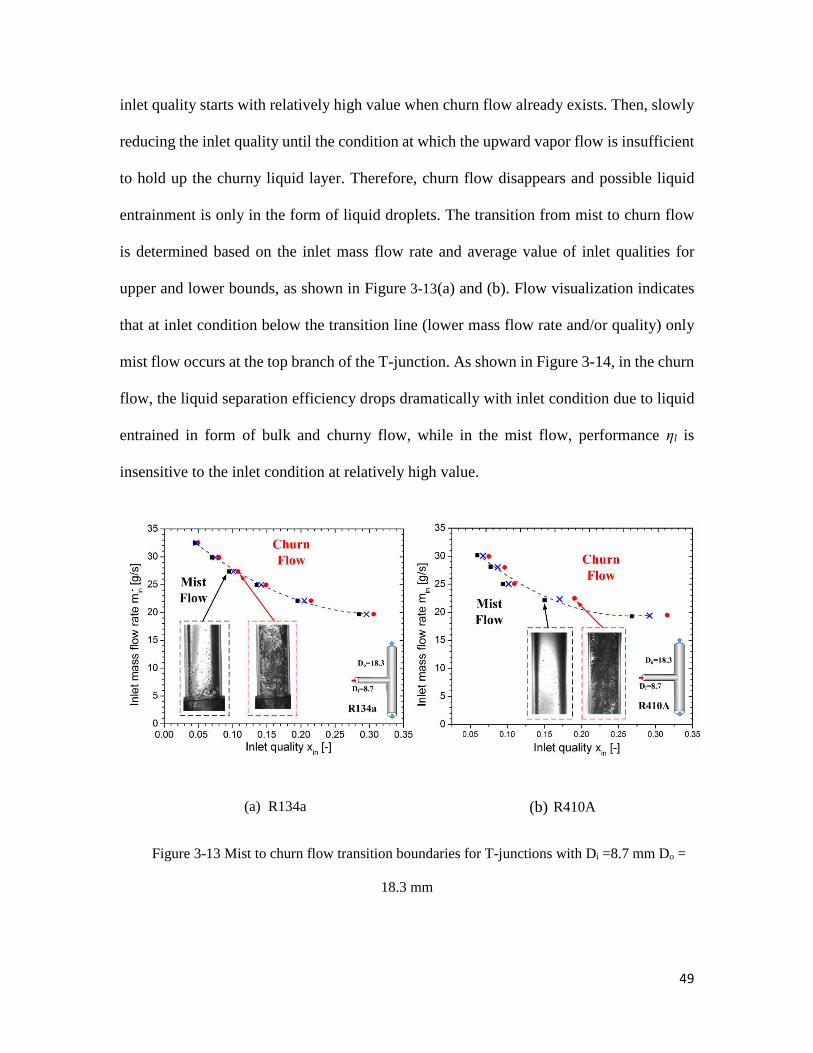
49
inlet quality starts with relatively high value when churn flow already exists. Then, slowly
reducing the inlet quality until the condition at which the upward vapor flow is insufficient
to hold up the churny liquid layer. Therefore, churn flow disappears and possible liquid
entrainment is only in the form of liquid droplets. The transition from mist to churn flow
is determined based on the inlet mass flow rate and average value of inlet qualities for
upper and lower bounds, as shown in Figure 3-13(a) and (b). Flow visualization indicates
that at inlet condition below the transition line (lower mass flow rate and/or quality) only
mist flow occurs at the top branch of the T-junction. As shown in Figure 3-14, in the churn
flow, the liquid separation efficiency drops dramatically with inlet condition due to liquid
entrained in form of bulk and churny flow, while in the mist flow, performance ηl is
insensitive to the inlet condition at relatively high value.
(a) R134a (b) R410A
Figure 3-13 Mist to churn flow transition boundaries for T-junctions with Di =8.7 mm Do =
18.3 mm

50
(a) R134a (b) R410A
Figure 3-14 Liquid separation efficiency at mist and churn flow patterns
3.3.5 CORRELATION FOR MIST TO CHURN FLOW TRANSITION IN
VERTICAL IMPACT T-JUNCTIONS
When mist flow turns into churn above the junction: 1) sufficient liquid diverts upward
against gravity; 2) strong vapor flow exerts interfacial force to hold up the churn liquid
above the junction. Thus, two dimensionless numbers are used as an attempt to characterize
that situation. The first parameter is Froude number Fr which in general represents the ratio
of inertia to gravity forces. During liquid separation in T-junctions, the quantity of liquid
spreading upward after impingement is mainly governed by gravity and inertia forces, since
the former intends to pull down the liquid into the bottom branch while the latter has a
great effect on liquid splashing. In this case, the vapor phase Froude number is used and
defined as follows:

51
( )
2in in
v i
ol v o
v
G x
DFr
DD g
ρρ ρ
ρ
=
− (3-10)
Where Gin and xin denote the inlet mass flux and quality, ρl and ρv denote liquid and
vapor densities, and Di and Do are diameters of the inlet and outlet tubes. It should be noted
that diameter ratio of Di/Do is also taken into account since the flow area in each tube is
different.
The second parameter is Lockhart-Martinelli parameter Xtt. It is typically used to
represent vapor liquid phases force interaction in two-phase flow and defined as follows:
0.5 0.1 0.91v l in
l v in
xXtt
x
ρ µρ µ −=
(3-11)
Where µl and µv denote dynamic viscosities for liquid and vapor refrigerant. It should
be pointed that Xtt is in turbulent-turbulent form considering the highly agitated churn flow
as observed in the experiment.
Figure 3-15 shows proposed correlation for transition from mist to churn flow regime
as a function of Fr and Xtt parameters for two different outlet tube diameters (18.3 and 13.4
mm) and two different refrigerants (R134a and R410A). So, in the range of fluids and
conditions explored well designed separator should have Fr<0.168 Xtt-0.67.

52
Figure 3-15 Proposed correlations of churn flow transition for vertical impact T-junctions
3.3.6 BUBBLE SEPARATION REGION AT THE DOWNWARD BRANCH
TUBE IN THE T-JUNCTION
In order to feed liquid only into the microchannel evaporator, a liquid column with a
certain height should be maintained in the downward branch of T-junction separators
serves as a barrier against bubble entrainment. Figure 3-16shows the bubble penetration
depth in the liquid column as a function of the inlet mass flow rate and quality, based on
experiments in this study with R134a. The depth increases with the inlet mass flow rate but
decreases with the quality. Particularly, the maximum penetration depth at each flow rate
occurs at the quality equal to zero, i.e. only liquid entering the separator. This trend implies
that the dispersed bubble is mainly created by the aeration effect when the separated liquid
jet hits and merges with the liquid column.
Such phenomenon is well explained and comprehensively reviewed by Bin (1993).
Typically, the liquid jet has disturbances on their surfaces due to Kelvin-Helmholtz

53
instability. After hitting the liquid column, the jets create small depression on the free
surface of the liquid column. When disturbances on the jet surface reach the depressions,
the surface deformation, and the resulting formation and closure lead to vapor entrainment
at the plunging point. The maximum penetration depth is reached as the buoyancy force
counteracts the momentum of the submerged jet. In this mixing region, some fine bubbles
may grow up by coalescence and escape sideways until they are free to rise to the liquid
surface, while others may just recirculate with intermittent breakage and coalescence.
Previous research found that the stable bubble diameter and the penetration depth strongly
depends on the volumetric flow rate and velocity of the plunging liquid (Evans et al., 1992).
Higher flow rate and/or injecting velocity will create greater submerged jet momentum and
corresponding higher energy dissipation rate in the mixing region, which in turn results in
the smaller aerated bubbles and deeper penetration. As shown in Figure, the penetration
seems deeper with more but smaller aerated bubbles. At the same mass flow rate, the
increase in quality will reduce the volumetric flow rate of the downward plunging liquid
due to 1) lower liquid flow rate at T-junction inlet and 2) greater liquid carryover by the
upward vapor flow. Thus, the penetration depth becomes smaller in the quality range
explored in this study. Thus, it can be seen in Figure 3-18that the penetration depth slightly
decreases with the inlet quality.
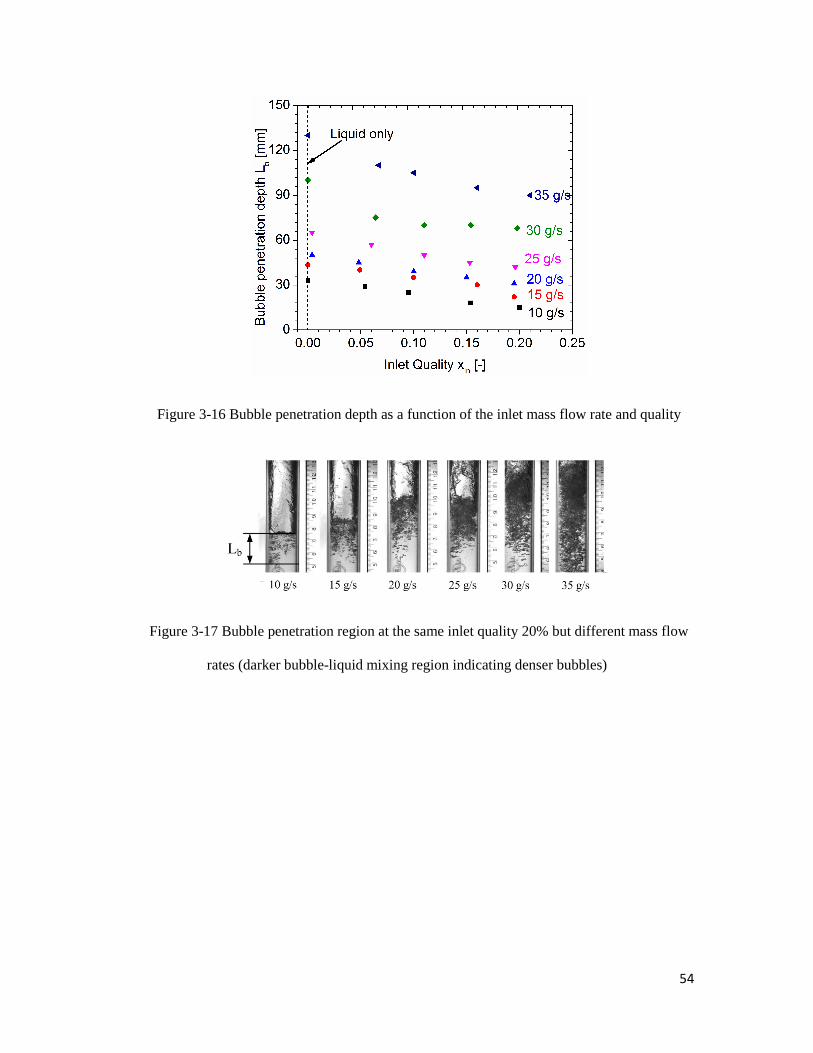
54
Figure 3-16 Bubble penetration depth as a function of the inlet mass flow rate and quality
Figure 3-17 Bubble penetration region at the same inlet quality 20% but different mass flow
rates (darker bubble-liquid mixing region indicating denser bubbles)

55
Figure 3-18 Bubble penetration region at various inlet qualities but the same mass flow rate
25 g/s
3.4 DESIGN OPTIONS TO ENHANCE VAPOR-LIQUID
SEPARATION
3.4.1 OVERVIEW OF FLOW PATTERNS IN T-SEPARATORS
The previous section characterizes typical flow patterns in such vertical impact T-
separators using R134a and R410A as working fluids. Critical conditions when
considerable liquid entrainment occurs (or imperfect liquid separation) were identified.
Design criteria are presented, based on conditions when misty flow turns in churn flow
regime. Figure 3-19 summarizes and depicts observed flow patterns at different regions of
T-separator.

56
Figure 3-19 Overview of flow patterns in a vertical impact T-junction
Since the T-separator inlet is directly connected to the expansion device, two-phase
flow is in developing state with four distinct regions as flow proceeds along the tube
(Bowers and Hrnjak, 2009): well mixed (homogeneous), separating, separated but
developing, and finally developed regions. To facilitate vapor-liquid separation in the
vertical tube, separated flow pattern is preferred. Previous work shows that separated flow
pattern in inlet tube only is insufficient to fully separate liquid flow at high liquid mass
flow rate. The situation in the vertical tube could be divided into three different regions.
The impact region is where two phase flow enters the junction of inlet and vertical tubes.
The incoming jet impinges and splashes on the vertical wall, some liquid is initially
diverted upward against gravity due to the inertia and drag force. This portion of liquid will
be separated in the liquid separation region right above the impact region, and the gravity
is the main drive. Previous results revealed that liquid separation efficiency is related to
the localized flow pattern. In the mist flow the liquid may be carried over as droplets with

57
generally insignificant mass compared to that fell to the downward branch, thus resulting
in good separation performance. In churn flow, liquid phase is built up in the top branch in
the form of churny and highly agitated structure which is primarily entrained by vapor flow.
The efficiency degrades dramatically. The transition from mist to churn flow requires: 1)
sufficient liquid flow diverted upward from the impact region; 2) sufficient upward vapor
flow to hold up and entrain the liquid. Thus, to enhance the separation performance, liquid
refrigerant should be initially directed toward the designated outlet (bottom branch) as
much as possible at the impact region, and local vapor velocity as well as resultant drag
force on liquid should be reduced in the liquid separation region. The vapor separation
region is below the impact region in the bottom branch tube. A liquid column with a certain
height serves as a barrier against vapor entrainment. Plunging liquid jet creates the
dispersed bubbles in the liquid column via aeration effect. The bubble penetration depth
strongly depends on liquid mass flow rate and plunging momentum.
Additional methods should be used to expand the operating range of the T-separator in
a compact design and they will be presented below:
1. Inlet angle inclination (θ = 0°, 15°, 30°, 45°)
2. Pre-separation via dual inlets
3. Relative diameter of inlet to outlet tubes (Di/Do = 0.475 , 0.563, 0.656)
4. Shape of inlet tube (round and flat)

58
3.4.2 EFFECT OF ANGLE OF INCLINATION OF INLET TUBE
Figure 3-20 Effect of inlet angle of inclination on liquid separation efficiency, 30 g/s
Figure 3-21 Flow separation at varied angles of inclination for �� ��= 30 g/s and xin =15%
It was expected that inclining inlet tube in direction of the gravity will enhance its
effects at lower angles, while at some angle efficiency will start deteriorating. Initial CFD
analysis was performed for four angles: 0°, 15°, 30°, and 45° at the same inlet mass flow
rate of 30 g/s. Some other flow rates were explored in limited range of angles. As shown
in Figure 3-20, inclination results in better liquid separation performance up to an
efficiency maximizing angle (here 45°). The improvement comes from two effects. First,
along the inclined tube, the inlet liquid jet has a downward component of the momentum,
same as the gravity and therefore it can be expected that after impacting less of the liquid

59
flow will be diverted to the top at the impact region, which in turn significantly reduces the
possibility of the transition to the churn flow regime. Comparing the flow images at the
inlet junction as shown in Figure 3-21, it can be seen that at the same inlet conditions (�� ��
= 30 g/s, xin =15%) the agitated churny liquid layer disappears when the angle increases up
to 30º. Second, the inclination angle reduces the liquid jet splashing effect and therefore
the generation of liquid ligaments and droplets because of lower normal velocity and less
dynamic impact of the liquid jet to the vertical tube wall.
3.4.3 EFFECT OF PRE-SEPARATION
Separated flow at the junction inlet is preferred to other developing regimes, since such
flow pattern will reduce the vapor-liquid phase interaction and therefore improve liquid
separation in the impact region. Dual inlet, as one of the possible configurations is utilized
in the T-junction with inlet inclination angle of 30º to enhance the separated flow pattern.
Figure 3-22 Illustration of pre-separation at the first junction
Figure 3-22 illustrates the pre-separation at the first junction that connects both upper
and main inlets. Due to downward gravity and relatively strong inertia force of liquid
refrigerant, vapor phase will mainly take off to the upper inlet, while the remaining liquid

60
rich flow will enter the main inlet. The liquid separation will be improved because: 1) liquid
jet entering the junction has lower velocity and thus smaller inertia force; 2) the local
upward vapor flow at the main junction will be reduced; 3) phase interaction will be weaker
after impingement due to separated flow pattern. As shown in Figure 3-23 the liquid
separation efficiency is higher for the dual inlet separator especially at mass flow rate of
35 g/s. Figure 3-24 compares the flow pattern at the main inlet for two T-junctions at the
same inlet condition. Clearly, for the single inlet a great amount of liquid droplets and films
are entrained by core vapor flow above the liquid layer at the bottom portion of the tube
while the flow pattern for the dual inlet appears much more stratified/wavy. Besides, churn
flow does not occur when vapor flow is pre-separated upstream. In principle, multiplication
of the separation junction would be beneficial. Infinite number of separation junctions
(inlets) results in the continuous separation along the main inlet tube.
Figure 3-23 Effect of pre-separation on liquid separation efficiency

61
Figure 3-24 Comparison of flow patterns at main junctions with and without pre-
separation for�� ��= 35 g/s and xin =15%
3.4.4 EFFECT OF THE DIAMETER RATIO (DI/DO)
Another option to reduce the liquid inertia force at the inlet to the impact region is to
increase the diameter of the inlet tube. Figure 3-25shows the variation of the liquid
separation efficiency with three different diameter ratios. For each condition the liquid
separation increases with the inlet tube diameter but of different magnitudes, since the
incoming liquid jet is slowed down, and there is less splashing. Gravity is able to pull down
more liquid against the reduced liquid inertia force. As shown in Figure 3-26, at the same
inlet condition of 35g/s and quality 15%, the flow pattern at the inlet tube near the junction
appears more stratified and churn flow condition does not occur in the top branch tube of
the T-junction with a greater diameter ratio of 0.656, since less quantity of the liquid flow
diverts upward after impacts.

62
Figure 3-25 Effect of diameter ratio on the liquid separation efficiency
Figure 3-26 Comparison of the flow pattern in T-junctions with different diameter ratios
at the inlet condition of 35 g/s, and 15%

63
Figure 3-27 Illustration of the liquid blockage on the flow area for the upward vapor flow
But, the efficiency is increased only up to 5% at the explored condition and the
improvement becomes insignificant as quality increases. This is mainly due to the
increased liquid-vapor phase interaction at the splitting region. This phenomenon is
illustrated in Figure 3-27that sketches the liquid jet enters the cross section of the vertical
tube. At a larger diameter ratio, the liquid jet with a wider shape from the inlet tube will
inevitably take over more cross sectional area of the vertical tube. Thus, the remaining area
available for upward vapor flow is reduced, which in turn results in stronger vapor liquid
phase interaction and consequently more liquid entrained by vapor flow towards the top
outlet. This negative effect will be further confirmed by the following section.
3.4.5 EFFECT OF THE SHAPE OF INLET TUBE
Figure 3-28 compares a T-junction separator with flat inlet (rectangular) to the round
inlets with diameter ratios of0.475 and 0.656. The flat inlet has the identical cross sectional
area with the small round inlet but only half of the large one. At the separation load of
35g/s and 20% quality, larger diameter ratio improves the efficiency only by 1% - 2%,
while the flat inlet increases the efficiency from 92% up to 98%. Comparing the flow
patterns shown in Figure 3-29 reveals that for the flat inlet the most of the incoming liquid

64
diverts into the downward branch, resulting in a mist flow and thus higher liquid separation
efficiency. The difference is mainly because the flat inlet confines the incoming liquid jet
in a shape of liquid sheet. Its width is expected to be similar as the tube width. More free
flow area in the vertical tube is left for upward vapor flow, thus reducing the vapor-liquid
interaction and liquid entrainment at the splitting region.
Figure 3-28 Effect of cross section shape of the inlet tube on the liquid separation
efficiency
Figure 3-29 Flow pattern at the T-junction with different inlet tube shapes at
condition of 35 g/s and 20%

65
3.4.6 EFFECT OF THE INLET TUBE LOCATIONS: CENTERED VS.
TANGENTIAL
Figure 3-30 shows the liquid separation efficiency for T-junctions with centered and
tangential inlet configurations. Compared to centered inlet, the tangential inlet provides a
swirling motion and the vapor-liquid phases are separated due to the centrifugal and
gravitation forces. In the conventional centrifugal separators for oil or similar with low
liquid load, the liquid that needs to be separated is typically in dispersed droplets with
different sizes. The centrifugal force intends to deposit the denser liquid on the wall. In
our case where the liquid mass fraction is as high as 75 ~ 90% and the supplied liquid is
mainly present in jet, the improvement in the separation performance is mainly because:
1) tangential inlet further confines the incoming liquid within a flat sheet and provides
a swirling motion to keep the liquid flow attached to the inner wall of the vertical tube after
impingement, thus reducing the vapor and liquid force interaction at the junction;
2) liquid splashing and bouncing is reduced since the liquid sheet enters the junction in
a tangential direction while for the centered inlet, the liquid impacts in a normal direction.
As shown in Figure 3-31, in the T-junction with flat tangential inlet, most of liquid diverts
downward and churn flow does not appear above the junction even at the highest mass
flow rate (35g/s) that represents capacity of around 6 kW.

66
Figure 3-30 Effect of inlet location on the liquid separation efficiency
Figure 3-31 Flow pattern at the T-junction with different inlet locations at 35 g/s and 20%
3.5 SUMMARY AND CONCLUSIONS
This chapter presents experimental study of vapor-liquid refrigerant separation in
vertical impact T-junctions for vapor compression system with flash gas bypass method.
R134a and R410A are chosen as working refrigerant, and inlet mass flow rate and quality
are varied approximately from 10 g/s to 40 g/s and from 10% to 25% with intention to
simulate operation in air-conditioning systems with cooling capacities in a range of about
1.5 to 6 kW. A few conclusions can be drawn as follows:

67
1. Liquid separation efficiency depends on the inlet conditions and the flow pattern
right above the tube junction. When mist flow exists, liquid is primarily entrained as
droplets through the top exit. The efficiency is relatively high, above 98%, and insensitive
to the variation of the inlet quality. When churn flow regime forms at the junction, the
efficiency dramatically reduces with increase of inlet mass flow rate and/or quality.
2. An empirical correlation for churn flow transition as a function of Fr and Xtt was
proposed (Fr=0.168 Xtt-0.67) based on experimental results for two refrigerants and T-
junctions with two different diameter ratios. It could be used as criterion for maximum
allowed conditions that helps design of the compact T junction separators.
3. As the downward angle of inclination (θ) increases from 0º (horizontal) to 45º, liquid
separation is enhanced because the downward component of inlet velocity facilitates liquid
separation and lower normal velocity reduces the impacts of liquid jet with the vertical wall
and therefore secondary droplets generation.
4. Dual inlet configuration introduces pre-separation of vapor refrigerant at the first
junction. Liquid rich flow entering the impact region has much lower velocity and inertia
force, as it is observed that flow pattern becomes more stratified.
5. Larger diameter of the inlet tube improves the separation efficiency, but the
improvement is limited (within 5% in the explored conditions) because wider liquid jet in
the larger inlet tube blocks the free flow area of the vapor flow and intensifies the vapor-
liquid phase interaction at the impact region.
6. T-junction with flat (rectangular) inlet shows superior performance over those with
circular inlet, up to 8% higher than the same size circular tube and even 6% higher than

68
double large circular one. This is because flat tube confines incoming liquid flow in a thin
jet, thus leaving more free flow area for the upward vapor flow and resulting lesser vapor-
liquid interaction.
7. The tangential flat inlet configuration further increases liquid separation efficiency
because 1) the swirling motion further confines liquid in a flat sheet at the impact region,
thus reducing vapor-liquid force interaction; 2) tangential flow reduces the liquid splashing
and bouncing as the impact angle of liquid to the wall is close to 0º.

69
Chapter 4 EFFECT OF FLASH GAS BYPASS
APPROACH ON R134A A/C SYSTEM WITH A
MICROCHANNEL EVAPORATOR
4.1 INTRODUCTION
This chapter presents experimental and numerical study on the effects of flash gas
bypass (FGB) approach on performances of an R134a mobile air-conditioning system with
a parallel flow microchannel evaporator modified to be single pass and single slab. An
experimental comparison to the direction expansion (DX) system demonstrates that the
system in FGB mode produces about 13% to 18% more cooling capacity and 4% to 7%
higher COP than DX mode when operating at the same compressor speed. When the
compressor speed was adjusted to maintain the same cooling capacity, the COP improved
37% to 55%. Two main benefits are identified and discussed: 1) improved refrigerant
distribution and 2) reduction of refrigerant pressure drop. In addition, FGB effects on the
evaporator heat transfer and pressure drop reduction is investigated by a simplified
evaporator model.

70
4.2 EXPERIMENTAL APPARATUS AND METHODS
4.2.1 EXPERIMENTAL FACILITY
In this section, experimental facility and the components of the R134a mobile air-
conditioning system are described in details. Figure 4-1 illustrates the diagram of the
experimental setup for the mobile air-conditioning system, while Figure 4-2 shows a
photograph of the facility. It consists of a fixed displacement variable speed swash-plate
compressor, a microchannel condenser with an integrated receiver, a manually-controlled
electric expansion valve, and a microchannel evaporator. All components are taken from a
major brand, mid-size car, except that the original six-pass and two-slab microchannel
evaporator (about 0.07 m2 face area and 3.2 m2 total air-side surface area) is replaced by
the current one with single-pass and single-slab design. It was done to maintain the
improved refrigerant distribution achieved by FGB method, since the refrigerant is only
distributed once in the inlet header. The detailed geometries of two microchannel
evaporators are compared and listed in Table 4-1. The tested evaporator consists of totally
34 parallel tubes with the face area of about 0.094 m2 and total air-side surface area of
about 2.1 m2; each tube is 275 mm long and has 19 ports with the hydraulic diameter of
about 0.8 mm. The microchannel condenser has totally 40 parallel tubes with the face area
of about 0.29 m2 and total air-side surface area of about 5.86 m2. The compressor consists
of six cylinders, each of which has a displacement of about 25 cm3 (see Figure 4-4).
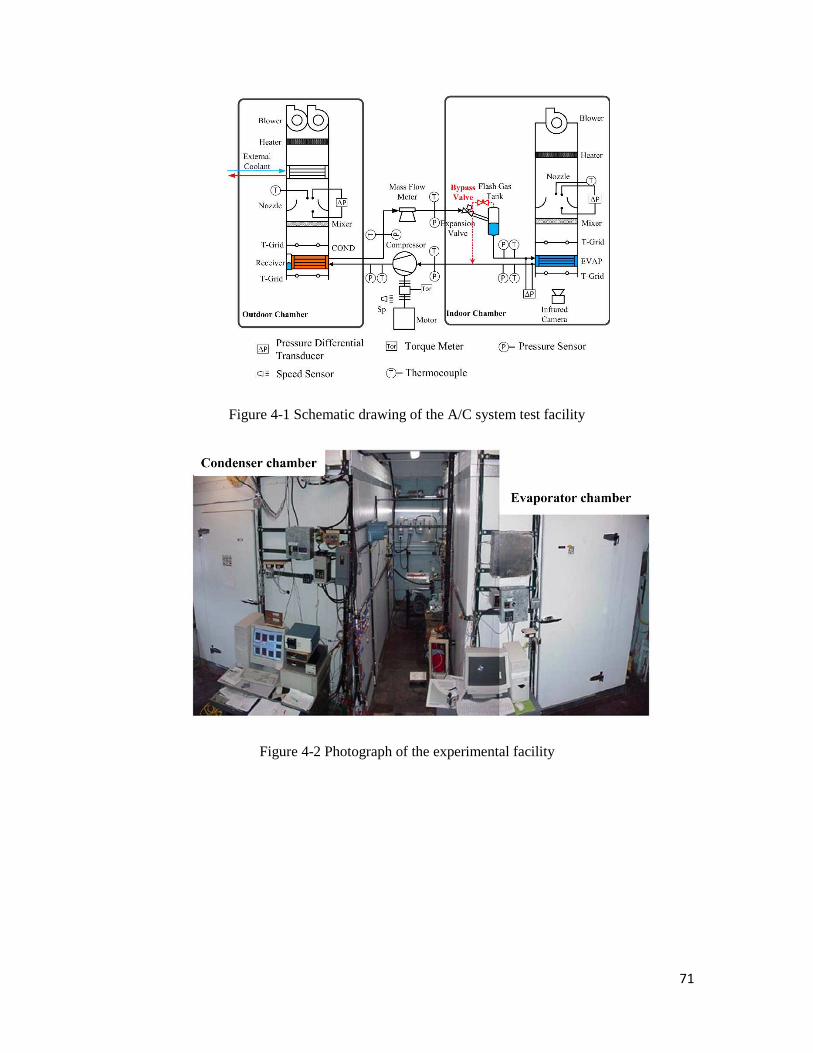
71
Figure 4-1 Schematic drawing of the A/C system test facility
Figure 4-2 Photograph of the experimental facility
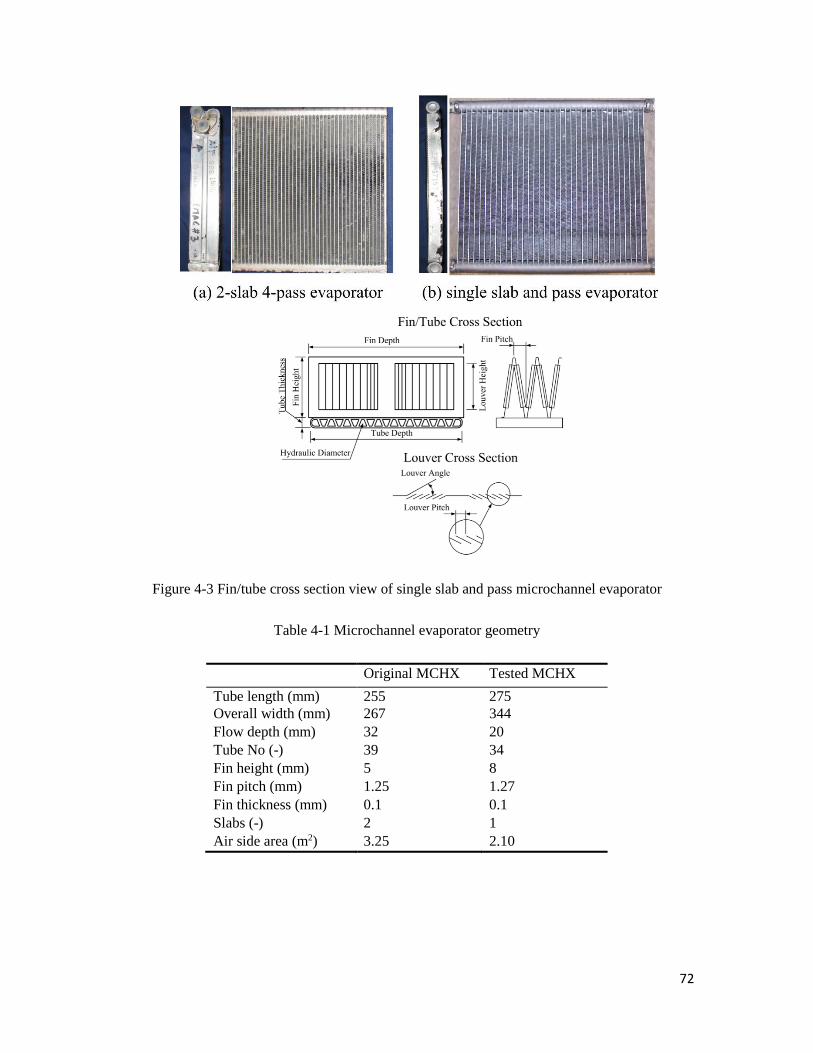
72
Figure 4-3 Fin/tube cross section view of single slab and pass microchannel evaporator
Table 4-1 Microchannel evaporator geometry
Original MCHX Tested MCHX
Tube length (mm) 255 275 Overall width (mm) 267 344 Flow depth (mm) 32 20 Tube No (-) 39 34 Fin height (mm) 5 8 Fin pitch (mm) 1.25 1.27 Fin thickness (mm) 0.1 0.1 Slabs (-) 2 1 Air side area (m2) 3.25 2.10

73
Figure 4-4 Electronic expansion valve and swash-plate compressor used in this study
Figure 4-5 Microchannel condenser used in this study
Figure 4-6 shows the detailed setup of microchannel evaporator with the
implementation of flash gas bypass approach. This A/C system can operate in two different
modes. When the bypass valve is fully closed, system operates in a conventional direct
expansion (DX) mode. In this case, two-phase refrigerant generated during the expansion
process flows into the microchannel evaporator. On the other hand, when the bypass valve
is properly open, flash vapor is separated in the transparent flash gas separator and then
bypassed to the suction line. In this case, the system operates in the FGB mode, feeding
the evaporator with only single phase liquid.
As compared in Table 4-1, the tested evaporator is slightly smaller than the original
one used in this A/C system and has no distributor embedded in the inlet header. Both of
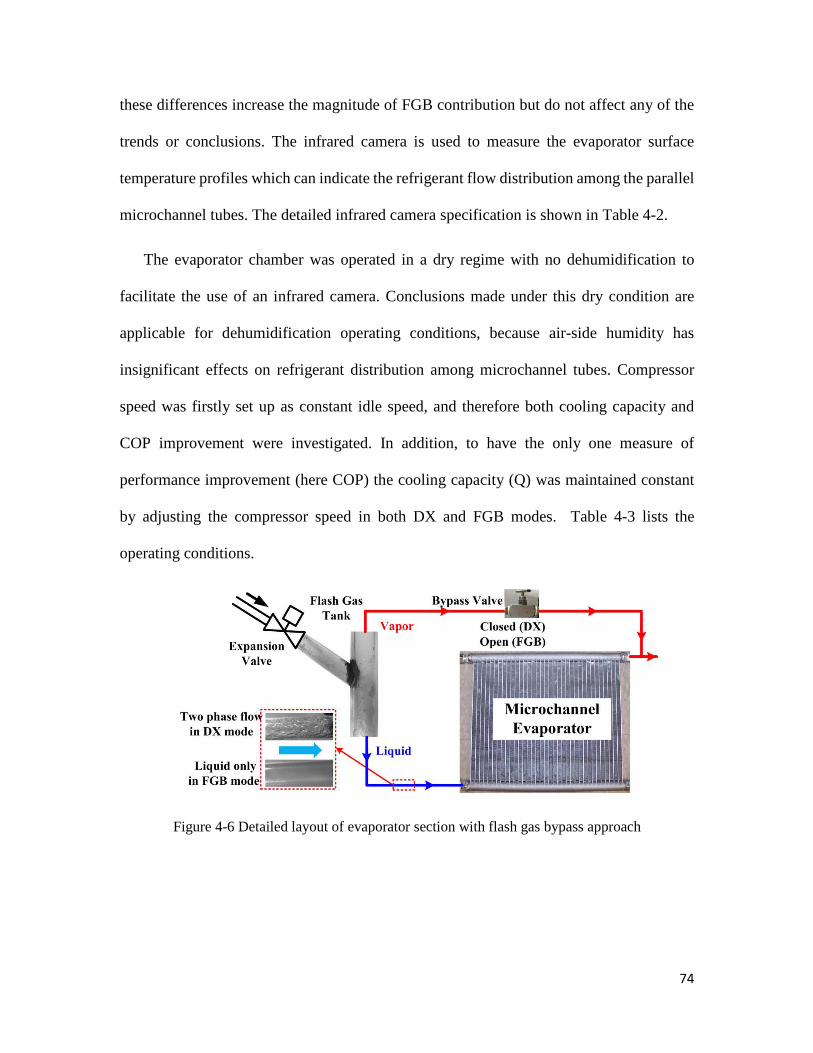
74
these differences increase the magnitude of FGB contribution but do not affect any of the
trends or conclusions. The infrared camera is used to measure the evaporator surface
temperature profiles which can indicate the refrigerant flow distribution among the parallel
microchannel tubes. The detailed infrared camera specification is shown in Table 4-2.
The evaporator chamber was operated in a dry regime with no dehumidification to
facilitate the use of an infrared camera. Conclusions made under this dry condition are
applicable for dehumidification operating conditions, because air-side humidity has
insignificant effects on refrigerant distribution among microchannel tubes. Compressor
speed was firstly set up as constant idle speed, and therefore both cooling capacity and
COP improvement were investigated. In addition, to have the only one measure of
performance improvement (here COP) the cooling capacity (Q) was maintained constant
by adjusting the compressor speed in both DX and FGB modes. Table 4-3 lists the
operating conditions.
Figure 4-6 Detailed layout of evaporator section with flash gas bypass approach

75
Figure 4-7 Infrared camera used to measure evaporator surface temperature
Table 4-2 Infrared camera specification
Item Camera model Thermal Trace Spectral Range Long wave Resolution 320×240 Measurement accuracy 275 Measurement range -40 to 350 °C Field view 29×22°
Table 4-3 Operating conditions
Items Unit Condenser side Evaporator Air inlet ºC 35 35 Air volume flow m3/s 0.342 0.203 Relative humidity - - Dry condition Compressor speed rpm 900 (only for fixed speed)
4.2.2 DATA REDUCTION AND UNCERTAINTY ANALYSIS
Both a refrigerant-side energy balance (Qref) and an air-side energy balance (Qair) are
used to calculate system capacities. It should be noted that in the FGB mode where only
single phase liquid enters the evaporator, the refrigerant side energy balance is based on
the flow rate of single phase liquid and its enthalpy difference between the inlet liquid and
superheated refrigerant at the outlet as shown in Equation (5-1a). In the DX mode,
conventional method for capacity calculation is used.
, ( )ref DX ref eri eroQ m h h= −& (4-1a)
, (1 )( )ref FGB ref in liq eroQ m x h h= − −& (4-1b)

76
( )air air eai naQ m h h= −& (4-2)
Where heri, hero, hliq denote refrigerant enthalpy at the evaporator inlet, outlet and liquid
enthalpy based on evaporator inlet pressure. heai, hna denote evaporator air inlet and nozzle
outlet enthalpy. The system capacity is based on an average value of the two energy
balances:
2
ref airQ QQ
+= (4-3)
Compressor speed VC and torque FC applied on the compressor shaft are also measured
with compressor work calculated as:
C C CW F V= (4-4)
The coefficient of performance (COP) is then as:
C
QCOP
W= (4-5)
The uncertainties for the calculated system parameters, namely the cooling capacity,
compressor power, and COP are calculated using the method given by Moffat (1988).
According to this method, the function U is assumed to be calculated from a set of N
measurements (independent variables) represented by
1 2 3( , , ,..., )NU U X X X X= (4-6)
Then the uncertainty of the result U can be determined by combining the uncertainties
of the individual terms using a root-sum-square method, i.e.
2
1
N
ii i
UU X
Xδ δ
=
∂= ∂ ∑ (4-7)

77
Using uncertainties for measured variables presented in Table 4-4, the uncertainties of
the calculated parameters are determined. The total uncertainties of Q and COP are
estimated to be 3.3% and 3.6%, respectively. For the system operating in both modes,
independently obtained air and refrigerant side energy balances were available and agreed
within 3% as shown in (Figure 4-8). During the operation in the FGB mode, the bypass
valve was manually controlled to maintain a certain liquid level in the flash gas separator.
Thus, only the vapor refrigerant is fully separated and bypassed to the suction line while
on the liquid line to the evaporator only liquid refrigerant is observed through the
visualization.
Table 4-4 Measured uncertainties
Measurement Unit Uncertainty Refrigerant pressure kPa ±3.56 Refrigerant pressure drop kPa ±1.52 Nozzle pressure drop Pa ±6.5 Temperature °C ±0.5 Refrigerant mass flow rate g/s ±0.5% Compressor speed rpm ±5 Compressor torque N·m ±0.05
Figure 4-8 Air and refrigerant side cooling capacities

78
4.3 EXPERIMENT RESULTS
4.3.1 CHARGE DETERMINATION TEST
The first step in performing an analytical comparison between the two modes of
operation is the determination of optimal refrigerant charge. Although optimal charge is
determined when both capacity and COP reach their maxima, this coincidence is seldom
perfect as Figure 4-9illustrates. The optimum is typically when the subcooling reaches a
plateau. Two independent charge determination tests were performed for the baseline DX
mode and the FGB mode as shown in Figure 4-9 (a) and Figure 4-9 (b). For this A/C system,
the refrigerant charge is higher than that for a practical system using the identical
components, as the refrigerant lines between components are longer. For the baseline DX
mode, refrigerant subcooling at the condenser outlet is observed to reach a plateau at a
charge of approximately 1375g to 1425g. The plateau region for the FGB mode, on the
other hand, occurs at a larger charge of about 1600g to 1650g. The additional 225g of
refrigerant charge is primarily attributed to the flash gas tank. In addition, only liquid phase
refrigerant occupies the volume of the inlet header and pipe line between the flash tank and
evaporator since flash vapor is bypassed. Nevertheless, the high side receiver can be
removed in the FGB mode since the flash gas separator would work as an accumulator.
Thus, refrigerant charge may not be necessarily higher in an optimized FGB system than
that for a DX system. Additionally, a compact flash gas separator could also help to reduce
the charge. In a practical system, the middle point of this plateau region is chosen. Thus,
the optimal charge amounts for DX and FGB modes are 1400 g and 1625 g which are used
in the later system performance tests.

79
Figure 4-9Determination of the optimal refrigerant charge (a) DX mode; (b) FGB mode
4.3.2 SYSTEM PERFORMANCE AT THE FIXED COMPRESSOR SPEED
The system in DX and FGB modes was tested and compared at the same compressor
speed. A manually controlled electronic expansion valve (EXV) controlled the compressor
suction superheat in a range of 5 ºC to 20 ºC.
Figure 4-10shows the cooling capacity and COP for both modes. The FGB mode
produces about 18% to 13% higher cooling capacity at 7% to 3% higher COP than the
baseline DX mode in the explored operating conditions. On the same p-h diagram, Figure
4-11 compares DX and FGB modes at the same compressor inlet superheat of about 15 ºC
and at the fixed compressor speed of 900 rpm. It can be seen that the suction pressure is
approximately 39 kPa higher in the FGB mode than in the DX mode. The refrigerant vapor
density at the compressor inlet is increased, resulting in a higher refrigerant mass flow rate
at the fixed compressor speed. Consequently, higher cooling capacity is obtained in FGB
mode.

80
The increase in evaporator exit pressure is mainly because in the FGB mode: 1) the
elevation of the evaporating pressure; 2) the reduced pressure drop across the microchannel
evaporator. The increase of the evaporator exit pressure (Pero,FGB – Pero,DX) and the pressure
drop reduction in the evaporator (∆Pevap,DX– ∆Pevap,FGB) as a function of compressor inlet
superheat are shown in the bar chart (Figure 4.X). Their difference represents the elevation
of the evaporator inlet saturation pressure (evaporating pressure). Clearly, the evaporating
pressure elevation contributes more to the suction pressure increase than the evaporator
pressure drop reduction.
Figure 4-10 Cooling capacity and COP in FGB and DX modes at the same compressor speed
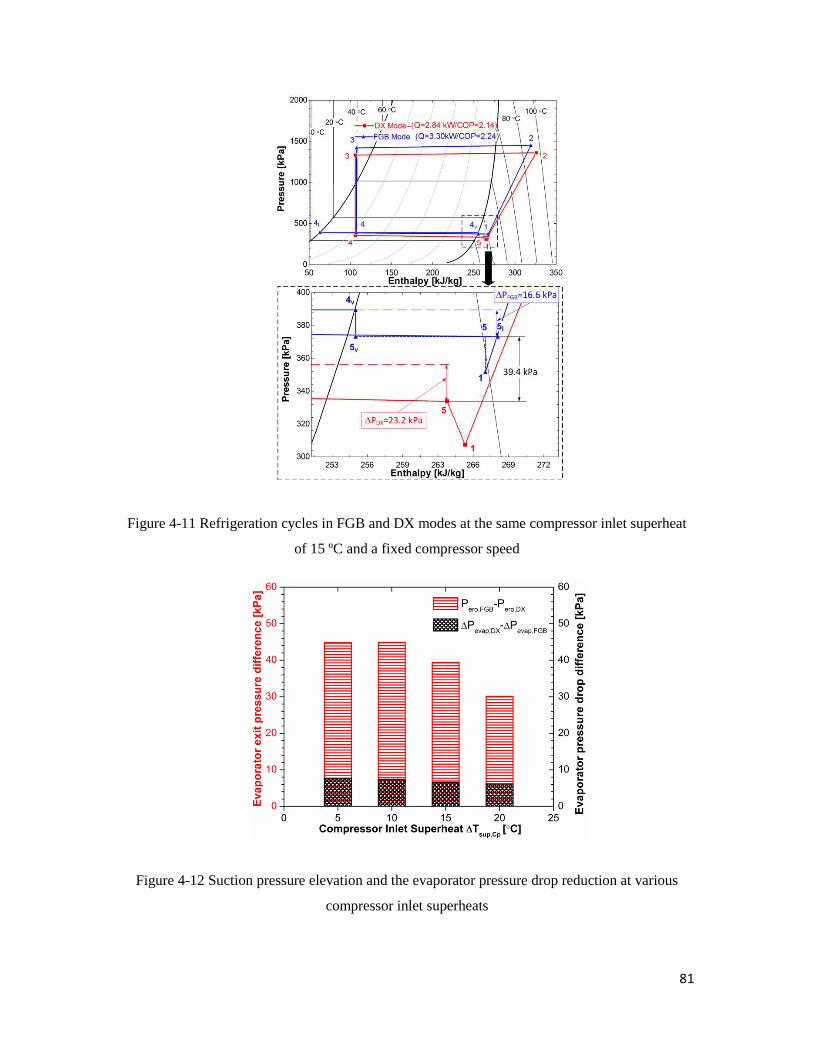
81
Figure 4-11 Refrigeration cycles in FGB and DX modes at the same compressor inlet superheat
of 15 ºC and a fixed compressor speed
Figure 4-12 Suction pressure elevation and the evaporator pressure drop reduction at various
compressor inlet superheats
82
4.3.3 FGB FIRST BENEFIT: IMPROVED REFRIGERANT DISTRIBUTION
Distribution of refrigerant among parallel tubes is evaluated here using non-intrusive
infrared images. Metric was the rating parameter φas defended in Bowers et al. (2010). The
parameter φis based on average evaporator surface temperature:
iiso
TT
N M=
×∑ (4-8)
Where N and M are number of image pixels at each row and column.
Once Tiso is determined for a given infrared image, the image is divided into columns
of pixels. For each column i, the number of pixels with temperature below Tiso defines a
height (Hi) and therefore the average height of all the columns (Havg) can be found. The
distribution rating parameterφis defined as follows:
112
N
i avgi
avg
H H
nHφ =
−= −∑
(4-9)
The distribution of liquid refrigerant mass flow through each channel would be very
difficult to directly measure. The evaluation of distribution using IR camera measuring
evaporator surface temperature has been used by many authors (Elbel and Hrnjak, 2004;
Qi et al., 2009; Bowers et al., 2010 and 2012; Shi et al., 2011; Tuo and Hrnjak, 2011; Tuo
and Hrnjak, 2012; Tuo et al., 2012). Figure 4-13 shows the evaporator surface temperatures
in DX and FGB modes at the same compressor speed as a function of compressor inlet
superheat. In the DX mode, a large red area (high surface temperatures – almost equal to
the air inlet temperature) on the right side of the evaporator presents a superheated zone
where the tubes receive much lesser liquid refrigerant than those on the left side (lower
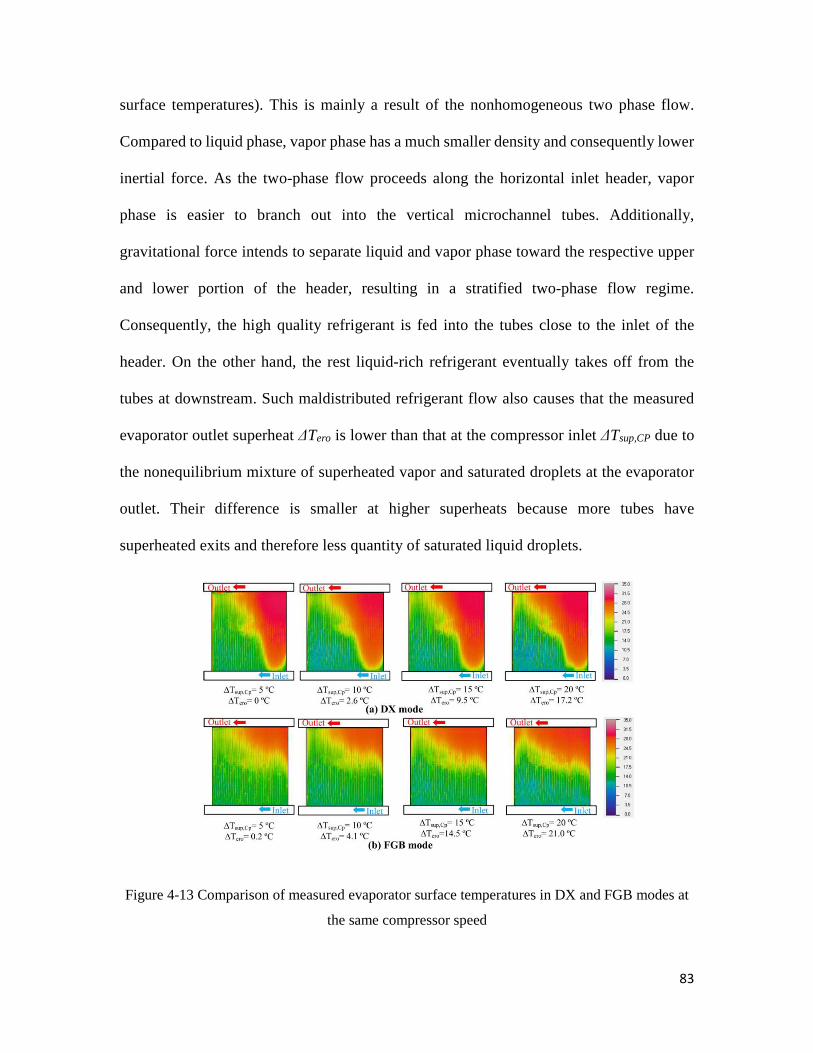
83
surface temperatures). This is mainly a result of the nonhomogeneous two phase flow.
Compared to liquid phase, vapor phase has a much smaller density and consequently lower
inertial force. As the two-phase flow proceeds along the horizontal inlet header, vapor
phase is easier to branch out into the vertical microchannel tubes. Additionally,
gravitational force intends to separate liquid and vapor phase toward the respective upper
and lower portion of the header, resulting in a stratified two-phase flow regime.
Consequently, the high quality refrigerant is fed into the tubes close to the inlet of the
header. On the other hand, the rest liquid-rich refrigerant eventually takes off from the
tubes at downstream. Such maldistributed refrigerant flow also causes that the measured
evaporator outlet superheat ∆Tero is lower than that at the compressor inlet ∆Tsup,CP due to
the nonequilibrium mixture of superheated vapor and saturated droplets at the evaporator
outlet. Their difference is smaller at higher superheats because more tubes have
superheated exits and therefore less quantity of saturated liquid droplets.
Figure 4-13 Comparison of measured evaporator surface temperatures in DX and FGB modes at
the same compressor speed

84
Figure 4-14 Comparison of distribution rating parameter φin DX and FGB modes at the same
compressor speed
In the FGB mode, the size of the superheated zone is significantly reduced and has a
more uniform profile since only liquid refrigerant enters the inlet header, significantly
improving the liquid uniformity. The result is the greater capacity achieved. As shown in
Figure 4-14, distribution rating parameter φ in the FGB mode is about 25% higher than that
in the DX mode, demonstrating a more uniform profile of the evaporator surface
temperature and refrigerant distribution among parallel tubes. However, it is worth noting
that in the FGB mode tubes on the left side appears to receive more liquid than those on
the right, since there is no or much lesser superheat zone at the tube downstream. This
indicates that the refrigerant maldistribution, although significantly improved compared to
DX mode, still exists in the FGB mode. The cause due to air-side load maldistribution can
be ruled out, as been confirmed by the relatively uniform air flow velocity and temperature
profiles measured by the anemometer and thermocouple grid. One of the possible reasons
is the pressure drop along the inlet and outlet headers. The liquid refrigerant in the inlet
header has a much lower velocity than the vapor in the outlet header after fully vaporizing

85
along the branch tubes, which results in the greater pressure drop in the outlet header than
in the inlet header. The tubes on the right side will experience smaller driving pressure
differentials and correspondingly lower refrigerant flow rates than those on the left. At
equal air-side load, the consequence is more superheat in the right region as illustrated in
Figure 4-13. The type of maldistribution is quite different from the quality maldistribution,
and will be studied and discussed in details in the following chapter.
4.3.4 FGB SECOND BENEFIT: REDUCED EVAPORATOR PRESSURE
DROP
Reduction of refrigerant-side pressure drop is another benefit of the FGB method,
which is illustrated in Figure 4-15. Total refrigerant flow rate totm& is higher in the FGB
mode than DX mode at the same compressor speed. However, the evaporator refrigerant-
side pressure drop is lower up to 30% due to bypassing the flash vapor. This results in the
actual refrigerant flow rate throughout the evaporator in the FGB mode to be only
, (1 )tot FGB inm x−& which is slightly lower than ,tot DXm& in the DX mode. Additionally,
refrigerant velocity along the inlet header and tubes and the average void fraction
throughout the evaporator are reduced as only liquid phase enters the evaporator. However,
since the pressure drop in the baseline DX mode is relatively low, the reduction of pressure
drop in the FGB mode is only about 5 to 7 kPa. Compared to the improved distribution,
performance enhancement due to this benefit is relatively low (Figure 4-12), but should be
more beneficial for a compact microchannel evaporator with small size microchannels, in
which case pressure drop is relatively high.

86
Figure 4-15 Evaporator pressure drop in FGB and DX modes at the same compressor speed
4.3.5 MAXIMUM COP ENHANCEMENT AT THE MATCHED COOLING
CAPACITY
To have the only one measure of performance improvement (here COP) the cooling
capacity (Qe) is maintained constant by varying the compressor speed in both DX and FGB
modes. As shown in Figure 4-16, capacities are maintained around 2.92 kW with a
deviation less than ±1%. The COP improvements are higher than when the compressor
speed is constant. Compressor speed for the DX mode had to be increased when superheat
was higher to compensate for the lesser evaporator performance. The compressor speed in
the FGB mode is reduced approximately 400 rpm (roughly 1/3) below that of the DX mode
to provide the same capacity. In general, lower speed can result in higher compressor
efficiencies, but for current experimental results isentropic efficiency in the FGB mode is
only about 1% to 2% higher than in the DX mode. Thus, improved isentropic efficiency
does not significantly affect the system performance. Corresponding p-h diagram for
∆Tsup,CP of 15 ºC is shown in Figure 4-17. In the FGB mode, the evaporator exit pressure

87
is increased 109 kPa primarily due to improved refrigerant distribution, and the discharge
pressure is approximately 55 kPa lower because of the smaller heat rejection rate in the
condenser. Both of these effects reduce the compressor work, resulting in a greater COP.
Figure 4-16 Maximum COP improvement at the matched cooling capacity

88
Figure 4-17 Refrigeration cycles in FGB and DX modes for a compressor inlet superheat of 15ºC
and at the matched capacity
Figure 4-18 shows refrigerant mass flow rate and evaporator pressure drop in DX and
FGB modes at the matched capacity. Comparing to the case of the fixed compressor speed,
reduction of the evaporator pressure drop is much higher. First, the flow rate of refrigerant
entering the evaporator is much lower in the FGB mode. Second, elevation of the
evaporating temperature increases the vapor phase density, and therefore the vapor phase
velocity and the pressure drop are further reduced.

89
Figure 4-18 Refrigerant mass flow rate and refrigerant-side pressure drop across the evaporator
for FGB and DX models at the same capacity
4.4 FGB EFFECTS ON THE PERFORMANCES OF
MICROCHANNEL EVAPORATORS
4.4.1 REFRIGERANT SIDE HEAT TRANSFER COEFFICIENT
Typically, the boiling heat transfer coefficient is determined by two boiling
mechanisms, nucleate boiling and convective boiling. The former is dependent on the wall
superheat, and the latter varies with mass flux, and local quality. Since the flashing vapor
is bypassed around the evaporator, both the average quality and the mass flux are reduced
in FGB mode. Thus, the refrigerant side boiling heat transfer coefficient is also affected.
But the magnitude and trend are strongly related to the types of working refrigerants which
are distinctly subjected to the two boiling mechanisms in microchannels. For instance,
Elbel and Hrnjak (2004) found FGB improves the CO2 boiling heat transfer coefficient,
since CO2, unlike other common refrigerants, heat transfer coefficient increases at lower

90
qualities because of its relatively high reduced evaporating pressure at typical working
conditions.
Figure 4-19 and Figure 4-20 compare the refrigerant-side heat transfer coefficient and
overall evaporator UA value in FGB and DX modes at different mass fluxes and inlet
qualities by the evaporator model (Tuo et al., 2012). Evaporator geometry and air-side
conditions are based on the previous experiment results. It can be seen that at the same
quality, ratio of the refrigerant heat transfer coefficient hr,FGB/hr,DX decreases with mass
flux increasing, because convective boiling mechanism is dominant for R134a which has
relatively large liquid-vapor density ratio. Bypassing the flash vapor reduces the mass flux
and therefore the convective boiling effect. As shown in Figure 4-19, heat transfer
coefficient reduction is more significant at higher inlet qualities, up to 20% in the explored
range. However, from the perspective of the refrigerant-air overall heat transfer coefficient
or UA value, this negative effect is considerably lower, only about 2% reduction, since the
air side thermal resistance is dominant over the refrigerant side. It should be pointed that
2% reduction occurs at relatively extreme condition, i.e. xin= 30% and G = 360 kg/m2s. If
looking into some typical conditions such as xin= 20% and G = 100 kg/m2s, the reduction
is less than 1%.

91
Figure 4-19 Reduction of refrigerant side heat transfer coefficient (FGB vs. DX)as a function of
refrigerant mass flux and quality
Figure 4-20 Reduction of overall evaporator UA value (FGB vs. DX)as a function of refrigerant
mass flux and quality
4.4.2 REFRIGERANT SIDE PRESSURE DROP
As discussed in previous section, the pressure drop reduction in FGB mode is due to:
1) decreased mass flux; 2) average refrigerant quality throughout the evaporator. But the
magnitude strongly depends on the evaporator DX baseline pressure drop. As shown in

92
Figure 4-21, the evaporator pressure drop decreases more significantly at a higher baseline
(DX) pressure drop and/or higher inlet quality. This indicates that FGB could achieve a
more compact design of the microchannel evaporator, because 1) microchannel with a
smaller channel size could be employed and 2) consequently the channel wall thickness
can be reduced. But it is worth of noting that this benefit should be varied for different
types of working refrigerants. For those high pressure refrigerants, like CO2 and R410A,
the corresponding evaporators in general already use small channel with hydraulic diameter
of about 0.5 mm. Besides, in the thermophysical property point of view, their saturation
temperature is less sensitive to the corresponding pressure than other comparatively low
pressure fluid, such as R134a, R1234yf, and etc. Thus, evaporation temperature elevation
from this benefit for high pressure fluids is not as considerable as that for low pressure
fluid.
Figure 4-21 Refrigerant-side pressure drop reduction (FGB vs. DX) as a function of mass flux
and quality

93
4.5 SUMMARY AND CONCLUSIONS
Flash Gas Bypass (FGB) is implemented in an R134a mobile air conditioning (MAC)
system with a single pass microchannel evaporator. An experimental comparison to a
conventional direct expansion system was conducted using the same components and under
the same operating conditions.
At the same compressor speed, the cooling capacity in FGB mode increased about 13%
to 18% over DX mode while COP increased about 4% to 7%. When the cooling capacity
is matched by adjusting the compressor speed, the COP improvement was 37% to 58%
higher when compared to the DX mode. The primary reason for the improved performance
of this system in the FGB mode is due to more uniform refrigerant distribution as shown
in Figures, 7-8. Superheated zone in the evaporator is reduced and the heat transfer rate is
higher than that in the DX mode, which results in higher cooling capacity, higher
evaporating temperature and thus higher efficiency (COP). Another benefit is reduced
refrigerant pressure drop across the evaporator, and this will be more beneficial when using
a compact microchannel evaporator with high pressure drops.
The magnitude of performance improvement due to the improved refrigerant
distribution and the reduced refrigerant-side pressure drop strongly depends on the
evaporator design, quality and relative size of the components of the system. Systems with
relatively small evaporator compared to condenser and compressor will benefit more from
FGB and vice versa is true: systems with oversized evaporators and good distribution will
see less effect.

94
Chapter 5 HEADER PRESSURE DROP INDUCED FLOW
MALDISTRIBUTION IN PARALLEL FLOW
MICROCHANNEL EVAPORATORS
5.1 INTRODUCTION
This chapter presents investigation of the refrigerant flow maldistribution caused by
the pressure drop in headers and its impact on the performance of a microchannel
evaporator with horizontal headers and vertically oriented tubes. First, experimental results
show that the flash gas bypass method almost eliminates the refrigerant maldistribution
due to evaporator inlet quality (two phase flow). However, the mass flow maldistribution
caused by the header pressure drop still exists. It is found to be mainly because the pressure
drop along the headers results in uneven pressure difference and therefore non-uniform
liquid refrigerant mass flow rate across each microchannel tube. A microchannel
evaporator model validated by experimental results is employed to quantify header
pressure induced flow maldistribution. Parametric analysis reveals that such
maldistribution impact is significantly reduced by enlarging the outlet header size,
increasing heat exchanger aspect ratio, and/or reducing the microchannel size while other
parameters are kept constant. When ratio of the outlet header to the total evaporator
pressure drop is less than 30%, the cooling capacity reduction is limited below 3%.
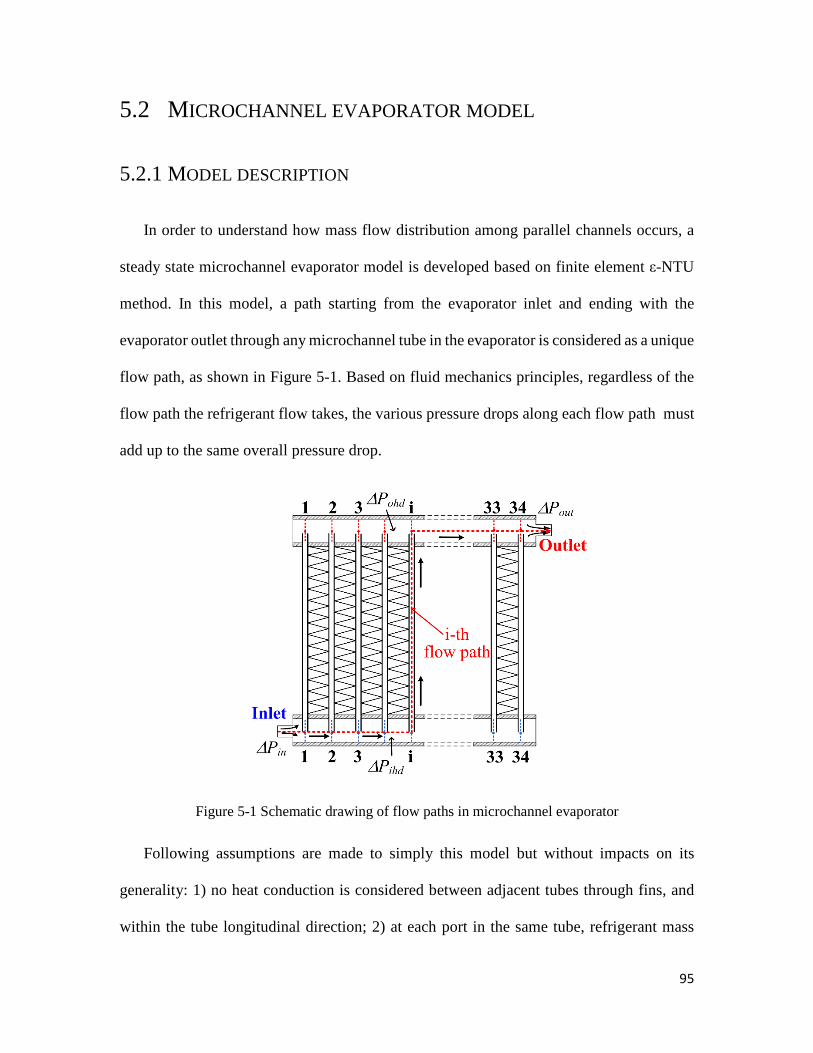
95
5.2 MICROCHANNEL EVAPORATOR MODEL
5.2.1 MODEL DESCRIPTION
In order to understand how mass flow distribution among parallel channels occurs, a
steady state microchannel evaporator model is developed based on finite element ε-NTU
method. In this model, a path starting from the evaporator inlet and ending with the
evaporator outlet through any microchannel tube in the evaporator is considered as a unique
flow path, as shown in Figure 5-1. Based on fluid mechanics principles, regardless of the
flow path the refrigerant flow takes, the various pressure drops along each flow path must
add up to the same overall pressure drop.
Figure 5-1 Schematic drawing of flow paths in microchannel evaporator
Following assumptions are made to simply this model but without impacts on its
generality: 1) no heat conduction is considered between adjacent tubes through fins, and
within the tube longitudinal direction; 2) at each port in the same tube, refrigerant mass
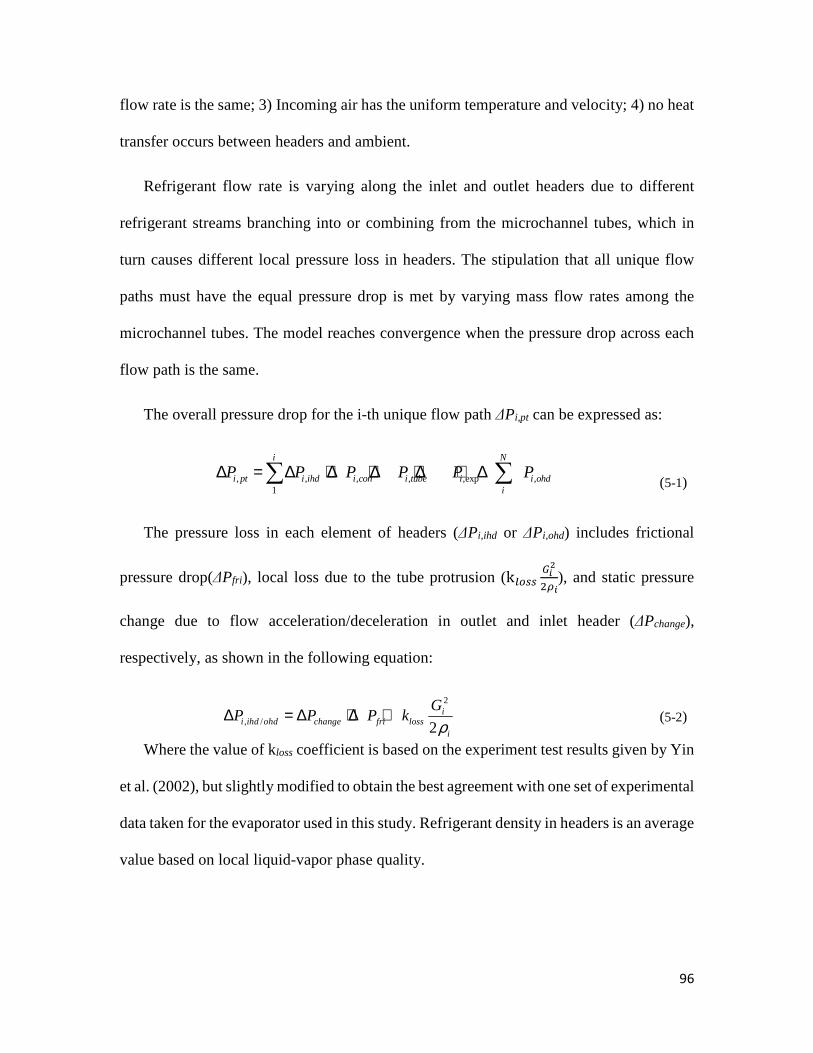
96
flow rate is the same; 3) Incoming air has the uniform temperature and velocity; 4) no heat
transfer occurs between headers and ambient.
Refrigerant flow rate is varying along the inlet and outlet headers due to different
refrigerant streams branching into or combining from the microchannel tubes, which in
turn causes different local pressure loss in headers. The stipulation that all unique flow
paths must have the equal pressure drop is met by varying mass flow rates among the
microchannel tubes. The model reaches convergence when the pressure drop across each
flow path is the same.
The overall pressure drop for the i-th unique flow path ∆Pi,pt can be expressed as:
, , , , ,exp ,1
i N
i pt i ihd i con i tube i i ohdi
P P P P P P∆ = ∆ + ∆ + ∆ + ∆ + ∆∑ ∑
(5-1)
The pressure loss in each element of headers (∆Pi,ihd or ∆Pi,ohd) includes frictional
pressure drop(∆Pfri), local loss due to the tube protrusion (k�������
���
), and static pressure
change due to flow acceleration/deceleration in outlet and inlet header (∆Pchange),
respectively, as shown in the following equation:
2
, / 2i
i ihd ohd change fri lossi
GP P P k
ρ∆ = ∆ + ∆ +
(5-2)
Where the value of kloss coefficient is based on the experiment test results given by Yin
et al. (2002), but slightly modified to obtain the best agreement with one set of experimental
data taken for the evaporator used in this study. Refrigerant density in headers is an average
value based on local liquid-vapor phase quality.

97
The pressure drop across the i-th microchannel tube (∆Pi,tube) consists of frictional
pressure drop (∆Pfri), acceleration pressure drop due to refrigerant evaporation along the
channel (∆Pacc), and gravitational pressure drop (∆Pgra), respectively.
,i tube fri acc graP P P P∆ = ∆ + ∆ + ∆ (5-3)
Sudden contraction/ expansion pressure loss due to change of flow area is also
considered when refrigerant enters or exits microchannel tube from or into headers. Table
1 summarized the correlations that have been chosen to calculate heat transfer and pressure
drop. More detailed information of this model can be found in author’s paper (Tuo et al.,
2012).
5.2.2 EXPERIMENTAL FACILITY
To validate the modeling results, the experiments are carried out in the same A/C
system test facility and the microchannel evaporator used in the Section 4.2.1. The
objective of this chapter is to investigate and quantify the effect of the header ∆P induced
flow maldistribution on the evaporator performance and to propose a several design options
to reduce the impact of the pressure drop on distribution. Thus, the quality induced
maldistribution is almost eliminated by the use of flash gas bypass (FGB) method, which
gives the possibility to study the impact of the header pressure drop alone. For
microchannel evaporators working in direct expansion (DX) mode, principles still hold but
could be experimentally examined when “quality induced maldistribution” is eliminated in
some other ways.
Two combinations of evaporator inlet/outlet location are employed, as shown in Figure
5-2. The data range from 299 to 387 kPa for the refrigerant evaporating pressure, 9.8~29g/s

98
for the mass flow rate of R134a refrigerant. Superheat at the evaporator exit is manually
controlled in the range of 5~20ºC. Air inlet temperature varies from 25ºC to 40 ºC.
Figure 5-2 Configurations of evaporator inlet/outlet and ∆P measurement in FGB mode
5.2.3 MODEL VALIDATION
Figure 5-3 shows the comparison of predicted and measured evaporator cooling
capacity. About 88% of the data points are predicted within +/- 5% deviation from the
experimental results. Figure 5-4 compares the predicted and measured total evaporator
pressure drop and outlet header pressure drop. About 92% of the data points are predicted
within +/- 20% deviation from the experimental results. In addition, the experiment results
show that the outlet header ∆P takes up about 43% - 76% of the pressure drop for this
microchannel evaporator at the investigated operating conditions. Figure 5-5compares
predicted surface temperatures to experimental infrared image for the case of evaporator
exit bulk superheat of about 11 ºC. The shape of predicted surface temperature profile
shows reasonably good agreement with the measured temperature profile. In addition, it is
evident that the tube superheated areas (red and high surface temperature zone) are

99
different among parallel tubes, indicating the non-uniformly distributed refrigerant flow.
Overall, simulation results show fair good agreement with experimental results.
Figure 5-3 Comparison of predicted and experimental cooling capacity of the microchannel
evaporator
Figure 5-4 Comparison of predicted and measured evaporator pressure drops (∆Pevap – overall
pressure drop across the evaporator; ∆Pohd –pressure drop along the outlet header)

100
Figure 5-5 Comparison of predicted and measured evaporator surface temperatures
5.3 RESULTS AND DISCUSSIONS
5.3.1 DISTRIBUTION PROFILE IN THE MICROCHANNEL EVAPORATOR
To further analyze the observed flow maldistribution, Figure 5-6(a) and (b) show the
detailed distribution profile among the parallel flow microchannel tubes at the condition of
35 ºC air inlet temperature and 11 ºC evaporator exit bulk superheat. It can be seen that the
outlet header ∆P is about 10 times higher than that in the inlet header, mainly because local
refrigerant is in the vapor phase flowing along the outlet header with much higher velocity
than the liquid refrigerant in the inlet header. Besides, pressure drop gradient increases at
downstream region of the outlet header. This is because refrigerant mass flow rate is higher
at downstream outlet header since more refrigerant streams from microchannel tubes
combines together in the outlet header at downstream. Consequently, such asymmetric
pressure profiles along the inlet and outlet headers cause that the available pressure
differential across the microchannel tube and corresponding liquid mass flow rate gradually
increase, causing less superheated zone at the downstream tubes. From Figure 5-6(b), it is
evident that the last three tubes still have liquid refrigerant at the exit due to the overfed

101
liquid refrigerant at the tube inlet, while the rest tubes have varied exit superheat, the degree
of which depends on the feeding liquid flow rate.
Figure 5-6 Detailed distribution profile among parallel microchannel tubes
5.3.2 EXPLORE OPTIONS TO IMPROVE FLOW DISTRIBUTION
To explore effects of the outlet header ∆P on the flow distribution and performance of
microchannel evaporators, three parameters which mainly determine the outlet header pressure
drop relative to the total evaporator pressure drop are considered: outlet header diameter
Dhd, heat exchanger aspect ratio β, and microchannel port size (hydraulic diameter) Dh.
These parameters are varied individually in the parametric analysis. The same

102
microchannel evaporator was used as the baseline for parametric analysis. For fair
comparison, air-side conditions, i.e. inlet temperature and volumetric flow rate are
maintained constant. Evaporator exit superheat and pressure are also kept constant for 5 ºC
and 390 kPa without losing generality, since these two parameters are usually given as
inputs for system design. Thus, evaporator inlet saturation pressure will be determined by
summation of the evaporator exit pressure and its total pressure drop. It should be pointed
out that this parametric analysis is carried out for microchannel evaporators operating in
FGB mode, since the quality maldistribution due to the flashing vapor is almost eliminated in the
FGB mode. To quantify the flow maldistribution effects on the evaporator cooling capacity, the
normalized cooling capacity is used for each case, and it is defined as the ratio of the actual cooling
capacity to the maximum possible cooling capacity for each case of parametric analysis. Thus, this
maximum possible capacity varies with the geometry modification.
5.3.2.1 EFFECT OF OUTLET HEADER DIAMETER
The outlet header diameter varies from baseline, 1.0Dhd to 2.0Dhd, while the inlet header
diameter remains constant. Figure 5-7illustrates the normalized liquid mass flow rate in
each microchannel tube as a function of the outlet header diameter. Normalized flow rate
is defined as actual liquid flow rate in each tube divided by the average value. It is evident
that as the diameter increases the liquid mass flow profile becomes more uniform, since
larger diameter reduces the vapor flow velocity and corresponding pressure drop along the
outlet header. The pressure drop across each microchannel tube becomes more uniform.
As illustrated in Figure 5-8, normalized cooling capacity, defined as actual cooling capacity
divided by the maximum possible capacity, gradually increases and approaches the
maximum value because of improved liquid distribution. Meanwhile, the ratio of outlet

103
header ∆P to total evaporator ∆P decreases from about 0.7 down to 0.12. This indicates
reducing outlet header to evaporator pressure drop ratio improves the evaporator cooling
capacity. Figure 5-9 shows the variation of the evaporator surface temperature profiles with
the outlet header diameter. Similarly, superheated area (red color) decreases and appears
in a more uniform pattern, indicating improved liquid distribution among parallel
microchannel tubes. From Figure 5-8, it can be seen that when the ratio of the outlet header
pressure drop to the evaporator pressure drop is less than 30%, the reduction of the cooling
capacity due to header ∆P induced flow maldistribution is limited within about 3%.
Figure 5-7 Liquid distribution among parallel channels as a function of outlet header diameter Dhd

104
Figure 5-8 Variation of normalized cooling capacity and pressure drop ratio with outlet
header diameter
Figure 5-9 Evaporator surface temperature profiles at different outlet header diameters
5.3.2.2 EFFECT OF MICROCHANNEL PORT SIZE (DH)
Another option to reduce header ∆P impact on the distribution and performance of
evaporator is to increase the tube pressure drop by reducing the size of microchannel port.
In this analysis, microchannel hydraulic diameter varies from 0.8 mm (baseline) to 0.4 mm
while keeping other parameters and operating conditions constant. Figure 5-10 shows that
at a smaller microchannel diameter the normalized liquid mass flow rate becomes more
uniform among parallel tubes. This is because the tube pressure drop increases, and
therefore the ratio of outlet header ∆P to total evaporator ∆P is reduced, as shown in Figure
5-11. Consequently, the normalized cooling capacity approaches the corresponding

105
maximum value. However, when channel diameter is further reduced to 0.4 mm, the
cooling capacity decreases although the liquid mass flow rate becomes even more uniform
(see Figure 5-10). This is because reducing microchannel diameter will significantly
increase ∆P across the tube. Since the evaporator exit condition is fixed, the saturation
temperature at the evaporator inlet has to be elevated to compensate the higher pressure
drop penalty. Figure 5-12 qualitatively illustrates effects of the evaporator pressure drop
on the heat transfer performance. When evaporator pressure drop increases with a fixed
suction pressure, the pressure at the evaporator inlet and corresponding evaporating
temperature gradually increase and therefore, the heat transfer temperature difference
between the refrigerant and air sides (typically represented by log mean temperature
difference (LMTD)) decreases. Figure 5-13 shows that the decrease in microchannel port
size gradually increases evaporator surface temperature, indicating higher refrigerant
saturation temperature and lower temperature difference. Although reducing the
microchannel port size consistently improves the liquid distribution, to some extent this
positive effect is offset by the negative impact due to temperature difference reduction.
Thus, the capacity decreases after the maximum value. From Figure 5-11, it can be seen
that the capacity reduction due to header ∆P induced flow maldistribution is less than 3%
when outlet header ∆P ratio is limited within 30% of total evaporator ∆P.

106
Figure 5-10 Liquid flow rate distribution as a function of microchannel diameter Dh
Figure 5-11Variation of normalized cooling capacity and pressure drop ratio with microchannel
size

107
Figure 5-12 Illustration of pressure drop effect on evaporator performance
Figure 5-13 Evaporator surface temperature profiles at a fixed bulk exit superheat of 5 °C
5.3.2.3 EFFECT OF HEAT EXCHANGER ASPECT RATIO
Heat exchanger aspect ratio is defined as the tube length over the width of the evaporator. The
aspect ratio for the baseline microchannel evaporator is 0.79. When the evaporator face area and
total heat transfer area are fixed, higher aspect ratio means longer but fewer microchannel tubes in
parallel and shorter inlet and outlet headers. Thus, tube ∆P will increase and header ∆P will
decrease, resulting in a smaller ∆P ratio of the header to the evaporator. As shown in Figure 5-14,
initially increasing the aspect ratio will improve the liquid distribution and evaporator capacity.
There also exists a peak capacity since further increase in the aspect ratio will cause too much
pressure drop penalty, thus reducing the heat transfer temperature difference and the cooling
capacity. Similarly, it can be observed that when ∆P ratio is lower than 30%, the difference between
the cooling capacity and the maximum value is about less than 2%.

108
Figure 5-14 Effect of the evaporator aspect ratio on the cooling capacity and the pressure drop
ratio
5.4 EXPERIMENTAL VALIDATION
From above analysis, constraining the outlet header ∆P to within approximately 30% of the
total evaporator pressure drop limits the cooling capacity degradation due to flow maldistribution
to within 3%. The options to achieve that include: 1) enlarging outlet header diameter; 2) increasing
heat exchanger aspect ratio (ratio of length to width); 3) reducing microchannel port size. When
comparing three options, enlarging the header diameter is always the best solution if maximizing
capacity is the only concern, since it improves the flow distribution but also reduces the total
evaporator pressure drop, both of which increases the evaporator capacity. Other two options of
increasing aspect ratio or reducing port size always induce the penalty of increased total pressure
drop. However, for the practical concern, the use of enlarged outlet header may not be practical,
while reducing the port size or varying the aspect ratio may bring about some advantages of
compactness. Thus, in practical design, to improve the refrigerant distribution, three options should
be properly considered.
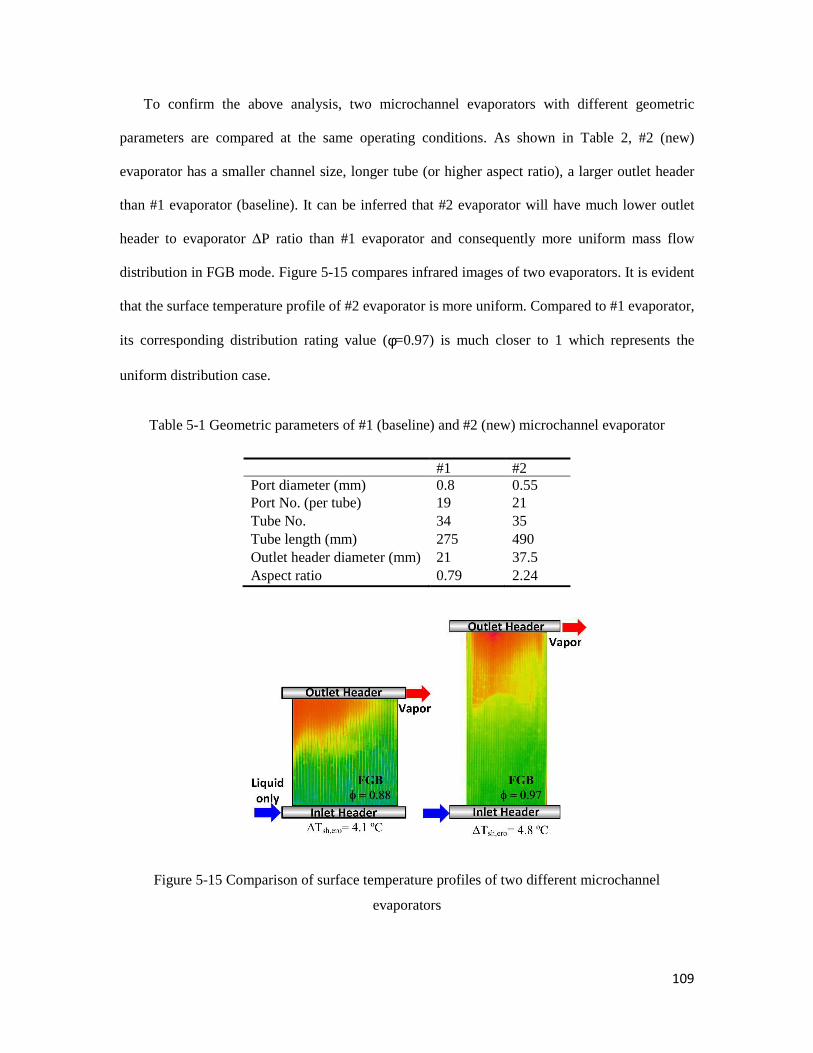
109
To confirm the above analysis, two microchannel evaporators with different geometric
parameters are compared at the same operating conditions. As shown in Table 2, #2 (new)
evaporator has a smaller channel size, longer tube (or higher aspect ratio), a larger outlet header
than #1 evaporator (baseline). It can be inferred that #2 evaporator will have much lower outlet
header to evaporator ∆P ratio than #1 evaporator and consequently more uniform mass flow
distribution in FGB mode. Figure 5-15 compares infrared images of two evaporators. It is evident
that the surface temperature profile of #2 evaporator is more uniform. Compared to #1 evaporator,
its corresponding distribution rating value (φ=0.97) is much closer to 1 which represents the
uniform distribution case.
Table 5-1 Geometric parameters of #1 (baseline) and #2 (new) microchannel evaporator
#1 #2 Port diameter (mm) 0.8 0.55 Port No. (per tube) 19 21 Tube No. 34 35 Tube length (mm) 275 490 Outlet header diameter (mm) 21 37.5 Aspect ratio 0.79 2.24
Figure 5-15 Comparison of surface temperature profiles of two different microchannel
evaporators

110
5.5 SUMMARY AND CONCLUSIONS
This paper presented the effects of refrigerant flow maldistribution due to the header
pressure drop on the performance of microchannel evaporators with horizontal headers and
vertically oriented tubes. Experimental results reveal that header induced mass flow
maldistribution still exists when the quality induced maldistribution is almost eliminated
by bypassing flashing vapor and feeding liquid only refrigerant into the evaporator header
in the FGB method. Both measurements and model results indicate that the outlet header
pressure drop causes the microchannel pressure drops, and consequently, the mass flow
rates, to be different from tube to tube as a function of the situation in the outlet header.
Parametric analysis based on an experimentally validated evaporator model quantifies
the effects of outlet header pressure drop on the flow maldistribution and the cooling
capacity. The methods to reduce its impacts are explored. When other geometric
parameters and operating conditions are kept constant, outlet header diameter, heat
exchanger aspect ratio, and microchannel port size are varied. The results indicate that
when the outlet header pressure drop is limited to approximately 30% of the total
evaporator pressure drop, the evaporator capacity degradation is lesser than 3%.

111
Chapter 6 PERIODIC REVERSE FLOW AND BOILING
FLUCTUATIONS IN MICROCHANNEL EVAPORATORS
6.1 INTRODUCTION
This paper presents the phenomenon of periodic reverse flow and associated boiling
fluctuation found in experiments with a parallel microchannel evaporator used in an R134a
air conditioning system. A simultaneous flow visualizations and measurements confirmed
the periodic flow reversal. It caused synchronized oscillations of the evaporator pressure
and the pressure drop. The magnitude and frequency of oscillations increased with the heat
flux. Three potential impacts of flow reversal on evaporator performance are identified: 1)
moderate liquid maldistribution; 2) reduced heat transfer coefficient; 3) increased
refrigerant side pressure drop.
To reduce these impacts, a revised flash gas bypass (FGBR) method is proposed to vent
out the reverse vapor flow trapped in the inlet header. An experimental comparison reveals
that the vapor venting provided a 5% increase of cooling capacity and 3% of COP at the
fixed compressor speed condition, while the maximum COP improvement was
approximately 10% -12% when capacity is matched by reduction of compressor speed.
In addition, the reverse vapor flow is characterized for the first time through this
method. Both its average flow rate and oscillation amplitude increase with average heat
flux, while the oscillation period is reduced. Compared with total refrigerant flow rate

112
supplied to the evaporator, average reverse vapor flow is in the range 2% to 8% at the
conditions explored.
6.2 EXPERIMENTAL FACILITY
The same A/C system test facility used in previous two chapters is also employed in
this study. Detailed information regarding the test facility can be found in the Section 4.2.1.
To visualize the behavior of two-phase refrigerant flow inside the inlet header, the original
aluminum headers were cutoff and replaced by transparent ones made by transparent PVC
tubes. The evaporator consists of totally 25 parallel flat tubes with a total face area of 0.065
m2 and total air-side surface area of 1.607 m2. Figure 3-1 shows the detailed configuration
of flash gas bypass and the microchannel evaporator with transparent inlet and outlet
headers. Since PVC is a low conductivity material, the flow within headers is adiabatic,
and heat transfer between hot air and refrigerant only occurs at aluminum microchannel
flat tubes. Each flat tube has an effective heat transfer length of 260 mm and 10 parallel
microchannels with the inner hydraulic diameter of 1.0 mm. The corresponding
confinement number Co is about 0.92 based on the definition by Kew and Cornwell (1997).
Thus, it can be seen that this microchannel with inner diameter of 1.0 mm for R134a can
be categorized as microchannel according to the criterion given by Kew and Cornwell
(1997). As illustrated in Figure 3-1, refrigerant flows upward along the microchannel tube,
and air flow direction is perpendicular to the vertical tube. Thus, refrigerant and air flow is
in a cross-flow configuration.
To vent out the reverse vapor trapped at the inlet header (originated from reverse flow),
two venting ports are added on both ends of the inlet header. An adiabatic venting line is
113
installed between the upstream flash gas separator and venting ports. To measure the
quantity of the reverse vapor flow vented out, a low pressure drop hot wire mass flow meter
is installed on the venting line. A venting valve is used to control the flow resistance,
preventing liquid entrainment from the inlet header for the accurate measurement of vapor
flow rate. However, this active valve control would be not necessary in practical systems,
since any entrained liquid refrigerant through the venting line will be eventually re-
separated in the flash gas separator.
With different combined setups of bypass and venting valves, this A/C system can
operate in three different cycles, as summarized in Table 1. When both bypass and venting
valves are fully closed, the system operates as a conventional direct expansion (DX) cycle.
Two phase refrigerant generated during the expansion process directly enters the
evaporator. When only bypass valve is open, the vapor and liquid refrigerant are fully
separated in the transparent flash gas separator, the system works in flash gas bypass (FGB)
cycle, feeding the evaporator with liquid only. When both valves are properly open, both
flashing vapor generated during the expansion process and backflow vapor discharged
from the heated channels will be bypassed to the suction line. The system runs as the
revised flash gas bypass (FGBR) cycle.
An infrared camera was used to measure the evaporator surface temperatures, which
provides indirect information regarding refrigerant distribution inside parallel
microchannel tubes. The camera model is Mikron Midas with a spatial resolution of
320×240 pixels. A high-speed CCD camera was used to visualize the flow regime at the
inlet header at a recording speed of 1000 fps. Meanwhile, a high-speed datalogger at a
sampling rate of 100 Hz was employed to record simultaneous oscillations of the

114
inlet/outlet pressures measured by two pressure sensors and the pressure drop measured
independently by a pressure differential transducer. Table 2 lists the operating conditions
for the A/C system. The uncertainties for pressure, temperature and mass flow rate
measurements are about ± 3.56 kPa, ±0.5 ºC and ±0.1%, respectively. The resulting
uncertainties for the capacity and COP measurements are about 3.3% and 3.6%.
Figure 6-1 The detailed layout of the evaporator section
Table 6-1 Operating cycle configurations with different valve setups
Cycle Bypass Valve Venting
DX Closed Closed
FGB Open Closed
FGBR Open Open

115
Table 6-2 Operating conditions
Items Unit Condenser side Evaporator side
Air inlet temperature ºC 27 27 35 35 43 43
Air volume flow rate m3/s 0.342(1.25 m/s) 0.233(3.64m/s) Relative humidity - - Dry condition Compressor speed rpm 900 (varied when matching cooling capacity) Evaporator exit superheat ºC 3 Condenser subcooling ºC 10-11
6.3 EXPERIMENTAL RESULTS
6.3.1 FLOW REGIME AND BOILING FLUCTUATIONS IN DX CYCLE
Figure 3-7 shows the infrared image of evaporator surface temperatures and two-phase
flow regime at the inlet header in DX mode at 35ºC/35ºC condition. The entire header is
divided into four zones of flow visualization. The infrared image shows a red region (high
surface temperature) in a wedge shape on the left-side evaporator, indicating refrigerant
flow in a superheated vapor state. This is because refrigerant temperature in a superheated
state rises up dramatically, which in turn causes that surface temperature increases and
approaches to the air inlet temperature. The large superheat zone near the evaporator inlet
indicates that microchannel tubes on the left side receive more vapor refrigerant than those
on the rear end of the header, because vapor flows preferentially through the microchannel
tubes near the inlet because of its lower density and inertia force than liquid. However, in
zones 1 and 2, the superheated region in each tube gradually enlarges as flow proceeds
downstream, reach the maximum size around at the tube 10, and then abruptly decreases.
This is mainly because the downward gravitational force intends to separate vapor on the
top and liquid on the bottom. The vapor-liquid flow initially well-mixed at the evaporator

116
inlet gradually becomes stratified, with lesser liquid droplets entrained by the vapor flow
but thicker bulk liquid flow at the bottom of the header. Thus, flow stratification increases
the difficulty to feed liquid refrigerant up to vertical tubes and the corresponding superheat
area. Until most vapor refrigerant is branched out and elevating surface of the bulk liquid
is close enough to the tube inlets, almost only liquid refrigerant is fed into the microchannel
tubes at downstream, i.e. zones 3 and 4.
The occasional reverse vapor flow which is discharged from the microchannels against
the upward bulk flow direction is observed to occur in microchannel tubes, especially those
located downstream of the inlet header (zones 3 and 4) where the liquid pool surface is as
high as the tube inlets, because reverse vapor flow is only “visible” as creating a bubble
with the liquid pool at the bottom. Reverse vapor is barely detected in the front part of the
header where the liquid surface is relatively low, probably because reverse vapor is swept
away by the fast horizontal flow before being injected into the liquid pool to generate
“visible” bubbles.

117
Figure 6-2 Flow regime at the inlet header in DX cycle at 35ºC/35 ºC condition
Behavior of reverse vapor flow could be indicated by oscillations of pressure, flow rate
and temperatures in microchannels (Brutin et al., 2003; Wu and Cheng, 2004; Xu et al.,
2005; Hetroni et al., 2005). Figure 6-3 shows the temporal oscillations of the evaporator
inlet/outlet pressures and pressure drop in DX cycle. In order to characterize oscillation,
Fast Fourier Transform (FFT) analysis is used to convert time-dependent data (Figure 6-3
(1a) and (2a)) into corresponding frequency domain data (Figure 6-3 (1b) and (2b)), in
which dominant frequency, if any, and amplitude could be identified. In Figure 6-3 (1a),
the pressure drop oscillates considerably but in somewhat random fashion with a temporal
average of about 26 kPa. Such fluctuation is mainly caused by: 1) nucleation bubble
dynamics and instances of vapor blockage during the confined bubble growth; 2) the

118
dynamic interaction of reverse vapor flow and the compressible volume provided by the
inlet header. Its random behavior is postulated to be due to the complicated interaction
among hundreds of parallel channels through the inlet header, since this evaporator consists
of 25 parallel tubes, and in total 250 parallel microchannels. Considering that severe quality
maldistribution at the inlet of the tubes results in the different heat fluxes in each individual
channel (see infrared image in Figure 3-7), the pressure drop oscillation is expected to be
different among channels. Consequently, the overall pressure drop measured between inlet
and outlet of the evaporator as being the dynamic superimposition of all pressure drops
across individual channel plus appropriate parts of the headers is unsteady.
From the amplitude spectrum in Figure 6-3(1b), pressure drop oscillation shows two
dominant frequency bands around 0.05 Hz and 0.83 Hz, indicating two corresponding
oscillation periods of about 20 s and 1.2 s. Particularly, the period of that faster oscillation
mode is very similar to that of the vapor backflow observed through the high speed images,
which well confirms that reverse flow results in the pressure drop fluctuation. The presence
of slower oscillation (f=0.05 Hz) is not unusual in a system with a superheat control using
electronic expansion valve (EXV) device. It may cause such low frequency or long period
oscillation in the A/C system. For pressure oscillations, the outlet pressure remains
relatively constant with small oscillation amplitude of about ±5kPa around the average; the
inlet pressure fluctuates significantly with a peak-to-peak value up to 20 kPa. Pout FFT
reveals only a low frequency band around 0.02 Hz, confirming its steady behavior observed
in time domain (Figure 6-3(2a)). It may be inferred that the operations of the compressor
and even condenser are not affected by reverse vapor flow and boiling fluctuations in the
evaporator. Pin has an extremely similar dominant frequency band peaking at 0.82 Hz as
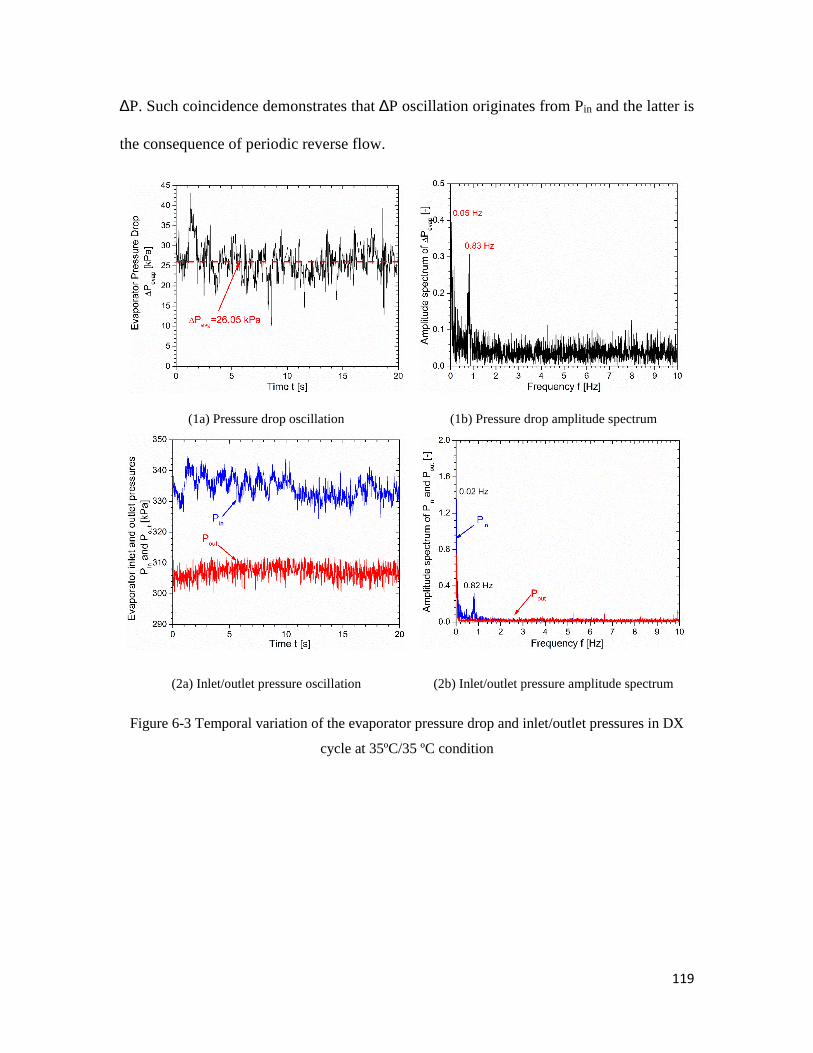
119
∆P. Such coincidence demonstrates that ∆P oscillation originates from Pin and the latter is
the consequence of periodic reverse flow.
(1a) Pressure drop oscillation (1b) Pressure drop amplitude spectrum
(2a) Inlet/outlet pressure oscillation (2b) Inlet/outlet pressure amplitude spectrum
Figure 6-3 Temporal variation of the evaporator pressure drop and inlet/outlet pressures in DX
cycle at 35ºC/35 ºC condition

120
6.3.2 FLOW REGIME AND BOILING FLUCTUATIONS IN FGB CYCLE
FGB cycle feeds the evaporator with liquid only refrigerant, as flashing vapor generated
during the expansion process is separated and bypassed to the suction line (Figure 3-1).
Figure 6-4shows a typical flow regime at the inlet header and evaporator surface
temperature profile in this case. Superheated area is reduced and in a more uniform pattern
compared to DX cycle. Microchannel tubes at the rear end of the header appear to receive
more liquid refrigerant than those close to the inlet, one of the reasons is mass flow
maldistribution due to the pressure drop of the outlet header (Tuo and Hrnjak, 2013).
Figure 6-4 Flow regime at the inlet header in FGB cycle at 35ºC/35 ºC condition

121
Figure 6-5 Periodic oscillation of vapor-liquid interface and reverse vapor flow (zone 3)
Although receiving only liquid refrigerant from upstream the flash gas separator, the
entire inlet header is not filled up with liquid. A clear vapor-liquid interface distinguishes
the liquid pool at the bottom and a vapor pocket at the top, oscillating up and down around
the tube inlets.
Figure 6-5 depicts a sequence of high-speed images for periodic reverse flow at one
portion of the inlet header. During the first 0.2 s no reverse bubble is observed, indicating
that liquid refrigerant may enter the tubes in a forward flow direction. Since t+0.4 s,
bubbles are gradually discharged out of the tubes, rising up in the liquid pool driven by the
buoyancy force, and finally breaking up and merging into the vapor pocket on the top. The
vapor reversal continues to about t+1.4 s. Meanwhile, the level of vapor-liquid interface
gradually drops since coalescence of reverse bubbles expands the volume of the vapor
pocket and thus expels out liquid pool retained at the header bottom. Particularly, during
the period of t+1.0 s to t+1.4 s, liquid level in the header is lower than the tube inlets.
Afterwards, liquid surface gradually goes up. It can be inferred that vapor backflow at the
tube inlets is ceased and forward upward flow is re-established, with taking both vapor and

122
liquid refrigerant temporally retained in the header. The behavior of reverse vapor flow
and induced vapor-liquid interface oscillation repeats periodically, and their period was
estimated to be about 1.8 s based on the flow visualization.
Figure 6-6 illustrates temporal variations of evaporator inlet/outlet pressures and
overall pressure drop. Compared to DX cycle, the pressure drop and inlet pressure in FGB
cycle fluctuate periodically in a clearer pattern and with greater oscillation amplitude, since
liquid is distributed more evenly among parallel microchannel tubes. This results in more
uniform heat flux and refrigerant mass flux to synchronize reverse flow oscillation in each
tube.
The pressure drop is about 18.65 kPa in average but temporally varies between the
instant maximum of about 39 kPa and the minimum of almost 0 kPa, resulting in the peak-
to-peak amplitude of roughly 39 kPa. In frequency domain, ∆P spectrum only has one
dominant frequency band centered at 0.53 Hz. This peak value corresponds to a period of
1.89 s, which is very similar to that of periodic reverse flow observed Figure 6-5. Similar
to DX cycle, Pin FFT shows exactly the same dominant frequency band and peak value,
but Pout remains almost constant. These results confirm that oscillations of inlet pressure
and therefore pressure drop are caused by periodic reverse vapor flow in microchannels
and dynamic interaction with the upstream compressible volume.
Under the same air inlet temperature and velocity (similar heat flux) the pressure drop
oscillation in FGB cycle differs from that in DX cycle (compare Figure 6-6(1b) to Figure
6-3(1b)). In FGB case, the pressure drop fluctuates at a lower frequency but with higher
oscillation amplitude. This may be because the flash gas separator in FGB cycle serves as
a damper upstream the inlet header and heated microchannels. Similar results were

123
observed by Brutin and Tadrist (2004): placing a compressible buffer tank upstream of the
heated microchannel increased the oscillation amplitude but decreased the frequency under
the same inlet mass flux and heat flux.
(1a) Pressure drop oscillation (1b) Pressure drop amplitude spectrum
(2a) Inlet/outlet pressure oscillation (2b) Inlet/outlet pressure amplitude spectrum
Figure 6-6 Variation of evaporator inlet/outlet pressures and pressure drops in FGB cycle at
35ºC/35 ºC condition
To further identify the relationship between reverse flow and oscillation of Pin, Figure
6-7(a) depicts one typical oscillation period of inlet and outlet pressures, and Figure 6-7(b)
shows a consecutive sequence of synchronized high speed images corresponding to
respective data points highlighted on Figure 6-7(a). At t = 5.224 s, the first bubble is vented

124
from the inlet of the second tube on the right, and until t = 5.364 s, vapor reverse is observed
at all the tubes and continues until t5. During this period, inlet pressure gradually increases
because of continuous accumulation of reverse vapor within the inlet header. It reaches the
peak value at t4, and then decreases. This drop may be because continuously evaporating
liquid that reside in the microchannel tubes will gradually deplete the residual liquid and
increase the superheated region, without receiving any fresh liquid from the tube inlet. It
will slow down bubble growth and lower the over pressure which drives the reverse flow.
Therefore, the inlet pressure decreases correspondingly. Clearly, vapor reversal appears to
be less intensive and even ceased at t5. When the inlet pressure is sufficient to overcome
the over pressure together with the pressure drop along the tube, forward upward flow is
re-instated. However, because the vapor pocket is present above the liquid and the liquid
surface is lower than the tube inlets, most likely only vapor refrigerant is received by tubes
at the beginning. Approximately, at t6, when rising liquid surface reaches the tube inlets,
fresh liquid starts to feed the microchannels. From above observation and analysis, one
oscillation cycle would be divided into three consecutive steps, as sketched in Figure 6-8:
1) t1~t5 –reverse vapor flow; 2) t5~t6 – re-entraining vapor in a forward flow; 3) t6~t7 – fresh
liquid feeding microchannels in a forward flow. Particularly, the third step, liquid feeding
the tubes only occurs approximately in the period of t6~t7, about 0.27 s or 16.2% of the
entire cycle. It can be inferred that the instant liquid mass flux entering the microchannels
would be about more than 5 times of the average value.
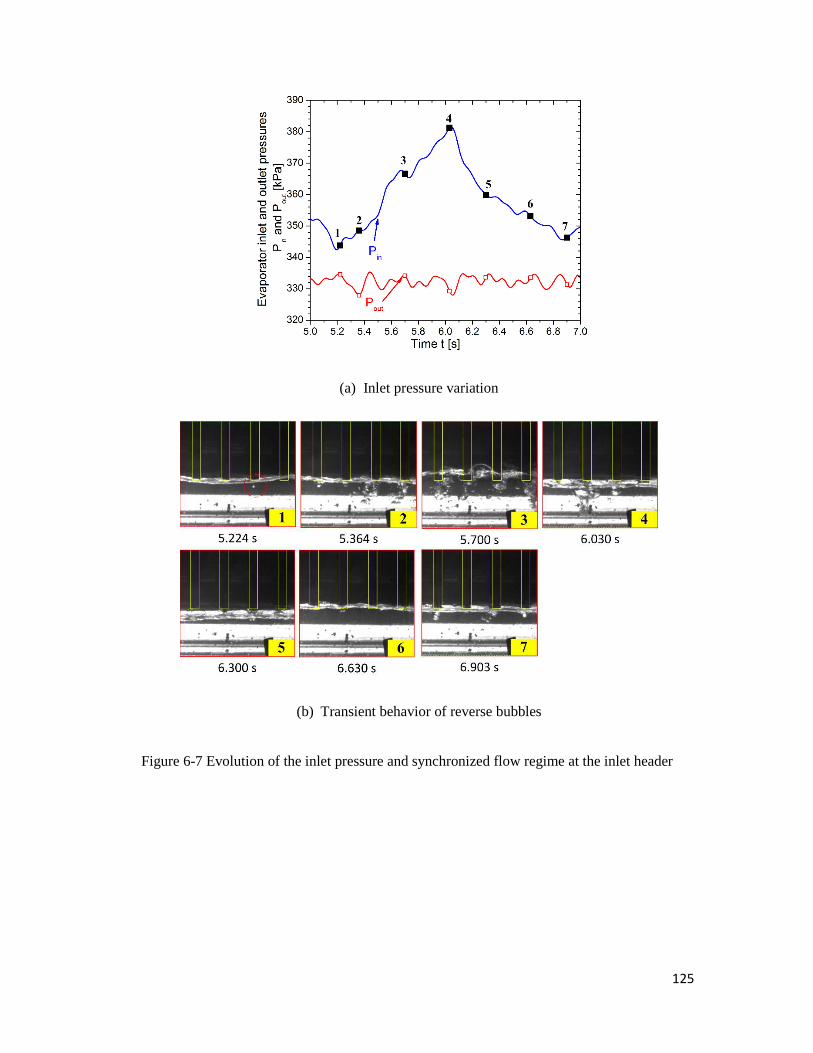
125
(a) Inlet pressure variation
(b) Transient behavior of reverse bubbles
Figure 6-7 Evolution of the inlet pressure and synchronized flow regime at the inlet header

126
Figure 6-8 Schematic illustration of temporal evolution of periodic reverse flow
6.3.3 EFFECT OF HEAT FLUX ON PERIODIC REVERSE VAPOR FLOW
Figure 6-9(1-3) shows the amplitude spectrums of the evaporator pressure drop at three
air temperatures in FGB cycle. As ambient temperature increases, the dominant frequency
bands are shifted up, indicating shorter oscillation periods or more intensive periodic
reverse vapor flow. This is because at the fixed compressor speed, higher air inlet
temperatures will increase the evaporator cooling capacity and the refrigerant flow rate due
to an increased refrigerant-air temperature difference. Average heat flux qvag and
refrigerant mass flux Gavg at each channel will both become higher for the evaporator with
fixed heat transfer area and controlled constant exit superheat. They are defined by
following equations, respectively:

127
,
eavg
ref s
A= (6-1)
,
(1 )ref inavg
ref c
m xG
A
−=
&
(6-2)
Where Qe, refm& , xin are cooling capacity, total refrigerant mass flow rate and quality
right after the expansion valve. Aref,s and Aref,c are heat transfer surface area and
microchannel cross sectional area on the refrigerant-side. Since flash vapor is bypassed,
only actual refrigerant flow rate is that for only liquid refrigerant, i.e. (1 )ref inm x−& .
Higher average heat flux at a higher air inlet temperature intensifies bubble nucleation
and the following longitudinal expansion both upstream and downstream along the
microchannels. On the other hand, proportionally increased liquid mass flux results in
liquid filling the channels at a faster pace. Both effects intend to speed up the oscillation of
the reverse flow. Figure 6-10illustrates that as average heat flux increases from 8.37 kW/m2
to 10.8 kW/m2 the oscillation frequency rises up from 0.45 Hz to 0.58 Hz. It should be
noted that the oscillation frequency just varies slightly because of relatively small change
of average heat flux.
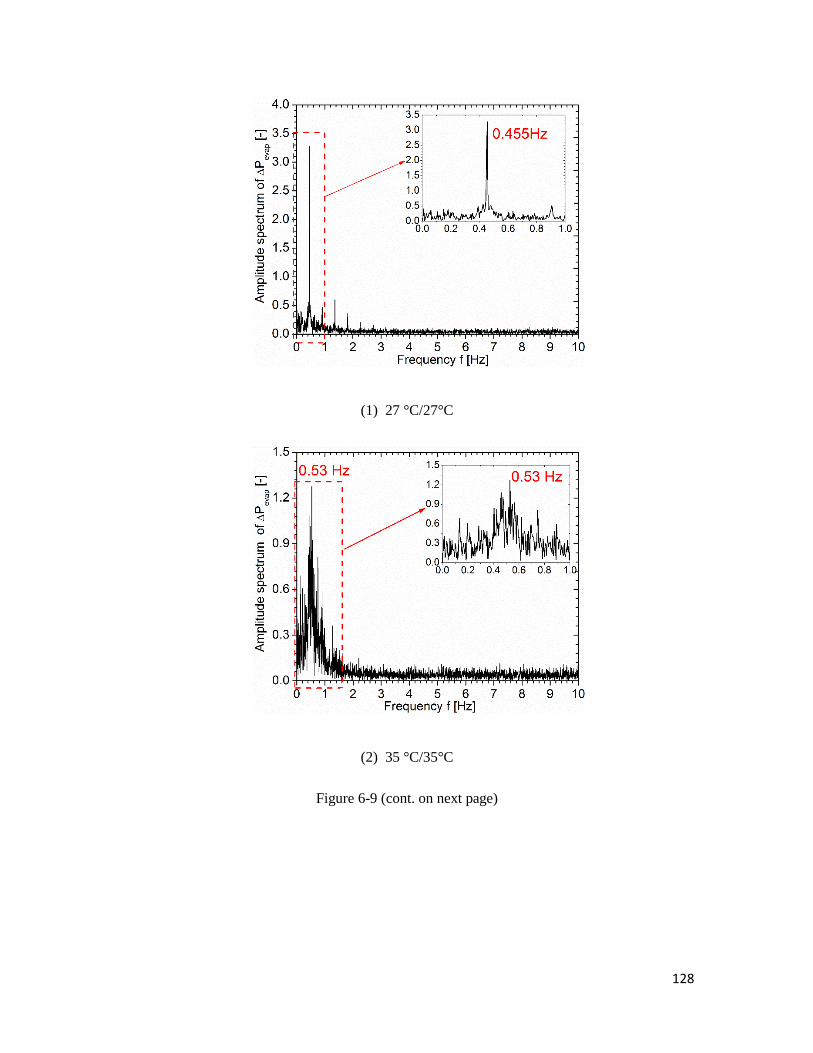
128
(1) 27 °C/27°C
(2) 35 °C/35°C
Figure 6-9 (cont. on next page)

129
(3) 43 °C/43°C
Figure 6-9 Pressure drop amplitude spectrum under different air inlet conditions
Figure 6-10 Variation of the dominant oscillation frequency as a function of average heat flux

130
6.3.4 IMPACTS OF REVERSE FLOW ON EVAPORATOR
PERFORMANCES
Periodic reverse flow and triggered boiling fluctuations will cause maldistribution of
refrigerant flow among parallel microchannel tubes. For microchannel evaporators in DX
mode, refrigerant maldistribution results from a combined effect of quality maldistribution
due to different vapor and liquid densities and inertia forces and due to periodic reverse
flow. It is very difficult to distinguish their individual impacts on evaporator performance.
The effects of periodic reverse flow are expected to be less significant than the quality
maldistribution for explored evaporator, since as shown in Figure 3-7 the large superheated
area on the left half of the evaporator is the consequence of vapor refrigerant predominantly
branching out through tubes near to the evaporator inlet.
One could expect that impact of reverse flow could be the only one disturbing factor in
FGB feeding mode which supposedly eliminates quality maldistribution by feeding liquid
only to the evaporator. On the other hand, the presence of reverse vapor that is periodically
discharged out of the microchannels creates trapped vapor in the header top. It will result
in oscillating vapor-liquid interface and thus obstruct feeding liquid only into each
microchannel tube in spite of the fact that the upstream flash gas separator supplies only
liquid to the inlet header. As shown in Figure 6-11(1), a liquid wave propagates from the
inlet toward the header end, creating an abrupt rise in the liquid surface, similar to a
hydraulic jump. At a certain moment, for example of t0 + 0.10 s, inlets of the first 3
microchannel tubes on the left are submerged in the wave crest, having the opportunity to
receive liquid refrigerant; while other tubes are still exposed to the vapor pocket, since

131
liquid surface ahead the abrupt rise is lower than the tube inlets. These tubes could only
take the vapor refrigerant. This would cause mild maldistribution of liquid refrigerant flow
among parallel microchannel tubes. A similar consequence would be expected when the
unstable wave travels backward after hitting the header end as shown in Figure 6-11(2).
In addition, reverse vapor flow may reduce local refrigerant-side heat transfer
coefficient. As discussed in previous section, backflow vapor trapped in the top header will
be re-entrained with a forward flow as long as the liquid surface does not reach or is not
close enough to the tube inlets. Very likely, the vapor entrainment will form a “dryout”
bubble slug without being surrounded by a thin liquid film between the channel wall and
vapor core, as illustrated in Figure 6-8. Thus, the local heat transfer coefficient in this
“dryout” vapor slug will be much lower than when tubes only receive liquid. Finally,
evaporator pressure drop will be increased, because trapped vapor will be recirculated into
the evaporator with reinstated forward flow.
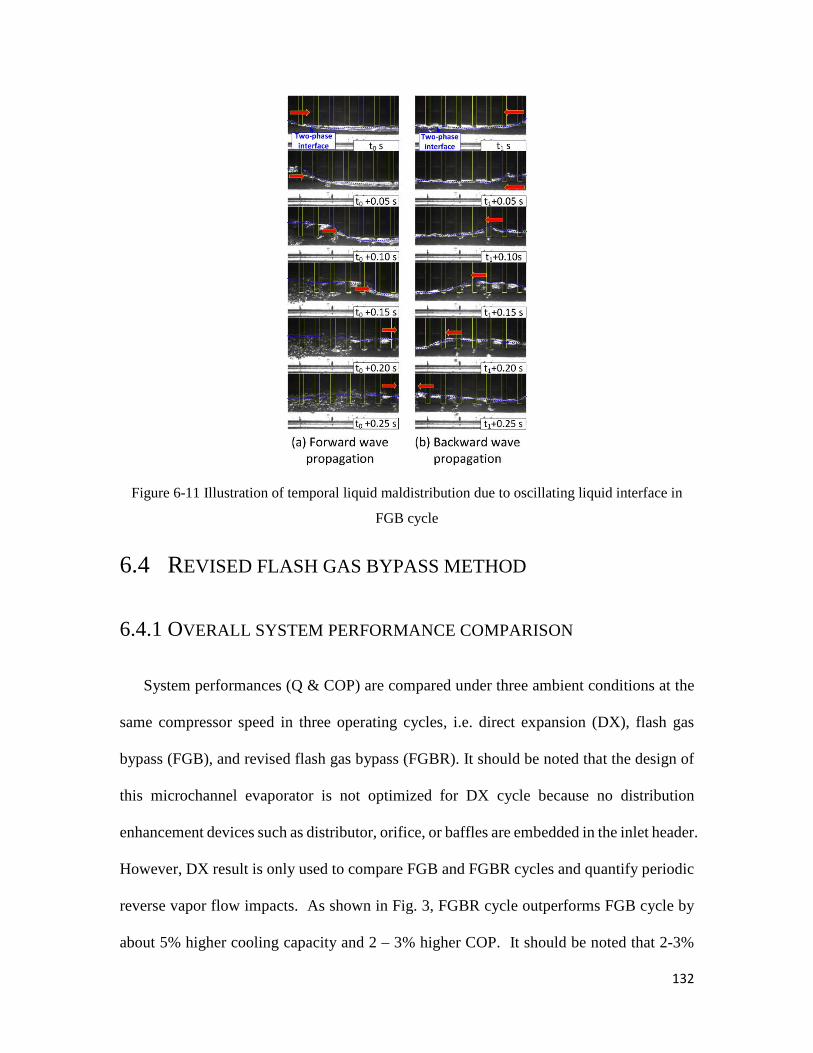
132
Figure 6-11 Illustration of temporal liquid maldistribution due to oscillating liquid interface in
FGB cycle
6.4 REVISED FLASH GAS BYPASS METHOD
6.4.1 OVERALL SYSTEM PERFORMANCE COMPARISON
System performances (Q & COP) are compared under three ambient conditions at the
same compressor speed in three operating cycles, i.e. direct expansion (DX), flash gas
bypass (FGB), and revised flash gas bypass (FGBR). It should be noted that the design of
this microchannel evaporator is not optimized for DX cycle because no distribution
enhancement devices such as distributor, orifice, or baffles are embedded in the inlet header.
However, DX result is only used to compare FGB and FGBR cycles and quantify periodic
reverse vapor flow impacts. As shown in Fig. 3, FGBR cycle outperforms FGB cycle by
about 5% higher cooling capacity and 2 – 3% higher COP. It should be noted that 2-3%
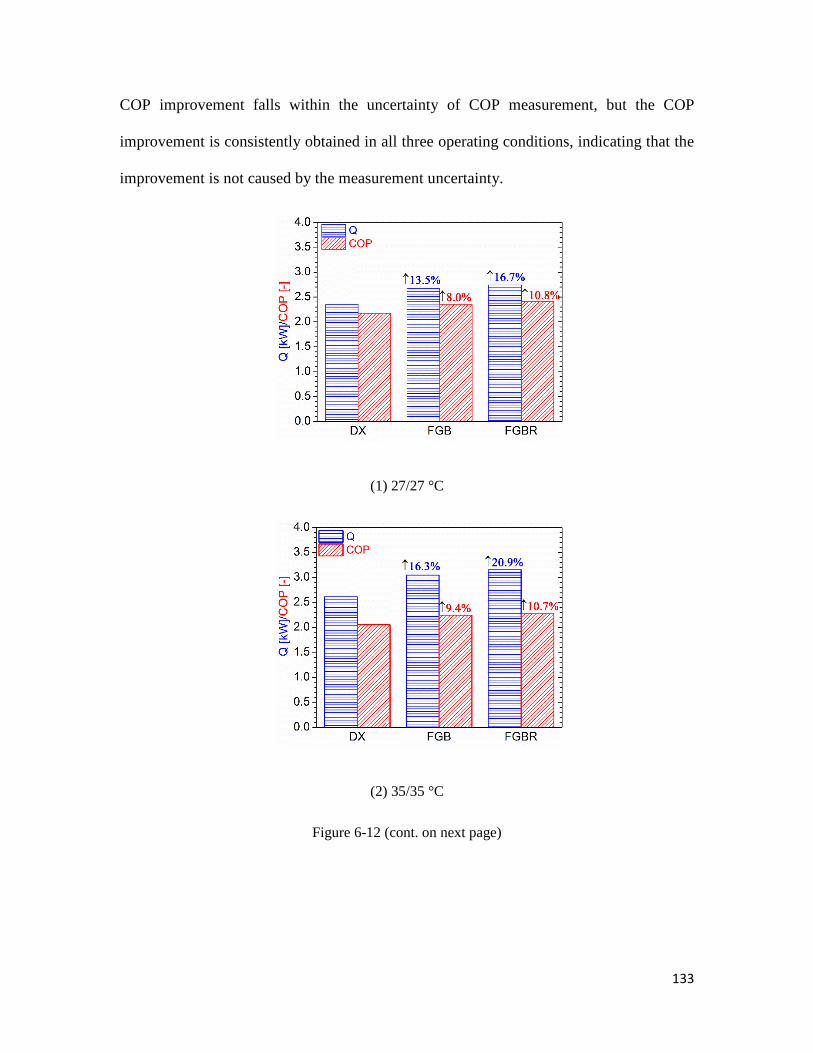
133
COP improvement falls within the uncertainty of COP measurement, but the COP
improvement is consistently obtained in all three operating conditions, indicating that the
improvement is not caused by the measurement uncertainty.
(1) 27/27 °C
(2) 35/35 °C
Figure 6-12 (cont. on next page)

134
(3) 43/43 °C
Figure 6-12 Comparison of A/C system performances in three operating cycles at the fixed
compressor speed
To have the only one measure of performance improvement (here COP), the
compressor speed is controlled to match the cooling capacity as DX cycle at each ambient
condition. As shown in Figure 6-13, FGBR cycle results in up to 12% higher COP
increment than FGB cycle. P-h diagram in Figure 6-14 depicts three operating cycles under
35°C/35°C condition to identify primary source of COP improvement. Compared to FGB
cycle, FGBR cycle further reduces the compressor speed 53 rpm to produce the same
cooling capacity. It can be seen that the evaporating temperature in the FGBR cycle is
12.1 °C, higher than 9.7 °C evaporating temperature in the FGB cycle. The elevation of
evaporating temperature increases the compressor suction pressure and therefore reduces
the compressor work. At the matched capacity, COP is higher in the FGBR cycle than in
the FGB cycle.

135
Figure 6-13 Maximum COP improvement when matching the cooling capacity
Figure 6-14 Comparison of the three cycles in p-h diagram

136
6.4.2 IMPROVED REFRIGERANT DISTRIBUTION
The distribution of liquid refrigerant mass flow through each channel would be very
difficult to directly measure. The evaluation of distribution using IR camera measuring
evaporator surface temperature can be used to evaluate refrigerant distribution inside
parallel tubes indirectly. Figure 6-15depicts the evaporator surface temperature profiles
under 27/27 °C condition. Parameter φcloser to 1 indicates more uniform distribution.
So,φ=0.828 in FGBR cycle being 4.2% higher than 0.795 in FGB cycle indicates improved
distribution by venting reversed vapor.
Distribution is a consequence of the situation in the inlet header and flow resistances
in the evaporator. Figure 6-16 compares the flow regimes at the inlet header without and
with vapor venting (FGB and FGBR cycles). In FGB cycle even only liquid refrigerant
flows into the inlet header, the header has significant volume of vapor. It is because of the
reverse vapor that is periodically discharged out of the microchannels. The vapor is trapped
in the volume above the ports of the channels and has no way of escaping but to be re-
entrained to the channels when the upward forward flow is re-instated. That will result in
oscillating vapor-liquid interface in the header. The oscillations are consequence of inertial
forces coming from the inlet liquid stream. That situation obstructs continuous feeding of
liquid only into each microchannel tube. In addition, at the moment when the liquid level
is below the tube inlets, only trapped reversed vapor is re-entrained into the microchannels,
very likely forming a “dryout” bubble slug which will have a much lower local heat transfer
coefficient than when tubes receive only liquid refrigerant.
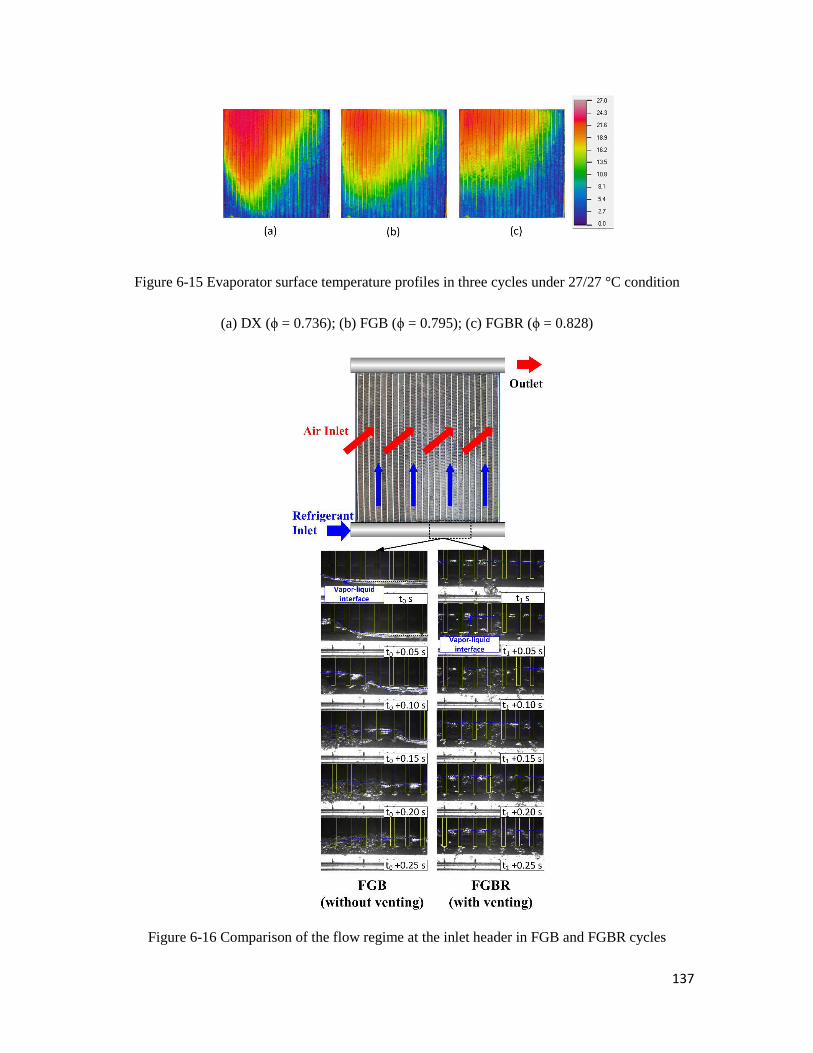
137
Figure 6-15 Evaporator surface temperature profiles in three cycles under 27/27 °C condition
(a) DX (ϕ = 0.736); (b) FGB (ϕ = 0.795); (c) FGBR (ϕ = 0.828)
Figure 6-16 Comparison of the flow regime at the inlet header in FGB and FGBR cycles

138
6.4.3 REDUCED EVAPORATOR PRESSURE DROP
As discussed in the Section 6.3.4, reverse vapor increases the pressure drop in the
evaporator due to re-entrainment. Vapor venting has the potential to overcome this problem.
Figure 6-17 shows the evaporator pressure drop measured at each ambient condition with
fixed compressor speed. FGB reduces the pressure drop up to 35% compared to baseline
DX cycle, because bypassing flashing vapor generated during the expansion process
reduces the refrigerant flow rate and average void fraction within the evaporator. The
refrigerant quality right after the expansion valve is about 25% (Figure 6-14), indicating
25% refrigerant flow being bypassed around the evaporator. In FGBR, the backflow vapor
trapped in the inlet header is further bypassed together with the flash vapor around the
evaporator instead of recirculation.
Figure 6-17 Evaporator pressure drops in three operating cycles

139
6.4.4 TEMPERATURE AND PRESSURE OSCILLATIONS
To compare the temporal oscillations, surface temperatures at three locations (1/4th,
1/2th, and 3/4th) along 8 and 12 microchannel tubes in both FGB and FGBR cycles at
35/35 °C conditions are shown in Figure 6-18(a) and (b). The oscillation amplitudes of
surface temperatures in FGBR cycle is less than 1 °C, much smaller than the corresponding
FGB cycle with up to 3 °C oscillation. This indicates more stable two-phase flow and heat
transfer within the microchannel tubes when venting the reverse vapor trapped in the inlet
header, which in turn contributes to the improved heat transfer performance of the
microchannel evaporator. Besides, the oscillation in FGBR cycle is in a faster speed, the
period is estimated only about 1.4 s, much lower than about 2.0 s period in FGB cycle.
Figure 6-18 Temporal oscillations of evaporator surface temperatures of microchannel tube

140
Figure 6-19(a) and (b) show effect of venting the reverse vapor on the oscillation
amplitude and period of the evaporator inlet pressure. It can be seen that vapor venting
reduces the inlet pressure oscillation amplitude up to 8 kPa, which is corresponding to
about 0.7 °C fluctuation of inlet saturation temperature. This is mainly because removing
vapor reduces the quantity of the backflow vapor temporarily stored in the vapor pocket
within the header (Figure 6-16) and affects the resultant pressure change. An increase in
heat flux applied on the microchannels results in a decrease of the pressure oscillation
period in both cases, but it appears faster and less sensitive with the heat flux in the case of
vapor venting. Reduced oscillation period may be due to two facts. First, vapor venting
would facilitate the backward progression of bubble elongation from the heated
microchannel tubes back to the header. As illustrated in Figure 6-16, when venting the
reverse vapor liquid surface appears to be more stable and smooth.
(a) Oscillation amplitude
Figure 6-19 (cont. on next page)
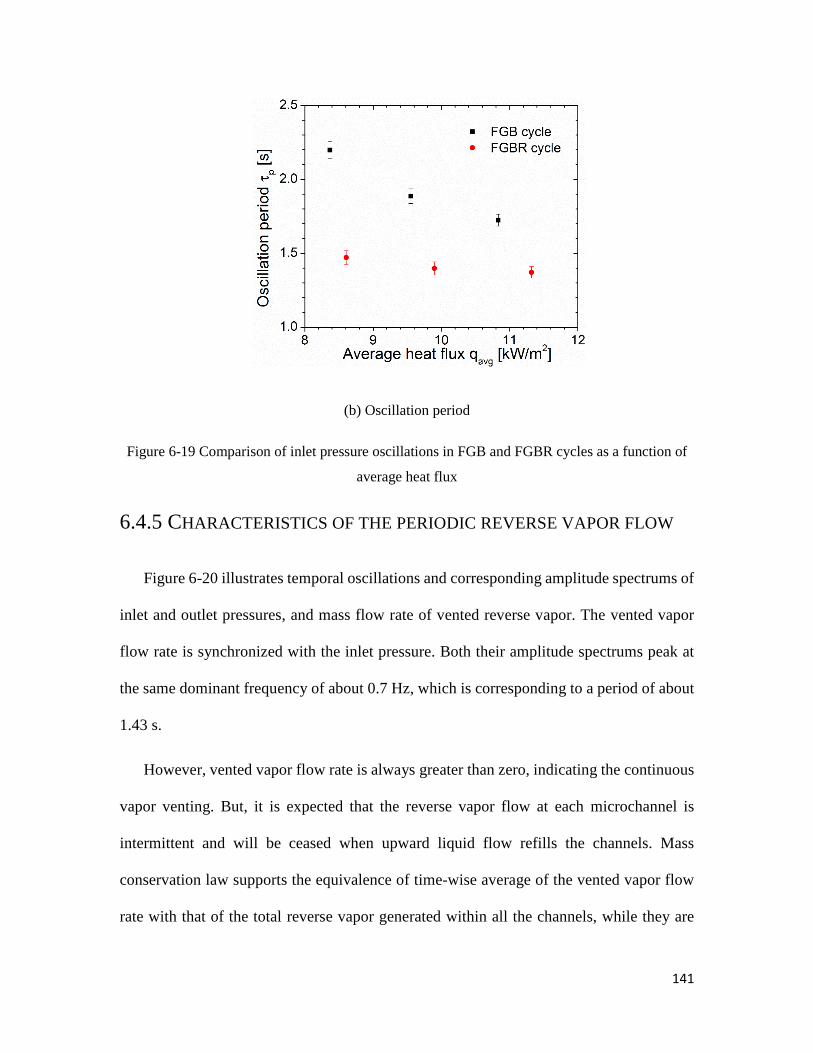
141
(b) Oscillation period
Figure 6-19 Comparison of inlet pressure oscillations in FGB and FGBR cycles as a function of
average heat flux
6.4.5 CHARACTERISTICS OF THE PERIODIC REVERSE VAPOR FLOW
Figure 6-20 illustrates temporal oscillations and corresponding amplitude spectrums of
inlet and outlet pressures, and mass flow rate of vented reverse vapor. The vented vapor
flow rate is synchronized with the inlet pressure. Both their amplitude spectrums peak at
the same dominant frequency of about 0.7 Hz, which is corresponding to a period of about
1.43 s.
However, vented vapor flow rate is always greater than zero, indicating the continuous
vapor venting. But, it is expected that the reverse vapor flow at each microchannel is
intermittent and will be ceased when upward liquid flow refills the channels. Mass
conservation law supports the equivalence of time-wise average of the vented vapor flow
rate with that of the total reverse vapor generated within all the channels, while they are

142
not dynamically equivalent to each other. That is the consequence of the fact that vented
flow is the function of the pressure difference between inlet header and point of connection
at the exit. Vapor reversed from the tube affects the pressure in the inlet header and thus
the vented flow.
(1a) Inlet/outlet pressure oscillation (1b) Inlet/outlet pressure amplitude spectrum
(2a) vented vapor mass flow rate oscillation (2b) vented vapor flow rate amplitude
spectrum
Figure 6-20 Temporal oscillations of measured pressures and vented vapor flow rate at
35°C/35°C condition
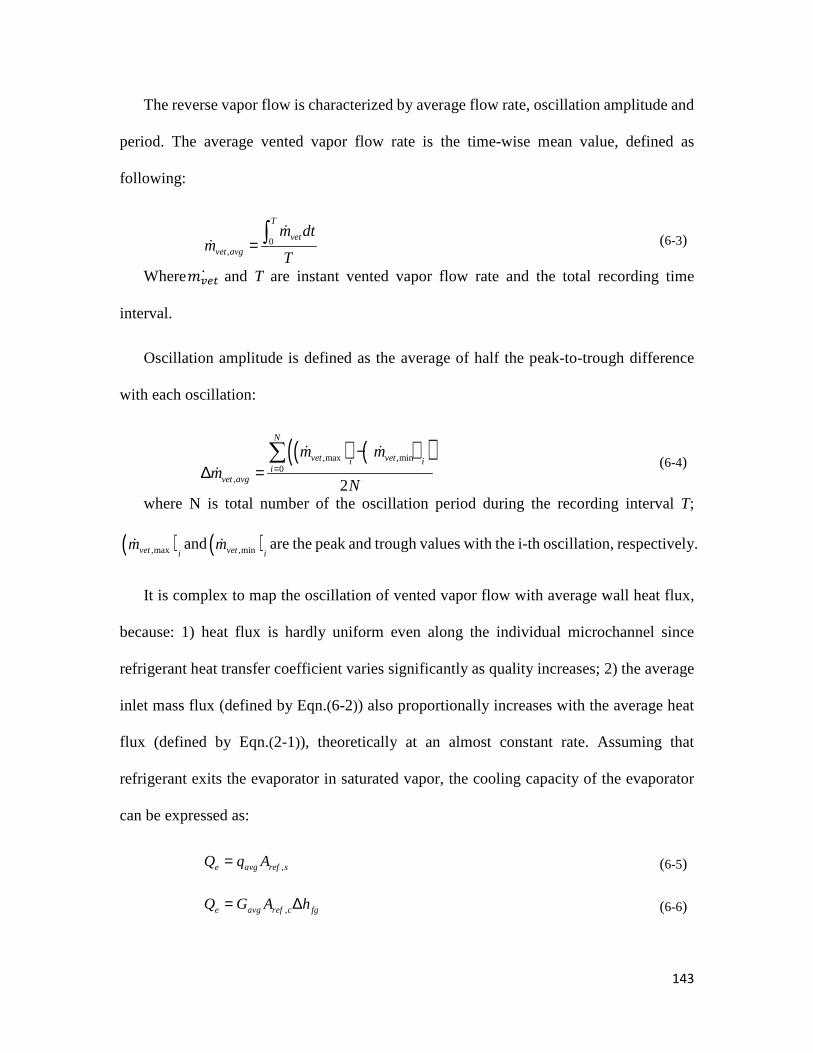
143
The reverse vapor flow is characterized by average flow rate, oscillation amplitude and
period. The average vented vapor flow rate is the time-wise mean value, defined as
following:
0,
T
vet
vet avg
m dtm
T= ∫
&
& (6-3)
Where����� and T are instant vented vapor flow rate and the total recording time
interval.
Oscillation amplitude is defined as the average of half the peak-to-trough difference
with each oscillation:
( ) ( )( ),max ,min0
, 2
N
vet veti ii
vet avg
m mm
N=
−∆ =∑ & &
& (6-4)
where N is total number of the oscillation period during the recording interval T;
( ),maxvet im& and( ),minvet i
m& are the peak and trough values with the i-th oscillation, respectively.
It is complex to map the oscillation of vented vapor flow with average wall heat flux,
because: 1) heat flux is hardly uniform even along the individual microchannel since
refrigerant heat transfer coefficient varies significantly as quality increases; 2) the average
inlet mass flux (defined by Eqn.(6-2)) also proportionally increases with the average heat
flux (defined by Eqn.(2-1)), theoretically at an almost constant rate. Assuming that
refrigerant exits the evaporator in saturated vapor, the cooling capacity of the evaporator
can be expressed as:
,e avg ref sQ q A= (6-5)
,e avg ref c fgQ G A h= ∆ (6-6)

144
For the current evaporator with rectangular shape microchannels, total refrigerant-side
heat transfer area Aref,s and cross-sectional area Aref,c can be written as:
, 4ref s h t p tA D L N N= (6-7)
2,ref c h p tA D N N= (6-8)
Where Dh and Lt are microchannel hydraulic diameter and total tube length; Np and Nt
are the number of channels in each flat tube and the number of parallel flat tubes.
Substituting Eqn. (6-6) - (6-8) into Eqn. (6-5) yields:
4 1avg t
avg h fg
G L
q D h=
∆ (6-9)
Eqn.(6-9) indicates that avg
avg
G
qis approximately a constant value for a given size
evaporator. Two variables cannot be varied independently. As shown in Figure 6-21, this
ratio is about 5.39, and all experimental results roughly fit on the theoretical value.
Figure 6-21 Relationship between average heat flux and mass flux at the microchannel tubes

145
Figure 6-22 shows effect of the average wall heat flux on average vented vapor flow
rate and its oscillation amplitude under three ambient conditions. Overall, it seems that
both average vented vapor flow rate,vet avgm& and the oscillation amplitude ,vet avgm∆ & increase
with the average heat flux qavg, but some data do not strictly follow the trend. This is
because both heat flux and mass flux affects the dynamic behavior of the reverse vapor
flow. In general, higher heat flux intensifies bubble nucleation followed by the longitudinal
expansion and therefore increases the reverse vapor flow rate. On the other hand, greater
mass flux intends to stabilize flow boiling by increasing incoming flow inertia and pressure
drop resistance upstream the reverse vapor.
Figure 6-22 Variations of average vented vapor flow rate and its oscillation amplitude with
average wall heat flux
Figure 6-23 shows the ratio of vented reverse flow rate to the total refrigerant flow
supplied to the evaporator, as an indicative of relative magnitude of the reverse vapor flow.
The instant peak value is up to about 13% of the total inlet flow rate while the instant
minimum is almost 0. The average vented vapor flow rate varies in a range of about 2% to

146
8% at conditions explored in this study. Figure 6-24 depicts characteristic oscillation period
of the vented reverse vapor flow as a function of average heat flux. It decreases from about
2 s to 1.4 s with heat flux increasing, indicating a more intensive reverse vapor flow.
Figure 6-23 Ratio of the vented vapor flow rate to total inlet flow rate
Figure 6-24 Oscillation period of the vented reverse vapor flow rate

147
6.5 SUMMARY AND CONCLUSIONS
This paper presented experimental study of periodic reverse flow and boiling fluctuations in a
microchannel evaporator with horizontal headers and parallel vertical upward microchannel tubes
used in an R134a A/C system.
Simultaneous flow visualizations and pressure measurements revealed that the oscillations of
evaporator inlet pressure and overall pressure drop are caused by the reverse vapor flow and the
dynamic interaction of the heated microchannels and the inlet header. According to refrigerant flow
condition within the microchannel tubes, one complete oscillation cycle can be divided into three
consecutive steps: 1) reverse vapor flow; 2) vapor re-entraining in forward flow; 3) liquid refilling
in forward flow.
Three potential major impacts of periodic reverse flow and boiling fluctuations are identified
in FGB cycle: 1) moderate maldistribution of liquid refrigerant due to vapor-liquid interface
oscillations around the tube inlets; 2) reduced local heat transfer coefficient due to formation of a
“dryout” bubble slug; 3) increased pressure drop as reversed vapor is recirculated through the
evaporator.
To mitigate impacts, a revised FGB cycle with venting reverse vapor flow (FGBR) is proposed
and, an experimental comparison to a FGB cycle demonstrated that the FGBR cycle resulted in an
up to 5% larger cooling capacity and an up to 3% higher COP when operated at identical test
conditions. In addition, when capacities of both systems are matched by varying compressor speed,
the maximum COP improvement is approximately 12%. By venting the reverse vapor out of the
inlet header, the liquid level within the inlet header is stabilized and elevated above all the tube
inlets. Thus, compared to FGB system, refrigerant distribution becomes more uniform since each
tube will receive almost only liquid refrigerant as long as the forward flow is periodically re-
instated. The improved liquid refrigerant distribution increases the overall heat transfer coefficient.

148
In addition, the evaporator pressure drop is further decreased because venting the reverse vapor
decreases the refrigerant mass flow rate and average void fraction within the evaporator.
Vented reverse vapor mass flow rate oscillates periodically and in-sync with fluctuations of
evaporator inlet pressure. Its temporal mean value and oscillation amplitude increase proportionally
to average wall heat flux. The ratio of vented vapor flow rate to total inlet refrigerant flow rate
varies in the range 8% to 2% at explored conditions of qavg = 7.5 ~ 11.5 kW/m2 and Gavg = 40 ~ 65
kg/m2s. Oscillation period increases from about 1.4 s to 2 s as average heat flux decreases.
149
Chapter 7 VISUALIZATION AND MEASUREMENT OF
PERIODIC REVERSE FLOW AND BOILING FLUCTUATIONS
7.1 INTRODUCTION
This chapter presents a simultaneous visualization and measurement on periodic
reverse flow and boiling fluctuations of R-134a in a parallel flow microchannel evaporator
used for air-conditioning systems. The visualization study shows that the microchannel
repeats the transient flow patterns with two stages: liquid rewetting stage, and transient
annular evaporating/dewetting stage. Correspondingly, five transient flow patterns are
identified along the microchannel: bubbly flow, elongated bubble, liquid lump flow,
annular flow, and mist/dryout flow. The reverse flow is observed to begin with the
elongated bubble flow at the upstream channel and continue until the transient annular film
evaporating/dewetting stage, indicating that the existing immeasurable high pressure
within the elongated bubble or at a certain location in the annular flow exceeds the channel
inlet and exit pressure. The period of the pressure drop fluctuation and flow pattern
alternation are almost identical with that of the reverse flow, and it decreases from 1.49 s
to 1.13 s when the average heat flux increases from 14.1 kW/m2 to 18.3 kW/m2. The
decrease in oscillation period is mainly due to the shortened time interval for the annular
film evaporating/dewetting stage.
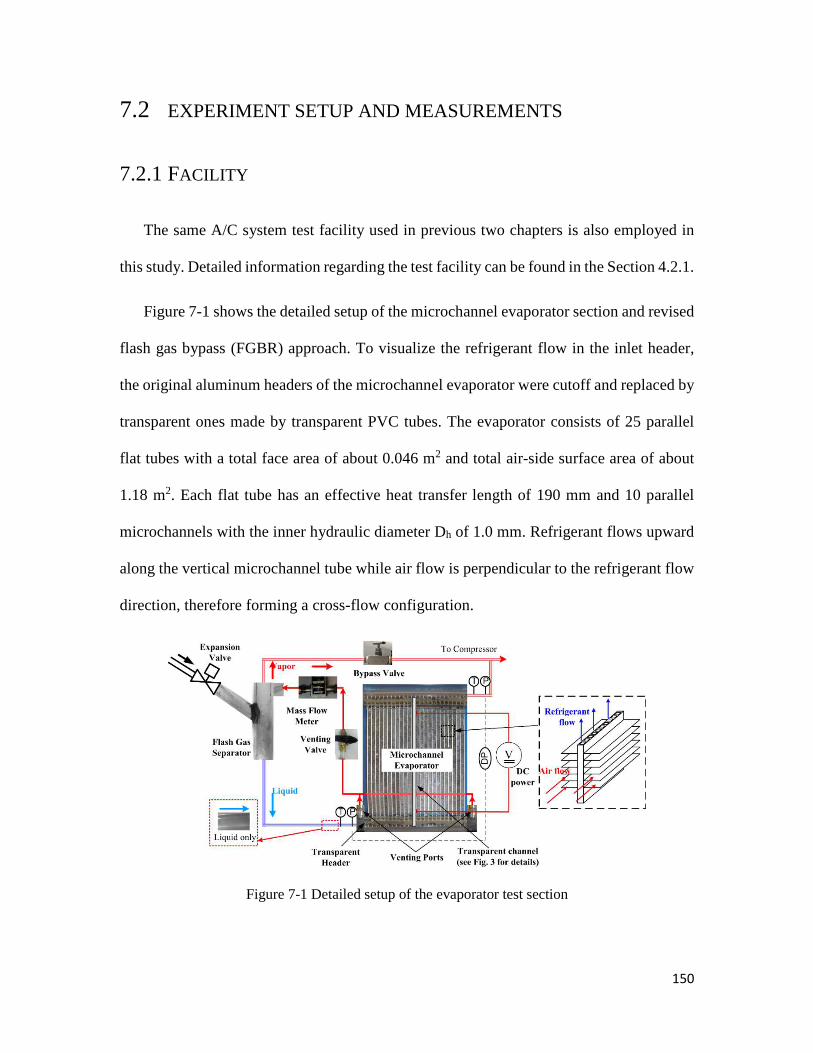
150
7.2 EXPERIMENT SETUP AND MEASUREMENTS
7.2.1 FACILITY
The same A/C system test facility used in previous two chapters is also employed in
this study. Detailed information regarding the test facility can be found in the Section 4.2.1.
Figure 7-1 shows the detailed setup of the microchannel evaporator section and revised
flash gas bypass (FGBR) approach. To visualize the refrigerant flow in the inlet header,
the original aluminum headers of the microchannel evaporator were cutoff and replaced by
transparent ones made by transparent PVC tubes. The evaporator consists of 25 parallel
flat tubes with a total face area of about 0.046 m2 and total air-side surface area of about
1.18 m2. Each flat tube has an effective heat transfer length of 190 mm and 10 parallel
microchannels with the inner hydraulic diameter Dh of 1.0 mm. Refrigerant flows upward
along the vertical microchannel tube while air flow is perpendicular to the refrigerant flow
direction, therefore forming a cross-flow configuration.
Figure 7-1 Detailed setup of the evaporator test section

151
Only liquid refrigerant is fed into the inlet header since flashing vapor generated during
the isenthalpic expansion process is separated in the flash gas separator and bypassed to
the compressor suction line. The flash gas separator is properly sized and designed to assure
fully separation of vapor and liquid refrigerant. Thus, quality maldistribution due to the
flashing vapor is essentially eliminated. Two venting ports are added on both ends of the
inlet header, letting out the reverse vapor trapped in the inlet header back to the upstream
flash gas separator. A mass flow meter with low pressure drop is installed on the venting
line to measure the dynamic flow rate of the reverse vapor flow. Table 1 lists the operating
conditions for the A/C system. The uncertainties for pressure, temperature and mass flow
rate measurements are about ± 3.56 kPa, ±0.5 ºC and ±0.1%, respectively. The resulting
uncertainties for the capacity and COP measurements are about 3.3% and 3.6%.
7.2.2 FLOW VISUALIZATION IN MICROCHANNELS
As shown in Figure 7-1 and Figure 7-2, one additional transparent Pyrex glass tube is
added on the front side and middle position of the original microchannel evaporator, in
parallel to other aluminum channels. The glass tube has inner and outer diameters of
1.0±0.1 mm and 4.9±0.4 mm. Its hydraulic diameter and total length are identical to other
aluminum channels. Being connected to the same headers, they are subjected to the
identical pressure difference. To bring the heat to the refrigerant flow and load it same as
in other channels, three identical Nichrome resistance wires are glued on the outer wall of
the Pyrex glass tube by thermal conductive paste. In addition, the thermal paste is applied
evenly around the circumference of the glass tube, except that only a small portion is left
uncovered for flow visualization. Objective of this design is to dissipate the electric heat

152
generated by three resistance wires relatively uniformly around the perimeter at a given
axial location in the same way and load as every other channel in the evaporator.
Figure 7-2 Transparent glass tube for flow pattern visualization
A high-speed CCD camera is used to visualize the transient flow pattern in the glass
microchannel at a recording frequency of 1000 frame/s (fps) and an image resolution of
512×512 pixels. A high-speed datalogger is used at a sampling rate of 100 Hz recorded
simultaneous fluctuations of the inlet/outlet pressures measured by two pressure sensors
and the pressure drop measured independently by a pressure differential transducer. The
pressure transducer used in this study has a response time of 5 millisecond (f = 200 Hz),
indicating that the sensor is able to capture the transient fluctuations at 100 Hz.
The camera and data logger were synchronized to be able to relate flow regimes and
pressure signals. To obtain a good spatial resolution of bubble growth and reverse flow,
the entire transparent tube is divided into five equal observation sections to be visualized

153
separately, as depicted in Figure 7-2, but the corresponding flow visualization has to be
performed at different times, and the overall flow pattern alternation along the entire
channel are not directly obtained. To link synchronized visualizations and pressure signals
in each section the pressure drop data are used as the time-wise reference signal to link and
compare the separately recorded flow pattern at each section, since the pressure drop
fluctuation shows a clear cyclic behavior and good repeatability. Figure 7-3 and Figure 7-4
show the DP frequency-amplitude spectrum, and the average ∆P and oscillation amplitude
A∆P during the synchronized video recording for different sections. Obviously, each
spectrum has almost identical peak frequency and amplitude, and the deviation of ∆P and
A∆P from their average value is less than 2%. Thus, the pressure drop signal has good
temporal repeatability and periodicity, which justifies its use as the time-wise reference
signal.
Figure 7-3 Frequency and amplitude spectrums of evaporator pressure drops corresponding to
synchronized flow visualizations at different sections at 35/35 °C conditions

154
Figure 7-4 Repeatability of measured evaporator pressure drops and oscillation amplitudes
corresponding
7.2.3 DETERMINATION OF THE ELECTRIC HEATING POWER
DC voltage controls the heating power used to evaporate refrigerant in the glass tube.
In open literature, the heating of refrigerant is achieved directly on a single channel or in
some cases on a copper base substrate which spreads the heat to parallel channels. Our
situation (microchannel evaporator is a part of a real A/C system) has hot air with certain
inlet velocity and temperature to heat up hundreds of parallel microchannels and naturally
the flow rate and heat flux for each channel is consequence of the interactions and seldom
exactly uniform. In addition, the refrigerant flow at the channel exit should be superheated
vapor (or at least average of all of them) because of thermal expansion valve control used
by A/C systems. Thus, the following procedure is employed to control applied heat on the
glass tube. First, DC voltage is coarsely adjusted until the observed flow pattern in the last
section (S-5) is in single phase vapor flow randomly entraining few dispersed droplets.
Further, the fine adjustment is based on the superheated tube area which is determined by
surface temperature profile. An infrared camera with a spatial resolution of 320×240
pixels is used to measure the surface temperature of the glass tube and aluminum
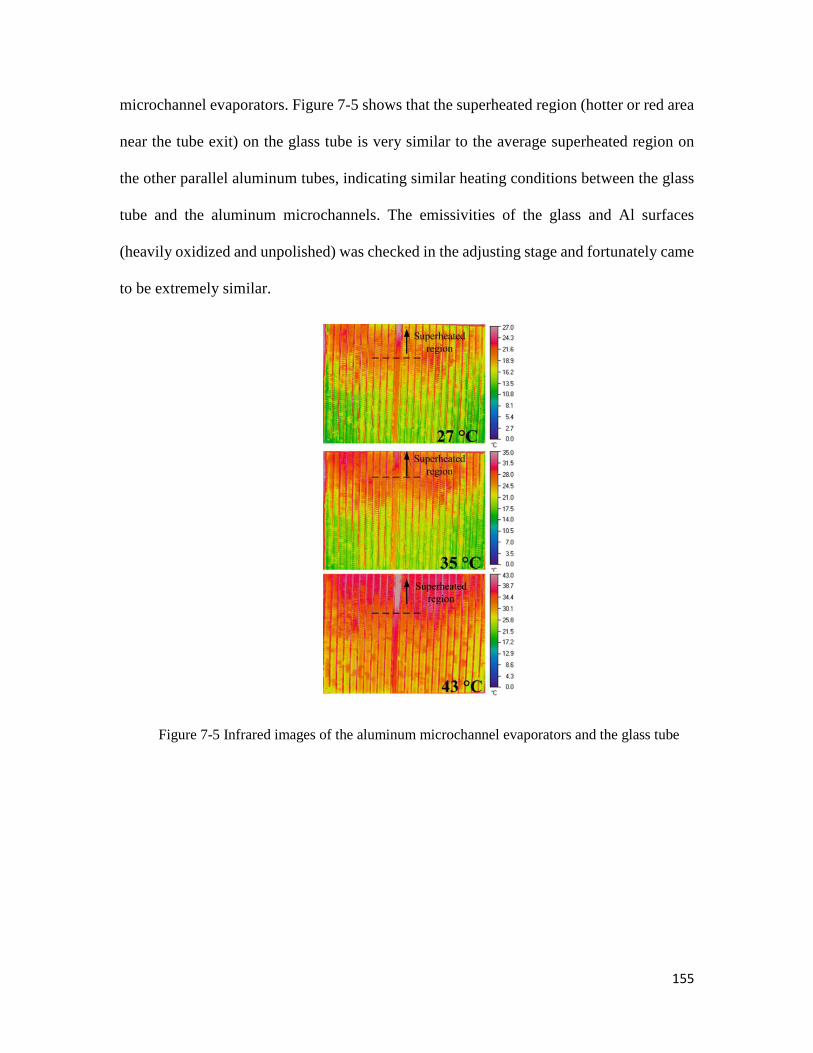
155
microchannel evaporators. Figure 7-5 shows that the superheated region (hotter or red area
near the tube exit) on the glass tube is very similar to the average superheated region on
the other parallel aluminum tubes, indicating similar heating conditions between the glass
tube and the aluminum microchannels. The emissivities of the glass and Al surfaces
(heavily oxidized and unpolished) was checked in the adjusting stage and fortunately came
to be extremely similar.
Figure 7-5 Infrared images of the aluminum microchannel evaporators and the glass tube

156
7.3 RESULTS
7.3.1 TRANSIENT FLOW PATTERNS IN EACH VISUALIZATION
SECTION
In general, typical flow patterns observed in a vertical microchannel include: isolated
(dispersed) bubbly flow, confined bubbly flow, slug (elongated bubbly) flow, churn flow,
slug-annular flow, annular flow, and mist flow. The most of the flow patterns are observed
in a single microchannel at a steady flow condition, i.e. constant mass flux and heat flux.
Nevertheless, in parallel flow microchannel evaporators used in A/C systems, the presence
of the periodic reverse flow implies the transient flow condition and therefore at the same
location different flow patterns is expected to occur due to alternating flow directions. Five
visualization sections along the channel are divided into three groups, depending on the
flow pattern transition: the entry section (S-1) – refrigerant flow begins with liquid or
bubbly flow; middle section (S-2,S-3,S-4) – refrigerant flow starts with elongated bubble
or long vapor slug or slug/annular flow; exit section (S-5) – refrigerant is always
superheated vapor with entrained dispersed droplets. The following sections only present
and analyze the flow pattern transition at the entry and middle sections at 35/35 ºC
operating condition.
7.3.2 FLOW PATTERN AT THE ENTRY SECTION (S-1)
Figure 7-6 and Figure 7-7 show the evaporator pressure drop fluctuation and the
corresponding flow pattern at section 1 (S-1). The pressure drop oscillates in a clearly

157
periodic pattern with an average value of about 5.87 kPa, oscillation amplitude of about
5.28 kPa, and cycle period of about 1.37 s.
A full cycle of the flow pattern alternation can be divided into two stages: liquid
rewetting stage (L) and annular film evaporating/dewetting stage (A). The onset of each
stage is also annotated on the pressure drop signal (See Figure 7-6). The average time
elapsed between two successive rewetting stages is about 1.37 s, the same for the pressure
drop oscillation. This coincidence indicates that the pressure drop fluctuation strongly
relates to the periodic alternation of the flow pattern. The time durations for two stages are
observed to be τ1 = 0.41 s andτ2 = 0.96 s, indicating that the transient film
evaporating/dewetting takes approximately twice longer than rewetting stage.
As shown in the frame 1, Figure 7-7, the fresh liquid is initially in the bubbly flow
pattern, indicating the onset of the bubble nucleation at the upstream location. This is
because the refrigerant is in a saturated liquid state, and any longitudinal heat conduction
and/or sudden drop saturation pressure resulted from transient pressure fluctuation may
cause the bubble nucleation prior to the heated section (S-1). Then, following the bubbly
flow is a series of bubbles in the elongated, bullet shape and with spherical cap and flat tail
that occupy most of the cross section. The confined elongated bubbles are resultant of
liquid evaporation and coalescence of successive bubbles. The liquid refrigerant is mainly
contained in liquid plugs which separate successive elongated bubbles, while the rest exists
as films between the bubbles and the channel wall. As time proceeds, in the frame 5, the
elongated bubble passing through the section 1 becomes longer comparable to the length
of the visualization window (38 mm). The in-between liquid bridge becomes thinner and

158
thinner, and ruptures into local liquid bumps at the frame 6. This is the transition liquid
ring flow to the following annular flow as shown in the frame 7 and 8.
L: liquid rewetting; A: annular film evaporating/dewetting
Figure 7-6 Temporal variations of ∆Pevap corresponding to synchronized flow pattern in S-1
(a) Liquid/bubbly flow entering the section 1; (b) elongated bubble; (c) liquid bridge between
vapor slugs; (c) rupture of the liquid bridge; (d) transient annular flow
Figure 7-7 Transient flow patterns during one oscillation cycle at section S-1

159
The flow pattern transition indicates varying liquid flow which is a consequence of the
reverse flow. Figure 7-8(a) and (b) show the flow dynamics of two adjacent bubbles which
are in a bubble train as show in Figure 7-8 (c). In Figure 7-8(a) the bubble axial lengths
initially experience a linear growth with a constant rate of about 6.38 µm/ms. Such pattern
suggests that the bubble growth might be inertia controlled. Until tc = 60 ms when the
bubbles reach almost to the size of the tube diameter, the axial length grows exponentially,
which indicates the intensive evaporation of the thin liquid layer between the wall and
bubbles. Many others also observed and reported such similar two-stage growth of the
nucleation bubble in microchannels but at different growth rate (Li et al, 2004; Fu et al.,
2010; Bogojevic et al., 2013).
Figure 7-8(b) shows the axial locations of bubble two interfaces. Initially, the bubbles
in a size smaller than channel diameter move freely upward with the bulk flow. The bubble
motion slows down due to the clogging of the growing bubbles at downstream and becomes
stationary at about 30 ms. Then the bubbles begin to flow backward since the downstream
elongated bubble expands reversely and pushes all the upstream bubbles and liquid
downwards. This is because the rapid growth of those downstream elongated bubbles
temporarily increases the pressure drop such that the pressure difference across the channel
is insufficient to drive the entire flow forward. At about 80 ms, the upstream bubbles are
also confined by the channel walls, the #2 bubble stops backflow as indicated by the
increasing axial location of both ends. The reverse flow location seems to shift to the #1
bubble of which the interfaces expand in the opposite direction. This may be because the
pressure within the #1 bubble is temporarily higher than the channel inlet and outlet

160
pressure. It can be concluded that for this microchannel evaporator, the location for the
onset of the reverse flow is before the end of section 1 (S-1).
(a) Bubble axial length
(b) Axial location of bubble interfaces (upstream and downstream)
Figure 7-8 (cont. on next page)

161
(c) The bubble growth and movement (arrow indicate direction and its length velocity)
Figure 7-8 Bubble dynamics in the reverse flow
7.3.3 FLOW PATTERNS IN THE MIDDLE SECTION (S-2, S-3, S-4)
Figure 7-9 - Figure 7-14 show the flow pattern visualization and simultaneous pressure
drop fluctuations at middle sections (S-2, S-3, and S-4). They are also found to be in a two-
stage flow pattern transition. But, since the refrigerant quality gradually increases along
the microchannel, fresh liquid during the rewetting stage in the middle section typically
begins in the form of the elongated bubble or vapor slug/annular flows.
As shown in Figure 7-9 and Figure 7-10 for section 2 (S-2),in each oscillation cycle the
refilling flow enters the section 2 (marked as “S”) about 100 ms after the onset of rewetting
stage at the section 1. This delay is due to the time duration for liquid front travel through
the section 1. Those elongated bubbles are separated by thin liquid plugs. In time, the liquid
slug becomes thinner and eventually breaks up into the liquid bumps to form the
transitional “liquid ring” flow that precedes the annular flow pattern (“A” as marked in
Figure 7-10).

162
Similarly in the section 3, as shown in Figure 7-11and Figure 7-12, the transient flow
patterns evolves from the elongated bubble (slug) flow (rewetting stage) and annular flow
(transient annular evaporating/dewetting stage). The onset of the first stage is
approximately 50 ms later than in S-2 section. For the section 4 (Figure 7-13 and Figure
7-14), the liquid bumps, generated by the liquid plug breakup upstream, are observed
intermittently passing through and wetting the tube wall. The time duration for rewetting
stage (C-A) is only about 0.21 s, much shorter than those in preceding sections due to
higher local vapor quality (less liquid refrigerant). Correspondingly, the transient annular
evaporating/dewetting stage lasts longer.
Figure 7-9 Temporal variations of pressure drop corresponding to synchronized flow pattern
in S-2

163
(a) Liquid plug between successive elongated bubbles; (b) liquid rings; (c) transient annular
flow
Figure 7-10 Transient flow patterns during one oscillation cycle in S-2
Figure 7-11 Temporal variations of evaporator pressure drop corresponding to synchronized
flow pattern in section S-3

164
(a) Thin liquid bridge separating two successive vapor slugs; (b) transient annular flow
Figure 7-12 Transient flow patterns during one oscillation cycle in S-3
Figure 7-13 Temporal variations of pressure drop corresponding to synchronized flow pattern
in S-4

165
(a) Thin liquid bridge separating two successive vapor slugs; (b) transient annular flow
Figure 7-14 Transient flow patterns during one oscillation cycle in S-4
7.3.4 TRANSIENT FLOW VISUALIZATION AT THE INLET HEADER
Figure 7-15 and Figure 7-16 depict the flow regime at one portion of the inlet header
which includes the transparent channel and a few adjacent aluminum tubes and the
simultaneous measurement of the pressure drop fluctuation. Since the reverse vapor
discharged in the inlet header is continuously vented out through the venting ports located
at both ends of the inlet header, the vapor-liquid interface in the header is elevated above
all the entries to the microchannels, the header was almost filled up with liquid refrigerant,
which guarantees feeding liquid only into each channels ( Tuo and Hrnjak, 2012, and 2013).
Frame 1 in Figure 7-16 shows that the reverse flow causes the temporary downward
expansion of the interface of an elongated bubble, pushing the liquid out of the channel.
After 140 ms, the backflow vapor is being continuously discharged out of the channel to

166
the liquid pool in the header. Meanwhile, a series of bubbles in different sizes are shattered
off the reverse vapor near the channel mouth, flow upward due to buoyance force. Until
about t0 + 440 ms (Frame 4), the last bubble attached to the channel mouth begins to shrink,
indicating that upward flow is re-established and the surrounding liquid pushes the bubble
back into the channel. Frame 5 clearly shows that the refresh liquid nose moves upward,
refilling the channel. The moments when the first reverse bubble is discharged out of the
channel (V) and when the fresh liquid entering the channel (F) are marked on the
synchronized pressure drop signal in Figure 7-15. In each oscillation cycle, flow reversal
approximately coincides with the pressure drop decreasing. At the same moment, the flow
pattern along the channel happens to be in the transient annular evaporating/dewetting
stage as denoted in Figure 7-7 to Figure 7-14. However, the exact moment when backflow
starts should be prior to the time instant V, as Figure 7-8(c) clearly indicates that the onset
of the bubble bi-directional expansion happens during the liquid rewetting stage. This time
difference is attributed to two facts: 1) the reversed bubble should take certain time to travel
from its location to the channel mouth; 2) the backflow velocity may be varied with respect
to time. The average velocity of the bubble front which is discharged out of the channel
can be estimated based on the change of vertical pixel position of the bubble front and of
the corresponding frame number, as following:
0 1
0 1rev
p p SU
f f F
−=−
(1)
p0 and p1 are the pixel position of the bubble front at corresponding frame number f0
and f1. S and F represent respectively the image scale (0.143 mm/pixel) and the frame rate
(1000 frame/s).

167
During the 10 s synchronized high speed video, thee estimated reverse vapor front
velocity varies significantly in the range of 0.12 m/s ~ 1.05 m/s, which indicates somewhat
random dynamics of the reverse vapor flow.
F: fresh liquid begins to enter the channel to re-establish the upward forward flow;
V: The reverse vapor begins to be discharged out of the channel entry
Figure 7-15 Temporal oscillation of the evaporator pressure drop corresponding to the
synchronized visualization of the reverse flow near the tube entry

168
(a) The elevated liquid level above entries to the channels; (b) The front cap of the elongated vapor expanding downward; (c) The vapor discharged out of channel; (d) Upward flow re-established, and the last reverse vapor is undetached due to the surface tension, and its size is shrinking because surrounding liquid refrigerant flows into the channel, thus pushing the vapor back;(e) Fresh liquid enters the microchannel, and bright part is the front nose of the fresh liquid flow
Figure 7-16 Transient flow pattern at the entry of the transparent tube (red arrow denotes flow
direction)

169
7.4 DISCUSSION
7.4.1 TRANSIENT FLOW PATTERNS IN THE ENTIRE CHANNEL
Previous section presents transient flow patterns for 6 visualization sections (5 in the
tube and 1 in the header) and the corresponding synchronized evaporator pressure drop
signal. As discussed in Section 2.2, using the pressure drop signals as the time reference
can combine the temporal evolution of the flow pattern for each section which is taken at
different times, and therefore make it possible sketch the flow pattern in the entire channel
and the inlet header.
Figure 7-17(a) and (b) show the one complete oscillation cycle of the evaporator
pressure drop and a frame sequence which sketch the transitional flow patterns along the
channel and the reverse flow. As depicted in Frame 1, the fresh liquid refrigerant refills
the channel in the upward direction, maybe at a relatively high velocity since the channel
at the downstream of the liquid nose should be almost dryout and occupied by the vapor
refrigerant evaporated from the preceding cycle. Nevertheless, there could be few residual
liquid rivulets which are not yet fully evaporated and retained on the channel wall. In the
frames 2-4, the bubbles elongate due to both liquid evaporation and coalesce of successive
bubbles, which will accelerate liquid front and increase downstream flow resistance.
Consequently, the fresh liquid entering the channel is being slowed down. Until the frame
5, one elongated bubble around S-1 section expands in both upstream and downstream
directions, indicating the beginning of the reverse flow. Thus, the vapor and liquid
refrigerant upstream of this bubble will be expelled out of the channel, whilst the
downstream refrigerant still travels toward the channel exit. As shown in Fig. 14(a), point

170
5, the channel inlet pressure still exceeds the exit pressure, indicating that high,
immeasurable pressure within the expanding elongated bubble causes the reverse flow.
At the Frame 7, the flow in the entire channel evolves into the annular and followed
dewetting transient stage. Meanwhile, the reverse vapor is still discharged out of the
channel. Dewetting and then dryout on the channel wall is due to two facts. First, the
continuous evaporation without supply of the fresh liquid from the inlet will reduce
thickness of the residual liquid film. Second, in the vertical channel, the gravity force will
facilitate the backflow to drain off the residual liquid film against surface tension force
which retains the liquid. The dewetting followed by dryout will significantly reduce the
vapor generation from the liquid film evaporation. Consequently, the inlet pressure will
return back to the highest pressure in the channel, and forward flow is re-initiated. As
shown in Frame 9, fresh liquid refills the dryout channel, which is the beginning of the next
cycle of the periodic reverse flow.
(a) One complete cycle of the evaporator pressure drop fluctuation
Figure 7-17 (cont. on next page)
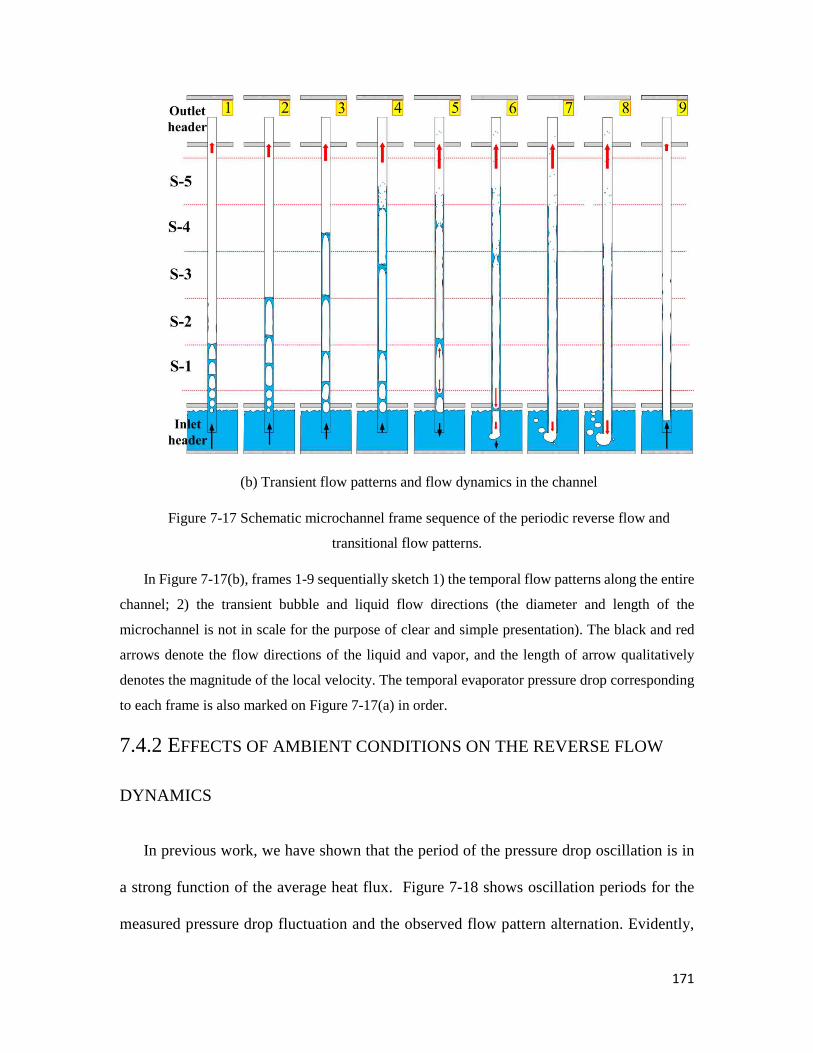
171
(b) Transient flow patterns and flow dynamics in the channel
Figure 7-17 Schematic microchannel frame sequence of the periodic reverse flow and
transitional flow patterns.
In Figure 7-17(b), frames 1-9 sequentially sketch 1) the temporal flow patterns along the entire
channel; 2) the transient bubble and liquid flow directions (the diameter and length of the
microchannel is not in scale for the purpose of clear and simple presentation). The black and red
arrows denote the flow directions of the liquid and vapor, and the length of arrow qualitatively
denotes the magnitude of the local velocity. The temporal evaporator pressure drop corresponding
to each frame is also marked on Figure 7-17(a) in order.
7.4.2 EFFECTS OF AMBIENT CONDITIONS ON THE REVERSE FLOW
DYNAMICS
In previous work, we have shown that the period of the pressure drop oscillation is in
a strong function of the average heat flux. Figure 7-18 shows oscillation periods for the
measured pressure drop fluctuation and the observed flow pattern alternation. Evidently,

172
they are almost identical with each other at various ambient conditions and decrease with
average heat flux increasing. This confirms that the pressure drop fluctuation is related to
the flow pattern alternation which is caused by the periodic reverse flow. Further, Figure
7-19 shows two time periods for the liquid refilling stage τ1 and annular/dewetting stage τ2.
For each condition, τ1 decreases but τ2 increases at the downstream section because of
higher local quality or less liquid flow. For each section, as the average heat flux increases
(higher air inlet temperature), τ2 decreases more significantly than τ1, indicating that the
reduced oscillation period is mainly resulted from the shortened time period for
annular/dewetting stage.
Figure 7-18 Average oscillation period τp,avg as a function of average heat flux qavg on the
microchannel evaporator

173
Figure 7-19 Time period for each transient stage in one complete oscillation cycle (τ1 and τ2
being respectively liquid refilling stage and annular/dewetting stage)
7.5 SUMMARY AND CONCLUSIONS
In previous chapter, we characterized periodic reverse flow in a microchannel
evaporator operated in a real R134a A/C system by high speed measurement and
simultaneous visualization of the flow pattern at the transparent inlet header. Three major
impacts on the evaporator performance were identified. Then, we proposed a venting
method to improve evaporator and system performance. But previous work did not
investigate the transient flow pattern alternation and bubble dynamics within the
microchannels. This chapter, as an extension of previous chapter, presents transient flow
pattern alternation and bubble dynamics in microchannels by visualizing reverse flow in
one of the microchannels in the evaporator. The conclusions are summarized as follows:
A full oscillation cycle can be divided into two stages: liquid rewetting stage and
transient annular/dewetting stage. Five typical flow patterns are observed in experiments:

174
bubbly flow, elongated bubble, liquid lump flow, annular flow, mist/dryout flow. Along
the microchannel, transient flow patterns vary alternately.
The periodic reverse flow results in the flow pattern alternation. The observed reverse
flow is found to begin with the elongated bubble flow pattern at the location very close to
the channel entry (Figure 7-8) but sustain throughout the film evaporating/dewetting
stage(Fig. 12). This indicates the existing immeasurable high pressure within the elongated
bubble and later at a certain location in the annular flow exceeds the channel inlet and exit
pressure, causing bidirectional flow. The nucleation bubbles first grow linearly before
confined by the channel and then expand exponentially along the longitudinal direction
(Figure 7-8).
The cyclic flow pattern alteration shows a good agreement with the measured pressure
drop fluctuation at various conditions, which confirms the strong dependence of the boiling
fluctuations on the reverse flow behavior (Figure 7-18). As the heat flux increases, the
oscillation period decreases. The flow visualization indicates that the decrease in period is
attributed to the shortened time duration for the annular film evaporating/dewetting stage,
since higher heat flux increase the film evaporating rate (Figure 7-19).
Since the second stage is observed to be about twice longer than the first stage, the film
evaporation is expected to the dominant mechanism of flow boiling heat transfer in the
microchannel tub. Besides, the reverse flow even suppress the bubble nucleation by
expelling the fresh liquid out the channel and leaving the annular film in the entire channel.

175
REFERENCES
Agostini, B., J.R. Thome, M. Fabbri, and B. Michel, High heat flux two-phase cooling in silicon
multi-microchannels. IEEE Trans. Compon. Packag. T, 31(3) (2008): 691–701.
Azzopardi, B.J., A. Purvis, and A. H. Govan, Annular two-phase flow split at an impacting T. Int.
J Mmultiphas. Flow, 13(5) (1987): 605-614.
Azzopardi, B.J., A. Purvis, and A. H. Govan, Flow split of churn flow at a vertical impacting T.
AERE Harwell, No. AERE-R-12440 (1986), England.
Azzopardi, B.J., and P. B. Whalley, The effect of flow patterns on two-phase flow in a T junction.
Int. J Mmultiphas. Flow, 8(5) (1982): 491-507.
Azzopardi, B.J., The split of vertical annular flow at a large diameter T junction. Int. J Mmultiphas.
Flow, 20(6) (1994): 1071-1083.
Baker, G., W. Clark, B.J. Azzopardi, J.A. Controlling the phase separation of gas–liquid flows at
horizontal T-junctions. AIChE J., 53(8) (2007): 1908-1915.
Baker, G., W. Clark, B.J. Azzopardi, J.A. Wilson, Transient effects in gas–liquid phase separation
at a pair of T-junctions. Chem. Eng. Sci., 63(4) (2008): 968-976.
Balasubramanian, P. and S.G. Kandlikar, Experimental study of flow patterns, pressure drop, and
flow instabilities in parallel rectangular minichannels. Heat Transfer Eng., 26(3) (2005): 20-27.
Beaver, A.C., J.M. Yin, C.W. Bullard, and P.S. Hrnjak, An experimental investigation of
transcritical carbon dioxide systems for residential air-conditioning. ACRC Report CR-18 (1999),
Univ. of Illinois, Urbana, USA.
Bergles, A.E., and S.G. Kandlikar, On the nature of critical heat flux in microchannels. J. Heat
Transfer, 127(1) (2005): 101-107.
Bevilaqua, M., G. Giacchetta, K.L. Nielsen, Two-phase liquid gas separation with a new conception
comb separator, 7th Int. Conf. Multiphas. Flow in Industrial Plants, Bologna, 2000.

176
Bin, A.K., Gas entrainment by plunging liquid jets, Chem. Eng. Sci., 48(21) (1993): 3585 – 3630.
Bogojevic, D., K. Sefiane, G. Duursma, and A.J. Walton, Bubble dynamics and flow boiling
instabilities in microchannels, Int. J of Heat Mass Transfer 58 (1-2) (2013): 663-675.
Bowers, C.D, S.S. Wujek, and P.S. Hrnjak, Quantification of refrigerant distribution and
effectiveness in microchannel heat exchangers using infrared thermography. Int. Refrig. Air
Conditioning Conf. (2010), Purdue, No.2117.
Bowers, C.D., and P.S. Hrnjak, Developing adiabatic two-phase flow. ACRC Report TR-267,
(2009): Univ. of Illinois, Urbana, USA.
Bowers, C.D., H. Mai, S. Elbel, and P.S. Hrnjak, 2012. Refrigerant distribution effects on the
performance of microchannel evaporators. Int. Refrig. Air Conditioning Conf. (2010), No.2173.
Bowers, C.D., T.A. Newell, and P.S. Hrnjak, Experimental investigation of two-phase refrigerant
distribution in a microchannel manifold, ACRC Report TR-245 (2006), Univ. of Illinois, Urbana,
USA.
Brutin, D., and L. Tadrist, Pressure drop and heat transfer analysis of flow boiling in a minichannel:
influence of the inlet condition on two-phase flow stability. Int. J Heat Mass Transfer, 47(10-11)
(2004): 2365-2377.
Brutin, D., F. Topin, and L. Tadrist, Experimental study of unsteady convective boiling in heated
minichannels. Int. J Heat Mass Transfer, 46(16) (2003): 2957-2965.
Chang, K.H., and C. Pan, Two-phase flow instability for boiling in a microchannel heat sink. Int. J
Heat Mass Transfer, 50(11-12) (2007): 2078-88.
Cho, H., and K. Cho, Mass flow rate distribution and phase separation of R-22 in multi-
microchannel tubes under adiabatic condition, Microscale Thermalphys. Eng., 8(2) (2003): 527–
533.
Choi, S., S. Shin, and Y. Cho, The effect of area ratio on the flow distribution in liquid cooling
module manifolds for electronic packaging. Int. Commun. Heat Mass, 20(2) (1993): 221-234.

177
D. Jin, Investigation on refrigerant distribution in evaporator manifolds. Phd Thesis, (2006): Univ.
Marland, College Park.
Das, G., P. K. Das, and B. J. Azzopardi, The split of stratified gas–liquid flow at a small diameter
T-junction. Int. J Mmultiphas. Flow, 31(4) (2005): 514-528.
Dshida, M, and P.S. Hrnjak, Evaluation of microchannel heat exchangers for a residential mini-
split type air-conditioning/heat pump system. ACRC Report CR-67 (2008), Univ. of Illinois,
Urbana, USA.
Elbel, S. and P.S. Hrnjak, Experimental and Analytical Validation of New Approaches to Improve
Transcritical CO2 Environmental Control Units. ACRC Report CR-52 (2003), Univ. of Illinois,
Urbana, USA.
Elbel, S. and P.S. Hrnjak, Flash gas bypass for improving the performance of transcritical R744
systems that use microchannel evaporators. Int. J Refrig., 27(7) (2004): 724 – 735.
El-Shaboury, A.M.F., H. M. Soliman, and G. E. Sims, Two-phase flow in a horizontal equal-sided
impacting tee junction. Int. J Mmultiphas. Flow, 33(4) (2007): 411-431.
Evans, G.M., G.J. Jameson, and B.W. Atkinson, Prediction of the bubble size generated by a
plunging liquid jet bubbel column, Chem. Eng. Sci., 47(13-14) (1992): 3265 – 3272.
Fu, X., P. Zhan, C.J. Huang, and R.Z. Wang, Bubble growth, departure and the following flow
pattern evolution during flow boiling in a mini-tube, Int. J Heat Mass Transfer 53 (21-22) (2010):
4819-4831.
Ghani, F., M. Duke, and J.K. Carson, Effect of flow distribution on the photovoltaic performance
of a building integrated photovoltaic/thermal (BIPV/T) collector. Sol. Energy, 86(5) (2011): 1518-
1530.
Graham, D.M., H.R. Kopke, M.J. Wilson, D.A. Yashar, J.C. Chato, and T.A. Newell, An
investigation of void fraction in the annular/stratified flow regions in smooth, horizontal tubes.
ACRC Report TR-144 (1999): Univ. of Illinois, Urbana, USA.

178
Han, Y., and N. Shikazono, Stabilization of flow boiling in a micro tube with air injection. Exp.
Therm. Fluid Sci., 35(7) (2011): 1255-1264.
Hetsroni, G., A. Mosyak, E. Pogrebnyak, and Z. Segal, Explosive boiling of water in parallel micro-
channels. Int. J Multiphas. Flow, 31(4) (2005): 371-392.
Hetsroni, G., A. Mosyak, E. Pogrebnyak, and Z. Segal, Periodic boiling in parallel microchannels
at low vapor quality. Int. J Multiphas Flow, 32(10-11) (2006): 1141-1159.
Huh, C., K. Jeongbae, and M.H. Kim, Flow pattern transition instability during flow boiling in a
single microchannel. Int. J Heat Mass Transfer, 50(5-6) (2007): 1049-1060.
Hwang, S.T., H. M. Soliman, and R. T. Lahey, Phase separation in impacting wyes and tees. Int. J
Mmultiphas. Flow, 15(6) (1989): 965-975.
Hwang, Y., D.H. Jin, and R. Radermacher, Refrigerant distribution in minichannel evaporator
manifolds. HVAC&R Research, 13(4) (2007): 543-555.
Idelchik, I.E., Handbook of hydraulic resistance, 3d ed. (1994), Begell House, New York.
Kandlikar, S. G., W.K. Kuan, D.A. Willistein, and H. Borrelli, Stabilization of flow boiling in
microchannels using pressure drop elements and fabricated nucleation sites, J Heat Transfer, 128(4)
(2006): 389–396.
Kandlikar, S.G., Nucleation characteristics and stability considerations during flow boiling in
microchannels. Exp. Therm. Fluid Sci., 30(5) (2006): 441-447.
Kew, P.A. and K. Cornwell, Correlations for prediction of flow boiling heat transfer in small-
diameter channels. Appl. Therm. Eng., 17(8-10) (1997): 705-715.
Kim, H.H., E.J. Lee, H.W. Byun, Two-phase refrigerant distribution in a parallel flow minichannel
heat exchanger having horizontal headers. Int. J. Heat Mass Transfer, 55(25-26) (2012): 7747-
7759.
Kim, S., E. Choi, and Y. Cho, The effect of header shapes on the flow distribution in a manifold
for electronic packaging applications. Int. Commun. Heat Mass, 22(3) (1995): 329-341.

179
Kosar, A., C. J. Kuo, and Y. Peles, Suppression of boiling flow oscillations in parallel
microchannels with inlet restrictors, J Heat Transfer, 128(3) (2006): 251–260.
Kulkarni, T., C.W. Bullard, and K. Cho, Header design tradeoffs in microchannel evaporators. Appl.
Therm. Eng., 24(5-6) (2004): 759-776.
Kuo, C.J., and Y. Peles, Flow boiling instabilities in microchannels and means for mitigation by
reentrant cavities. J. Heat Transfer, 130(7) (2008): 072402-10.
Kuo, C.J., and Y. Peles, Pressure effects on flow boiling instabilities in parallel microchannels. Int.
J Heat Mass Transfer, 52(1-2) (2009): 271-280.
Lee, H.J., Y. Dong, and S. Yao, Flow instability of evaporative microchannels, Int J Heat Mass
Transfer, 53(9–10) (2010): 1740–1749.
Lee, J., and I. Mudawar, Two-phase flow in high-heat-flux micro-channel heat sink for refrigeration
cooling applications: Part I––pressure drop characteristics. Int. J Heat Mass Transfer, 48(5) (2005):
928-940.
Lee, P. and C. Pan, Boiling heat transfer and two-phase flow of water in a single shallow
microchannel with a uniform or diverging cross section. J Micromech. Microeng., 18(2) (2008):
025005.
Li, H.Y., F.G. Tseng, and C. Pan, Bubble dynamics in microchannels. Part II: two parallel
microchannels, Int. J Heat Mass Transfer 47(25) (2004): 5591-5601.
Liu, G., J.L. Xu, Y.P. Yang and W. Zhang, Active control of flow and heat transfer in silicon
microchannels. J Micromech. Microeng., 20(4) (2010): 045006.
Lu, C., and C. Pan, A highly stable microchannel heat sink for convective boiling, J Micromech
Microeng, 19(5) (2009): 055013.
Lu, C., and C. Pan, Stabilization of flow boiling in microchannel heat sinks with a diverging cross-
section design. J Micromech. Microeng., 18(7) (2008): 075035.
Mak, C.Y., N. K. Omebere-Iyari, and B.J. Azzopardi, The split of vertical two-phase flow at a small
diameter T-junction. Chem. Eng. Sci., 61(19) (2006): 6261-6272.

180
Marchitto, A., F. Devia, M. Fossa, G. Guglielmini, and C. Schenone, Experiments on two-phase
flow distribution inside parallel channels of compact heat exchangers. Int. J. Multiphas. Flow, 34(2)
(2008): 128-144.
Margaris, D. P., T-junction separation modelling in gas–liquid two-phase flow. Chem. Eng.
Process., 46(2) (2007): 150-158.
Marti, S., and O. Shoham, A unified model for stratified-wavy two-phase flow splitting at a reduced
T-junction with an inclined branch arm. Int. J Mmultiphas. Flow, 23(4) (1997): 725-748.
Milosevic, A., and P.S. Hrnjak, Flash gas bypass concept utilizing low pressure refrigerants. ACRC
Report TR-283 (2010). Univ. of Illinois, Urbana, USA.
Moffat, R.J., Describing the uncertainties in experimental results. Exp. Therm. Fluid Sci., 1(1)
(1988): 3-17.
Mohamed, M.A., H. M. Soliman, and G. E. Sims, Conditions for complete phase separation in an
impacting tee junction at various inclinations of the outlet arms. Int. J Mmultiphas. Flow, 47(0)
(2012): 66-72.
Mohamed, M.A., H. M. Soliman, and G. E. Sims, Experimental investigation of two-phase flow
splitting in an equal-sided impacting tee junction with inclined outlets. Exp. Therm. Fluid Sci.,
35(6) (2011): 1193-1201.
Mudde, R.F., J. S. Groen, and H. E. A. Akker, Two-phase flow redistribution phenomena in a large
T-junction. Int. J Mmultiphas. Flow, 19(4) (1993): 563-573.
Park, J.E., J.R. Thome, and B. Michel, Effect of inlet orifice on saturated CHF and flow
visualization in multi-microchannel heat sinks. In Proc. 25thAnnu. IEEE SEMI-THERM Symp.
(2009), San Jose, CA, 1-8.
Peng, F. D. Cantrak, and P.S. Hrnjak, 2002. Refrigerant distribution in the inlet header of plate
evaporators. SAE Congress (2002), Paper No.2002-01-0948.
Peng, F., and P.S. Hrnjak, Adiabatic developing two-phase refrigerant flow in manifolds of heat
exchangers. ACRC Report TR-225 (2004), Univ. of Illinois, Urbana, USA.
181
Qi, Z.G., J.P. Chen, and R. Radermacher, 2009. Investigating performance of new mini-channel
evaporators. Appl. Therm. Eng., 29(17-18): 3561-4567.
Qu, W. and I. Mudawar, Transport phenomena in two-phase micro-channel heat sinks. J. Electron.
Packaging, 126(2) (2004): 213-224.
Revellin, R., V. Dupont, T. Ursenbacher, J.R. Thome, and I. Zun, Characterization of diabatic two-
phase flows in microchannels: Flow parameter results for R-134a in a 0.5 mm channel. Int. J.
Multiphas. Flow, 32(7) (2006): 755-774.
Seeger, W., J. Reimann, and U. Müller, Two-phase flow in a T-junction with a horizontal inlet.
Part I: Phase separation. Int. J Mmultiphas. Flow, 12(4) (1986): 575-585.
Shi, J., X. Qu, Z. Qi, and J. Chen, Investigating performance of microchannel evaporators with
different manifold structures. Int. J. Refrig., 34(1) (2011): 292-302.
Shoham, O., J. P. Brill, and Y. Taitel, Two-phase flow splitting in a tee junction—experiment and
modelling. Chem. Eng. Sci., 42(11) (1987): 2667-2676.
Stacey, T., B. J. Azzopardi, and G. Conte, The split of annular two-phase flow at a small diameter
T-junction. Int. J Mmultiphas. Flow, 26(5) (2000): 845-856.
Tae, S.J., and K. Cho, Two-phase split of refrigerants at a T-junction. Int. J Refrig., 29(7) (2006):
1128-1137.
Thome, J.R., and J.E. Hajal, Two-Phase Flow Pattern Map for Evaporation in Horizontal Tubes:
Latest Version. Heat Tran. Eng., 24(6) (2003): 3-10.
Tuo H.F., A. Bielskus, and P.S. Hrnjak, Effect of flash gas bypass on the performance of R134a
mobile air-conditioning system with microchannel evaporator. Int J Materials & Manufacturing,
4(1) (2011): 231 – 239.
Tuo H.F., A. Bielskus, and P.S. Hrnjak, Experimentally validated model of refrigerant distribution
in a parallel microchannel evaporator. Int. J Materials & Manufacturing, 5(2) (2012): 365 – 374.
Tuo H.F., and P.S. Hrnjak, Flash gas bypass in mobile air conditioning system with R134a. Int. J
Refrig., 35(7) (2012): 1869-1877.

182
Tuo, H.F., and P.S. Hrnjak, Effect of the header pressure drop induced flow maldistribution on the
microchannel evaporator performance. Int. J Refrig. (2013), DOI: 10.1016/j.ijrefrig.2013.06.002.
Tuo, H.F., and P.S. Hrnjak, Experimental study of refrigerant two-phase separation in a compact
vertical T-junction. ASHRAE Trans., 118(1) (2012): 672-680.
Tuo, H.F., and P.S. Hrnjak, New approach to improve performance by venting periodic reverse
vapor flow in microchannel evaporator, Int. J Refrig (2013), DOI: 10.1016/j.ijrefrig.2013.05.020.
Tuo, H.F., and P.S. Hrnjak, Periodical reverse flow and boiling fluctuations in a microchannel
evaporator of an air-conditioning system, Int. J Refrig 36(4) (2013): 1263-1275.
Vist, S, and J. Pettersen, Two-phase flow distribution in compact heat exchanger manifolds. Exp.
Therm. Fluid Sci., 28(2-3) (2004): pp.209-215.
Wang, X.A, and P. Yu, Isothermal flow distribution in header systems. Int. J. Sol. Energy, 7(3)
(1989): 159-169.
Wren, E., B. Azzopardi, Affecting the phase split at a large diameter T-junction by using baffles.
Exp. Therm. Fluid Sci., 28(8) (2004a): 835-841.
Wren, E., B. J. Azzopardi, The Phase Separation Capabilities of Two T-Junctions Placed in Series.
Chem. Eng. Res. Des., 82(3) (2004b): 364-371.
Wu, H.Y., and P. Cheng, Boiling instability in parallel silicon microchannels at different heat flux.
Int. J Heat Mass Transfer, 47(17-18) (2004): 3631-3641.
Wu, H.Y., and P. Cheng, Visualization and measurements of periodic boiling in silicon
microchannels. Int. J Heat Mass Transfer, 46(14) (2003): 2603-2614.
Xu, J., G.H, Liu, W. Zhang, Q. Li and B. Wang, Seed bubbles stabilize flow and heat transfer in
parallel microchannels. Int. J. Multiphas. Flow, 35(8) (2009): 773-790.
Xu, J., J. Zhou, and Y. Gan, Static and dynamic flow instability of a parallel microchannel heat
sink at high heat fluxes. Energ. Convers. Manage., 46(2) (2005): 313-334.
Yin, J.M., C.W. Bullard, and P.S. Hrnjak, Single-phase pressure drop measurements in a
microchannel heat exchanger. Heat Transfer Eng., 23(4) (2002): 3-12.
183
Zhang, L., E.N. Wang, K.E. Goodson, and T.W. Kenny, Phase change phenomena in silicon
microchannels. Int. J. Heat Mass Transfer, 48(8) (2005): 1572-1582.
Zhang, T.J., T. Tong, J. Chang, Y. Peles, R. Prasher, M.K. Jensen, J. Wen, and P. Phelan , Ledinegg
instability in microchannels. Int. J Heat Mass Transfer, 52(25-26) (2009): 5661-5674.
Zou, Y., and P.S. Hrnjak, Performance measurement and visualization on the refrigerant
distribution in the vertical manifold of the microchannel tube heat exchanger. ACRC Report CR-73
(2010), Univ. of Illinois, Urbana, USA.
Zou, Y., and P.S. Hrnjak, Experiment and visualization on R134a upward flow in the vertical
header of microchannel heat exchanger and its effect on distribution. Int. J Heat Mass Transfer,
62(1) (2013a): 124-134.
Zou, Y., and P.S. Hrnjak, Refrigerant distribution in the vertical header of the microchannel heat
exchanger - measurement and visualization of R410A flow. Int. J Refrig., (2013b), DOI:
10.1016/j.ijrefrig.2013.04.021.

184
PUBLICATIONS GENERATED IN THIS STUDY
Archival Journals
1. Tuo, H.F., and P. Hrnjak, 2013. Visualization and measurement of periodic reverse flow and
boiling fluctuations in a microchannel evaporator of an air-conditioning system, Int. J Heat
Mass Transfer, Under Review.
2. Tuo, H.F., and P. Hrnjak, 2013. Effect of venting the periodic reverse vapor flow on the
performance of a microchannel evaporator in air-conditioning systems, Int. J Heat Mass
Transfer, Accepted.
3. Tuo, H.F., and P. Hrnjak, 2013. Vapor - liquid separation in a vertical impact T-junction for
vapor compression systems with flash gas bypass, Int. J Refrig., Under Review.
4. Tuo, H.F., and P. Hrnjak, 2013. Enhancement of vapor-liquid separation in vertical impact T-
junctions for vapor compression systems with flash gas bypass, Int. J Refrig., Under Review.
5. Tuo, H.F., and P. Hrnjak, 2013. Effect of the header pressure drop induced flow
maldistribution on the microchannel evaporator performance, Int. J Refrig.,DOI:
10.1016/j.ijrefrig.2013.06.002.
6. Tuo, H.F., and P. Hrnjak, 2013. New approach to improve performance by venting periodic
reverse vapor flow in microchannel evaporator, Int. J Refrig.,DOI:
10.1016/j.ijrefrig.2013.05.020.
7. Tuo, H.F., and P. Hrnjak, 2013. Periodical reverse flow and boiling fluctuations in a
microchannel evaporator of an air-conditioning system, Int. J Refrig., 36(4): 1263 – 1275.
8. Tuo, H.F., and P. Hrnjak, 2012. Flash gas bypass in mobile air conditioning system with
R134a, Int. J Refrig., 35(7): 1869 – 1877.

185
Conference Proceedings
1. Tuo, H.F., and P. Hrnjak, 2013. Periodic Reverse Flow and Boiling Fluctuations in a
Microchannel Evaporator of an R134a Mobile Air-Conditioning System, SAE Int. J Materials
& Manufacturing, 6(3): 540 – 548.
2. Tuo, H.F., A. Bielskus, and P. Hrnjak, 2012. Experimentally validated model of refrigerant
distribution in a parallel microchannel evaporator, SAE Int. J Materials & Manufacturing,
5(2): 365 – 374.
3. Tuo, H.F., and P. Hrnjak, 2012. Flash Gas Bypass Method for Improving Performance of an
A/C System With a Microchannel Evaporator, Int. Refrig. & Air Conditioning Conf., Purdue,
#2502.
4. Tuo, H.F., A. Bielskus, and P. Hrnjak, 2012. An Experimentally Validated Modeling of
Refrigerant Distribution in a Parallel Microchannel Evaporator, ASHRAE Trans., 118(1): 375.
5. Tuo, H.F., and P. Hrnjak, 2012. Experimental Study of Refrigerant Two Phase Separation in
a Compact Vertical T-junction, ASHRAE Trans., 118(1): 672.
6. Tuo, H.F., A. Bielskus, and P. Hrnjak, 2011. Effect of flash gas bypass on the performance
of R134a mobile air-conditioning system with microchannel evaporator, SAE Int. J Materials
& Manufacturing, 4(1): 231 – 239.