© 2012 joshua brandon sears - ideals
TRANSCRIPT

© 2012 Joshua Brandon Sears

TECHNOLOGICAL OVERLAP AND THE PERFORMANCE IMPLICATIONS FOR THE
ACQUISITION OF SMALL TECHNOLOGY FIRMS
BY
JOSHUA BRANDON SEARS
DISSERTATION
Submitted in partial fulfillment of the requirements
for the degree of Doctor of Philosophy in Business Administration
in the Graduate College of the
University of Illinois at Urbana-Champaign, 2012
Urbana, Illinois
Doctoral Committee:
Associate Professor Glenn Hoetker, Chair
Professor Joseph Mahoney, Director of Research
Associate Professor Joseph Clougherty
Assistant Professor Douglas Miller
ii
ABSTRACT
This dissertation focuses on the performance implications of acquisitions in high technology
industries. I use this setting to understand what factors affect a firm’s ability to successfully
acquire external technology to enhance its innovative productivity, decrease the time elapsed
until the initial post-acquisition innovation utilizing the target firm’s knowledge, and to create
shareholder value. In the three essays, I focus on how the overlap in the technological knowledge
possessed by the target firm and the acquiring firm affect acquisition performance.
The first essay of my dissertation submits that our current understanding of technological
overlap is incomplete. I maintain that technological overlap is actually best viewed as two
distinct constructs: target overlap, the proportion of the target’s knowledge base that the acquirer
already possesses, and acquirer overlap, the proportion of the acquirer’s knowledge base
duplicated by the target. Treating target and acquirer overlap as distinct concepts allows me to
simultaneously incorporate three drivers: the acquirer’s absorptive capacity, knowledge
redundancy, and organizational disruption due to potential conflict between the acquirer’s and
target’s knowledge workers.
The second essay addresses how different rationales for acquiring small technology firms
affect the post-acquisition utilization of the target’s and the acquirer’s technological capabilities.
I identify four general rationales that have previously been identified in the literature. I then
identified two general characteristics of the four rationales that can assist researchers in
empirically differentiated between the rationales: the technological relatedness between the
target and the acquirer and the technological leader/laggard status of the acquirer. Through the
identification of the two variables and how they relate to the four different rationales, I am able
to explain prior conflicting results on whether the technological capabilities of the target and

iii
acquirer are substitutive or complementary. I find that the target’s technological capabilities
increase post-acquisition patenting and create more value when less technological overlap exists.
On the other hand, the acquirer’s technological capabilities increase patenting and create more
value when the acquirer is a technological leader. Further, acquirers benefit most when both little
technological overlap is present and the acquirer is a technological leader.
My third essay investigates the independent and interactive effects that geographic
distance, crossing national borders, and technological overlap have on the time it takes the
acquirer to utilize the pre-acquisition knowledge of the target in post-acquisition innovation.
Further, I hypothesize that whether these factors facilitate or impede the acquirer’s ability to
innovate expeditiously using the target’s pre-acquisition knowledge depends on whether the
acquirer integrates the target’s knowledge with its own or rather the acquirer maintains target
innovative autonomy. I show that the acquirer crossing national borders has a significantly
greater impact on time compared to mere distance. Cross-border acquisitions lengthen the time to
knowledge integrating innovations while cross-border acquisitions shorten the time to non-
integrating innovations. I also show that technological overlap facilitates knowledge integrating
innovation while impeding non-integrating innovations. Further, I show that technological
overlap moderates the effect that cross-border acquisitions have on integrating innovations.

iv
ACKNOWLEDGEMENTS
There are many people that I must acknowledge as the completion of the doctoral program and
this dissertation would not have been possible or nearly as wonderful an experience without
them.
First, I must acknowledge my dissertation chair, Glenn Hoetker. With respect to this
dissertation, I could not have asked for a better fit between chair and student than the relationship
I had with Glenn. He provided the early guidance and support for my ideas that brought an early
paper on technological acquisitions and resource matching into the well-developed first essay of
this dissertation. As I progressed to the later stages of the dissertating process, Glenn gave me the
freedom needed to develop as a scholar. Beyond this dissertation, Glenn has provided me with a
solid foundation in various literatures and has exposed me to numerous econometric analyses
methods. And as I have begun to disseminate my work, Glenn has mentored me in the ‘revise
and resubmit’ process which will be an invaluable skill to possess.
I must also acknowledge my director of research, Joe Mahoney. Joe has made a
tremendous impact on my development from my first interaction with him teaching the
philosophy of science to his detailed reading of every word in my dissertation and job market
presentation. Joe’s remarkable knowledge of the strategy literature was invaluable in clarifying
the focus, theory, limits, and contributions of this dissertation.
Joe Clougherty and Doug Miller also made significant contributions to the development
of this dissertation. I am not sure if my third essay would be what it is today if it was not for an
early conversation I had with Joe when he first arrived in Champaign. Our conversation led to
the idea of investigating the substitutability of technological overlap with geographic distance
and crossing national borders in technological acquisitions. Doug’s experience studying

v
technological acquisitions brought much needed knowledge to the committee. Further, I would
like to thank Doug for broadening my knowledge and perspective of technological acquisitions.
I would also like to acknowledge the numerous other faculty members that have impacted
my development. I would like to thank Janet Bercovitz, Deepak Somaya, and Rajshree Agarwal
for donating their time to the student presentation seminars. I would like to thank Ruth Aguilera
and John Dencker for inviting me to write a chapter with them. Your expertise in corporate
governance and human resource management has broadened my view of acquisitions. I would
like thank Anju Seth for introducing me to the literature on acquisitions and resource exchange
which began my interest in the technological acquisitions literature. I would also like to thank
Rose Luo for providing opportunities for additional financial support.
I must acknowledge my fellow doctoral students. First, I must acknowledge Min-Young
Kim who matriculated with me and was the only other international business student during our
first year. I really appreciate the intellectual discussions we had throughout the program. I would
like to thank Young-Chul Jeong, Chih Liu, Marleen McCormick, Shawn Riley, Kim Wang,
Mahka Moeen, Shweta Gaonkar, Seth Carnahan, Sai Lan, and Amit Jain for their support and
friendship that was vital during the first two years of the program. I would further like to thank
Grace Su, Wenxin Guo, John Mawdsley, Jeff Savage, Jin Uk Kim, Sandra Corridor, Ishva
Minefee, and Bradley Skousen for providing great feedback on my manuscripts and
presentations and just for your overall friendship in the last few years of the program.
Last but definitely not least, I would like to thank my family. I would like to thank Angie,
my brother and his family, and my sister and her family for their love and support over the years.
While my mom only survived long enough to know that I was applying for doctoral programs,
she always supported my decision to continue my education. I cannot thank my father enough for

vi
his support. If it was not for his support, I probably would have never been able to enter the
doctoral program and reach this achievement as I would have had to get a ‘real’ job years ago. In
regards to my loving wife Nok, I cannot express my thanks and appreciation enough. Her
support and patience with me over the last five years is remarkable. I am beyond grateful for the
sacrifices that my wife made in leaving her family, country, and career to spend five years in
near poverty with me.

vii
To my father George and wife Nok

viii
TABLE OF CONTENTS
CHAPTER 1: INTRODUCTION………………………………………………………………1
CHAPTER 2: ESSAY 1 – TECHNOLOGICAL OVERLAP, TECHNOLOGICAL
CAPABILITIES, AND RESOURCE RECOMBINATION IN
TECHNOLOGICAL ACQUISITIONS…………………………………………9
CHAPTER 3: ESSAY 2 – WHEN DO FIRMS BENEFIT FROM ACQUIRING
EXTERNAL TECHNOLOGY?.........................................................................44
CHAPTER 4: ESSAY 3 – TECHNOLOGICAL ACQUISITIONS, DISTANCE,
AND TIME ELAPSED UNTIL THE INITIAL
POST-ACQUISITION INNOVATION…………………………………….…89
CHAPTER 5: CONCLUSION……………………………………………………………….127
REFERENCES ………………………...………………………………………………………137
APPENDIX A: CUMULATIVE ABNORMAL RETURNS………………………….………147
APPENDIX B: ESSAY 1 ANALYSIS USING PATENTING AS THE
DEPENDENT VARIABLE………………………………………………..…150
APPENDIX C: INTERACTION INTERPRETATIONS USING ABNORMAL
RETURNS AS THE DEPENDENT VARIABLE…………………………....157

1
CHAPTER 1
INTRODUCTION
In innovative industries, technological change is both rapid and frequent (Sarkar et al., 2006).
While both incumbents and startups strive to innovate, past research provides evidence that much
of the truly novel innovations originate in startups (Abernathy and Utterback, 1978; Pavitt,
Robson, and Townsend, 1987). With internal R&D focusing on incremental innovations (Knott
and Posen, 2009; Sorensen and Stuart, 2000; Tushman and Anderson, 1986) and corporate
strategies focusing on specialization and the outsourcing non-core activities (Mayer, Somaya,
and Williamson, Forthcoming), firms find themselves in competency traps (Levinthal and
March, 1993). As a result technological acquisitions have become a popular complement to
internal innovation, which allows firms to overcome the time compression diseconomies of
internal innovation that are inherent to innovative industries (Dierickx and Cool, 1989). While
many resources may not be available on strategic factor markets, technology, technological
knowledge, and technological capabilities are available through the acquisition of small,
technology firms (Barney, 1989; Dierickx and Cool, 1989).
While mergers and acquisitions have been the focus of much research throughout the
history of economics, finance, accounting, and management research (see Haleblian et al. (2009)
for a recent review of the literature on acquisitions), the acquisition of small technology firms
has only become a major research phenomenon in the past decade (see Graebner, Eisenhardt, and
Roundy (2010) for a review of the literature on technological acquisitions). Granstrand and
Sjolander (1990) introduced the idea of a special external market for technology through the
trading of small, technology-based firms. The literature has since taken off in line with the
growth of the market for small technology firms (e.g., Ahuja and Katila, 2001; Benson and

2
Ziedonis, 2009; Graebner, 2004, 2009; Karim, 2006, 2009; Karim and Mitchell, 2000; King,
Slotegraaf, and Kesner, 2008; Makri, Hitt, and Lane, 2010; Paruchuri, Nerkar, and Hambrick,
2006; Puranam, Singh, and Chaudhuri, 2009; Puranam, Singh, and Zollo, 2006; Puranam and
Srikanth, 2007; Ranft and Lord, 2002; Schweizer, 2005; Uhlenbruck, Hitt, and Semadeni, 2006).
While the popularity of acquiring external technology through the market for corporate
control has grown over the past two decades, many of these acquisitions continue to fail to meet
the acquiring firm’s expectations (Graebner et al., 2010; King et al., 2008). While expectations
of shareholder value creation remain the same, the acquisition and integration of the target firm’s
technological knowledge and capabilities are the primary motivating factor behind technological
acquisitions in contrast to cost and market synergies of non-technological acquisitions (Brush,
1996; Seth, 1990)1. In this dissertation, I investigate the factors that affect the success of
acquiring small technology firms.
With the literature on the acquisition of small technology firms in a relatively early stage,
much of the research has only focused on a few success factors. The relatedness of the
technological knowledge of the target firm and the acquiring firm, otherwise known as
technological overlap, has received the most attention. Ahuja and Katila (2001) brought
technological overlap to the forefront of the technological acquisitions literature with their
finding of the inverted U-shape relationship between technological overlap and post-acquisition
patenting intensity in the chemical industry. With Cloodt, Hagedoorn, and Van Kranenburg
(2006) finding similar results in a study of aerospace and defense, computers and office
1 While technological knowledge and capabilities are the primary motivation of acquisitions of
small, technology firms, market power has been noted as a secondary motive or a primary
motive for a minority of technological acquisitions. Market power has been recognized as an
acquisition rationale in terms of entering nascent markets (Santos and Eisenhardt, 2009) and
foreign markets (Birkinshaw, Bresman, and Håkanson, 2000; Schweizer, 2005).

3
machinery, pharmaceuticals, and electronics and communications industries, technological
overlap has become a recurring independent and control variable. In this dissertation, I advance
the current state of knowledge regarding the performance implications of technological overlap
in the acquisition of small technology firms. I address three measures of performance:
shareholder value creation, quantity of post-acquisition knowledge creation, and time to post-
acquisition knowledge creation. In advancing our knowledge of technological overlap and
technological acquisitions, I address the following research questions in the three essays:
1. Does target overlap, i.e., how much of the target firm’s technology the acquiring firm
knows (Ahuja and Katila, 2001), and acquirer overlap, i.e., how much of the acquiring
firm’s technology the target firm knows, possess their own unique effects on acquisition
performance? (Essay 1)
2. Do the target firm’s and the acquiring firm’s technological capabilities contribute
differently to post-acquisition knowledge creation and value creation depending on the
rationale for acquiring the small technology firm? (Essay 2)
3. How does distance (technological, geographic, and cultural) between the target firm and
the acquiring firm impact the amount of time it takes the acquiring firm to utilize the
target firm’s technological knowledge in post-acquisition innovation? (Essay 3)
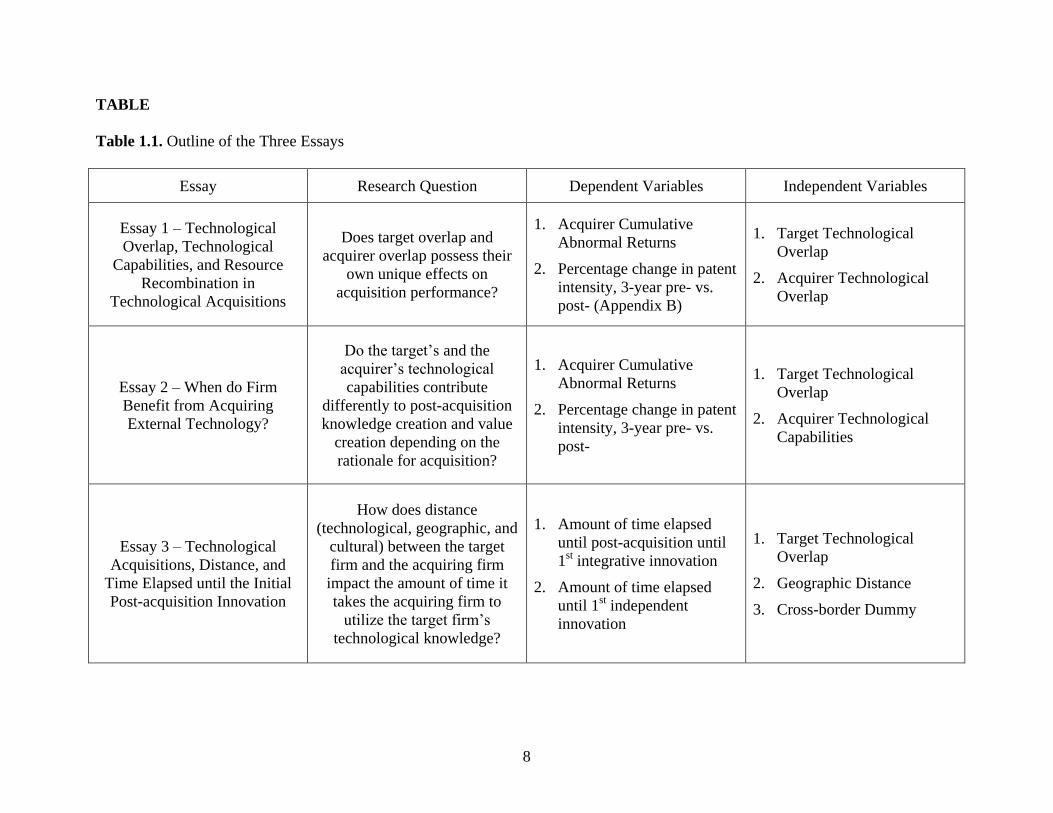
Table 1.1 displays the research questions addressed and the main variables included in the three
essays.
While technological overlap has become a required variable in any study of technology
acquisitions, there has been little advancement made in the conceptual construct. The most
common conceptualization of the construct accounts for how much of the target firm’s
technological knowledge the acquiring firm already knows (e.g., Ahuja and Katila, 2001; Cloodt

4
et al., 2006; Kapoor and Lim, 2007). One alternative conceptualization of the construct was to
simultaneously look at how much of the target the acquirer already knows and how much of the
acquirer the target already knows which constituted a measure of common knowledge (Mowery,
Oxley, and Silverman, 1998). More recently, Makri et al. (2010) differentiated between similar
knowledge and complementary knowledge. In this dissertation, I advance the common
conceptualization and measurement of technological overlap (Ahuja and Katila, 2001) by
differentiating between target technological overlap and acquirer technological overlap. Target
technological overlap equates to how much of the target’s knowledge the acquirer already knows
which is equivalent to the traditional concept and measurement of technological overlap (Ahuja
and Katila, 2001). On the other hand, acquirer technological overlap equates to how much of the
acquirer’s knowledge the target already knows. In Essay 1, I focus on this differentiation and the
effects that these two overlaps have on the relationship between the technological capabilities of
the target and the acquiring firm and value creation for the acquiring firm’s shareholders.
Beyond the need to acquire new technology or technological capabilities, there are
multiple micro-rationales for acquiring a small technology firm (Graebner et al., 2010). The lack
of differentiation in the rationales for acquiring external technology can explain prior conflicting
results on whether the target firm’s technological capabilities complement (e.g., Cassiman and
Veugelers, 2006; Makri et al., 2010; Veugelers, 1997) or substitute (e.g., Blonigen and Taylor,
2000; Hitt, Hoskisson, and Ireland, 1990; King et al., 2008) the technological capabilities of the
acquiring firm. In Essay 2, I identify four general rationales from the literature: capability
upgrading, strategic renewal, capability deepening, and capability diversification. I then identify
two variables that I submit differ among the rationales: whether the acquiring firm is a
technological leader or laggard and the level of target technological overlap. By utilizing these

5
two constructs, I incorporate the differentiation between potential absorptive capacity and
realized absorptive capacity identified by Zahra and George (2002). Target technological overlap
identifies the potential absorptive capacity in the acquisition which relates to the ability of the
acquirer to acquire and assimilate the knowledge of the target firm while the acquirer’s
technological capabilities identifies the realized absorptive capacity which relates to the ability of
the acquirer to transform and exploit the knowledge of the target firm (Zahra and George, 2002).
By identifying these two variables that can assist in differentiating among the four rationales, I
am able to extend our knowledge about when acquiring a small technology firm benefits
innovation and acquirer shareholder value creation.
Knowledge creation has been the primary dependent variable in the limited amount of
research focused on technological acquisitions2. In Essay 2, I connect knowledge creation
(patenting) with acquirer shareholder creation which has been a neglected dependent variable in
the technological acquisitions literature (Graebner et al., 2010). Connecting knowledge creation
with shareholder value creation is a contribution of its own. Barney (1988) submitted that for an
acquirer to create value for its shareholders it must be able to create inimitable, unique
synergistic cash flows. While all acquisitions possess this potential, the acquisitions of small
technology firms possess unique empirical characteristics enabling the testing of the Barney
(1988) proposition. Since by definition technological acquisitions are limited to small targets,
many of the traditional synergies (e.g., cost and market synergies) are minimized enhancing the
ability to measure the knowledge creation synergies. Therefore, in Essay 2, I am able to test the
link between knowledge creation and value creation.
2 Knowledge creation is a general term. Past studies have also used the term innovation or
invention with the construct most often measured using patents (Ahuja and Katila, 2001; Makri
et al., 2010).
6
Since technology acquisitions occur due to the need to overcome the time compression
diseconomies of internal innovation (Dierickx and Cool, 1989), the amount of time it takes the
acquirer to utilize the target’s knowledge significantly affects the success of the acquisition.
Similar to value creation, there has been little work in the technological acquisitions literature
which has addressed time (Puranam et al., 2006). In Essay 3, I contribute to this important aspect
of technological acquisitions.
In consideration of acquiring, assimilating, transforming, and exploiting the knowledge
of the target in a timely manner, we must consider the physical location of the target firm in
relation to the acquiring firm. Outside of the acquisitions literature, studies have shown the
difficulties in distant knowledge exchange (Jaffe, Trajtenberg, and Henderson, 1993; Mowery
and Ziedonis, 2001; Rosenkopf and Almeida, 2003). With many technology acquisitions
maintaining the autonomy of the target firm’s knowledge workers by maintaining its pre-
acquisition R&D facilities while still seeking coordinated innovation with the acquiring firm’s
knowledge workers (Puranam, 2001), studying the effect that geographic distance has on the
ability to utilize the target firm’s knowledge becomes quite relevant to the technological
acquisitions literature. Similarly, whether the two firms domicile in the same nation also affects
the ability to transfer knowledge (Freeman, 1995; Lam, 2003). But, as Puranam et al. (2009)
have shown that technological overlap enhances communication, I investigate how increases in
target technological overlap facilitates the acquisition of more geographically distant target
firms.
Another issue affecting the performance of technology acquisitions is that the acquiring
firms expect the target knowledge workers to perform two distinct roles (Puranam, 2001). First,
the acquiring firm expects the target firm knowledge workers to continue independent innovative

7
activities. Second, the acquiring firm expects the target firm knowledge workers to coordinate
innovative activities with the acquiring firm knowledge workers. In Essay 3, I address how
geographic distance and technological overlap possess different effects on the time it takes the
acquiring firm to utilize the target firm’s knowledge depending on whether the knowledge is
used in independent innovation or integrated innovation. This creates vital knowledge on
whether a potential target firm is an appropriate target based on how the acquiring firm plans to
utilize the target firm’s knowledge workers in conjunction with the geographic and technological
proximity of the target firm to the acquiring firm.
In conclusion, this dissertation advances the concept and measurement of the
technological overlap construct and further investigates how it affects the performance of
acquisitions of small technology firms with regards to shareholder value creation, knowledge
creation, and the time it takes to create new knowledge using the target firm’s knowledge. The
three essays show the importance of accounting for both target overlap and acquirer overlap, the
rationale for acquiring the small technology firm, and the location of the target firm.
8
TABLE
Table 1.1. Outline of the Three Essays
Essay Research Question Dependent Variables Independent Variables
Essay 1 – Technological
Overlap, Technological
Capabilities, and Resource
Recombination in
Technological Acquisitions
Does target overlap and
acquirer overlap possess their
own unique effects on
acquisition performance?
1. Acquirer Cumulative
Abnormal Returns
2. Percentage change in patent
intensity, 3-year pre- vs.
post- (Appendix B)
1. Target Technological
Overlap
2. Acquirer Technological
Overlap
Essay 2 – When do Firm
Benefit from Acquiring
External Technology?
Do the target’s and the
acquirer’s technological
capabilities contribute
differently to post-acquisition
knowledge creation and value
creation depending on the
rationale for acquisition?
1. Acquirer Cumulative
Abnormal Returns
2. Percentage change in patent
intensity, 3-year pre- vs.
post-
1. Target Technological
Overlap
2. Acquirer Technological
Capabilities
Essay 3 – Technological
Acquisitions, Distance, and
Time Elapsed until the Initial
Post-acquisition Innovation
How does distance
(technological, geographic, and
cultural) between the target
firm and the acquiring firm
impact the amount of time it
takes the acquiring firm to
utilize the target firm’s
technological knowledge?
1. Amount of time elapsed
until post-acquisition until
1st integrative innovation
2. Amount of time elapsed
until 1st independent
innovation
1. Target Technological
Overlap
2. Geographic Distance
3. Cross-border Dummy

9
CHAPTER 2
ESSAY 1: TECHNOLOGICAL OVERLAP, TECHNOLOGICAL CAPABILITIES, AND
RESOURCE RECOMBINATION IN TECHNOLOGICAL ACQUISITIONS
INTRODUCTION
Much of the foundational research on technological acquisitions examined the relationship
between acquisition performance and the amount of overlap between the technological
knowledge bases of the target firm and acquiring firm (Ahuja and Katila, 2001; Graebner et al.,
2010; Kapoor and Lim, 2007). More recent research has extended the concept of technological
overlap by investigating the effects that technological similarities and complementarities have on
acquisition performance (Makri et al., 2010). In this study, I further extend the concept of
technological overlap along two different dimensions.
First, I extend technological overlap to encompass both target and acquirer overlap,
which may be asymmetric. Most empirical constructions of technological overlap have measured
what I call “target overlap”, the portion of the target’s knowledge already known by the acquirer
(Ahuja and Katila, 2001; Cloodt et al., 2006; Kapoor and Lim, 2007). However, acquisitions
also vary in the degree to which the acquirer’s existing knowledge is duplicated by the target’s
knowledge, what I call “acquirer overlap”. In addition to identifying target overlap and acquirer
overlap as conceptually and empirically distinct, I develop differential hypotheses regarding their
effect on the creation or destruction of value in an acquisition.
Second, while previous research has tested the direct effect of either technological
overlap (Ahuja and Katila, 2001; Cloodt et al., 2006; Kapoor and Lim, 2007; Makri et al., 2010)
or technological capabilities on acquisition performance (King et al., 2008), I examine these
factors jointly. By doing so, I show how acquirer and target overlap affect the acquirer’s ability

10
to generate value post-acquisition from both its own technological capabilities and those it
acquires from the target firm.
My findings show that acquirer and target overlap affect value creation separately and
jointly. High target overlap decreases the value created by the target’s technological resources
due to knowledge redundancy. High acquirer overlap diminishes the value created by the
acquirer’s technological capabilities by exposing more of the acquirer’s knowledge workers to
disruption and conflict with the target’s knowledge workers. Indeed, for many firms, the negative
effects of high acquirer overlap exceed any value created from acquiring new technological
resources and capabilities. High acquirer overlap can also reduce the value created by the
target’s technological capabilities, but only when target overlap is also high, leading to conflict
rather than potential synergies.
This study makes four primary contributions to the literature on technological
acquisitions. First, it offers a conceptually and empirically more accurate and nuanced measure
of technological overlap. Second, it applies that measure to show that target and acquirer overlap
have distinct, but inter-related, impacts on the value created from the technological capabilities
of the target and acquirer. Third, it broadens the theoretical explanation of value creation in
technological acquisitions by simultaneously incorporating three drivers: the acquirer’s
absorptive capacity, knowledge redundancy, and exposure to organizational disruption due to
conflict between the acquirer’s and target’s knowledge workers3. While individual papers have
3 Cohen and Levinthal (1990: 128) define absorptive capacity as ‘an ability to recognize the
value of new information, assimilate it, and apply it to commercial ends.’ A strict interpretation
of this definition may have excessive knowledge redundancy decreasing the acquiring firm’s
absorptive capacity in reference to the target firm as ‘new information’ decreases. In this
dissertation, I interpret the definition in line with Ahuja and Katila (2001) as they differentiate
between ‘an ability to recognize the value of new information, assimilate it, and apply it to
commercial ends’ (Cohen and Levinthal, 1990: 128) from the actual presence of new

11
discussed each driver in isolation, the separate measures of target overlap and acquirer overlap
allows me to be able to consider them simultaneously and thus isolate the impact of each.
Lastly, it extends the literature on technological acquisitions by studying acquirer shareholder
value creation, which has been a neglected dependent variable in the technological acquisitions
literature (Graebner et al., 2010). Measuring shareholder value creation complements patent
counts, the most common dependent variable (Ahuja and Katila, 2001; Kapoor and Lim, 2007;
Paruchuri et al., 2006), by capturing not only innovative productivity, but also innovative quality
and novelty. Further, shareholder value creation provides particularly useful insights into the
determinants of the performance of technological acquisitions, since it reflects the degree to
which the acquirer accomplished the raison d'être of such acquisitions, creating unique resource
recombinations from the two firms’ capabilities (Barney, 1988).
THEORY AND HYPOTHESES
In innovative industries, technological change is both rapid and frequent (Sarkar et al., 2006).
While both incumbents and startups strive to innovate, past research provides evidence that much
of the truly novel innovations originate in startups (Abernathy and Utterback, 1978; Pavitt et al.,
1987). As a result, technological acquisitions have become a popular complement to internal
innovation, allowing firms to overcome the time compression diseconomies of internal
innovation inherent in the rapid and frequently changing technologies of innovative industries
(Dierickx and Cool, 1989). Accordingly, technological acquisitions have become an important
stream in the broader acquisitions literature (Ahuja and Katila, 2001; Benson and Ziedonis,
2009; Capron and Mitchell, 2009; Graebner, 2004, 2009; Kapoor and Lim, 2007; Makri et al.,
information. According to Ahuja and Katila (2001: 201), increases in knowledge redundancy
between the acquiring firm and target firm does not decrease absorptive capacity but decreases
the benefits of absorptive capacity.

12
2010; Paruchuri et al., 2006; Puranam et al., 2009; Puranam et al., 2006; Puranam and Srikanth,
2007; Ranft and Lord, 2002; Schweizer, 2005).
Barney (1988) argued that acquirers can capture economic value by creating novel
recombinations from their resources and capabilities and those of the target. More recent
research provides evidence that the pursuit of such novel recombinations motivates many
acquisitions (Karim and Mitchell, 2000; Larsson and Finkelstein, 1999).
The resource-based view of firm growth (Barney, 1988; Penrose, 1959) suggests three
factors influence the degree to which a given acquisition will succeed in creating value: the
target’s technological capabilities, the acquirer’s technological capabilities, and the overlap
between the two (technological overlap). The technological capabilities of the target and of the
acquirer each represent fungible resources that can potentially be recombined. However, the
greater the overlap between the target and acquirer, the fewer the opportunities for novel
recombination exist. Consideration of these factors leads to the straightforward prediction that
an increase in the technological capabilities of the target and/or acquirer, or a decrease in the
overlap between their capabilities, will increase the value created by the acquiring firm ceteris
paribus.
Prior studies have been generally consistent with this prediction. However, the
measurement of technological overlap in existing research obscures important contingencies that
determine the potential to create or even lose value post-acquisition. Prior studies have
measured technological overlap as the amount of the target’s knowledge base that the acquirer
already knows (Ahuja and Katila, 2001), the sum of the technological overlap from both firms
(Mowery, Oxley, and Silverman, 1996; Mowery et al., 1998), or subsumed technological overlap
in a more coarse grained measure of resource overlap represented by product lines and product
13
categories (Karim, 2006; Karim and Mitchell, 2000). I propose that target and acquirer overlap
each possess a unique effect on the acquirer’s ability to create value from the target’s and the
acquirer’s technological capabilities. Incorporating each separately allows me to be able to
separate the effects of absorptive capacity, knowledge redundancy and post-acquisition conflict
in a way prior studies have not been able to accomplish.
Figure 2.1 illustrates four idealized combinations of target overlap and acquirer overlap.
The shaded area represents technological overlap, that is, knowledge common to both target and
acquirer. The non-shaded areas represent knowledge unique to the acquirer or target.
I begin by considering the impact of target overlap. When target overlap is low
(Quadrants 1 and 2), a large proportion of the target’s knowledge is new to the acquirer and there
are many opportunities for novel combinations of the target’s knowledge and the acquirer’s
knowledge. However, the acquirer may not be able to realize these novel recombinations. The
acquirer needs a minimum level of absorptive capacity to successfully identify, value, assimilate,
and commercialize the recombinative possibilities of the target’s technological resources (Cohen
and Levinthal, 1990). Since much of the target’s knowledge is unfamiliar to the acquirer, the
acquirer will have a diminished ability to understand the technological resources and capabilities
of the target and will be unable to extract maximal value from the target’s technological
capabilities (cf. Mowery et al., 1998).
When target overlap is high (Quadrants 3 and 4), the acquirer has a greater ability to
understand and absorb the target’s knowledge. However, since much of the target’s knowledge
is redundant to knowledge the acquirer already possessed, there are fewer possibilities to create
novel recombinations of the target’s and acquirer’s technological knowledge. Indeed, the
increase in knowledge redundancy not only decreases the possible number of novel

14
recombinations that can be made using the newly acquired technological knowledge; it may also
decrease the novelty and quality of those recombinations (Makri et al., 2010).
In summary, when target overlap is low, there are many opportunities for novel
recombinations, but the acquirer lacks the absorptive capacity to recognize and execute them.
The technological resources of the target are largely wasted. When target overlap is high, the
acquirer has the necessary absorptive capacity, but knowledge redundancy means there are few
novel recombinations available. The target’s technological capabilities offer few opportunities to
create value.
Thus, the effects of absorptive capacity and knowledge redundancy on the ability of the
acquirer to generate value from the technological resources of the target vary in opposite
directions as target overlap changes. Since theory provides no guidance to which effect will
dominate, I offer competing hypotheses.4
Hypothesis 1a: An increase in target technological overlap will positively affect the
impact the target’s technological capabilities will have on abnormal returns.
Hypothesis 1b: An increase in target technological overlap will negatively affect the
impact the target’s technological capabilities will have on abnormal returns.
I hypothesize that acquirer technological overlap, which this study is the first to examine, affects
the value created by both the acquirer’s and the target’s technological capabilities. Increased
acquirer overlap is associated with increased routine disruption and conflict between the
4 I contrast the hypotheses, which address the moderating effect of target overlap on the
relationship between technological capabilities and value creation, to the non-linear relationship
proposed found in studies of the direct effects of technological overlap on acquisition
performance (Ahuja and Katila, 2001; Cloodt et al., 2006; Kapoor and Lim, 2007). I explore this
point at greater length in the Discussion section.
15
knowledge workers of the target and acquirer, a recognized source of value destruction in the
acquisitions literature (Mirvis, 1985; Paruchuri et al., 2006; Puranam et al., 2006).
When acquirer overlap is low (Quadrants 1 and 3), there is little basis for conflict arising
post-acquisition. Since the overlapping knowledge represents a small portion of the acquirer’s
knowledge base, few of the acquiring firm’s knowledge workers will find themselves in
competition with the target’s knowledge workers. Rather, supplementing the acquirer’s
capabilities with complementary capabilities of the target can generate novel recombinations.
Since both workforces can benefit from being associated with these new recombinations, there is
incentive for cooperation, setting the stage to increase the value of both the acquirer’s and the
target’s technological capabilities.
In contrast, as acquirer overlap increases, represented by a move from the left two
quadrants to the right two quadrants in Figure 2.1, more of the acquirer’s knowledge workers are
redundant to, rather than complementary to, the target’s knowledge workers. As the two groups
have similar expertise, they are likely to find themselves competing for limited resources in an
already established capability of the acquirer rather than supplementing each other in order to
build a new capability.
As the firm seeks to resolve this internal competition, it is often the target’s workforce
that is reconfigured (Capron, Dussauge, and Mitchell, 1998; Capron, Mitchell, and
Swaminathan, 2001; Capron and Pistre, 2002; Karim, 2006). The resulting loss of social status
and centrality on the part of the target’s innovators is one of the most significant drivers of lost
technological productivity post-acquisition (Paruchuri et al., 2006). It often leads to increased
turnover among the target’s workers (Krishnan, Miller, and Judge, 1997), which is highly
damaging to knowledge transfer after the acquisition (Ranft and Lord, 2000).
16
Sometimes, however, it is the acquirer’s employees that bear the brunt of post-acquisition
reorganization. This is particularly likely to be the case when the acquirer intends to upgrade or
substitute their present capabilities with the superior capabilities of the target (Karim, 2006), as
would be suggested by a firm acquiring a target that duplicates many of its existing capabilities,
rather than relying on internal development to expand its capabilities (Capron and Mitchell,
2009; Helfat, 1994; Tripsas and Gavetti, 2000).
Whichever group of employees is ultimately most affected by the acquisition, employees
are likely to resist the acquisition for fear of its potential negative effects on their careers
(Greenwood, Hinings, and Brown, 1994; Walsh, 1988, 1989). Such resistance is well
documented as a source of acquisitions failing to meet their expectations (Blake and Mouton,
1985; Hambrick and Cannella, 1993; Larsson and Finkelstein, 1999). Employee resistance
impedes the ease of communication and post-acquisition interaction between the knowledge
workers, which is critical for the successful creation of novel recombinations using the acquirer’s
and target’s technological capabilities.
In summary, an increase in acquirer overlap means that more of the acquirer’s entrenched
knowledge workers face the risk of their knowledge being made redundant by the acquisition and
thus have an incentive to resist the integration of the target’s knowledge workers. The resulting
conflict increases the likelihood of turnover, and the resulting loss of knowledge, for both the
target and acquirer and makes successful recombination of the acquirer’s and target’s
technological capabilities more difficult. Thus, I expect increases in acquirer overlap to increase
conflict leading to a decrease in the acquirers ability to extract value from the target’s and the
acquirer’s technological capabilities. This leads to the second and third hypotheses:

17
Hypothesis 2: An increase in acquirer technological overlap will negatively affect the
impact the target’s technological capabilities will have on abnormal returns.
Hypothesis 3: An increase in acquirer technological overlap will negatively affect the
impact the acquirer’s technological capabilities will have on abnormal returns.
METHODS
Data and Sample
The sample consists of technological acquisitions obtained from SDC Platinum’s Mergers and
Acquisitions database from 1995 to 2004. 1995 is the first year that an acquisition meeting the
criteria appears in the SDC database. Using 2004 as the end date allowed me to be able to
construct the patent citation-based independent variables. I initially identified acquisitions as
technological acquisitions if both acquirer and target were classified as “high tech” firms in SDC
Platinum’s M&A database.
I limited the sample to firms listed as manufacturing firms by SIC codes 20-39 to allow
for comparisons with previous technological acquisition research (Puranam et al., 2009;
Puranam et al., 2006; Puranam and Srikanth, 2007). I limited the acquisitions to those where the
target has less than 500 employees at the time of the acquisition. This is consistent with the U.S.
Small Business Administration definition of a small business and prior studies on technological
acquisitions (Granstrand and Sjolander, 1990; Puranam et al., 2009; Puranam et al., 2006;
Puranam and Srikanth, 2007). It also creates greater confidence that the motive behind the
acquisition was for technology and not for market power. I limited the sample to acquisitions by
public firms to allow for the construction of the dependent variable from an event study. I
included only acquisitions for which 100% of the target is acquired. This eliminated partial

18
acquisitions and acquisitions of targets for which the acquirer already owned a stake. I also
eliminated divestitures to eliminate any effect on the firms’ returns due to greater negotiation
power by the targets’ parents. Lastly, I limited the sample to deals greater than $50 million, since
small deals may have no effect on the acquirer’s share price. To ensure that all of the acquisitions
were technologically motivated, I searched news articles and newswires using LexisNexis and
eliminated all acquisitions that were clearly not technologically motivated (Ahuja and Katila,
2001; Ranft and Lord, 2000). I also eliminated all acquisitions where the target did not possess
any patents to allow for the independent variable construction. After implementing these filters,
the final sample consists of 97 acquisitions involving 73 different acquirers.
Measures
Dependent variable. I used the event study method to construct the cumulative abnormal returns
(CAR) of the acquirers, that is, acquiring firm’s stock market reaction to the announcement of the
acquisition (McWilliams and Siegel, 1997). This methodology has been extensively used to
evaluate the value created from an acquisition in the management literature (Arikan and Capron,
2010; Capron and Pistre, 2002; Goranova, Dharwadkar, and Brandes, 2010; Kim and
Finkelstein, 2009; McWilliams and Siegel, 1997; Uhlenbruck et al., 2006). I used daily returns
for the acquirers and the equally-weighted market returns, which I obtained both from the CRSP
database. I used equally-weighted market returns since they possess a greater degree of
correlation with security returns than value-weighted returns, which creates more precise
estimators allowing for enhanced detection of abnormal returns (Peterson, 1989). I used an
estimation window of 250 days from 51 days prior to the announcement to 300 days prior and an
event window of 3 days from 1 day prior to the announcement to 1 day after. A 3 day window
allows for differences in the timing of the announcement and the release of the announcement in

19
the press (Peterson, 1989). To ensure that there were no confounding events, I searched
LexisNexis for every acquirer and eliminated any acquisitions for which there was a
confounding event within a 5-day event window. I used Scholes-Williams coefficients to
calculate the CARs, which corrects for the bias created from thin and nonsynchronous security
trading in the market model (Scholes and Williams, 1977).
As advocated by McWilliams and Siegel (1997), I first tested for a significant difference
in the abnormal returns, which confirms that I captured the abnormal returns from the
acquisitions. The cumulative abnormal returns are significantly different from zero at the 0.001
level; therefore, I am confident that I captured the stock market’s responses to the acquisitions.
Of the 97 acquisitions in the sample, 35 have a positive CAR while 62 have a negative CAR.
Independent Variables. The variables acquirer technological overlap and target technological
overlap refer to the degree to which the knowledge bases of the two firms overlap. To calculate
the overlap measures, I begin by determining each firm’s knowledge base. Consistent with
definitions of a firm’s knowledge base as “the distinct elements of knowledge with which the
firm has revealed a relationship” (Kim and Kogut, 1996) or the set of knowledge with which the
firm has “demonstrated familiarity with, or mastery of” (Ahuja and Katila, 2001), I follow prior
work (Ahuja and Katila, 2001; Cloodt et al., 2006; Kapoor and Lim, 2007) and include two
components in each firm’s knowledge base. First, I include the firm’s own patents, since they
represent knowledge the firm created. Second, I include patents cited by the firm’s patents, since
“By creating a patent that builds on these prior patents, the firm provides evidence that the
knowledge contained in those past patents is a part of the firm’s knowledge set.” (Ahuja and
Katila, 2001:202). To ensure that I am capturing knowledge that was still relevant at the time of
the acquisition, I include patents with an application date in the seven years prior to the

20
acquisition announcement, as Jaffe, Trajtenberg and Henderson (1993) found that citations
dramatically decrease 7 years after the application date.
Combining these two components for the target and eliminating any duplication
generates the target’s knowledge base. Doing the same for the acquirer generates the acquirer’s
knowledge base. As illustrated in Figure 2.2, the area inside Kt equals the target’s knowledge
base while the area inside Ka equals the acquirer’s knowledge base. Area R, the intersection of Kt
and Ka, equals the portion of the target and the acquirer’s knowledge bases that is redundant. The
technological overlap variables, which range from 0 to 1, are then calculated as follows:
Acquirer technological overlap = R / Ka (1)
Target technological overlap = R / Kt (2)
where
Ka = the number of unique patents in the acquirer’s knowledge base, which consists of
the acquirer’s patents and patents cited by the acquirer’s patents in the seven years prior
to the acquisition announcement date,
Kt = the number of unique patents in the target’s knowledge base, which consists of the
target’s patents and patents cited by the target’s patents in the seven years prior to the
acquisition announcement date, and
R = redundancy in knowledge bases, the number of patents in the intersection of the
acquirer and target’s knowledge bases.
For technological capabilities, I constructed the variables acquirer technological
capabilities and target technological capabilities. I constructed these variables as citation
weighted patent counts of the seven years prior to the acquisition announcement (Trajtenberg,
1990), measured as follows:

21
Technological capabilities ∑ (∑ ( ) )
(3)
where
Cil = the number of forward citations received by patent l for firm i,
nit = the number of patents issued during year t for firm i.
I dated the patent counts by their application date, which controlled for differences among the
patents in the time it took to be granted (Ahuja and Katila, 2001; Henderson and Cockburn,
1996; Trajtenberg, 1990). I chose seven years to be confident that I captured most of the
innovative technology that represented the current technological capabilities of the acquirer and
the target (Trajtenberg, 1990). As a robustness check, I constructed variables for the firms’
cumulative prior five years and a total accumulation of prior patents. The seven-year
accumulation has a correlation of 0.959 with the five-year accumulation and a 0.909 with the
total accumulation for the target firms. The seven-year accumulation has a correlation of 0.986
with the five-year accumulation and a 0.9603 with the total accumulation for the acquiring firms.
With the high correlations between the five- and seven-year accumulations, I used the seven-year
accumulation to be more conservative in making sure I captured all relevant unique
technological capabilities that a firm possesses.
Control variables. I constructed two variables to control for acquirer specifics. First, I
constructed the variable acquisition experience. Acquisition experience has been found to create
benefits (Bruton, Oviatt, and White, 1994; Fowler and Schmidt, 1989; Zollo and Singh, 2004), to
create a burden (Kusewitt Jr, 1985), and to have no effect (King et al., 2004; Lahey and Conn,
1990). Acquisition experience counts the number of acquisitions the acquirer completed in the
five years prior to the acquisition. I limited the acquisition experience to five years due to
empirical evidence that shows depreciation in the knowledge gained from managerial experience

22
(Sampson, 2005). I also constructed the variable relative market share to control for market
dominance of the acquirer.
I included two variables to control for industry differences. First, I included a dummy
variable, pharma, set to one if the acquirer is in the pharmaceutical/biotech industry. I included
this variable since past research has found unique characteristics of the acquisition process
between pharmaceutical and biotechnology firms (Kalaitzandonakes, 2000; Schimmelpfennig,
King, and Naseem, 2003; Schweizer, 2005). I also constructed a four-firm industry concentration
ratio at the SIC 3-digit classification using Compustat called 4-firm concentration ratio.
I included two variables that control for the size of the two merging firms. To ensure that
the results are not driven merely by the relative size of the firm’s knowledge bases, I constructed
the variable relative size (knowledge bases), which is the number of knowledge elements in the
target’s knowledge base divided by the number of elements in the acquirer’s knowledge base. I
also constructed the variable relative size (employees) as the log of the relative size of the target
to acquirer in terms of their number of employees.
I included two variables to control for transaction specifics. From the SDC Platinum
M&A database, I included the percent of the transaction paid in stock called %stock. I also
included the value of the transaction called transaction value (100 millions) which controls for
the monetary size of the acquisition.
Finally, I included two variables to control for the timing of the acquisition. I construct
two dummy variables called pre-1998 and post-2000. Uhlenbruck et al. (2006) found that
acquirer shareholders valued acquisitions in the internet industry lower after the stock market
correction in the year 2000. I also included a dummy for acquisitions occurring before 1998 to

23
control for differences in shareholder valuation at different stages of the technological
acquisition wave that started in the early 1990s.
Descriptive Statistics
Table 2.1 contains the descriptive statistics and correlations of the variables. The correlation
between acquirer overlap and target overlap is only 0.23, supporting the contention that they are
separate constructs. Although two correlations are above 0.50, relative size (employees) with
acquirer technological capabilities and relative size (employees) with relative market share, the
maximum variance inflation factor (VIF) analyses in models 1-4 is 4.41, well below the critical
value of 10. Model 5 contains multiple interactions with acquirer overlap and consequently a
higher VIF (12.28). I therefore supplement model 5 with alternative models that do not rely on
interaction variables.
Models
I ran three separate analyses of the data to test the hypotheses. I used OLS regression and
estimated robust White-Huber standard errors to correct for potential heteroskedasticity in all
three of the analysis. First, I tested the hypotheses by interacting the technological overlap
variables with the technological capabilities variables. This analysis provides initial support for
the hypotheses, although multicollinearity greatly affected the final model. In the second
analysis, I avoided interaction terms by splitting the sample by target overlap at the median to
test Hypothesis 1a and Hypothesis 1b, and then splitting the sample by acquirer overlap at the
median to test Hypothesis 2 and Hypothesis 3. This allowed for me to be able to test for
differences in the technological capabilities coefficients using a Wald test. In the third analysis, I
split the sample at the medians of both target overlap and acquirer overlap, creating four
subsamples that correspond to the four quadrants of Figure 2.1. I then ran separate regressions
24
for each quadrant and tested for differences in the technological capabilities coefficients using a
Wald test.
RESULTS
Analysis I
In the first analysis of the hypotheses, I tested the moderating effects of target overlap and
acquirer overlap by interacting each with acquirer and target technological capabilities. As
reported in Table 2.2, model 1 includes all of the variables without any of the interaction
variables. Subsequent models add individual interaction terms, with model 5 containing the
complete set of interactions. Consistent with resource-based view expectations, target
technological capabilities create value while counter to expectations, acquirer technological
capabilities destroy value.
I find modest support for Hypothesis 1b over Hypothesis 1a. The interaction between
target technological capabilities and target overlap is negative in both models in which it is
included, but is only significant in model 2.
Hypothesis 2 and Hypothesis 3 focus on the negative effects of acquirer overlap. The
interaction between target technological capabilities and acquirer overlap is negative and
significant in model 3, which supports Hypothesis 2. The interaction between acquirer
technological capabilities and acquirer overlap is negative and significant in model 4, which
supports Hypothesis 3. Unsurprisingly, given the high multicollinearity when all of the
interactions were included, none of the interactions were significant in model 5.
Analysis II
Table 2.3 reports the results of the second analysis, in which I tested the moderating effects of
target overlap and acquirer overlap separately. I did this by testing Hypothesis 1a and Hypothesis

25
1b with the sample split at the target overlap median and then testing Hypothesis 2 and
Hypothesis 3 with the sample split at the acquirer overlap median.5
Models 6 and 7 display the results for the test of Hypothesis 1a and Hypothesis 1b. At
low levels of target overlap (model 6), the coefficient for target technological capabilities
coefficient is positive and significant. At high levels of target overlap (model 7), the coefficient
for target technological capabilities coefficient is negative, but not significantly different from
zero. A Wald test comparing the coefficient for target technological capabilities across the
models confirms that it is significantly greater at low levels of target overlap than at high levels
(p = 0.012). Confirming the results of the first analysis, hypothesis 1b is supported over
hypotheses 1a.
Models 8 and 9 report the results of splitting the sample at the median of acquirer overlap
to test Hypothesis 2 and Hypothesis 3. Unlike in analysis I, hypothesis 2 is not supported. The
coefficient for target technological capabilities is not significant for either low (model 8; β =
0.013, p = 0.227) or high (model 9; β = 0.006, p = 0.571) acquirer overlap. Additionally, the
coefficients do not differ significantly from each other (p = 0.428). Analysis III, reported below,
provided additional insights into this result.
Consistent with expectations for Hypothesis 3, the coefficient for the acquirer’s
technological capabilities is significantly (p = 0.004) less when acquirer overlap is high (model
9; β = -0.031, p = 0.003) than when it is low (model 8; β = -.004, p = 0.552). An increase in
acquirer overlap negatively affects the impact the acquirer’s technological capabilities have on
abnormal returns.
5 As detailed below, the results are robust to splitting the sample at other levels.

26
Analysis III
For the final test of the hypotheses, I split the sample into the four quadrants of Figure 2.1. I did
this by splitting the sample at the medians of the acquirer and target overlaps. The regression
results can be found in Table 2.4 while the Wald test results can be found in Table 2.5.
Testing Hypothesis 1a and 1b requires two comparisons of the coefficient for target
technological capabilities: quadrant 1 versus quadrant 3 and quadrant 2 versus quadrant 4. A
Wald test shows that the coefficient is significantly (p = 0.080) greater in quadrant 1 (low target
overlap/low acquirer overlap; β = 0.025, p = 0.044) than in quadrant 3 (high target overlap/low
acquirer overlap; β = 0.008, p = 0.443). Similarly, the coefficient is significantly (p = 0.008)
higher in quadrant 2 (low target overlap/high acquirer overlap; β = 0.025, p = 0.150) than in
quadrant 4 (high target overlap/high acquirer overlap; β = -0.009, p = 0.351). Thus, regardless of
the level of acquirer overlap, the target’s technological capabilities coefficient indicates that
more value creation occurs when the target overlap is low than when it is high. Consistent with
both prior analyses, this result supports Hypothesis 1b over Hypothesis 1a.
Testing hypothesis 2, which proposes that an increase in acquirer technological overlap
negatively affects the value created by the target’s technological capabilities, requires two
comparisons of the coefficient for target technological capabilities: quadrant 1 versus quadrant 2
and quadrant 3 versus quadrant 4. A Wald test shows that the coefficient is not significantly (p =
0.991) greater in quadrant 1 (low target overlap/low acquirer overlap; β = 0.025, p = 0.044) than
in quadrant 2 (low target overlap/high acquirer overlap; β = 0.025, p = 0.150). On the other hand,
the coefficient is significantly (p = 0.073) higher in quadrant 3 (high target overlap/low acquirer
overlap; β = 0.008, p = 0.443) than in quadrant 4 (high target overlap/high acquirer overlap; β =
-0.009, p = 0.351).

27
This more fine-grained analysis helps explain the lack of support for Hypotheses 2 in
Analysis II. The impact of acquirer overlap on the value created by the target’s technological
capabilities is contingent on the level of target overlap. When target overlap is high, there is a
negative impact as predicted. When target overlap is low, there is no impact. I discuss this
interesting finding in the discussion section.
Testing Hypothesis 3, which proposes that an increase in acquirer technological overlap
negatively affects the value created by the acquirer’s technological capabilities, also involves
comparing quadrant 1 versus quadrant 2 and quadrant 3 versus quadrant 4. A Wald test shows
that the coefficient is significantly (p = 0.078) greater in quadrant 1 (low target overlap/low
acquirer overlap; β = 0.007, p = 0.757) than in quadrant 2 (low target overlap/high acquirer
overlap; β = -0.028, p = 0.183). Similarly, the coefficient is significantly (p = 0.000) greater in
quadrant 3 (high target overlap/low acquirer overlap; β = 0.011, p = 0.426) than in quadrant 4
(high target overlap/high acquirer overlap; β = -0.034, p = 0.012). I thus find strong support for
Hypothesis 3. Acquirer technological capabilities have a more negative impact on value at higher
levels of acquirer overlap. This effect exists at both low and high levels of target overlap.
Robustness Tests
I ran robustness tests for analysis II by splitting the sample at different levels of target and
acquirer overlap to alleviate any concerns about the results being driven by the choice of using
the median to split the sample. For the robustness regressions, I split the sample at the 33rd
percentile and the 66th
percentile for target overlap to test Hypotheses 1a and 1b and for acquirer
overlap to test Hypotheses 2 and 3.
Panel A in Table 2.6 displays the robustness test results for Hypothesis 1b. I find support
for Hypothesis 1b when the sample is split at either the 33rd
percentile or the 66th
percentile of

28
target overlap. Panel B in Table 2.6 displays the robustness test results for Hypotheses 2 and 3.
The results are consistent with analysis II in that acquirer overlap does not significantly affect the
impact that the target technological capabilities have on value creation at either split. This is not
surprising since I found in analysis III that acquirer overlap only negatively affects the acquirer’s
ability to extract value from the target’s technological capabilities when there is also high target
overlap. The results for Hypothesis 3 remain substantively robust. Under all three splits, the
value created from acquirer technological capabilities is higher when acquirer overlap is low.
The difference is significant (p = 0.0181) when the sample is split at the 33rd
percentile of
acquirer overlap and marginally insignificant when the sample is split at the 66th
percentile (p =
0.109).
I also ran the analyses with abnormal returns using a 5-day event window, which
provides the advantage of capturing any value change outside the 3-day event window due to
information leakage at the cost of more opportunity for confounding events. The results using the
5-day window are substantively the same as the 3-day window presented in the analyses above.
The hypotheses and results are summarized in Table 2.7.
DISCUSSION AND CONCLUSION
This study advances our understanding of the performance of technological acquisitions by
incorporating the interaction of the level of technological overlap and the amount of
technological capabilities possessed by the target and acquirer. In doing so, it makes four
primary contributions.
First, it theoretically and empirically advances the concept of technological overlap by
showing that target overlap and acquirer overlap are separate constructs and need not be
symmetric. Doing so complements other work (Makri et al., 2010) that takes a more multi-

29
dimensional view of technological overlap. I submit that the idea of asymmetric knowledge
overlap across partners is also applicable to alliances, extending insights generated by examining
overlap as a symmetric attribute of an alliance (e.g., Mowery et al., 1996, 1998).
Distinguishing target and acquirer overlap enables the paper’s second contribution, by
simultaneously considering the impact of overlap (both target and acquirer) and technological
capabilities (again, both target and acquirer) on acquisition performance. This study is the first
paper of which I am aware to do so. One of the paper’s key insights, that target overlap and
acquirer overlap have distinct effects on the acquirer’s ability to create value from combining the
target’s and the acquirer’s technological capabilities, comes directly from this advance.
The study’s third contribution is to broaden the theoretical explanation of value creation
in technological acquisitions by simultaneously incorporating three drivers: the acquirer’s
absorptive capacity, knowledge redundancy, and exposure to organizational disruption due to
conflict between the acquirer’s and target’s knowledge workers. While individual papers have
discussed each driver in isolation, the separate measures of target overlap and acquirer overlap
allows me to be able to consider them simultaneously and thus isolate the impact of each. Three
useful insights flow from this contribution.
The first insight comes from the finding that, when target overlap is high, knowledge
redundancy decreases an acquirer’s ability to derive value from a target’s technological
capabilities, but when target overlap is low, there does not seem to be negative impact from a
lack of absorptive capacity. This finding suggests that acquiring managers may be better able to
recognize what they do not know than recognize what they know too well. Complementing
Coff’s (2002) finding that potential acquirers are more likely to withdraw an acquisition when
there is little knowledge overlap between the target and the acquirer, I expect management to

30
only follow through on acquisitions with foreseen synergies6. However, in pursuit of those
potential synergies, they may get tunnel vision and not recognize excessive knowledge
redundancy and its potential value destroying effects.
The second insight regards the precedents and consequences of conflict between
knowledge workers of the acquirer and target. High acquirer overlap has a negative effect on the
acquirer’s ability to extract value from the target’s technological capabilities only when there is
simultaneously high target overlap. As target overlap decreases, the target’s knowledge workers
bring greater amounts of new knowledge with them into the acquisition. Although much of the
acquirer’s knowledge is redundant, if it can be coupled with non-redundant knowledge from the
target, the target’s knowledge workers have much to offer the acquirer allowing for synergy
realization, which will provide an interactive productive working environment instead of one of
conflict and competition. With increases in target overlap leading to less new knowledge brought
in from the target, there is not as much room for complementarities and synergy realization.
Without potential for complementarities between the two firms’ knowledge workers, the
redundancies visibly emerge in the workplace leading to a more competitive, hostile
environment.
The third insight contrasts the effects of knowledge redundancy and conflict. Knowledge
redundancy from high target overlap reduces the value created from the target’s technological
capabilities, but conflict caused by high acquirer overlap can actually lead to a loss of value from
the acquirer’s own capabilities. Indeed, calculating the combined effect of target and acquirer
6 While I focused on absorptive capacity in building the hypotheses, information asymmetries is
another line of theorizing for the effects of low target overlap. Following Coff (2002), low target
overlap leads to greater information asymmetries. In the context of value creation, the acquirer
may be more likely to overvalue the target’s resource and capabilities leading to a negative
impact on acquirer value creation as target overlap decreases. The results do not suggest that low
target overlap leads to overpayment.

31
capabilities according to the results reported in Table 2.5 shows that, for an acquisition with
mean levels of target and acquirer capabilities, the value lost from the acquirer’s technological
capabilities exceeds the gains from the target’s technological capabilities when acquirer overlap
is high (quadrants 2 and 4). For example, while the target’s technological capabilities coefficient
is positive in quadrant 2 (low target overlap/high acquirer overlap), the negative impact that the
acquirer’s capabilities possess destroys all value created by the target’s capabilities leading to
value destruction on average. Consistent with Capron and Mitchell (2009), firms seem to be
more efficient at acquiring technologies that are more dissimilar to their own as conflict arises if
the firms possess similar technological capabilities. Managers considering acquiring a company
with knowledge overlapping much of their own must recognize that such acquisitions are not
only unlikely to generate value, but they may also reduce the value of the acquirer’s pre-existing
knowledge.
The paper’s fourth contribution is to extend the literature on technological acquisitions by
studying shareholder value creation as an outcome. Although relatively neglected as a dependent
variable (Graebner et al., 2010), shareholder value creation provides theoretical and managerial
insights. It is a direct measure of the degree to which the managers of the acquiring firm have
accomplished their ultimate goal of generating shareholder value by acquiring small
technological firms. It complements studies of post-acquisition invention productivity, usually
measured as patent counts (Ahuja and Katila, 2001; Cloodt et al., 2006; Kapoor and Lim, 2007;
Makri et al., 2010; Paruchuri et al., 2006; Puranam and Srikanth, 2007). In particular, it suggests
that the low innovation quantity observed in acquisitions with low target overlap may conceal an
offsetting increase in the novelty and quality of innovations generated in such acquisitions. In
this regard, it helps confirm Makri et al.’s (2010) finding that less quantity can be accompanied

32
with greater quality when lower similarity and greater complementarity exists between the
acquirer and target.
While the impact the capabilities of the target and acquirer have on shareholder value
creation decreases as overlap increases, the differences in the intercepts of the subsamples
suggest that overall value creation may be greater with greater levels of overlap. In Table 2.3 the
intercept is significantly positive in both high target overlap and high acquirer overlap
subsamples while both low overlap subsamples are significantly negative. In Table 2.4 the
intercept is significantly positive for the subsample with both high target and high acquirer
overlap while the other three subsample intercepts are not significantly different from zero.
Therefore, there are probably other factors significantly impacting shareholder value creation in
high overlap acquisitions that are beyond the scope of this chapter. This finding does create an
interesting line of future enquiry as to why these high overlap acquisitions are creating greater
overall value while the target and acquirer technological capabilities are negatively impacting
shareholder value.
I would like to highlight two areas I believe are particularly promising directions for
future research. First, differentiating acquisitions by their levels of target and acquirer overlap
ties into the ongoing discussion of the motives for acquisition. Both Karim and Mitchell (2000)
and Larsson and Finkelstein (1999) similarly identify two distinct motives for acquisitions.
Karim and Mitchell (2000) refer to “resource extension” versus “resource deepening” while
Larsson and Finkelstein (1999) refer to “economies of fitness” versus “economies of sameness”.
Within this essay’s scheme, as represented by Figure 2.1, quadrant 1 (low target overlap/low
acquirer overlap) represents the “resource extension” or “economies of fitness” motive. The
acquiring firms are purchasing targets that possess many unique technological capabilities which

33
can extend (Karim and Mitchell, 2000) or complement (Larsson and Finkelstein, 1999) their own
capabilities. Quadrant 4 (high target overlap/high acquirer overlap) represents the “resource
deepening” or “economies of sameness” motive. The acquiring firm purchases capabilities that it
is not only quite familiar with but also make up a greater portion of its own capabilities. When I
compare the value the acquirer is able to extract from the target’s and its own technological
capabilities, I find that the target’s technological capabilities create significantly more value in
quadrant 1 and the acquirer’s technological capabilities destroy significantly more value in
quadrant 4. This finding is consistent with Larsson and Finkelstein’s (1999) results in that an
increase in the complementarity between the acquirer and target increased the probability of
synergy realization. An interesting extension of Karim and Mitchell (2000) and Larsson and
Finkelstein (1999) would be to identify the motives for the acquisitions taking place in quadrants
2 and 3 of Figure 2.1.
The second area for future research would help address the primary limitation of the
study. While I was able to build upon a large theoretical literature and rich empirical findings in
developing the hypotheses, I did not directly observe the underlying mechanisms. Having
established the relationship between overlap, capabilities and acquisition performance, I hope
future work will examine its micro foundations. In particular, it would be helpful to see how the
levels of acquirer and target overlap influence the probability of employee departing from the
target and, especially, the acquiring firm (cf. Karim, 2006). The same observation could be
undertaken for asset divestitures at different levels of acquirer and target overlap.
In conclusion, I have shown that technological overlap in an acquisition is better thought
of as two technological overlaps, one describing the knowledge set of the target firm and the
other the knowledge set of the acquiring firm. The two overlaps have distinct, but inter-related,

34
effects on the degree to which the acquirer creates—or destroys—value from its own
technological capabilities and those of the target. The findings suggest that the two overlaps
drive value creation or destruction through distinct causal mechanisms: the creation of absorptive
capacity, knowledge redundancy and the generation of post-acquisition disruption and conflict.
These mechanisms have different theoretical implications and require different managerial
responses, which this study has taken the initial steps to explore. I hope others will use this study
as a foundation to expand on that exploration.

35
TABLES AND FIGURES
Table 2.1. Descriptive statistics and correlationsa
mean s.d. min max 1 2 3 4 5 6 7 8 9 10 11 12 13 14
1. CAR -0.03 0.09 -0.34 0.23
2. Pre-1998 0.06 0.24 0 1 0.04
3. Post-2000 0.43 0.50 0 1.00 -0.11 -0.22
4. Transaction value (100 million) 5.11 8.06 0.50 56.58 -0.18 -0.07 -0.06
5. Pharma 0.37 0.49 0 1 -0.08 -0.20 0.15 0.04
6. % stock 0.66 0.45 0 1 -0.20 0.01 -0.34 0.20 0.00
7. Relative size (employees) -2.95 2.00 -7.32 0.95 -0.30 -0.18 0.07 0.09 -0.03 0.25
8. Relative size (knowledge bases) 0.58 2.40 0.00 22.90 0.24 -0.05 0.10 -0.06 -0.03 0.02 0.30
9. 4-firm concentration ratio 0.41 0.10 0.31 0.95 0.17 0.12 -0.14 -0.02 -0.43 -0.06 -0.02 -0.08
10. Acquisition experience 5.70 8.87 0 53 0.14 -0.04 -0.14 0.25 -0.19 0.07 -0.42 -0.10 0.23
11. Relative market share 0.06 0.09 0.0001 0.41 0.19 0.13 0.02 -0.12 0.02 -0.20 -0.73 -0.12 -0.09 0.18
12. Target technological overlap 0.17 0.24 0 1 0.02 -0.09 0.04 0.30 -0.01 -0.13 -0.06 -0.11 -0.01 0.17 0.05
13. Acquirer technological overlap 0.04 0.08 0 0.4 -0.05 -0.11 0.03 0.06 0.22 0.17 0.33 0.07 -0.15 -0.21 -0.25 0.26
14. Target technological capabilities 4.92 1.65 0.69 8.94 0.09 0.10 -0.13 0.11 0.04 0.03 -0.10 0.10 -0.23 0.06 0.24 0.19 0.15
15. Acquirer technological capabilities 7.15 2.25 0 10.43 0.00 0.14 -0.14 0.06 -0.19 -0.22 -0.59 -0.40 -0.04 0.37 0.47 0.23 -0.31 0.33
a Correlations equal to or greater than .20 are significant at the .05 level.
Variables

36
Table 2.2. OLS regression analysis of complete sample
Dependent variable = CAR (3-day window)
Target technological overlap 0.020 0.204 * 0.017 0.037 0.141
(0.57) (1.69) (0.50) (1.04) (1.08)
Acquirer technological overlap 0.051 0.042 0.941 *** 0.665 ** 0.715 **
(0.32) (0.28) (3.71) (2.59) (2.00)
Target technological capabilities 0.008 0.012 ** 0.011 ** 0.011 ** 0.014 **
(1.47) (2.14) (2.15) (2.11) (2.28)
Acquirer technological capabilities -0.011 ** -0.011 ** -0.008 -0.008 -0.008
(2.02) (2.09) (1.61) (1.45) (1.57)
Target technological capabilities x -0.037 * -0.023
target technological overlap (1.67) (0.96)
Target technological capabilities x -0.182 *** -0.064
acquirer technological overlap (3.03) (0.32)
Acquirer technological capabilities x -0.138 ** -0.081
acquirer technological overlap (2.53) (0.53)
Transaction value (100 million) -0.001 -0.001 -0.001 -0.002 -0.001
(0.95) (0.89) (0.99) (1.02) (0.96)
Pharma -0.015 -0.013 -0.013 -0.012 -0.011
(0.81) (0.71) (0.69) (0.65) (0.60)
% stock -0.035 ** -0.032 * -0.031 * -0.030 * -0.029 *
(2.17) (1.96) (1.98) (1.91) (1.81)
Relative size (employees) -0.025 *** -0.027 *** -0.021 *** -0.021 *** -0.022 ***
(3.74) (4.04) (3.25) (3.27) (3.34)
Relative size (knowledge bases) 0.011 *** 0.010 *** 0.010 *** 0.011 *** 0.010 ***
(5.84) (5.64) (5.70) (5.85) (5.55)
4-firm concentration ratio 0.124 0.128 0.145 0.145 0.146
(1.24) (1.27) (1.46) (1.46) (1.45)
Acquisition experience 0.000 0.000 0.000 0.000 0.000
(0.11) (0.24) (0.12) (0.08) (0.07)
Relative market share -0.109 -0.136 -0.090 -0.100 -0.113
(1.13) (1.40) (0.94) (1.06) (1.16)
Pre-1998 -0.031 -0.031 -0.030 -0.030 -0.030
(1.11) (1.11) (1.00) (1.03) (1.02)
Post-2000 -0.031 * -0.031 * -0.023 -0.026 -0.025
(1.82) (1.82) (1.42) (1.59) (1.57)
Intercept -0.071 -0.097 -0.107 * -0.107 * -0.121 *
(1.09) (1.36) (1.72) (1.68) (1.75)
Observations 97 97 97 97 97
F-statistic 20.01 *** 14.47 *** 25.02 *** 24.26 *** 18.74 ***
R-squared 0.33 0.35 0.36 0.36 0.37
Robust t statistics in parentheses
* significant at 10%; ** significant at 5%; *** significant at 1%
(5)(1) (2) (3) (4)
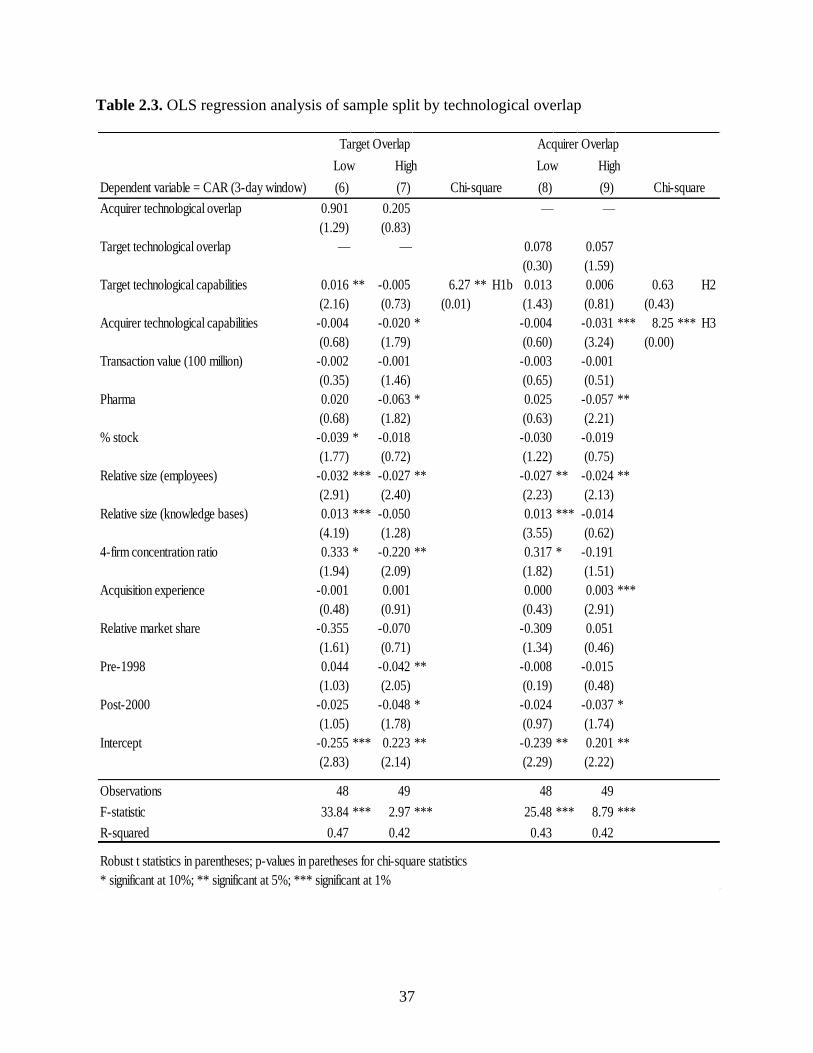
37
Table 2.3. OLS regression analysis of sample split by technological overlap
Dependent variable = CAR (3-day window) (6) (7) (8) (9)
Acquirer technological overlap 0.901 0.205
(1.29) (0.83)
Target technological overlap 0.078 0.057
(0.30) (1.59)
Target technological capabilities 0.016 ** -0.005 6.27 ** H1b 0.013 0.006 0.63 H2
(2.16) (0.73) (0.01) (1.43) (0.81) (0.43)
Acquirer technological capabilities -0.004 -0.020 * -0.004 -0.031 *** 8.25 *** H3
(0.68) (1.79) (0.60) (3.24) (0.00)
Transaction value (100 million) -0.002 -0.001 -0.003 -0.001
(0.35) (1.46) (0.65) (0.51)
Pharma 0.020 -0.063 * 0.025 -0.057 **
(0.68) (1.82) (0.63) (2.21)
% stock -0.039 * -0.018 -0.030 -0.019
(1.77) (0.72) (1.22) (0.75)
Relative size (employees) -0.032 *** -0.027 ** -0.027 ** -0.024 **
(2.91) (2.40) (2.23) (2.13)
Relative size (knowledge bases) 0.013 *** -0.050 0.013 *** -0.014
(4.19) (1.28) (3.55) (0.62)
4-firm concentration ratio 0.333 * -0.220 ** 0.317 * -0.191
(1.94) (2.09) (1.82) (1.51)
Acquisition experience -0.001 0.001 0.000 0.003 ***
(0.48) (0.91) (0.43) (2.91)
Relative market share -0.355 -0.070 -0.309 0.051
(1.61) (0.71) (1.34) (0.46)
Pre-1998 0.044 -0.042 ** -0.008 -0.015
(1.03) (2.05) (0.19) (0.48)
Post-2000 -0.025 -0.048 * -0.024 -0.037 *
(1.05) (1.78) (0.97) (1.74)
Intercept -0.255 *** 0.223 ** -0.239 ** 0.201 **
(2.83) (2.14) (2.29) (2.22)
Observations 48 49 48 49
F-statistic 33.84 *** 2.97 *** 25.48 *** 8.79 ***
R-squared 0.47 0.42 0.43 0.42
Robust t statistics in parentheses; p-values in paretheses for chi-square statistics
* significant at 10%; ** significant at 5%; *** significant at 1%
Chi-square
— —
— —
Chi-square
Target Overlap
Low High
Acquirer Overlap
Low High

38
Table 2.4. OLS regression analysis with sample split according to Figure 2.1
Quadrant from Figure 1
Target overlap
Acquirer overlap
Dependent variable = CAR (3-day window)
Target technological capabilities 0.025 ** 0.025 0.008 -0.009
(2.25) (1.55) (0.79) (0.97)
Acquirer technological capabilities 0.007 -0.028 0.012 -0.034 **
(0.32) (1.42) (0.83) (2.94)
Transaction value (100 million) -0.003 0.001 -0.002 *** -0.003
(0.35) (0.60) (5.49) (1.15)
Pharma 0.070 -0.012 -0.006 -0.087
(0.88) (0.31) (0.28) (1.49)
% stock 0.043 0.022 -0.030 * -0.029
(0.30) (0.41) (2.02) (0.50)
Relative size (employees) -0.053 -0.012 -0.006 -0.029 *
(1.45) (0.79) (0.34) (1.92)
Relative size (knowledge bases) 0.020 -0.028 0.032 -0.017
(1.54) (0.71) (0.19) (0.21)
4-firm concentration ratio 0.574 -0.044 -0.148 -0.487 *
(1.43) (0.25) (0.69) (2.14)
Acquisition experience 0.003 -0.001 0.000 0.004
(0.48) (0.25) (0.25) (1.43)
Relative market share -0.713 0.346 -0.370 -0.121
(0.83) (1.49) (1.06) (0.52)
Pre-1998 0.054 -0.040 -0.031
(0.99) (1.21) (1.18)
Post-2000 -0.018 -0.030 -0.035 -0.023
(0.29) (0.78) (1.42) (0.78)
Intercept -0.610 -0.009 -0.044 0.463 **
(1.25) (0.05) (0.50) (2.26)
Observations 25 24 24 24
F-statistic 10.62 *** 2.10 5.75 *** 6.96 ***
R-squared 0.58 0.40 0.55 0.61
Robust t statistics in parentheses
* significant at 10%; ** significant at 5%; *** significant at 1%
Q1 Q2 Q3 Q4
Low
—
(10) (11) (12) (13)
Low
Low High High
HighLowHigh

39
Table 2.5. Test of coefficient differences with overlap levels split into four quadrants
H2 & H3
Target
Technological
Capabilities =
0.025**
Acquirer
Technological
Capabilities =
0.007
Target
Technological
Capabilities =
0.025
Acquirer
Technological
Capabilities =
-0.028
Target
Technological
Capabilities =
-0.009
Acquirer
Technological
Capabilities =
-0.034**
Target
Technological
Capabilities =
0.008
Acquirer
Technological
Capabilities =
0.012
Low Acquirer
Technological Overlap
High Acquirer
Technological Overlap
High Target
Technological
Overlap
Low Target
Technological
Overlap
chi-square = 3.06
p-value = 0.0801
chi-square = 7.04
p-value = 0.0080
H1b
H3
chi-square = 3.10
p-value = 0.0783
H3
chi-square = 13.23
p-value = 0.0003
H2
chi-square = 0.00
p-value = 0.9913
H2
chi-square = 3.22
p-value = 0.0729
Q1 Q2
Q3 Q4
* p < .10
** p < .05
*** p < .01
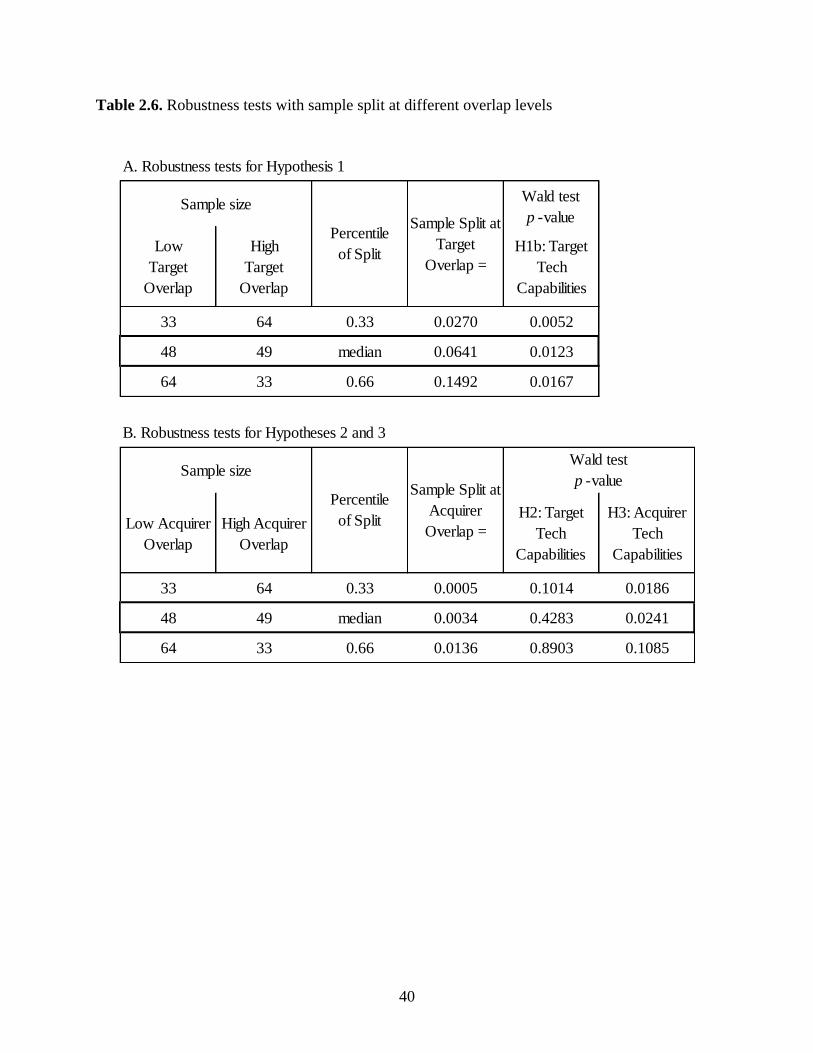
40
Table 2.6. Robustness tests with sample split at different overlap levels
A. Robustness tests for Hypothesis 1
Wald test
p -value
Low
Target
Overlap
High
Target
Overlap
H1b: Target
Tech
Capabilities
33 64 0.33 0.0270 0.0052
48 49 median 0.0641 0.0123
64 33 0.66 0.1492 0.0167
B. Robustness tests for Hypotheses 2 and 3
Low Acquirer
Overlap
High Acquirer
Overlap
H2: Target
Tech
Capabilities
H3: Acquirer
Tech
Capabilities
33 64 0.33 0.0005 0.1014 0.0186
48 49 median 0.0034 0.4283 0.0241
64 33 0.66 0.0136 0.8903 0.1085
Sample size
Percentile
of Split
Sample size
Percentile
of Split
Wald test
p -value
Sample Split at
Target
Overlap =
Sample Split at
Acquirer
Overlap =

41
Table 2.7. Summary of hypotheses and results.
Hypotheses Analysis I Analysis II Analysis III
Hypothesis 1a: An increase in target technological overlap will
positively affect the impact the target’s technological capabilities
will have on abnormal returns.
Not supported Not supported Not supported
Hypothesis 1b: An increase in target technological overlap will
negatively affect the impact the target’s technological capabilities
will have on abnormal returns.
Supported Supported Supported
Hypothesis 2: An increase in acquirer technological overlap will
negatively affect the impact the target’s technological capabilities
will have on abnormal returns.
Supported Not supported Partial
support
Hypothesis 3: An increase in acquirer technological overlap will
negatively affect the impact the acquirer’s technological capabilities
will have on abnormal returns.
Supported Supported Supported
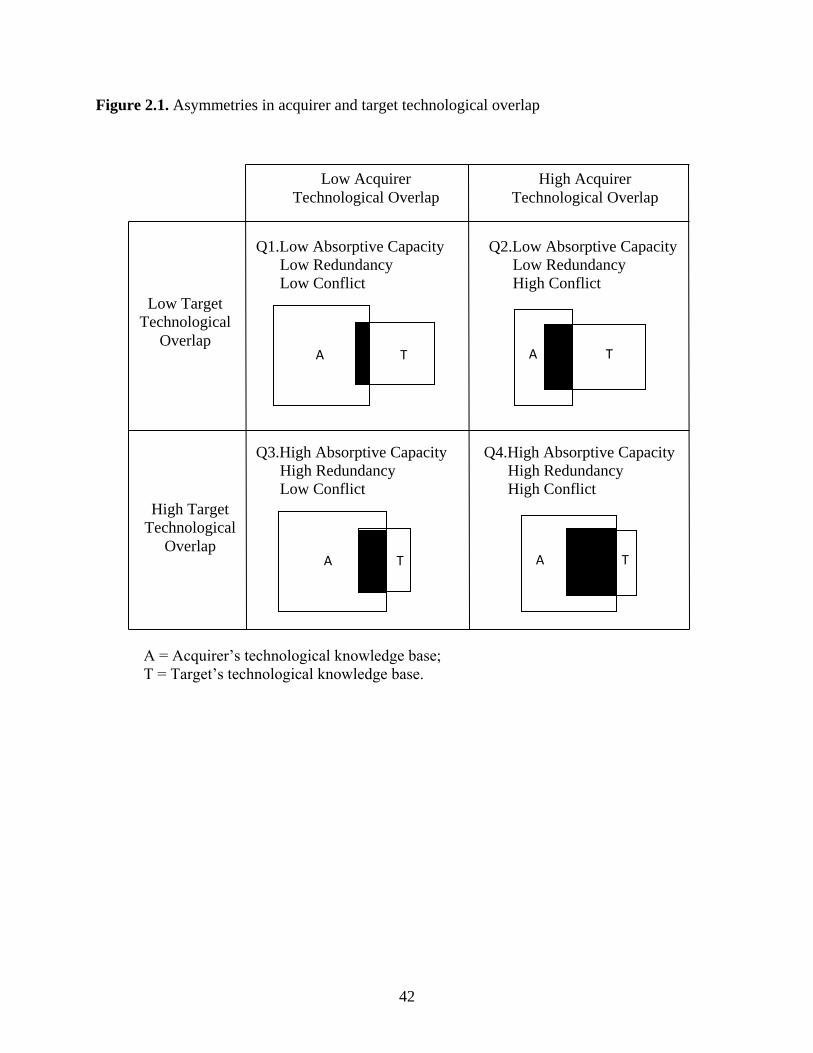
42
Figure 2.1. Asymmetries in acquirer and target technological overlap
A = Acquirer’s technological knowledge base;
T = Target’s technological knowledge base.
Q3.High Absorptive Capacity
High Redundancy
Low Conflict
T
A
A
T
Q4.High Absorptive Capacity
High Redundancy
High Conflict
Q1.Low Absorptive Capacity
Low Redundancy
Low Conflict
Low Acquirer
Technological Overlap
High Acquirer
Technological Overlap
High Target
Technological
Overlap
Low Target
Technological
Overlap
T A
A T
Q2.Low Absorptive Capacity
Low Redundancy
High Conflict

43
Figure 2.2. Knowledge bases and technological overlap
Kt
R
Ka
TARGET ACQUIRER

44
CHAPTER 3
ESSAY 2: WHEN DO FIRMS BENEFIT FROM ACQUIRING EXTERNAL
TECHNOLOGY?
INTRODUCTION
While technological acquisitions have recently become a much researched phenomenon among
management scholars (for a review see Graebner et al., 2010), scholars have yet to take into
account the different rationales for externally acquiring technology into their empirical analyses.
Karim and Mitchell (2000) made an initial contribution to identifying rationales for technological
acquisitions with their differentiation between resource extension and resource deepening
acquisitions. While Karim and Mitchell (2000) and Karim (2006) show that acquiring firms
execute post-acquisition reorganization differently with different acquisition rationales, current
research still gives insufficient attention to rationales when investigating acquisition
performance.
I submit that we must consider the rationale for the technological acquisition as the lack
of differentiation can explain prior conflicting results on whether the target firm’s technological
capabilities complement (e.g., Cassiman and Veugelers, 2006; Makri et al., 2010; Veugelers,
1997) or substitute (e.g., Blonigen and Taylor, 2000; Hitt et al., 1990; King et al., 2008) the
technological capabilities of the acquiring firm. I maintain that both findings are correct but
require qualifications. The target firm’s and the acquiring firm’s technological capabilities either
complement or substitute each other depending on the rationale for the acquisition. Karim (2006)
finds evidence that how the acquiring firm redeploys, reorganizes, and divests the assets of the
target firm and the acquiring firm depends on the rationale for the acquisition. The fact that
different rationales entail different utilizations of the target firm’s and acquiring firm’s

45
capabilities means that empirically testing a sample of acquisitions with mixed rationales can
lead to misleading results.
To address this concern, I extend Karim and Mitchell’s (2000) resource extension and
resource deepening rationales by identifying four general rationales for externally acquiring
technology. While identifying specific rationales may not be feasible due to information
availability, I submit that by looking at whether the acquiring firm is a technological leader or
laggard and the degree of overlap between the technological knowledge of the target firm and the
acquiring firm researchers can obtain a general understanding of the rationale driving the
acquisition. I identify four general rationales from the literature and link these rationales to the
acquiring firm’s technological capabilities and technological overlap: strategic renewal
(technological laggard/low technological overlap), capability upgrading (technological laggard/
high technological overlap), capability diversification (technological leader/low technological
overlap), and capability deepening (technological leader/high technological overlap).
I further synthesize theory and develop hypotheses about the differential effects the
technological capabilities of the target firm and acquiring firm have on acquisition performance
depending on whether the acquirer is a technological leader or laggard and the amount of
technological overlap present. I build hypotheses through a resource-based view with emphasis
on the creation of novel resource recombinations (Galunic and Rodan, 1998; Kogut and Zander,
1992). I conduct dual analyses of acquisition performance, linking increases in post-acquisition
innovative performance with acquirer value creation. I find that the target firm’s technological
capabilities have a greater positive impact on the creation of novel resource recombinations
when there is less technological overlap between the target firm and the acquiring firm. I also
find that the acquiring firm’s technological capabilities have an increasingly positive impact on
46
the creation of novel resource recombinations as the acquiring firm’s technological capabilities
increase. Further, I find that the acquiring firm creates more shareholder value from the
capabilities of the target firm and the acquiring firm when there is less technological overlap
between the target firm and the acquiring firm and when the acquiring firm is a technological
leader. Finally, and most importantly, I find that an acquiring firm must be technologically
capable for shareholders to value the acquisition of external technology.
I make five primary contributions to the literature on technological acquisitions. First, I
theoretically advance the conceptual understanding of technological acquisitions by identifying
four different general rationales for externally acquiring technology. Second, I synthesize theory
that explains when the technological capabilities brought into an acquisition create value for the
acquiring firm by creating novel resource recombinations. Third, I show that the capabilities of
the target firm and the acquiring firm can be either complementary (Larsson and Finkelstein,
1999; Makri et al., 2010) or substitutive (King et al., 2008) depending on the rationale for the
acquisition. By differentiating the rationales by the acquirer’s capabilities and target overlap, I
show that the target firm’s and the acquiring firm’s capabilities are more complementary in
acquisitions with characteristics suggesting a capability diversification rationale, but substitutive
in other acquisitions especially those with characteristics suggesting a capability upgrading
rationale. Fourth, I provide evidence that on average not all acquiring firms lose value from
acquisitions as much of the prior literature reports. I find that it is only the technological laggards
that destroy value for their shareholders when undertaking acquisitions. This aligns with recent
findings that the diversification discount occurs because of technological laggards diversifying
(Miller, 2004). Finally, I provide evidence linking the creation of novel resource recombinations
and acquirer value creation supporting Barney’s (1988) argument that the acquiring firm can

47
only capture the value created from an acquisition when unique, inimitable synergistic cash
flows exist.
RATIONALES FOR TECHNOLOGICAL ACQUISITIONS
Since research on technological acquisitions has garnered attention from various perspectives in
the management literature (cf. Graebner et al., 2010), the need to take a more in-depth account
of the rationales for the external acquisition of technology arises. Unfortunately, researchers have
yet to account for differences in rationales when studying the performance of technological
acquisitions. I submit that there are underlying differences in the utilization of the target firm’s
and the acquiring firm’s technological resources and capabilities among the different rationales
that create differential performance implications.
To understand the differential performance implications for different rationales, we must
first recognize the differences in the characteristics of the acquisitions. First, I account for the
degree of overlap between the technological knowledge of the target firm and the acquiring firm.
By accounting for the technological overlap, we understand whether the acquiring firm attempts
to extend and diversify its current technological capabilities or rather deepen and strengthen its
current technological capabilities (Haspeslagh and Jemison, 1991; Karim and Mitchell, 2000;
Larsson and Finkelstein, 1999).
Second, I account for whether the acquiring firm is a technological leader or laggard. By
accounting for the acquiring firm’s technological leader/laggard status, we gain an understanding
of not only the acquiring firm’s need to externally acquire new technological resources and
capabilities but also the acquiring firm’s ability to benefit from combining the capabilities of the
target firm with its own capabilities.
48
By simultaneously considering both the level of technological relatedness and whether
the acquiring firm is a technological leader or laggard, I submit that researchers are better able to
understand which of the four general rationales identified in the technological acquisitions
literature is driving the acquisition: strategic renewal, capability upgrading, capability
diversification, and capability deepening. Figure 3.1 gives a visual representation of where these
four rationales occur relative to each other. As seen in Figure 3.1, I do not constrain the four
rationales to their respective quadrants as I am not arguing that the rationales are mutually
exclusive of each other.
Strategic Renewal
Strategic renewal as a rationale for acquiring new technology means that the acquiring firm not
only aims to extend its current technological capabilities by acquiring a technologically
dissimilar firm, but also aims to transform the firm’s core technological strategy through the use
of the target firm’s technological capabilities. Agarwal and Helfat (2009: 282) define strategic
renewal as follows:
“Strategic renewal includes the process, content, and outcome of refreshment or
replacement of attributes of an organization that have the potential to substantially affect
its long-term prospects.”
A key part of this definition for strategic renewal technological acquisitions is the, “replacement
of attributes of an organization that have the potential to substantially affect its long-term
prospects.” Therefore, strategic renewal driven acquisitions should derive more post-acquisition
benefit from the target firm’s technological capabilities rather than from the acquiring firm’s
technological capabilities.
Strategic renewal acquisitions are likely to be characterized by technological dissimilarity
between the target firm and acquiring firm and by the acquiring firm being a technological

49
laggard. Strategic renewal acquisitions are one of two types of acquisition rationales I discuss
that falls within Karim and Mitchell’s (2000) ‘resource extension’ acquisitions.
Capability Upgrading
The rationale behind capability upgrading acquisitions is that the acquiring firm becomes unable
to compete with its current technological capabilities and therefore acquires a target firm to
upgrade its current technological capabilities. Though much of the acquisitions literature
suggests that target firms are the ones who have their resources experimented with through
reconfiguration and recombination (Capron et al., 1998; Capron et al., 2001; Capron and Pistre,
2002; Karim, 2006), this is not always the case. Karim (2006) finds that acquiring firms
reconfigure their own internal units into the newly acquired firm more often than previously
thought. Karim (2006: 816) explains this finding as follows:
“…an argument that is more likely and consistent with evoking radical change is that a
firm is purposefully trying to change some of the practices of a poor performing
internally developed unit. This assumes that the target possesses some routines or
intangible assets that the acquiring firm would like to absorb and spread within its
organization.”
The capability upgrading rationale acquisitions are likely to be characterized by
technological laggard acquiring firms that already possess a great amount of the target firms’
technological knowledge. Capability upgrading acquisitions are one of two types of rationales
that I discuss that falls within Karim and Mitchell’s (2000) ‘resource deepening’ acquisitions.
Capability Diversification
Capability diversification acquisitions align best with the traditional ‘resource extension’
acquisitions (Karim and Mitchell, 2000) and the resource-based view of firm growth (Penrose,
1959). Capability diversification acquisitions are likely characterized by technological leader
acquiring firms that acquire technologically less related target firms. Technological leaders find

50
that they possess slack resources for which they can redeploy in new markets by combining their
capabilities with those of the target firm.
Capability diversification acquisitions create new opportunities for path breaking change
as do strategic renewal acquisitions except firms conducting capability diversification
acquisitions only plan to diversify into new technological domains and not completely overhaul
their technological trajectory as with strategic renewal acquisitions. Therefore, capability
diversification driven acquisitions should derive benefit from both the target firm’s and the
acquiring firm’s technological capabilities.
Capability Deepening
Capability deepening acquisitions closely relate to Karim and Mitchell’s (2000) ‘resource
deepening’ acquisitions. These acquisitions are likely characterized by technological leader
acquiring firms that acquire technologically related firms.
While both incumbents and startups strive to innovate, past research provides evidence
that much of the truly novel innovations originate in startups (Abernathy and Utterback, 1978;
Pavitt et al., 1987). As a result, technological acquisitions have become a popular complement to
internal innovation allowing firms to overcome the time compression diseconomies of internal
innovation (Dierickx and Cool, 1989). For example, Cisco prefers to acquire technology through
acquisition rather than through internal development when the development time exceeds six
months (Aguilera and Dencker, 2004). Since the firms that undertake capability deepening
acquisitions are already technology leaders in the same technological domain as the target firm,
gaining access to state-of-the-art technology within the target firm is a common characteristic of
these acquisitions.

51
THEORY AND HYPOTHESES
Technological acquisitions have the potential to create value through the recombination of the
technological resources and capabilities of the target firm and the acquiring firm (Galunic and
Rodan, 1998; Kogut and Zander, 1992). As far back as Schumpeter (1934) and Penrose (1959),
recombinations of resources and capabilities have been the foundation of innovation. More
recent research provides evidence that the pursuit of novel recombinations is the driving force
that motivates many technological acquisitions (Karim and Mitchell, 2000; Larsson and
Finkelstein, 1999). In addition Barney (1988) maintains that the ability of the acquiring firm to
capture value created from an acquisition depends on its ability to create novel resource
recombinations. Therefore, I use a resource-based lens to analyze the acquiring firm’s ability to
create shareholder value by creating novel recombinations of the target firm’s and the acquiring
firm’s technological resources and capabilities. The theoretical model underlying the hypotheses
can be found in Figure 3.2.
In building the hypotheses from the theoretical model, I create hypotheses that are split
into two analyses. The first pertains to how the two drivers, technological overlap and the
acquiring firm’s technological capabilities, affect the ability of the acquiring firm to create novel
resource recombinations (percentage change in post-acquisition patenting intensity) using the
target firm’s and the acquiring firm’s technological capabilities. The second recognizes that the
four general rationales are characterized by different make-ups of the two drivers, and, therefore,
I hypothesize about differential acquirer value creation from the technological capabilities of the
target firm and the acquiring firm.

52
Resource Recombination
Technological overlap signals the amount of potential novel resource recombinations possible
from the pooling of the target firm’s and the acquiring firm’s technological resources. Each
acquisition contains a given set of possible novel resource recombinations. As the overlap
between the technological resources of the target firm and the acquiring firm increases, the
number of novel recombinations possible in that particular acquisition’s set decreases. Therefore,
if we compare two different acquisitions with identical quantities of technological resources in
the two target firms and the two acquiring firms but with different levels of technological
overlap, the acquisition with less technological overlap will possess a greater number of novel
resource recombinations in its set. Further, the technological capabilities of the target firm and
the acquiring firm will have a greater impact on creating resource recombinations as
technological overlap decreases as there will be more opportunities for the post-acquisition firm
to capitalize on the technological capabilities. This leads to the first set of hypotheses:
Hypothesis 1a: Given that the acquiring firm is a technological laggard, the target firm’s
technological capabilities will possess a greater impact on the percentage change in
post-acquisition patenting intensity when there is less technological overlap.
Hypothesis 1b: Given that the acquiring firm is a technological leader, the target firm’s
technological capabilities will possess a greater impact on the percentage change in
post-acquisition patenting intensity when there is less technological overlap.
Hypothesis 1c: Given that the acquiring firm is a technological laggard, the acquiring
firm’s technological capabilities will possess a greater impact on the percentage change
in post-acquisition patenting intensity when there is less technological overlap.

53
Hypothesis 1d: Given that the acquiring firm is a technological leader, the acquiring
firm’s technological capabilities will possess a greater impact on the percentage change
in post-acquisition patenting intensity when there is less technological overlap.
At the same time, we must also consider the technological capabilities of the acquiring
firm as not all firms possess equal ability to create novel resource recombinations. As the
technological capabilities of the acquiring firm increases, we should also expect an increase in
the creation of novel recombinations from the set of possible novel resource recombinations in
that particular acquisition. Acquiring firms with greater technological capabilities have greater
realized absorptive capacity enabling them to better transform and exploit the acquired
knowledge of the target firm with its own (Zahra and George, 2002). This leads to the second set
of hypotheses.
Hypothesis 2a: Given low technological overlap, the target firm’s technological
capabilities will possess a greater impact on the percentage change in post-acquisition
patenting intensity when the acquiring firm is a technological leader rather than a
laggard.
Hypothesis 2b: Given high technological overlap, the target firm’s technological
capabilities will possess a greater impact on the percentage change in post-acquisition
patenting intensity when the acquiring firm is a technological leader rather than a
laggard.
Hypothesis 2c: Given low technological overlap, the acquiring firm’s technological
capabilities will possess a greater impact on the percentage change in post-acquisition
54
patenting intensity when the acquiring firm is a technological leader rather than a
laggard.
Hypothesis 2d: Given high technological overlap, the acquiring firm’s technological
capabilities will possess a greater impact on the percentage change in post-acquisition
patenting intensity when the acquiring firm is a technological leader rather than a
laggard.
Value Creation
I now address how technological overlap and the technological leader/laggard status of the
acquiring firm gives us an understanding of how differential novel resource recombination
creation among the four general rationales leads to differential value creation. Following
Barney’s (1988) logic, the potential for resource recombination creation should contribute to
differential value creation since the ability of the acquiring firm to capture value in an acquisition
depends on its ability to create unique, inimitable future cash flows.
Due to less overlap between the technological knowledge of the target firm and the
acquiring firm, both strategic renewal and capability diversification rationales have greater
resource recombination possibilities than capability upgrading and capability deepening
rationales. The technological capabilities should create more value in capability diversification
acquisitions compared to the capability deepening acquisition due to the potential for truly novel
and high quality innovations from the recombination of the complementary resources (Makri et
al., 2010).
With strategic renewal acquisitions, the acquiring firm’s technological capabilities are not
nullified or discarded, but redirected towards a new technological trajectory. The acquisition of a

55
firm that possesses technological knowledge not present in the acquiring firm’s knowledge base
jumpstarts the acquiring firm’s capabilities which allows it to compete in the new technological
domain. When considering the post-acquisition cooperation of knowledge workers in
technological laggard firms, conflict and productivity loss may be more prevalent in capability
upgrading driven acquisitions since there will be less possibilities for creating complementarities
due to the high technological overlap (Paruchuri et al., 2006; Sears and Hoetker, 2012).
Therefore, I expect the technological capabilities to create more value in strategic renewal
acquisitions compared to capability upgrading acquisitions.
Since both technological overlap and the technological capabilities of the acquiring firm
affect the creation of novel resource recombinations, I separately test the effect that technological
overlap possesses when the acquiring firms are technological laggards and when the acquiring
firms are technological leaders. This allows me to be able to isolate the effect that technological
overlap has on the ability of the acquiring firm to create shareholder value from the target firm’s
and its own technological capabilities. This leads to the third set of hypotheses:
Hypothesis 3a: Given that the acquiring firm is a technological laggard, the target firm’s
technological capabilities will create more shareholder value for the acquiring firm on
average when there is less technological overlap.
Hypothesis 3b: Given that the acquiring firm is a technological leader, the target firm’s
technological capabilities will create more shareholder value for the acquiring firm on
average when there is less technological overlap.

56
Hypothesis 3c: Given that the acquiring firm is a technological laggard, the acquiring
firm’s technological capabilities will create more shareholder value for the acquiring
firm on average when there is less technological overlap.
Hypothesis 3d: Given that the acquiring firm is a technological leader, the acquiring
firm’s technological capabilities will create more shareholder value for the acquiring
firm on average when there is less technological overlap.
Due to the greater technological capabilities of the acquiring firm, both capability
diversification and capability deepening rationales have greater potential to actually create novel
resource recombinations from their given set of resource recombination possibilities compared to
capability upgrading and capability deepening rationales. For example, if we could hold the
number of resource recombinations possible in an acquisition’s set of possible recombinations
constant, we would expect the number of resource recombinations actually created to increase
with increases in the acquiring firm’s technological capabilities. Therefore, ceteris paribus,
increases in the acquiring firm’s technological capabilities should increase the value derived
from the target firm’s and the acquiring firm’s technological capabilities.
Differentiating among the value creation in the four rationales goes beyond the size of the
of the recombination sets. ‘Replacement’ of particular routines, resources, and/or capabilities
motivate strategic renewal driven acquisitions (Agarwal and Helfat, 2009). The technological
capabilities should then create more value in capability diversification acquisitions compared to
the strategic renewal acquisitions since much of the prior strategic importance of the acquiring
firm’s technological capabilities will become less relevant post-acquisition in strategic renewal

57
acquisitions. On the other hand, capability diversification acquisitions create value from
integrating the capabilities of both the target firm and the acquiring firm.
Capability upgrading acquisitions will also face difficulties creating value from
recombining the resources of the target firm and acquiring firm. Potential conflict (Paruchuri et
al., 2006; Sears and Hoetker, 2012) and routine disruptions (Puranam and Srikanth, 2007) will
further disadvantage capability upgrading acquisitions compared to capability deepening.
Therefore, I predict that the technological capabilities of the target firm and the acquiring firm
will create more value in capability deepening acquisitions compared to capability upgrading
acquisitions.
In developing the second set of hypotheses, I separately test the effect that the
technological leader/laggard status possesses when there are low levels of technological overlap
and when there are high levels of technological overlap. This allows me to be able to isolate the
effect the technological leader/laggard status of the acquiring firm has on its ability to create
shareholder value from the target firm’s and its own technological capabilities. This leads to the
fourth set of hypotheses:
Hypothesis 4a: Given low technological overlap, the target firm’s technological
capabilities will create more shareholder value for the acquiring firm on average when
the acquiring firm is a technological leader rather than a laggard.
Hypothesis 4b: Given high technological overlap, the target firm’s technological
capabilities will create more shareholder value for the acquiring firm on average when
the acquiring firm is a technological leader rather than a laggard.

58
Hypothesis 4c: Given low technological overlap, the acquiring firm’s technological
capabilities will create more shareholder value for the acquiring firm on average when
the acquiring firm is a technological leader rather than a laggard.
Hypothesis 4d: Given high technological overlap, the acquiring firm’s technological
capabilities will create more shareholder value for the acquiring firm on average when
the acquiring firm is a technological leader rather than a laggard.
By incorporating the previous two sets of hypotheses, I expect acquisitions that possess
characteristics that suggest a capability diversifying acquisitions to create the most value.
Capability diversifying acquisitions benefit more from possessing greater potential for novel
resource recombinations compared to capability upgrading and capability deepening acquisitions
due to less technological overlap. Capability diversifying acquisitions also benefit more from a
greater ability to identify and create novel recombinations from their given set of potential
recombinations compared to strategic renewal acquisitions due to the acquiring firm being a
technological leader. Capability diversifying acquisitions should also be less susceptible to
conflict between the knowledge workers of the target firm and acquiring firm as each brings their
own unique capabilities to the post-acquisition firm. Therefore, the acquiring firm should be able
to benefit from both the target firm’s capabilities and its capabilities.
According to Barney’s (1988) conditions for the acquiring firm to appropriate value,
capability diversification acquisitions should create the most value. With both strategic renewal
and capability upgrading rationales, the acquiring firm does not possess the technological
capabilities needed to create unique recombinations that allow it to appropriate value. With
capability deepening acquisitions, the target firm and acquiring firm do not possess resources

59
different enough to be able to create unique recombinations. This leads to bidding wars for the
target firm where the target firm ends up capturing most of the synergistic value created. This
leads to the fifth set of hypotheses:
Hypothesis 5a: Acquisitions characterized by simultaneous low technological overlap
and the acquirer being a technological leader will create the most amount of value when
summing the value created from both the target firm’s technological capabilities and the
acquiring firm’s technological capabilities.
Hypothesis 5b: Acquisitions characterized by simultaneous low technological overlap
and the acquirer being a technological leader will create the greatest amount of overall
value appropriated by the acquiring firm.
I expect capability upgrading acquisitions to create the least amount of value or more
likely destroy the most amount of value as research has consistently shown that acquiring firms
lose value on average in acquisitions. Capability upgrading acquisitions not only have a smaller
given set of recombination possibilities due to greater technological overlap but also consist of
technological laggard acquiring firms that are less able to identify and create novel resource
recombinations. As these acquiring firms have been unable to develop sufficient technological
capabilities internally in the past, shareholders will have little reason to believe they will
successfully manage the target firm’s technological resources and capabilities. Given Barney’s
(1988) argument, any technological synergistic value to be created in capability upgrading
acquisitions will be captured by the target firm’s shareholders. This leads to the final set of
hypotheses:

60
Hypothesis 6a: Acquisitions characterized by simultaneous high technological overlap
and the acquirer being a technological laggard will create the least amount of value
when summing the value created from both the target firm’s technological capabilities
and the acquiring firm’s technological capabilities.
Hypothesis 6b: Acquisitions characterized by simultaneous high technological overlap
and the acquirer being a technological laggard will create the least amount of overall
value appropriated by the acquiring firm.
METHODS
Data and Sample
The analysis consists of two parts: patenting intensity and value creation using cumulative
abnormal returns. Since constructing cumulative abnormal returns requires additional constraints
compared to constructing patenting variables, the sample for the analysis of abnormal returns is a
subset of the full sample used for testing effects on patenting intensity.
The sample consists of technological acquisitions obtained from SDC Platinum’s
Mergers & Acquisitions database from 1994 to 2004. The year 1994 is the first year that an
acquisition appears in the SDC database after implementing all constraints while I chose 2004 as
the end date to allow for the construction of the patenting intensity dependent variable. The
acquisitions are initially identified as technological acquisitions if both the acquiring firm and
target firm are classified as ‘high tech’ firms in SDC Platinum’s M&A database.
I further took the following steps to create the sample. I limited the sample to firms listed
as manufacturing firms by SIC codes 20-39 to allow for comparisons with previous
technological acquisition research (Puranam et al., 2009; Puranam et al., 2006; Puranam and

61
Srikanth, 2007). I limited the acquisitions to those where the target firm had less than 500
employees at the time of the acquisition. This criterion is both consistent with the U.S. Small
Business Administration definition of a small business and with prior studies on technological
acquisitions (Granstrand and Sjolander, 1990; Puranam et al., 2009; Puranam et al., 2006;
Puranam and Srikanth, 2007). This also allows for me to be more confident that market power
did not motivate the acquisition. I also eliminated partial acquisitions and acquisitions of target
firms for which the acquiring firm already owns a stake. To ensure that all of the acquisitions are
technological in nature, I searched news articles and newswires using LexisNexis and eliminated
acquisitions that were clearly not technological in nature (Ahuja and Katila, 2001). I also
eliminated all acquisitions where the target firm does not possess any patents to allow for the
independent variable construction. The final sample for the patenting intensity analysis consists
of 246 acquisitions.
I further filtered the sample for the analysis using cumulative abnormal returns. I
removed divestitures to eliminate any effect on the firms’ returns due to greater negotiation
power by the target firm’s parent. I eliminated any acquisition where there was a confounding
event (public announcement) surrounding the event window. Lastly, I limited the sample to deals
greater than $50 million since small deals may have no effect on the acquiring firm’s share price.
After filtering the original sample of firms, I was left with a final sample consisting of 97
acquisitions.
Dependent Variables
Percentage change in patenting intensity. I constructed the variable, percentage change in
patenting intensity, to measure the percentage change in novel resource recombination creation
from the pre-acquisition period to the post-acquisition period. I calculate this variable by

62
subtracting the count of patents applied for and later granted by the target firm and the acquiring
firm combined in the three-year window prior to the acquisition from the count of patents
applied for and later granted by the post-acquisition firm in the three-year window following the
acquisition. I then divided this number by the count of the number of patents applied for and
granted by the target firm and acquiring firm combined in the three-year window prior to the
acquisition. The formula is as follows:
Percentage change in patenting intensity ( )
⁄ (1)
Acquirer cumulative abnormal returns. To measure value creation, I used the event study
method to construct the cumulative abnormal returns (CAR) of the acquiring firms, that is, the
acquiring firm’s stock market reaction to the announcement of the acquisition (McWilliams and
Siegel, 1997). I used daily acquiring firm returns and equally-weighted market returns, which I
obtained from the CRSP database. I used equally-weighted market returns since they possess a
greater degree of correlation with security returns than value-weighted returns, which creates
more precise estimators allowing for enhanced detection of abnormal returns (Peterson, 1989). I
used an estimation window of 250 days from 51 days prior to the announcement to 300 days
prior. I used an event window from one day prior to the announcement to one day after. The
three day window allows for differences in the timing of the announcement and the release of the
announcement in the press (Peterson, 1989). To ensure no confounding events, I searched
LexisNexis for every acquiring firm and eliminated any acquisitions for which there was a
confounding event within a five day event window. I used Scholes-Williams coefficients to
calculate the CARs which corrects for the bias created from thin and nonsynchronous security
trading (Scholes and Williams, 1977). The complete method implemented in calculating
acquiring firm CAR can be found in Appendix A.
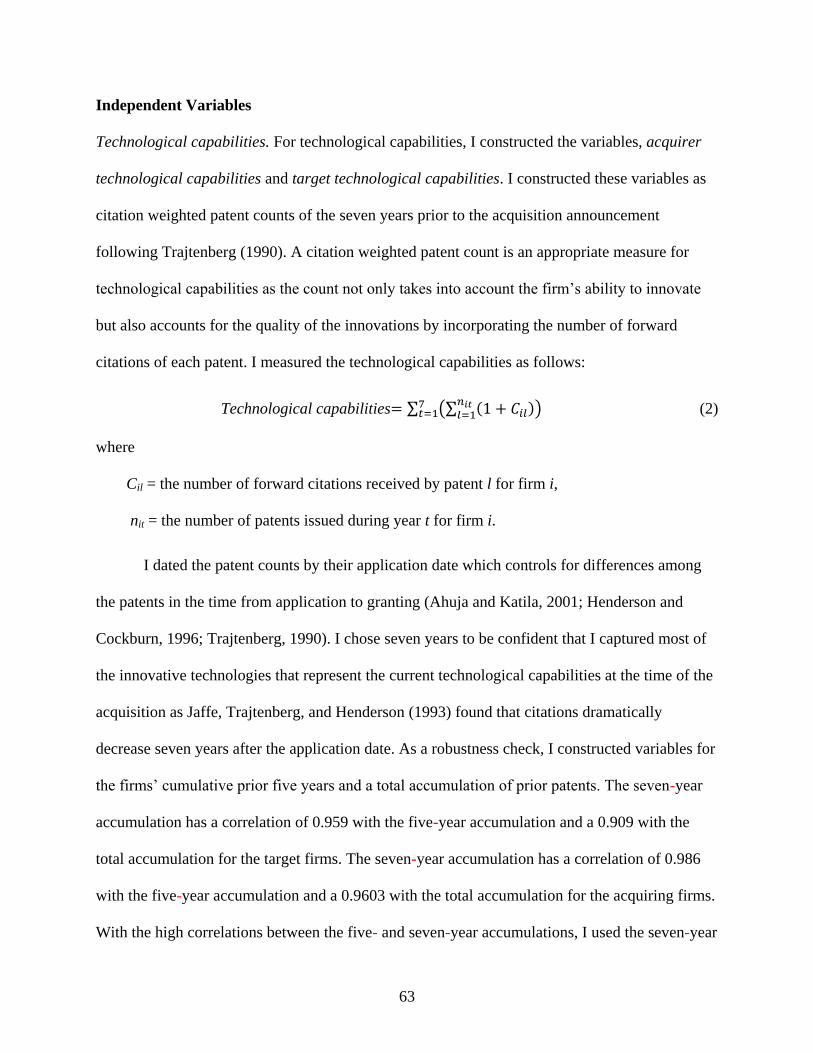
63
Independent Variables
Technological capabilities. For technological capabilities, I constructed the variables, acquirer
technological capabilities and target technological capabilities. I constructed these variables as
citation weighted patent counts of the seven years prior to the acquisition announcement
following Trajtenberg (1990). A citation weighted patent count is an appropriate measure for
technological capabilities as the count not only takes into account the firm’s ability to innovate
but also accounts for the quality of the innovations by incorporating the number of forward
citations of each patent. I measured the technological capabilities as follows:
Technological capabilities ∑ (∑ ( ) )
(2)
where
Cil = the number of forward citations received by patent l for firm i,
nit = the number of patents issued during year t for firm i.
I dated the patent counts by their application date which controls for differences among
the patents in the time from application to granting (Ahuja and Katila, 2001; Henderson and
Cockburn, 1996; Trajtenberg, 1990). I chose seven years to be confident that I captured most of
the innovative technologies that represent the current technological capabilities at the time of the
acquisition as Jaffe, Trajtenberg, and Henderson (1993) found that citations dramatically
decrease seven years after the application date. As a robustness check, I constructed variables for
the firms’ cumulative prior five years and a total accumulation of prior patents. The seven-year
accumulation has a correlation of 0.959 with the five-year accumulation and a 0.909 with the
total accumulation for the target firms. The seven-year accumulation has a correlation of 0.986
with the five-year accumulation and a 0.9603 with the total accumulation for the acquiring firms.
With the high correlations between the five- and seven-year accumulations, I used the seven-year

64
accumulation to be more conservative in making sure I captured all relevant unique
technological capabilities.
For technological overlap, I constructed the variable, target technological overlap, which
represents the percentage of the target firm’s knowledge base that the acquiring firm possesses in
its knowledge base. I constructed the knowledge bases in line with Ahuja and Katila (2001). A
firm’s knowledge base is a count of the number of unique elements of knowledge where I
defined an element of knowledge as either a firm’s patent or a patent cited by one of the firm’s
patents. By aggregating these elements of knowledge and eliminating all duplicates, I arrived at a
firm’s knowledge base. In constructing the knowledge bases, I included patents with an
application date in the seven years prior to the acquisition announcement. A seven-year window
allows me to be confident that I captured the knowledge that the firms possessed that were still
relevant at the time of the acquisition (Jaffe et al., 1993).
Control Variables
I constructed the variable, acquirer technological overlap, following the method outlined above
for target technological overlap except that I measured the proportion of the acquiring firm’s
knowledge base that is a part of the target firm’s knowledge base instead of the proportion of the
target firm’s technological knowledge base that is a part of the acquiring firm’s knowledge base.
Sears and Hoetker (2012) showed that technological overlap can be asymmetric and that target
overlap and acquirer overlap can affect acquisition performance differently.
I constructed the variable acquisition experience. Acquisition experience has been found
to create benefits (Bruton et al., 1994; Fowler and Schmidt, 1989; Zollo and Singh, 2004), to
create a burden (Kusewitt Jr, 1985), and to have no effect (King et al., 2004; Lahey and Conn,
1990). Acquisition experience counts the number of acquisitions the acquiring firm completed in
65
the five years prior to the acquisition. I limited the acquisition experience to five years due to
empirical evidence that has shown depreciation in the knowledge gained from managerial
experience (Sampson, 2005).
I included three variables that control for the size of the acquisition. I constructed the
variable relative size (employees) as the log of the relative size of the target firm to acquiring
firm in terms of their number of employees. I also construct the variable relative size (knowledge
bases) which is the number of knowledge elements in the target firm’s knowledge base divided
by the number of elements in the acquiring firm’s knowledge base.
I controlled for the industry of the acquisitions. I created dummy variables for each
industry at the 2-digit SIC level for the analysis on patenting intensity. For the analysis on CAR,
instead of including all dummy variables, I only included the variable pharma which is a dummy
variable for acquisitions in the biotech/pharmaceutical industry. I only included the pharma
dummy for the following reasons. First, the analysis on CAR suffered the limitation of small
sample sizes. By only including the pharma variable, I was able to minimize the number of
degrees of freedom used. Second, the sole use of pharma was sufficient for the analysis as the
other industry dummies were not statistically significant.
I further included four control variables exclusively for the analysis on CAR. First, I
included the variable % of stock which measures the percent of the transaction that was paid for
with acquirer stock. Second, I constructed the variable relative market share to control for
market dominance of the acquiring firm. Third, I construct an acquiring firm four-firm industry
concentration ratio at the SIC 3-digit classification level using Compustat called 4-firm
concentration ratio. I also included the variable transaction value which is the value of the
acquisition scaled to 100 million. Transaction value provided two control benefits. First, it

66
provided a control for the overall size in value of the acquisition. Second, it was able to partially
control for the abnormal returns being driven by overpayment since including premium paid
would eliminate too many acquisitions from the sample due to missing data.
Finally, for the patenting analysis, I included the variable pre-acquisition patenting. This
variable controlled for the quantity in patenting activity of the two merging firms as this will
affect the quantity of post-acquisition patenting necessary to create a significant percentage
change. The variable is calculated as a count of the patents applied for in the immediate three
years prior to the acquisition by the target firm and the acquiring firm combined that were
eventually granted.
Methods of Analyses
To test the hypotheses for both percentage change in patenting intensity and value creation, I
split the sample into four subsamples by the level of target technological overlap and the
acquirer’s technological capabilities. For the change in patenting subsamples, I split the sample
into four subsamples including the 50 most extreme acquisitions for each subsample. This allows
there to be less of an arbitrary split as no acquisition would switch to a different subsample by a
minimal change of value in where I choose to split the sample. That means that there is a buffer
of acquisitions in between the four subsamples in the patenting analysis. For the cumulative
abnormal returns subsamples, I split the full sample at the median of acquirer technological
capabilities to distinguish between leaders and laggards and then I split the sample at target
technological overlap. By splitting the sample into these four subsamples, I am able to test for
differences in abnormal returns among the subsamples which tests Hypotheses 5b and 6b. I also
run OLS regressions for each of the subsamples. To test for differences in the impact of the
target’s and the acquirer’s technological capabilities on the percentage change in patenting

67
intensity, I run Wald tests on significant differences in the coefficients of the four subsample
OLS results which tests Hypotheses 1 and 2. To test for differences in value contributed by the
capabilities among the four subsamples, I multiply the values of the target and acquirer
capabilities variables by their respective coefficients from the four separate regressions. I then
calculate the average value contributed by the target’s capabilities and by the acquirer’s
capabilities for each of the four subsamples. I then test for differences in the average value
contributed by the target’s and the acquirer’s technological capabilities among the four
subsamples which tests Hypotheses 3 and 4. To test Hypotheses 5a and 6a, I use a Wald test to
test for significant differences in the sum of value created by both the target’s and the acquirer’s
technological capabilities.
Descriptive Statistics
Table 3.1 contains the descriptive statistics and correlations of the variables. Panel A contains the
variables used in the analysis of patenting intensity. Panel B contains the variables used in the
analysis of CAR. From looking at the correlations for the patenting analysis, there are three
correlations that are above 0.50 which includes relative size (employees) with acquirer
technological capabilities and acquirer technological capabilities with pre-acquisition patenting
intensity, and relative size (employees) with pre-acquisition patenting intensity. For the CAR
analysis, there are also two correlations that are above 0.50 which include both relative market
share and acquirer technological capabilities with relative size (employees). I ran variance
inflation factor (VIF) analyses on all the models and none of the variables have VIFs high
enough to create concern. I also did not find that the coefficients jumped around with changes in
model specifications which signals multicollinearity (Echambadi and Hess, 2007). Therefore, I
am confident that multicollinearity did not significantly affect the results.
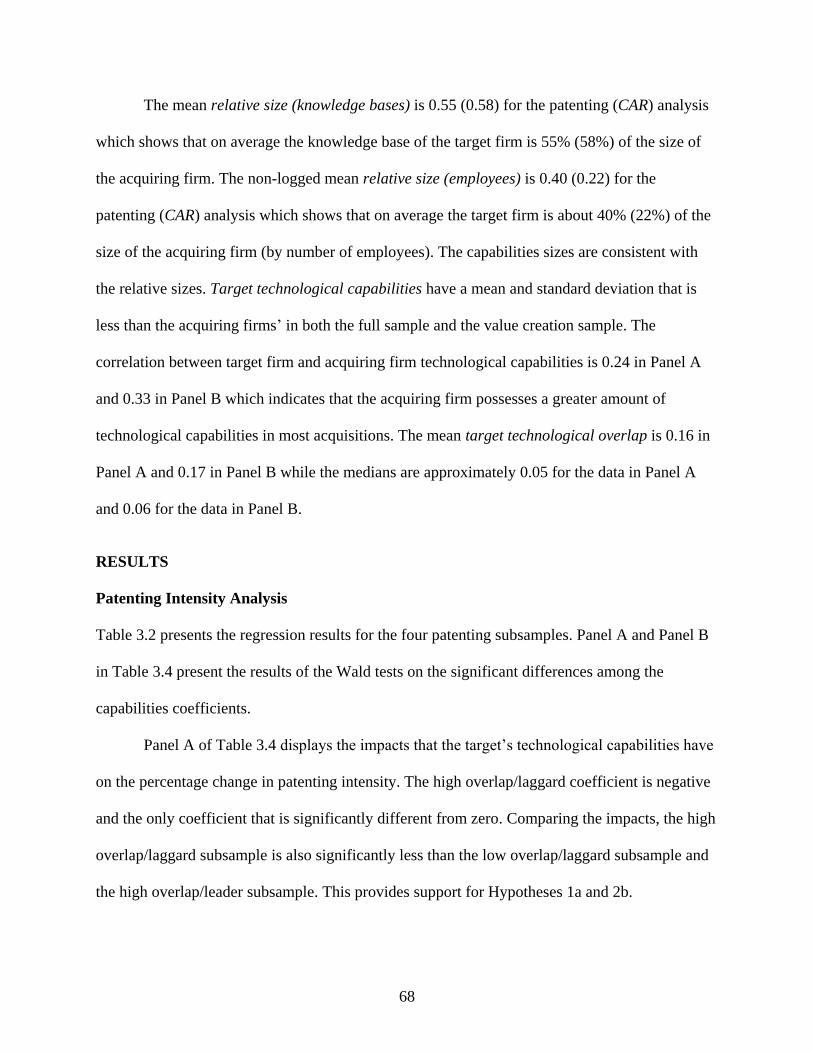
68
The mean relative size (knowledge bases) is 0.55 (0.58) for the patenting (CAR) analysis
which shows that on average the knowledge base of the target firm is 55% (58%) of the size of
the acquiring firm. The non-logged mean relative size (employees) is 0.40 (0.22) for the
patenting (CAR) analysis which shows that on average the target firm is about 40% (22%) of the
size of the acquiring firm (by number of employees). The capabilities sizes are consistent with
the relative sizes. Target technological capabilities have a mean and standard deviation that is
less than the acquiring firms’ in both the full sample and the value creation sample. The
correlation between target firm and acquiring firm technological capabilities is 0.24 in Panel A
and 0.33 in Panel B which indicates that the acquiring firm possesses a greater amount of
technological capabilities in most acquisitions. The mean target technological overlap is 0.16 in
Panel A and 0.17 in Panel B while the medians are approximately 0.05 for the data in Panel A
and 0.06 for the data in Panel B.
RESULTS
Patenting Intensity Analysis
Table 3.2 presents the regression results for the four patenting subsamples. Panel A and Panel B
in Table 3.4 present the results of the Wald tests on the significant differences among the
capabilities coefficients.
Panel A of Table 3.4 displays the impacts that the target’s technological capabilities have
on the percentage change in patenting intensity. The high overlap/laggard coefficient is negative
and the only coefficient that is significantly different from zero. Comparing the impacts, the high
overlap/laggard subsample is also significantly less than the low overlap/laggard subsample and
the high overlap/leader subsample. This provides support for Hypotheses 1a and 2b.

69
The low overlap/laggard subsample coefficient is marginally significantly greater than
the low overlap/leader coefficient (p = 0.101). While the directions is opposite of what I
hypothesize, the logic for why the low overlap/laggard subsample is greater provides support for
the typology. Strategic renewal acquisitions rely greatly on the knowledge of the target firm for
its new strategic direction while capability diversification acquisitions utilize the target’s
knowledge as part of a peripheral strategy. Therefore, the target should have a significantly
greater impact on post-acquisition innovation in strategic renewal acquisitions compared to
capability diversification acquisitions.
Panel B of Table 3.4 displays the impacts that the acquirer’s technological capabilities
have on the percentage change in patenting intensity. The low overlap/laggard subsample is
significantly less than the other three subsamples. This provides support for Hypothesis 2c, but
runs contrary to Hypothesis 1c. With strategic renewal acquisitions relying more heavily on the
target’s knowledge rather than the acquirer’s knowledge, it is not too unexpected for the low
overlap/laggard subsample coefficient to have a weaker impact on post-acquisition invention
compared to the high overlap/laggard subsample.
The capabilities of the acquirers have the greatest impact on the percentage change in
patenting intensity when the acquirer is a technological leader. The coefficient is only
significantly greater than zero for the high overlap/leader subsample. Further, the high
overlap/leader coefficient is marginally significantly greater than the high overlap/laggard
subsample (p = 0.161).
Value Creation Analysis
The value creation analysis investigates the differential value creation by the target firm’s and
the acquiring firm’s technological capabilities. Table 3.3 presents the regression results for the

70
four subsamples. Table 3.4 presents the results for the Hypotheses 3a-3d, 4a-4d, 5a, 5b, 6a, and
6b.
Panel C of Table 3.4 displays the value created from the target firm’s technological
capabilities. The target firm’s technological capabilities create more value when there is low
technological overlap between the target firm and the acquiring firm. This result holds for both
technological leaders and technological laggards. Therefore, Hypotheses 3a and 3b are both
supported.
Contrary to Hypotheses 4a and 4b, the target firm’s technological capabilities create more
value when the acquiring firm is a technological laggard. This result holds for both low and high
levels of technological overlap. Though these results are contrary to Hypotheses 4a and 4b, they
do lend support to the proper identification of the general rationales. Since the target firm’s
technological capabilities will play a much greater role of importance in the future success of the
technological laggard acquiring firms, it is not too surprising that shareholders value the target
firm’s capabilities more in acquisitions with characteristics suggesting strategic renewal and
capability upgrading rationales.
Panel D of Table 3.4 displays the value created from the acquiring firm’s technological
capabilities. Similar to the target firm’s technological capabilities, the acquiring firm’s
capabilities also create more value when there is less technological overlap. This holds true for
both technological leaders and laggards. Therefore, both Hypotheses 3c and 3d are supported.
Supporting Hypotheses 4c and 4d, the acquiring firm’s technological capabilities create more
value when the acquiring firm is a technological leader. This finding holds true with both low
and high levels of technological overlap.

71
Panel E of Table 3.4 displays the results for value creation from combining the target
firm’s and the acquiring firm’s technological capabilities. As creating technological synergies
motivate many technological acquisitions, testing for differences in value creation from both the
target firm’s and the acquiring firm’s capabilities combined indicates which rationales may
benefit more from technological synergies. The low overlap/leader subsample acquisitions create
the most value from combining the target firm’s and the acquiring firm’s technological
capabilities while the high overlap/laggard subsample acquisitions create the least amount of
value and actually destroy value. These results provide support for Hypotheses 5a and 6a. The
value created from the combined technological capabilities in the low overlap/laggard and high
overlap/leader subsamples were not significantly different from each other.
Panel F of Table 3.4 displays the results for the tests of significant differences in acquirer
cumulative abnormal returns. While the low overlap/leader subsample has the greatest abnormal
return, it is only significantly greater than the high overlap/laggard subsample, which provides
partial support for Hypothesis 5b. While the high overlap/laggard subsample has the lowest
abnormal return, it is only significantly less than the low overlap/leader and high overlap/leader
subsamples which provides strong partial support for Hypothesis 6b. An interesting finding is
that both laggard subsamples significantly lose value while both leader subsamples do not
significantly lose or create value. Therefore, the results show that on average only technological
laggards destroy value when acquiring technology on the external market.
Table 3.5 presents a summary of the hypotheses and results.
DISCUSSION AND CONCLUSION
This research study maintains that there are four main rationales for acquiring external
technology and that the rationales have different implications for novel resource recombination

72
creation and therefore, acquirer shareholder value creation. I submit that by taking into account
whether the acquirer is a technological leader or laggard and how technologically related the
target is to the acquirer, we gain an understanding of the rationale for the acquisition and the
performance implications.
The analysis of differential impacts on novel resource recombination creation from the
capabilities of the target and acquirer does not provide as clear a picture as does the value
creation analysis, but the analysis does provide some evidence of differences. The patenting
intensity variable points toward the target’s technological capabilities possessing a greater
impact when the rationale is for strategic renewal or capability deepening. The target firm will
possess greater influence in the strategic renewal acquisitions while the acquiring firm is better
able to use the target’s knowledge in new knowledge creation in capability deepening
acquisitions since the target firm is quite similar to the acquiring firm and the acquirer possess
great knowledge creation capabilities.
The results of the acquirer’s technological capabilities impact on patenting intensity are
much clearer. As hypothesized, the results show that technological leaders are better able to
create novel resource recombinations using their own technological capabilities following an
acquisition. An interesting finding is that while the low overlap/laggard subsample created some
of the greatest benefit from the target’s technological capabilities the acquirer’s technological
capabilities hindered the creation of novel resource recombinations. This is consistent with what
we would expect from strategic renewal acquisitions. They discard the old while leaning on the
new.
The analysis of differential value contribution gives a clear picture of when the target’s
technological capabilities create more value. The target’s technological capabilities create more

73
value when they are less technologically related to the acquirer’s capabilities. These results align
with the literature on resource recombinations (Galunic and Rodan, 1998; Kogut and Zander,
1992) and innovative complementarities (Ahuja and Katila, 2001; Makri et al., 2010). An
interesting finding is that only in the low overlap/leader subsample are the target coefficients
positive. This indicates that investors do not value externally acquiring technology when there is
a high degree of technological relatedness between the target and acquirer. The market possibly
foresees integration complications between the knowledge workers of the target and the acquirer
in resource deepening acquisitions as Capron and Mitchell (2009) find acquisitions are less
successful with greater similarities in technology.
The results for value contribution from the acquirer’s technological capabilities also
contribute to our understanding in which rationales the acquirer’s capabilities contribute more
value. The empirical results show that only technology leaders create value from their own
technological capabilities in an acquisition. Both strategic renewal and capability upgrading
rationales entail acquiring new technological capabilities that will play a major role in the post-
acquisition firm. Therefore, the market discounts the acquirer’s technological capabilities when
technological laggards acquire new capabilities.
Since the results show that value creation from the target’s technological capabilities does
not guarantee that value will be created from the acquirer’s technological capabilities too, we
need to consider the value created from the combination of the target’s and the acquirer’s
technological capabilities. This analysis investigates the synergistic value creation from
combining the target’s and the acquirer’s technological capabilities. As hypothesized, I find that
the low overlap/leader subsample creates the most value. Capability diversification acquisitions
benefit both from a greater possible quantity of novel resource recombinations due to less

74
technological overlap and from the acquirer being better able to identify and create novel
resource recombinations. This finding is also consistent with Barney (1988) as capability
diversification acquisitions possess the greatest opportunity for creating novel resource
recombinations unforeseen by the market and inimitable by competitors.
The combined resources also create value in the low overlap/laggard and high
overlap/leader subsamples while the high overlap/laggard subsample actually destroys value on
average. The interesting part of testing the target and acquirer separately is that while both the
low overlap/laggard and high overlap/leader subsamples create synergistic value from combining
their capabilities, the high overlap/leader subsample creates value from the acquirer’s capabilities
and the low overlap/laggard subsample creates value from the target’s capabilities. Considering
the corresponding rationales, capability deepening acquisitions enhance the value of the
acquirer’s capabilities by acquiring state-of-the-art technology that would take the acquirer too
long to develop in-house. As mentioned above, Cisco prefers to acquire similar firms when the
technology the target possesses will require more than six months for Cisco to internally develop
(Aguilera and Dencker, 2004). When Cisco acquires a small technology firm, its technology
becomes more valuable with the absorption of the target’s technology. On the other hand,
strategic renewal acquisitions enhance the value of the target’s capabilities by bringing its own
flailing technology to a new market and technological domain. With capability upgrading, the
acquirer does not have sufficient capabilities to either enhance the target’s capabilities or take
advantage of the capabilities that they acquire from the target to enhance their own capabilities
which leads to value destruction.
Acquirer shareholders’ ultimate concern is whether the acquisition creates value or
destroys value. While research on acquisitions consistently finds that acquirers lose value, the

75
results show that only technological laggards destroy shareholder value. This carries implications
for management. If the firm cannot develop successful technology internally, then the market
will not value it trying to externally acquire technology. This finding aligns with Miller’s (2004)
finding that the diversification discount is caused by technological laggards diversifying into new
markets.
The dual analysis of patenting intensity and value creation allows for comparison of the
theoretical model that resource recombination relates to value creation. The results provide
minimal evidence that the target’s impact on resource recombination aligns with the value
contributed by the target’s technological resources. The target’s technological capabilities drive
both increased novel resource recombination and value creation in the low overlap/laggard
subsample. The alignment of resource recombination creation and value creation is better
evidenced with the acquirer’s technological capabilities. The technological leaders possess a
greater impact on resource recombination creation and value creation.
This study is not without its limitations. The main limitation is the inability to observe the
rationale of the acquisitions. Further, the study does not observe the resource recombination
process. While patents do provide empirical evidence of combining prior knowledge, I was
unable to observe the reorganization and integration of capabilities that a survey study would be
able to observe. These limitations do provide opportunities for future research to take a look
inside the integration process to observe how different rationales lead to different resource
utilizations.
In conclusion, I make the following contributions. I find that acquirers create more value
from the target’s technological capabilities when the target is less technologically related to the
acquirer and from their own technological capabilities when they are technological leaders. I find

76
that acquirers create the most value from combining the technological capabilities of the target
and the acquirer when the acquisition possesses characteristics suggesting a capability
diversification rationale and acquirers actually destroy value from combining the technological
capabilities of the target and the acquirer when the acquisition possesses characteristics
suggesting a capability upgrading rationale. I also provide evidence linking resource
recombination creation and acquirer value creation which Barney (1988) initially proposed.
Finally, and most importantly, I find that an acquirer must be technological capable for
shareholders to value the acquisition of external technology. If a firm is a technological laggard,
the market does not value it externally purchasing new capabilities.
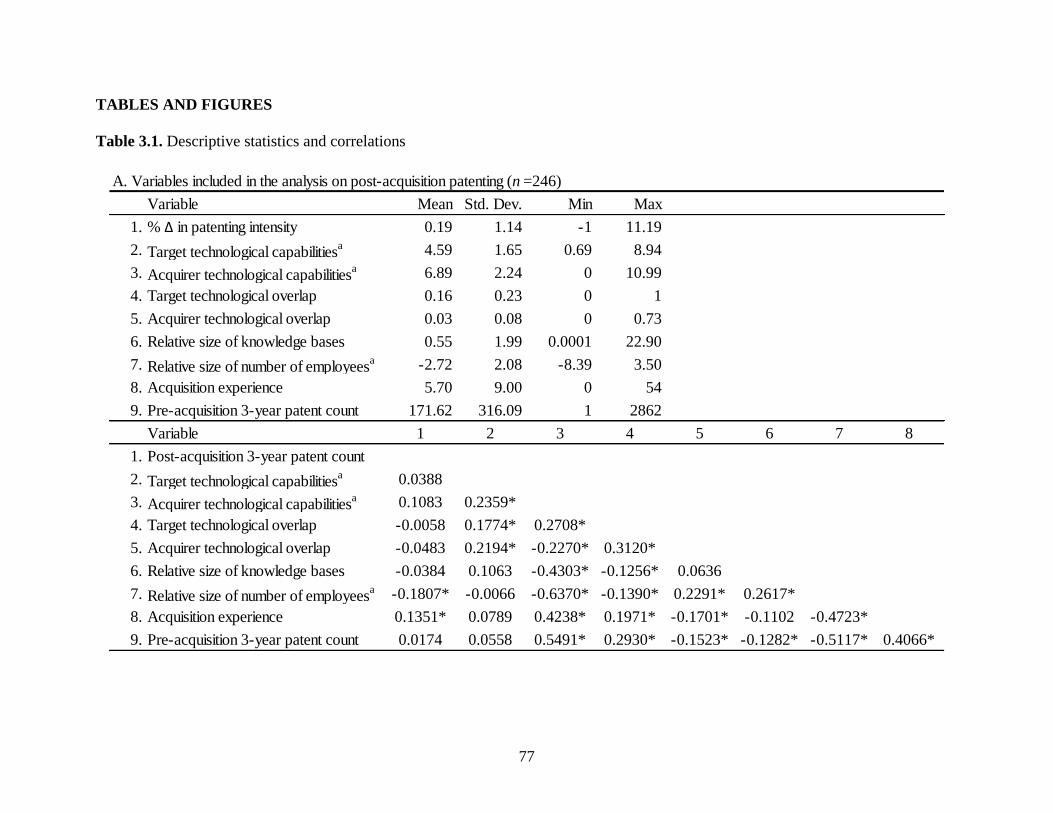
77
TABLES AND FIGURES
Table 3.1. Descriptive statistics and correlations
A. Variables included in the analysis on post-acquisition patenting (n =246)
Variable Mean Std. Dev. Min Max
1. % ∆ in patenting intensity 0.19 1.14 -1 11.19
2. Target technological capabilitiesa 4.59 1.65 0.69 8.94
3. Acquirer technological capabilitiesa 6.89 2.24 0 10.99
4. Target technological overlap 0.16 0.23 0 1
5. Acquirer technological overlap 0.03 0.08 0 0.73
6. Relative size of knowledge bases 0.55 1.99 0.0001 22.90
7. Relative size of number of employeesa -2.72 2.08 -8.39 3.50
8. Acquisition experience 5.70 9.00 0 54
9. Pre-acquisition 3-year patent count 171.62 316.09 1 2862
Variable 1 2 3 4 5 6 7 8
1. Post-acquisition 3-year patent count
2. Target technological capabilitiesa 0.0388
3. Acquirer technological capabilitiesa 0.1083 0.2359*
4. Target technological overlap -0.0058 0.1774* 0.2708*
5. Acquirer technological overlap -0.0483 0.2194* -0.2270* 0.3120*
6. Relative size of knowledge bases -0.0384 0.1063 -0.4303* -0.1256* 0.0636
7. Relative size of number of employeesa -0.1807* -0.0066 -0.6370* -0.1390* 0.2291* 0.2617*
8. Acquisition experience 0.1351* 0.0789 0.4238* 0.1971* -0.1701* -0.1102 -0.4723*
9. Pre-acquisition 3-year patent count 0.0174 0.0558 0.5491* 0.2930* -0.1523* -0.1282* -0.5117* 0.4066*

78
Table 3.1. Continued.
B. Variables included in the analysis on cumulative abnormal returns (n =97)
Variable Mean Std. Dev. Min Max
1. Cumulative abnormal returns -0.03 0.09 -0.34 0.23
2. Target technological capabilitiesa
4.92 1.65 0.69 8.94
3. Acquirer technological capabilitiesa
7.15 2.25 0 10.43
4. Target technological overlap 0.17 0.24 0 1
5. Acquirer technological overlap 0.04 0.08 0 0.40
6. Acquisition experience 5.70 8.87 0 53
7. Transaction value 5.11 8.06 0.50 56.58
8. Relative size of number of employeesa
-2.95 2.00 -7.32 0.95
9. Relative size of knowledge bases 0.58 2.40 0.00 22.90
10. % of stock 0.66 0.45 0 1
11. 4-firm concentration ration 0.41 0.10 0.31 0.95
12. Acquirer relative market share 0.06 0.09 0.0001 0.41
13. Pharma 0.37 0.49 0 1
Variable 1 2 3 4 5 6 7 8 9 10 11 12
1. Cumulative abnormal returns
2. Target technological capabilitiesa
0.0876
3. Acquirer technological capabilitiesa
0.0013 0.3330*
4. Target technological overlap 0.0163 0.1868 0.2336*
5. Acquirer technological overlap -0.049 0.1519 -0.3136* 0.2606*
6. Acquisition experience 0.1431 0.0623 0.3705* 0.1716 -0.2109*
7. Transaction value -0.1795 0.1088 0.0582 0.2982* 0.0562 0.2538*
8. Relative size of number of employeesa
-0.2985* -0.1017 -0.5944* -0.0633 0.3290* -0.4242* 0.0902
9. Relative size of knowledge bases 0.2351* 0.0969 -0.3977* -0.1077 0.067 -0.1013 -0.0627 0.2965*
10. % of stock -0.1997* 0.0314 -0.2179* -0.1328 0.1652 0.0679 0.1959 0.2450* 0.017
11. 4-firm concentration ration 0.1736 -0.2320* -0.0429 -0.0108 -0.1506 0.2283* -0.0249 -0.0207 -0.0805 -0.0641
12. Acquirer relative market share 0.1851 0.2410* 0.4694* 0.0502 -0.2460* 0.1796 -0.1176 -0.7250* -0.1226 -0.2011* -0.0873
13. Pharma -0.0838 0.0392 -0.1933 -0.0067 0.2198* -0.1941 0.0386 -0.03 -0.0322 -0.0037 -0.4322* 0.0205
* p<0.05a logarithm.

79
Table 3.2. OLS regression analysis of percentage change in patenting intensity
Target technological overlap
Leader/laggard
Dependent variable
Variables
Target technological capabilities 0.033 -0.213 * -0.163 0.182
(0.07) (0.12) (0.12) (0.24)
Acquirer technological capabilities -0.116 0.186 0.563 0.703 *
(0.11) (0.16) (0.44) (0.40)
Target technological overlap -0.348 5.371 0.572
(0.68) (6.34) (0.95)
Acquirer technological overlap -1.309 -134.444 -7.385 ***
(1.72) (153.64) (2.56)
Relative size (knowledge bases) -0.040 0.702 5.132 1.879
(0.04) (0.50) (4.95) (2.61)
Relative size (employees) -0.149 * -0.044 -0.074 0.080
(0.08) (0.16) (0.12) (0.15)
Acquisition experience -0.029 0.011 0.040 ** 0.005
(0.06) (0.06) (0.02) (0.01)
Pre-acquisition patenting -0.004 -0.005 -0.002 -0.001
(0.01) (0.01) (0.00) (0.00)
Industry dummies
Intercept -0.078 -0.619 -3.849 -6.657 *
(0.66) (0.89) (3.03) (3.69)
Observations 50 50 50 50
F-statistic 2.34 ** 3.59 *** 1.57 1.99 *
R-squared 0.34 0.25 0.29 0.25
Robust standard errors in parentheses
*** p<0.01, ** p<0.05, * p<0.1
low high low high
General RationalesStrategic
Renewal
Capability
Upgrading
Capability
Diversification
Capability
Deepening
Included
laggard laggard leader leader
% ∆ in patenting in 3-years pre- vs. post-acquisition
1 2 3 4
-
-
Included Included Included

80
Table 3.3. OLS regression analysis of acquirer cumulative abnormal returns
General RationalesStrategic
Renewal
Capability
Upgrading
Capability
Diversification
Capability
Deepening
Target technological overlap low high low high
Acquirer leader/laggard laggard laggard leader leader
Dependent variable = CAR Model 7 Model 8 Model 9 Model 10
Target technological capabilities 0.0184 -0.0031 0.0060 -0.0257*
(0.0139) (0.0386) (0.0053) (0.0128)
Acquirer technological capabilities -0.0040 -0.0291 0.0237** 0.0196
(0.0160) (0.0274) (0.0098) (0.0271)
Target technological overlap 1.3322 0.0745 0.2667 -0.0457
(0.9926) (0.1472) (0.4438) (0.0474)
Acquirer technological overlap 0.9410 0.0567 -25.1351* 2.3689**
(0.9652) (0.4537) (13.6634) (0.8237)
Acquisition experience -0.0112 0.0038 0.0040** 0.0018**
(0.0079) (0.0338) (0.0014) (0.0008)
Transaction value -0.0085** -0.0002 0.0046** -0.0017**
(0.0033) (0.0037) (0.0016) (0.0007)
Relative size of number of employees -0.0602*** -0.0239 0.0075 -0.0478**
(0.0175) (0.0411) (0.0085) (0.0177)
Relative size of knowledge bases 0.0172** -0.0080 0.9792* 0.1315
(0.0062) (0.1010) (0.5367) (0.2457)
% of stock -0.0605 0.0264 -0.0174 -0.0052
(0.0499) (0.1415) (0.0228) (0.0223)
4-firm concentration ration 0.4384** 0.0400 0.4871*** -0.6034**
(0.1730) (0.3094) (0.1543) (0.2136)
Acquirer relative market share 0.4420 0.8892 -0.0287 -0.2096
(0.5846) (1.3089) (0.1589) (0.1312)
Pharma 0.0726 -0.0302 0.0347 -0.1141***
(0.0406) (0.0812) (0.0289) (0.0284)
Intercept -0.3735** 0.0471 -0.4783*** 0.0081
(0.1421) (0.2666) (0.1306) (0.1544)
Observations 24 24 24 25
F-statistic 28.17*** 2.06 3.00** 25.44***
R-squared 0.84 0.31 0.56 0.74
Robust standard errors in parentheses
*** p<0.01, ** p<0.05, * p<0.1

81
Table 3.4. Test for differences in mean value created from the technological capabilities and in cumulative abnormal returnsa
A. Target capabilities’ impact on % ∆ in patenting intensity B. Acquirer capabilities’ impact on % ∆ in patenting intensity
C. Mean value created from target capabilities D. Mean value created from acquirer capabilities
Low
Overlap
High
Overlap
Technology
Laggard
Technology
Leader
Low
Overlap
High
Overlap
Technology
Laggard
Technology
Leader
0.074*** -0.017***
0.027*** -0.146***
-0.019***
0.184***
-0.175***
0.199***
Low
Overlap
High
Overlap
Technology
Laggard
Technology
Leader
Low
Overlap
High
Overlap
Technology
Laggard
Technology
Leader
0.033 - 0.213*
- 0.163 0.182
- 0.116
0.703*
0.186
0.563
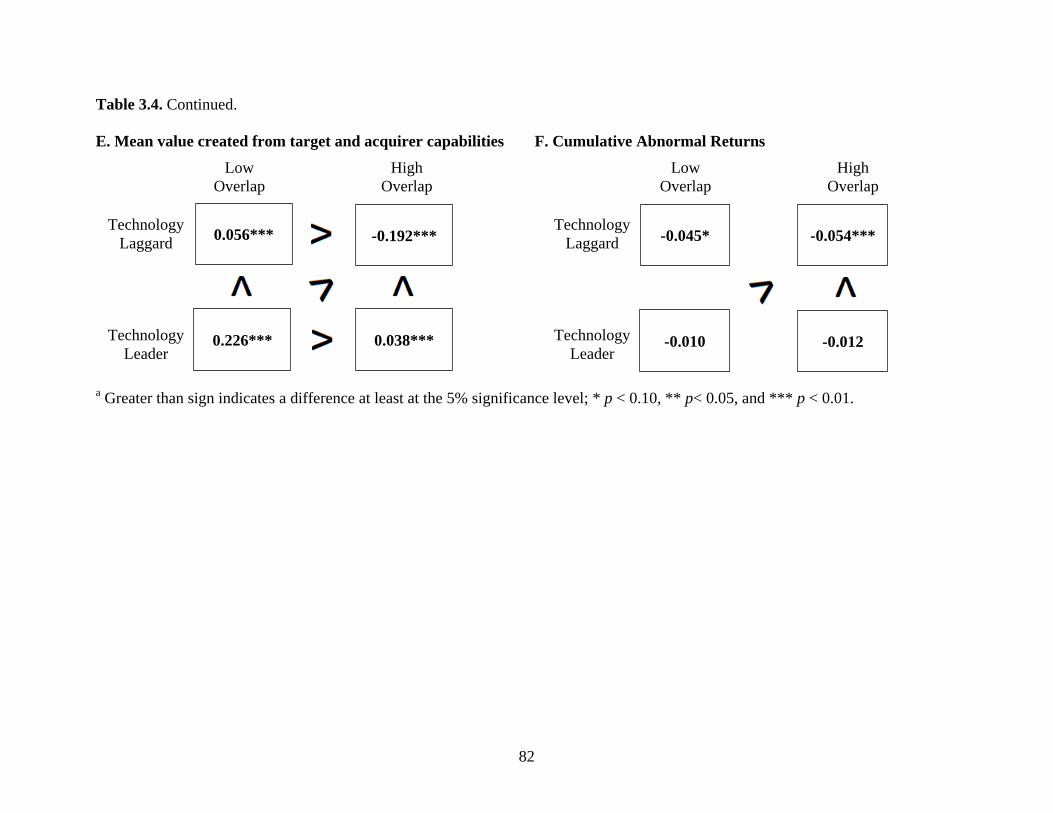
82
Table 3.4. Continued.
E. Mean value created from target and acquirer capabilities F. Cumulative Abnormal Returns
a Greater than sign indicates a difference at least at the 5% significance level; * p < 0.10, ** p< 0.05, and *** p < 0.01.
Low
Overlap
High
Overlap
Technology
Laggard
Technology
Leader
Low
Overlap
High
Overlap
Technology
Laggard
Technology
Leader
0.056***
0.226*** 0.038***
-0.192*** -0.045*
-0.010 -0.012
-0.054***

83
Table 3.5. Summary of hypotheses and results.
Hypotheses Results
Hypothesis 1a: Given that the acquiring firm is a technological laggard, the target firm’s technological
capabilities will possess a greater impact on the percentage change in post-acquisition patenting intensity
when there is less technological overlap.
Supported
Hypothesis 1b: Given that the acquiring firm is a technological leader, the target firm’s technological
capabilities will possess a greater impact on the percentage change in post-acquisition patenting intensity
when there is less technological overlap.
Not supported
Hypothesis 1c: Given that the acquiring firm is a technological laggard, the acquiring firm’s technological
capabilities will possess a greater impact on the percentage change in post-acquisition patenting intensity
when there is less technological overlap.
Not supported
Hypothesis 1d: Given that the acquiring firm is a technological leader, the acquiring firm’s technological
capabilities will possess a greater impact on the percentage change in post-acquisition patenting intensity
when there is less technological overlap.
Not supported
Hypothesis 2a: Given low technological overlap, the target firm’s technological capabilities will possess a
greater impact on the percentage change in post-acquisition patenting intensity when the acquiring firm is a
technological leader rather than a laggard.
Not supported

84
Table 3.5. Continued.
Hypothesis 2b: Given high technological overlap, the target firm’s technological capabilities will possess a
greater impact on the percentage change in post-acquisition patenting intensity when the acquiring firm is
a technological leader rather than a laggard.
Supported
Hypothesis 2c: Given low technological overlap, the acquiring firm’s technological capabilities will
possess a greater impact on the percentage change in post-acquisition patenting intensity when the
acquiring firm is a technological leader rather than a laggard.
Supported
Hypothesis 2d: Given high technological overlap, the acquiring firm’s technological capabilities will
possess a greater impact on the percentage change in post-acquisition patenting intensity when the
acquiring firm is a technological leader rather than a laggard.
Not supported
Hypothesis 3a: Given that the acquiring firm is a technological laggard, the target firm’s technological
capabilities will create more shareholder value for the acquiring firm on average when there is less
technological overlap.
Supported
Hypothesis 3b: Given that the acquiring firm is a technological leader, the target firm’s technological
capabilities will create more shareholder value for the acquiring firm on average when there is less
technological overlap.
Supported
Hypothesis 3c: Given that the acquiring firm is a technological laggard, the acquiring firm’s technological
capabilities will create more shareholder value for the acquiring firm on average when there is less
technological overlap.
Supported

85
Table 3.5. Continued.
Hypothesis 3d: Given that the acquiring firm is a technological leader, the acquiring firm’s technological
capabilities will create more shareholder value for the acquiring firm on average when there is less
technological overlap.
Supported
Hypothesis 4a: Given low technological overlap, the target firm’s technological capabilities will create
more shareholder value for the acquiring firm on average when the acquiring firm is a technological leader
rather than a laggard.
Not supported
Hypothesis 4b: Given high technological overlap, the target firm’s technological capabilities will create
more shareholder value for the acquiring firm on average when the acquiring firm is a technological leader
rather than a laggard.
Not supported
Hypothesis 4c: Given low technological overlap, the acquiring firm’s technological capabilities will create
more shareholder value for the acquiring firm on average when the acquiring firm is a technological leader
rather than a laggard.
Supported
Hypothesis 4d: Given high technological overlap, the acquiring firm’s technological capabilities will
create more shareholder value for the acquiring firm on average when the acquiring firm is a technological
leader rather than a laggard.
Supported
Hypothesis 5a: Acquisitions characterized by simultaneous low technological overlap and the acquirer
being a technological leader will create the most amount of value when summing the value created from
both the target firm’s technological capabilities and the acquiring firm’s technological capabilities.
Supported

86
Table 3.5. Continued.
Hypothesis 5b: Acquisitions characterized by simultaneous low technological overlap and the acquirer
being a technological leader will create the greatest amount of overall value appropriated by the acquiring
firm.
Partial support
Hypothesis 6a: Acquisitions characterized by simultaneous high technological overlap and the acquirer
being a technological laggard will create the least amount of value when summing the value created from
both the target firm’s technological capabilities and the acquiring firm’s technological capabilities.
Supported
Hypothesis 6b: Acquisitions characterized by simultaneous high technological overlap and the acquirer
being a technological laggard will create the least amount of overall value appropriated by the acquiring
firm.
Partial support

87
Figure 3.1. Rationales for technological acquisitions
Technology
Laggard
Technology
Leader
Strategic
Renewal
Capability
Upgrading
Capability
Diversification
Capability
Deepening
Low
Overlap
High
Overlap
Technological Overlap
Acq
uir
er‘s
Tec
hnolo
gic
al C
apab
ilit
ies

88
Figure 3.2. Theoretical model
Creation of novel
resource recombinations
post-acquisition
Acquirer stock market
reaction to acquisition
announcement
―
+
+
Overlap of technological
knowledge between the
target and the acquirer
Technological capabilities
of the acquirer
+ Technological capabilities
of the target and the
acquirer

89
CHAPTER 4
ESSAY 3: TECHNOLOGICAL ACQUISITIONS, DISTANCE, AND TIME ELAPSED
UNTIL THE INITIAL POST-ACQUISITION INNOVATION
INTRODUCTION
In innovative industries, technological change is both rapid and frequent (Sarkar et al., 2006).
With internal R&D focusing on incremental innovations (Knott and Posen, 2009; Sorensen and
Stuart, 2000; Tushman and Anderson, 1986) and corporate strategies focusing on specialization
and the outsourcing of non-core activities (Mayer et al., Forthcoming), firms find themselves in
competency traps (Levinthal and March, 1993). Further, evidence suggests that much of the truly
novel innovations originate in startups (Abernathy and Utterback, 1978; Pavitt et al., 1987). As a
result, technological acquisitions have become a popular complement to internal innovation,
therefore, allowing firms to overcome the time compression diseconomies of undertaking ‘crash’
R&D programs by internalizing existing stocks of know-how (Dierickx and Cool, 1989). In this
paper, I address the effects that geographic distance, technological overlap, and whether the
acquiring firm and the target firm domicile in different countries have on the amount of time it
takes the post-acquisition firm to innovate utilizing the target firm’s pre-acquisition
technological knowledge.
While a significant amount of research has investigated the independent effects that
technological overlap (e.g., Mowery et al., 1996, 1998; Szulanski, 1996), geographic distance
(e.g., Jaffe et al., 1993; Mowery and Ziedonis, 2001; Rosenkopf and Almeida, 2003), and
crossing national borders (e.g., Bresman, Birkinshaw, and Nobel, 1999; Teece, 1977) have on
knowledge transfer, little has been done on their interactive effects, and even fewer studies have
been conducted on their interactive effects in the context of acquisitions (cf. Phene, Tallman, and
90
Almeida, 2010). I make two main advancements in this stream of research. First, I investigate the
independent and interactive effects that technological overlap, geographic distance, and cross-
border acquisitions have on the amount of time it takes the acquiring firm to utilize the target
firm’s pre-acquisition technological knowledge in post-acquisition innovation. Second, I show
that whether these factors facilitate or impede the acquiring firm’s ability to the overcome time
compression diseconomies of internal innovation through acquisition depends on how the
acquiring firm utilizes the target firm’s technological capabilities.
Acquisitions differ in the post-acquisition utilization of the target firm’s resources and
capabilities (Karim, 2006; Puranam and Srikanth, 2007; Sears, 2011). Some post-acquisition
innovations integrate the knowledge of the target firm with that of the acquiring firm in building
new knowledge for which I term ‘integrative innovation’ (Almeida, Song, and Grant, 2002).
Other post-acquisition innovations do not integrate and thus maintain innovative autonomy in the
target firm for which I term ‘independent innovation’ (Puranam et al., 2009)7.
I submit that technological overlap, geographic distance, and cross-border acquisitions
affect the amount of time that elapses until the first post-acquisition integrative innovation and
the first post-acquisition independent innovation differently. While technological overlap
facilitates communication which benefits integrative innovation, communication facilitation can
actually impede independent innovation when the acquiring firm excessively intervenes into the
target firm’s innovative activities. Similarly, geographic distance and cross-border acquisitions
create communication problems for integrative innovation while they create a buffer between the
acquiring firm and the target firm that maintains target autonomy, therefore, minimizing target
7 In independent innovations, the target firm’s knowledge may or may not be combined with the
acquiring firm’s knowledge later on in the product development process. For example, an
independent innovation’ could be combined with the acquiring firm’s knowledge in commercial
products or in higher order knowledge through modular design.

91
firm disruption. Further, I argue that technological overlap can attenuate the impediments to
communication that geographic distance and cross-border acquisitions create in integrative
innovation and also attenuate the benefits that geographic distance and cross-border acquisitions
create by maintaining target firm autonomy for independent innovation.
I find that crossing national borders has a greater impact compared to geographic distance
on the time elapsed until the initial post-acquisition innovation in both integrative innovation and
independent innovation8. While I find that cross-border acquisitions take a longer amount of time
to create an integrative innovation compared to domestic acquisitions, technological overlap
attenuates the negative effect of crossing national borders. On the other hand, I find that cross-
border acquisitions take a shorter amount of time to create the first independent innovation
compared to domestic acquisitions. I also find evidence that technological overlap impedes
independent innovation while I find no evidence that technological overlap significantly interacts
with either geographic distance or cross-border acquisitions with independent innovation.
The paper makes the following contributions. First, I integrate the effects that geographic
distance, cross-border acquisitions, and technological overlap have on intra-firm knowledge
flows. While each of these have received extensive attention in prior research, there has been
little research that integrates these effects in the same study and even fewer, if any, that have
focused on their interactive effects within acquisitions. Second, I show that whether and how
technological overlap, geographic distance, and cross-border acquisitions affect the time it takes
to post-acquisition innovation utilizing the target firm’s pre-acquisition knowledge depends on
the type of innovation, integrative or independent. Third, I show that acquisitions do not suffer
the same intensity of frictions in knowledge flows that market mechanisms and spillovers incur
8 All empirical analyses control for the technological capabilities of both the target and acquiring
firms and for pre-acquisition innovations utilizing the target firm’s knowledge.

92
from geographic distance. Rather, knowledge flows are impeded by the knowledge residing in
different national contexts. I further show that technological overlap can provide a commonality
in the sources of knowledge that can attenuate these difficulties. Fourth, the study provides
implications for target firm selection. When considering whether to acquire a specific target firm,
this study shows that the acquiring firm should jointly consider where the target firm is
geographically located and how related the target firm’s technological knowledge is to its own.
Lastly, the study emphasizes that management must understand how they plan on utilizing the
target firm’s knowledge prior to the acquisition to properly consider the implications of
geographic and technological distance on post-acquisition innovation.
THEORY AND HYPOTHESES
While technological acquisitions occur in order for the acquiring firm to benefit from the
technological knowledge or capabilities of the target firm, not all technological acquisitions
utilize the knowledge of the target in the same manner. In this paper I differentiate between two
methods of target knowledge utilization for post-acquisition innovation: integrative innovation
and independent innovation. Integrative innovations integrate the knowledge of the target firm
with that of the acquiring firm in building new knowledge during the post-acquisition innovation
process (Almeida et al., 2002). Independent innovations do not integrate the knowledge and thus
maintain innovative autonomy in the target firm (Puranam et al., 2009).
While the two types of innovation are distinct, acquisitions are not limited to choosing
one or the other. For example from Puranam (2001: 141), Mario Mazzola, Chief Development
Officer at Cisco, stated, ‘We do not think it is necessary for the R&D team(s) to be together.
Actually we would encourage them to continue development independently, but co-operate and
communicate with our R&D/manufacturing people.’ Since many acquiring firms will seek to
93
develop both integrative innovations and independent innovations, it is important to understand
the differential effects that technological overlap and the physical location of the target firm have
on integrative innovation and independent innovation.
In this section, I build hypotheses regarding the independent and interactive effects that
technological overlap, geographic distance, and cross-border acquisitions have on the time it
takes the post-acquisition firm to utilize the target firm’s pre-acquisition knowledge in post-
acquisition innovations. First, I hypothesize about their effects on integrative innovation. Then, I
hypothesize about their effects on independent innovation.
Integrative Innovation
There has been a plethora of research that has shown that knowledge flows dissipate with
geographic distance (e.g., Cameron, 1996; Jaffe et al., 1993). Empirical findings even suggest
that geographic distance disadvantages knowledge transfer when firms use market mechanisms,
such as licensing, (Mowery and Ziedonis, 2001) or alliances (Rosenkopf and Almeida, 2003). I
submit that the difficulties in knowledge transfer attributed to geographic distance in licensing
and alliances also negatively affect acquisitions.
Acquisitions that integrate the knowledge of the target firm and the acquiring firm rely
heavily on knowledge exchange. First, the need to integrate the target firm’s knowledge with the
acquiring firm’s knowledge calls for reciprocal interdependence (Thompson, 1967) or mutual
adjustment (Tushman and Nadler, 1978) which requires greater coordination (Galbraith, 1973,
1977). Second, the dynamic environment of innovative industries creates greater uncertainty
which requires even greater levels of communication (Tushman and Nadler, 1978). With the
enhanced need for knowledge exchange, the acquiring firm must consider the factors facilitating
or impeding communication.

94
While recent technological advancements in electronic communication have eased distant
communication, knowledge integration still requires frequent face-to-face interaction (Bresman
et al., 1999). Almeida, Phene, and Grant (2003) captured the importance of face-to-face meetings
in their interviews with National Semiconductor and Siemens where they found that electronic
mail must be supplemented with on-site visits. Bresman et al. (1999) also found that enhanced
communication and increased frequency in visits and meetings increased knowledge transfer.
Further, Porter (1990) noted that geographic proximity enables more frequent face-to-face
meetings that help build trust which Graebner (2009) found crucial for the success of an
acquisition of a technological firm.
In line with this logic, geographically proximate interactions increase the acquiring firm’s
ability to integrate the target firm’s knowledge with its own (Puranam and Srikanth, 2007). With
increases in geographic distance, the post-acquisition firm encounters difficulties coordinating
through mutual adjustment. The further the distance between the target firm and the acquiring
firm, the more difficult it will be for the acquiring firm to conduct frequent on-site visits. These
communication and coordination difficulties are further enhanced due to differences in time
zones. The culminating difficulties in attaining mutual adjustment between the target firm and
the acquiring firm lead to the following hypothesis:
Hypothesis 1. The amount of time that elapses until the initial post-acquisition integrative
innovation increases with increases in geographic distance.
Beyond geographic distance, a post-acquisition firm encounters difficulties in integrative
innovation when the two firms domicile in different countries. Cross-border acquisitions
encounter additional impediments to knowledge transfer beyond mere geographic distance
95
(Björkman, Stahl, and Vaara, 2007; Child, Faulkner, and Pitkethly, 2001; Sears, Aguilera, and
Dencker, 2012). When considering cross-border acquisitions, we must recognize the different
environmental contexts for which the knowledge resides (Lam, 2006; Phene, Fladmoe-Lindquist,
and Marsh, 2006; Williams, 2007). Williams (2007: 869) stated that, ‘context dependence arises
because knowledge integrates components of knowledge—such as people, personal networks, or
information—which vary between settings.’ Further, Argote and Ingram (2000) noted that
compatibility between the components of knowledge is necessary for effective knowledge
transfer.
While Saxenian (1994) found that work practices, culture, and technical terminology are
unique to particular regions, the national systems of innovation literature stresses that countries
possess their own unique characteristics (Freeman, 1995; Kneller, 2003). Bartholomew (1997)
explained that the impediments to cross-border knowledge transfer are due to the embeddedness
of knowledge transfer mechanisms in national contexts while Lane, Salk, and Lyles (2001)
argued that cultural compatibility is a necessary condition for intra-firm knowledge absorption.
Further, Lam (2006) proposed that there are taken-for-granted assumptions and common rules
specific to countries that facilitate knowledge transfer that can also impede knowledge transfer
when crossing borders that do not share these taken-for-granted assumptions and common rules.
Combing the difficulties of geographic distance with the additional difficulties of
knowledge residing in different national contexts, cross-border acquisitions encounter great
obstacles to integrating the knowledge of the target firm with that of the acquiring firm. This
leads to the following hypothesis:
96
Hypothesis 2. The amount of time that elapses until the initial post-acquisition integrative
innovation increases with the acquisition being a cross-border acquisition rather than a
domestic acquisition.
Contrary to the effects of geographic distance and cross-border acquisitions,
technological overlap facilitates knowledge exchange. Common knowledge between the
acquiring firm and the target firm is a prerequisite for communication (Demsetz, 1988; Grant,
1996b) and intra-firm knowledge absorption (Lane et al., 2001). At a minimum, a common
language is necessary for communication (Grant, 1996a, 1996b).
Technological overlap provides common vocabulary, conceptual knowledge, and
experience between the knowledge workers of the target firm and the acquiring firm which drive
efficient communication (Grant, 1996a). In the absence of technological overlap, Szulanski
(1996) found intra-organizational knowledge transfer exceedingly hindered. In their studies on
alliances, Mowery et al. (1996, 1998) found that greater technological overlap facilitated inter-
firm knowledge transfer. Beyond knowledge transfer, knowledge similarities increase inter-firm
learning (Lane and Lubatkin, 1998), and lead to greater intra-firm intangible resource sharing
(Tsai, 2000).
Technological overlap also creates an ability to merge the innovative routines of the
target firm and the acquiring firm through efficient communication. In order to merge routines in
integrative innovation, the firms must possess the “ability to receive and interpret a stream of
incoming messages from other members and from the environment" (Nelson and Winter, 1982:
100). Grant (1996a) noted that this level of communication is necessary to reach routines of
mutual adjustment that enable knowledge integration. Technological overlap should then

97
enhance the acquiring firm’s ability to expeditiously create integrative innovations. This leads to
the following hypothesis:
Hypothesis 3. The amount of time that elapses until the initial post-acquisition integrative
innovation decreases with increases in technological overlap.
While geographic distance and cross-border acquisitions hinder a firm’s ability
expeditiously create integrative innovations, technological overlap attenuates the communication
and coordination difficulties that arise from great geographic distance through the creation of
rich communication channels (Gupta and Govindarajan, 2000). Technological overlap creates a
common technological language that facilitates distant communication (Puranam et al., 2009).
Puranam et al. (2009: 317) explain the advantages of ‘common ground’,
‘…if the common ground between interdependent individuals contains significant levels
of shared knowledge about how the interdependent technological subsystems work, then
the need for formal coordination mechanisms such as those associated with structural
integration should decrease. Such common ground could exist, for instance, when the
engineers have been working in the same technological domains prior to the acquisition.’
Consistent with this argument, Tallman and Phene (2007) found that technological similarities
have a greater impact on facilitating international knowledge flows compared to mere inter-
cluster knowledge flows.
Not only does technological overlap create rich communication channels by providing a
common technical language, but it also means that the knowledge workers of the two firms share
common experiences and behavioral norms that facilitate knowledge exchange (Grant, 1996a).
That is, when geographic distance prohibits frequent on-site visits that will allow the knowledge
workers to physically demonstrate how the knowledge can be integrated, common experiences
and behavioral norms eases the need to physically demonstrate the procedures for knowledge

98
integration. In support of this argument, Almeida et al. (2003) find that shared behavioral norms
facilitate cross-border knowledge transfer.
The target firm needs to be either technologically or geographically proximate to allow
for successful integration. Phene et al. (2006) find that technologically dissimilar external
knowledge possesses a greater probability of contributing to break through innovations when it
resides in the same national context as the recipient firm while international knowledge
possesses a greater probability of leading to break through innovations when the knowledge is
more technologically similar. If the knowledge is neither technologically nor geographically
proximate, then the knowledge does not significantly impact the probability of creating break
through innovations (Phene et al., 2006). With respect to the findings of Phene et al. (2006), I
submit that for sufficient communication to exist to not only create breakthrough innovations but
also expeditiously innovate either geographic proximity or technological proximity must exist.
This leads to the following hypotheses:
Hypothesis 4. Increases in technological overlap weaken the positive relationship
between geographic distance and the amount of time that elapses until the initial post-
acquisition integrative innovation.
Hypothesis 5. Increases in technological overlap weaken the positive relationship
between cross-border acquisitions and the amount of time that elapses until the initial
post-acquisition integrative innovation.
Independent Innovation
With independent innovation, the target firm continues its innovative activities independent of
the acquiring firm’s innovative activities. The acquiring firm then integrates the target firm’s

99
knowledge at the product level or at a higher integrative level of knowledge building. On the
other hand, the acquiring firm may not integrate the target firm’s knowledge at all. Since
knowledge integration does not take place, the acquiring firm should focus on minimizing the
interruptions in the innovative activities of the target firm by maintaining its autonomy.
The same forces that impede integrative innovation, geographic distance and cross-border
acquisition, help preserve the autonomy of the target firm which facilitates efficient independent
innovation. On the other hand, technological overlap which facilitates integrative innovation now
decreases the ability of the target firm to remain operationally autonomous, therefore, impeding
independent innovation.
The problem of maintaining target autonomy arises from the acquiring firm’s need to
possess a non-trivial amount of control over the innovative activities of the target firm.
Transaction costs economics explains technological acquisitions as a phenomenon of asset
specificity with respect to the innovative activities of the target firm (Williamson, 1985). By
taking the assumption that control rights drive the transaction out of the market into corporate
control, we must expect the acquiring firm will selectively intervene in the innovative activities
of the target. Selection intervention occurs when management exercises forbearance when
intervention provides no net gain but exercises fiat when intervention provides net gains
(Williamson, 1985). The acquiring firm’s management will have incentives to intervene in the
operations of the target firm if the acquiring firm’s management believes it possesses superior
knowledge since the management’s performance (hence incentives) are linked to the innovative
outcomes of the target firm.
While mechanisms may be undertaken to alleviate excessive intervention (Foss, Foss,
and Vázquez, 2006), much research maintains that selective intervention is not possible (e.g.,

100
Foss, 2003; Graebner, 2009; Williamson, 1988). The enhanced problems of selective
intervention arise from the acquiring firm believing it possesses superior knowledge or decision
making capabilities regarding the target firm’s operations. Foss (2003: 342) noted the following
about managers’ tendencies to excessively intervene,
‘…robust findings in experimental psychology show the presence of a systematic
overconfidence bias in judgment; that is, people tend to trust their own judgments more
than is “objectively” warranted. Managers are not exceptions to this bias, perhaps quite
the contrary. The presence of the overconfidence bias in the judgments that underlie
managerial decision making is likely to aggravate the problem of selective intervention,
because it produces additional meddling in subordinates’ decisions.’
While geographic proximity facilitates interaction and communication, geographic
distance provides the autonomy that the target firm needs to maintain its pre-acquisition
innovative productivity. Evidence shows that workers interact less when there is greater
geographic distance between them (Allen, 1977). The inability for frequent on-site visits and the
limitations of technological communications (Almeida et al., 2003) create a gap in the
knowledge that the acquiring firm management possesses regarding the innovative activities of
the target firm. As Foss (2003) added that ignorance reduces the probability of selective
intervention, we should expect the increased gap in knowledge between the target firm and the
acquiring firm arising from geographic distance (Almeida et al., 2003) will decrease the
probability of selective intervention.
With fewer interactions, there will be fewer opportunities for the acquiring firm to
intervene in the target firm’s innovative activities. Further, with the innovative activities under
the control of the target firm, the target firm will not only better utilize its pre-acquisition
knowledge but also be better able to create new knowledge (Miles et al., 1997). Therefore,

101
greater geographic distance should advantage the acquiring firm in creating independent
innovations. This leads to the following hypothesis:
Hypothesis 6. The amount of time that elapses until the initial post-acquisition
independent innovation decreases with increases in geographic distance.
The greater the distance in information, the more likely the manager is not going to
intervene (Foss et al., 2006). Beyond mere geographic distance, cross-border acquisitions create
enhanced obstacles to selective intervention. With knowledge residing in different national
contexts (Bartholomew, 1997; Lane et al., 2001; Williams, 2007), there will be greater
knowledge asymmetries between the target firm and the acquiring firm. Therefore, the acquiring
firm’s management is less likely to perceive that it possesses superior knowledge compared to
that of the target firm. Further, with the additional costs of international knowledge transfer
(Teece, 1977), acquiring firms are likely to delegate the decision rights to the target firm in
independent innovations (Nickerson and Zenger, 2004). Rugman and Verbeke (2003) noted that
the excessive cross-border communication costs deter excessive intervention. Therefore, cross-
border acquisitions should advantage the acquiring firm in creating independent innovations by
maintaining target firm autonomy. This leads to the following hypothesis:
Hypothesis 7. The amount of time that elapses until the initial post-acquisition
independent innovation decreases with the acquisition being a cross-border acquisition
rather than a domestic acquisition.
While technological overlap facilitates knowledge transfer which benefits integrative
innovation, technological overlap also leads to the acquiring firm meddling in the target firm’s

102
operations which impedes independent innovation. Hansen (1999) argued that increases in
connectedness threatens the autonomy of the target firm through enhanced ‘red tape’. Similarly,
Weick (1976) submitted that organizational units that are not tightly linked face less interference
and disruption from constraints imposed by organizational systems.
Foss et al. (2006) emphasized that the optimal level of decision delegation (autonomy) to
the target firm occurs when the incremental benefits of the knowledge specialization of the target
firm equals the incremental costs of loss of control for the acquiring firm. Technological overlap
can negatively affect the acquiring firm’s perception of the optimal level of decision delegation
(autonomy) given to the target firm. First, technological overlap decreases the perceived benefit
of the specialized (non-overlapping) technological knowledge of the target firm. Second,
technological overlap increases the perceived costs of the loss of control as the acquiring firm
will have a heightened sense that it possesses superior knowledge to that of the target firm.
While management may believe that they can maintain autonomy in the target firm,
technological overlap increases the possibility of the acquiring firm intervening when the optimal
decision delegate the decision rights to the target firm.
Therefore, greater technological overlap should disadvantage the acquiring firm in
expeditiously creating independent innovations. This leads to the following hypothesis.
Hypothesis 8. The amount of time that elapses until the initial post-acquisition
independent innovation increases with increases in technological overlap.
While geographic distance and cross-border acquisitions decrease the probability of
excessive intervention, I now argue that technological overlap attenuates the benefits of
autonomy that accompanies geographic distance and cross-border acquisitions. The argument put

103
forth above with regard to technological overlap facilitating knowledge integration now supports
the increased likelihood of the acquiring firm selectively intervening. The common vocabulary,
conceptual knowledge, and experience held between the target firm and the acquiring firm which
drive efficient communication also reduce target firm autonomy (Grant, 1996a). Similarly, the
‘common ground’ (Puranam et al., 2009) arising from greater technological overlap which
facilitates distant knowledge integration will increase the probability that the acquiring firm
management will believe that they possess superior knowledge leading to selective intervention
(Foss, 2003). Further, the ease in communication should reduce the costs of selective
intervention. In summary, holding geographic distance constant, increases in technological
overlap will reduce the costs and hurdles of knowledge transfer, therefore, reducing the
incentives for the acquiring firm to not selectively intervene. This leads to the final of
hypotheses:
Hypothesis 9. Increases in technological overlap weaken the negative relationship
between geographic distance and the amount of time that elapses until the initial post-
acquisition independent innovation.
Hypothesis 10. Increases in technological overlap weaken the negative relationship
between cross-border acquisitions and the amount of time that elapses until the initial
post-acquisition independent innovation.
METHODS
Data and Sample
The sample consists of technological acquisitions obtained from SDC Platinum’s Mergers &
Acquisitions database that occurred between 1994 and 2004. The year 1994 is the first year that

104
an acquisition appears in the SDC database after implementing all constraints while I chose 2004
as the end date to allow for the construction of the variables using patents. The acquisitions were
initially identified as technological acquisitions if both the acquiring firm and target firm were
classified as ‘high tech’ firms in SDC Platinum’s M&A database.
I further took the following steps to create the sample. I limited the sample to firms listed
as manufacturing firms by SIC codes 20-39 to allow for comparisons with previous
technological acquisition research (Puranam et al., 2009; Puranam et al., 2006; Puranam and
Srikanth, 2007). I limited the acquisitions to those where the target firm had less than 500
employees at the time of the acquisition. This criterion is both consistent with the U.S. Small
Business Administration definition of a small business and with prior studies on technological
acquisitions (Granstrand and Sjolander, 1990; Puranam et al., 2009; Puranam et al., 2006;
Puranam and Srikanth, 2007). This also allowed me to be more confident that market power and
cost synergies did not motivate the acquisition. To ensure that all of the acquisitions were
technological in nature, I searched news articles and newswires using LexisNexis and eliminated
acquisitions that were not technological in nature (Ahuja and Katila, 2001). I also eliminated all
acquisitions where the target firm did not possess any patents to allow for the variable
construction. The final sample for the patenting intensity analysis consists of 246 acquisitions
with 185 distinct acquiring firms.
Dependent Variables
I constructed two dependent variables that measure the amount of time elapsed until the first
post-acquisition integrative innovation and the amount of time elapsed until the first post-
acquisition independent innovation. The acquisitions in the sample fall into one of four types: 1)
does not patent using pre-acquisition knowledge of the target firm (94 acquisitions), 2) only

105
patents using pre-acquisition knowledge of the target firm that is not integrated with the
acquiring firm’s pre-acquisition knowledge (only independent innovations; 75 acquisitions), 3)
only patents using pre-acquisition knowledge that is integrated with pre-acquisition knowledge
of the acquiring firm (only integrative innovations; 10 acquisitions), and 4) patents both
independent innovations and integrative innovations (68 acquisitions).
The variable integrative innovation measures the amount of time that passed post-
acquisition until the post-acquisition firm filed an eventually granted patent that cites both a pre-
acquisition target firm patent and a pre-acquisition acquiring firm patent. I used the ‘effective
date’ given by SDC as the date that the acquisition is finalized and, therefore, day zero in the
count until the first integrative innovation. I used a seven-year pre-acquisition window for the
target firm and acquiring firm patents that are to be recombined post-acquisition since Jaffe et al.
(1993) found that citations dramatically decrease seven years after the application date.
Therefore, I am more confident that I captured most relevant pre-acquisition technology of the
target firm and the acquiring firm. If the post-acquisition firm did not file a granted patent by
December 31, 2009, the acquisition was right-censored.
The variable independent innovation measures the amount of time that passed post-
acquisition until the post-acquisition firm filed an eventually granted patent that cites a pre-
acquisition target firm patent but does not cite a pre-acquisition acquiring firm patent. I
constructed this measure in line with the construction of integrative innovation.
Independent Variables
I created the variable, geographic distance, which measures the distance in miles between the
acquiring firm and the target firm. For the location of the firms, I obtained the zip codes from
SDC’s M&A database. I reviewed articles pertaining to the acquisitions from LexisNexis to
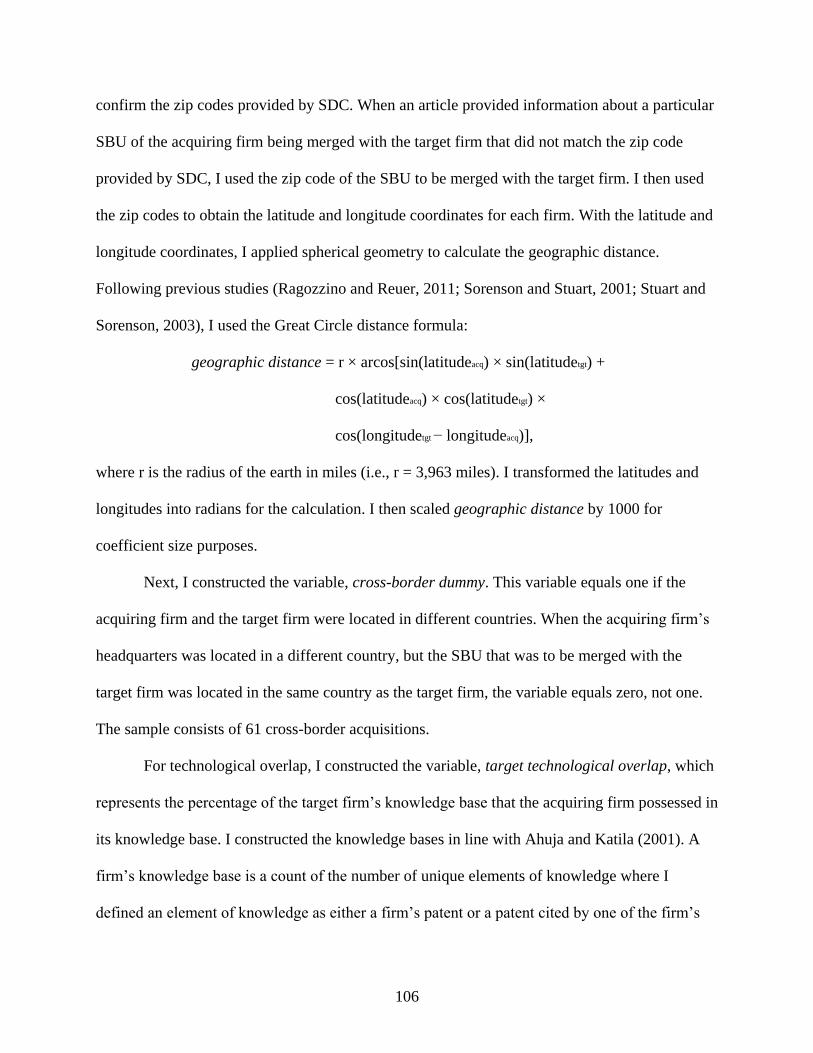
106
confirm the zip codes provided by SDC. When an article provided information about a particular
SBU of the acquiring firm being merged with the target firm that did not match the zip code
provided by SDC, I used the zip code of the SBU to be merged with the target firm. I then used
the zip codes to obtain the latitude and longitude coordinates for each firm. With the latitude and
longitude coordinates, I applied spherical geometry to calculate the geographic distance.
Following previous studies (Ragozzino and Reuer, 2011; Sorenson and Stuart, 2001; Stuart and
Sorenson, 2003), I used the Great Circle distance formula:
geographic distance = r × arcos[sin(latitudeacq) × sin(latitudetgt) +
cos(latitudeacq) × cos(latitudetgt) ×
cos(longitudetgt − longitudeacq)],
where r is the radius of the earth in miles (i.e., r = 3,963 miles). I transformed the latitudes and
longitudes into radians for the calculation. I then scaled geographic distance by 1000 for
coefficient size purposes.
Next, I constructed the variable, cross-border dummy. This variable equals one if the
acquiring firm and the target firm were located in different countries. When the acquiring firm’s
headquarters was located in a different country, but the SBU that was to be merged with the
target firm was located in the same country as the target firm, the variable equals zero, not one.
The sample consists of 61 cross-border acquisitions.
For technological overlap, I constructed the variable, target technological overlap, which
represents the percentage of the target firm’s knowledge base that the acquiring firm possessed in
its knowledge base. I constructed the knowledge bases in line with Ahuja and Katila (2001). A
firm’s knowledge base is a count of the number of unique elements of knowledge where I
defined an element of knowledge as either a firm’s patent or a patent cited by one of the firm’s

107
patents. By aggregating these elements of knowledge and eliminating all duplicates, I arrived at a
firm’s knowledge base. In constructing the knowledge bases, I included patents with an
application date in the seven years prior to the acquisition ‘effective date’. Similar with the
dependent variable, I used a seven-year window to be confident that I captured the knowledge
that the firms possessed that was still relevant at the time of the acquisition (Jaffe et al., 1993).
Control Variables
I constructed the variable, acquirer technological overlap, following the method outlined above
for target technological overlap except that I measured the proportion of the acquiring firm’s
knowledge base that is a part of the target firm’s knowledge base instead of the proportion of the
target firm’s knowledge base that is a part of the acquiring firm’s knowledge base. Sears and
Hoetker (2012) showed that technological overlap can be asymmetric and that target overlap and
acquirer overlap possess their own unique effects on acquisition performance.
To control for the technological capabilities of the target firm and the acquiring firm, I
constructed the variables, acquirer technological capabilities and target technological
capabilities. I constructed these variables as citation weighted patent counts of the seven years
prior to the acquisition announcement following Trajtenberg (1990) using the application date of
each patent. A citation weighted patent count is an appropriate measure for technological
capabilities as the count not only takes into account the firm’s ability to innovate but also
accounts for the quality of the innovations by incorporating the number of forward citations of
each patent.
I constructed the variable acquisition experience. Acquisition experience has been found
to create benefits (Bruton et al., 1994; Fowler and Schmidt, 1989; Zollo and Singh, 2004), to
create a burden (Kusewitt Jr, 1985), and to have no effect (King et al., 2004; Lahey and Conn,

108
1990). Acquisition experience counts the number of acquisitions the acquiring firm completed in
the five years prior to the acquisition. I limited the acquisition experience to five years due to
empirical evidence that has shown that managerial experience depreciates quickly (Karim, 2009;
Sampson, 2005).
I included two variables that control for the acquisition size. I constructed the variable
relative size (employees) as the log of the relative size of the target firm to the acquiring firm in
terms of the number of employees. I also constructed the variable relative size (knowledge bases)
which is the number of unique knowledge elements in the target firm’s knowledge base divided
by the number of unique elements in the acquiring firm’s knowledge base.
I also controlled for the industry of the acquiring firm. I included dummy variables for
each industry at the 2-digit SIC level.
Finally, I constructed a dummy variable called pre-acquisition citation dummy.
The variable equaled one if the acquiring firm cited a target firm patent prior to the
acquisition and equaled zero if no such citation occurred.
Descriptive Statistics
The descriptive statistics and correlations can be found in Table 4.1. Of the 246 acquisitions, 77
acquisitions had at least one integrative innovation, and 142 acquisitions had at least one
independent innovation. The mean time to the first integrative innovation was 20.58 months
compared to a mean time of 15.13 months to the first independent innovation. By conducting a t-
test for differences in means, I find that the time to the first integrative innovation is significantly
longer than the time to the first independent innovation (p = 0.0256). Table 4.2 presents
descriptive statistics for geographic distance and target technological overlap for different
subsamples of acquisitions and tests for significant differences in the means of the subsamples.

109
The mean geographic distance between the target firms and the acquiring firms is 1,699
miles with the median at 1,261 miles. The mean geographic distance for the 75 acquisitions that
created only independent innovations is 1,906 miles while the mean geographic distance for the
77 acquisitions that created integrative innovations is 1,580 miles. These distances are not
significantly different (p = 0.1496) nor are any of the other comparisons of geographic distance
in Table 4.2.
There are 61 cross-border acquisitions in the sample. There are 39 cross-border
acquisitions that either creates an integrative innovation or an independent innovation. There are
11 cross-border acquisitions that create an integrative innovation and 37 cross-border
acquisitions that create an independent innovation.
The mean target technological overlap is 0.1638 while the median is 0.0575 for the
complete sample. The mean target technological overlap is 0.1158 for the 75 acquisitions that
created only independent innovations, 0.2801 for the 77 acquisitions that created integrative
innovations, 0.1842 for the 142 acquisitions that created an independent innovation, 0.4096 for
the 10 acquisitions that created only integrative innovations, and 0.1068 for the 94 acquisitions
that did not create either an integrative innovation or an independent innovation. In Table 4.2 we
can see that the mean overlaps in most of the subsamples are significantly different from each
other. The integrative innovation acquisitions possess significantly greater target technological
overlap than the independent innovation acquisitions. Another statistic to notice is that those
acquisitions that did not innovate post-acquisition utilizing the target firm’s pre-acquisition
knowledge possess the least amount of target technological overlap.

110
Method of Analysis
To test the hypotheses, I conducted a survival analysis using an accelerated failure time model.
The accelerated failure time model allows me to test the effect that the independent variables
have on the time to the first integrative innovation or the first independent innovation.
Comparing various distributions through AIC analysis, the lognormal distribution provides the
best fit for the integrative innovation models while the loglogistic distribution provides the best
fit for the independent innovation models. The hypotheses are tested by entering the three
independent variables and the interactions between target technological overlap and geographic
distance and between target technological overlap and cross-border dummy in the right-hand
side of the model.
RESULTS
Integrative Innovation
Table 4.3 presents the results for the hypotheses on integrative innovation. Model 1 presents the
results for the independent effects in Hypotheses 1-3. Model 2 presents the results for Hypothesis
4 and Model 3 presents the results for Hypothesis 5. Model 4 presents the results for the
simultaneous test of Hypotheses 4 and 5.
Geographic distance does not have a significant impact on the amount of time that
elapses until the first post-acquisition integrative innovation. Further, geographic distance does
not significantly interact with target technological overlap. Therefore, the analysis provides no
support for either Hypothesis 1 or Hypothesis 4.
The acquisition being a cross-border acquisition does significantly affect the amount of
time elapsed until the first post-acquisition integrative innovation. The cross-border dummy is
significant in all models for which it is included. Model 1 shows that a cross-border acquisition

111
increases the expected time elapsed until first integrative innovation by 458% (β = 1.7189). This
supports Hypothesis 2.
Target technological overlap possesses a highly significant effect on the amount of time
elapsed until the first post-acquisition integrative acquisition in all models. In Model 1, an
increase in target technological overlap by one percentage point decreases the expected time
elapsed until the first integrative innovation by 2.30% (β = -2.3308)9. Further, a one standard
deviation increase in technological overlap (0.23) decreases the time elapsed until the first
integrative innovation by 41%. This provides support for Hypothesis 3.
Target technological overlap also significantly impacts the relationship between the
acquisition being a cross-border acquisition and the amount of time elapsed until the first
integrative innovation. When there is no technological overlap, crossing national borders
increases the expected time to the first integrative innovation by 1657% in Model 4 (β = 2.8664).
When technological overlap is held at its mean (0.16), crossing national borders increases the
expected time to the first integrative innovation by 828% in Model 4 (βcross-border + βinteraction ×
(0.16) = 2.8664 + -0.6389 = 2.2275). When technological overlap is held at one standard
deviation above the mean (0.38), crossing national borders increases the expected time to first
integrative innovation by 285% in Model 4 (βcross-border + βinteraction × (0.38) = 2.8664 + -1.5173 =
1.3491). Therefore, we see that an increase in technological overlap weakens the impact that
crossing national borders has on extending the time to the first post-acquisition integrative
innovation. This supports Hypothesis 5.
9 All interpretations pertaining to the effects of target technological overlap are calculated by
dividing the target technological overlap coefficient by 100 before exponentiation since a unit
increase of target technological overlap (a percentage point) equals 0.01 instead of one.

112
Alternatively, we can interpret the interaction as technological overlap possessing a
greater impact on facilitating communication and, therefore, decreasing the amount of time that
elapses until the first integrative innovation in cross-border acquisitions. In domestic
acquisitions, an increase in target technological overlap by one percentage point decreases the
expected time elapsed until the first integrative innovation by 2.72% in Model 4 (β = -2.7587),
while in cross-border acquisitions, an increase in target technological overlap by one percentage
point decreases the expected time elapsed until the first integrative innovation by 6.53% in
Model 4 (βtarget_overlap + βinteraction = -2.7587 + -3.9929 = -6.7516).
Independent Innovation
Table 4.4 presents the results for the hypotheses on independent innovation. Model 5 presents the
results for the independent effects in Hypotheses 6-8. Model 6 presents the results for Hypothesis
9 and Model 7 presents the results for Hypothesis 10. Model 8 presents the results for the
simultaneous test of Hypotheses 9 and 10.
Geographic distance does not possesses a significant impact on the time elapsed to the
first independent innovation either. Further, geographic distance does not significantly interact
with technological overlap. Therefore, the analysis provides no support for either Hypothesis 6
or Hypothesis 9.
The acquisition being a cross-border acquisition does significantly affect the amount of
time elapsed until the first post-acquisition independent innovation. The cross-border dummy is
significant in all models. Model 5 shows that a cross-border acquisition decreases the expected
time elapsed until the first independent innovation by 63% (β = -1.0005). This supports
Hypothesis 7.

113
For this initial analysis, target technological overlap does not possess a significant impact
on the amount of time elapsed until the first independent innovation. Further, target
technological overlap does not significantly moderate the impact that the acquisition being a
cross-border acquisition has on the amount of time elapsed until the first independent innovation.
Therefore, the initial analysis provides no support for either Hypothesis 8 or Hypothesis 10.
Robustness Tests
I conducted robustness tests on both integrative innovations and independent innovations by only
considering acquisitions where the post-acquisition firm innovates using the pre-acquisition
knowledge of the target firm. That is, I drop all acquisitions from the survival analysis that
neither create a post-acquisition integrative innovation nor create a post-acquisition independent
innovation. While these models lose information from the non-innovating acquisitions, these
non-innovating acquisitions may also possess characteristics that are not controlled for in the
previous models that are affecting the results. For example, some technological acquisitions are
undertaken to kill the target firm’s technology, therefore, the information included in these
acquisitions could be confounding the results. The results for the robustness tests can be found in
Table 4.5.
For integrative innovations, the results are fairly robust. The cross-border dummy
variable is significant in all four models. Target technological overlap possesses a significant
main effect (Model 9) when no interactions are included. Further, the interaction between target
technological overlap and the cross-border dummy is significant in Model 11. This provides
further support for Hypothesis 2, Hypothesis 3, and Hypothesis 5.
For independent innovations, neither geographic distance nor the acquisition being a
cross-border acquisition is significant. Contrary to the results in the first analysis, technological

114
overlap possesses a significant main effect on the amount of the time elapsed until the first
independent innovation. The lack of significance in the initial analysis could be driven by the
characteristics of technological overlap in the non-innovating acquisitions that were dropped in
this robustness test. As can be seen in Table 4.2, the non-innovating acquisitions possess the least
amount of target technological overlap. Therefore, there will be a high negative correlation
between target technological overlap and the time elapsed since these non-innovating
acquisitions are right censored. This can then confound the true effects of target technological
overlap on independent innovation. From Model 13, an increase in a percentage point of target
technological overlap increases the time to the first independent innovation by 1.83% (β =
1.8166). Further, a one standard deviation increase in technological overlap (0.23) increases the
time elapsed until the first independent innovation by 52%. This provides some support for
Hypothesis 8.
Table 4.5 presents a summary of the hypotheses and results.
DISCUSSION AND CONCLUSION
In this paper, I investigated the effects that geographic distance, cross-border acquisitions, and
technological overlap have on the time elapsed until the initial post-acquisition innovation
utilizing the target firm’s technological knowledge. Further, I have shown that whether and how
these factors affect post-acquisition innovation depends on whether the acquiring firm integrates
the target firm’s technological knowledge with its own or not. Through this study, I have
advanced our understanding of what constrains and what facilitates a firm’s ability to overcome
the time compression diseconomies of internal innovation through external technology
acquisition. I will now further discuss the results and their implications.

115
This study contributes to our understanding of the firm as a superior mechanism for
knowledge flows. While Jaffe et al. (1993) with knowledge spillovers, Mowery and Ziedonis
(2001) with licensing arrangements, and Rosenkopf and Almeida (2003) with alliances found
that difficulties in knowledge transfer arise with geographic distance, this study does not find
that geographic distance disadvantages post-acquisition knowledge integration10
. Two
complementary theses have been submitted that would explain why acquisitions do not
encounter enhanced difficulties in knowledge flows from increased geographic distance. Kogut
and Zander (1993) proposed that firms are superior vehicles for transferring knowledge as
internalization facilitates coordination through mutual adjustment. Further, Transaction costs
economics argues that internalizing the transaction would attenuate opportunism allowing for
enhanced information disclosure, therefore, advantaging integrative innovation and further
facilitating mutual adjustment.
While geographic distance did not significantly affect integrative innovation, crossing
national borders did significantly affect integrative innovation. Cross-border acquisitions do
encounter significantly greater difficulties in knowledge integration compared to domestic
acquisitions. By simultaneously testing geographic distance and technological distance, we see
that there is something beyond mere distance that creates difficulties in integrative innovations.
This provides support for the proposition that knowledge resides in different environmental
(national) contexts that provide obstacles to knowledge transfer (Lam, 2006; Phene et al., 2006;
Williams, 2007).
10
In trade both geographic distance and crossing borders matter (Ghemawat, 2001), and
therefore, it is important to include both in empirical models. In the studies cited, Jaffe et al.
(1993) independently tested the effects of distance and crossing borders, Mowery and Ziedonis
(2001) only considered domestic licensing within the United States, and Rosenkopf and Almeida
(2003) controlled for crossing borders but did not differentiate between crossing national borders
and state borders.

116
Technological overlap possessed the most significant effect on the time to post-
acquisition integrative innovation. This supports the argument that similar technical language
and experience enhances the efficiency of integrative innovation (Grant, 1996a). Further, I find
that technological overlap attenuates the difficulties arising in cross-border acquisitions. This
extends Puranam et al. (2009) finding that ‘common ground’ facilitates distant communication
and coordination by introducing the tension between the national context and the technical
context of knowledge. With research showing that knowledge possesses unique characteristics
specific to where it is located (Porter, 1990; Saxenian, 1994) which lead to enhanced synergistic
possibilities in cross-border acquisitions (Larsson and Finkelstein, 1999), this study shows that
technological overlap can overcome the embeddedness of the knowledge in its national context
allowing the acquiring firm to achieve unique location specific synergies.
Similar to integrative innovations, crossing national borders rather than mere geographic
distance significantly affects the time it takes to the first independent innovation. As predicted, I
find that cross-border acquisitions are faster at creating the first post-acquisition innovation
compared to domestic acquisitions. The key question that arises is why would borders increase
the autonomy or create less target firm disruption compared to mere geographic distance. One
explanation is that crossing borders entails enhanced difficulties in conducting on-site visits.
Further, by integrating the evidence on knowledge residing in its national context, the additional
asymmetries that arise lead to the acquiring firm’s managers to perceive that they do not possess
superior knowledge compared to that of the target firm, therefore, reducing selective intervention
and target disruption.
Technological overlap did possess some negative effects on the efficiency of independent
innovation. While not significant in the full sample analysis, technological overlap did increase
117
the amount of time that elapsed until the first independent innovation when only considering
those acquisitions that did produce some type of innovation that utilized the target firm’s pre-
acquisition knowledge. Therefore, for those that did utilize the target firm’s technological
knowledge, increased relatedness in knowledge delayed independent innovation.
This study provides implications for the management of acquiring firms. When
considering the acquisition of a firm for innovative purposes, management must consider
whether the target firm is located in a similar national environment and how technologically
related the two firms’ knowledge bases are. While this has been addressed in prior research, I
further show that management must recognize their intent. Do they intend to collaborate with the
target firm in post-acquisition innovation or rather maintain the autonomy of the target firm? For
managers that would like to maintain the target firm’s pre-acquisition innovative trajectory while
simultaneously creating collaborative efforts, this paper shows that management must find a
balance of geographic distance and technological overlap that facilitates communication but does
not create excessive opportunities for selective intervention that will hamper the innovative
productivity of the target firm.
This study is not without its limitations. One limitation that provides opportunities for
interesting future research is the inability to perceive intent. I was unable to observe what the
acquiring firm intended to do or what motivated the acquiring firm to purchase the target firm.
While I was able to observe integrative innovations and independent innovations, I do not know
if these innovations were the pre-acquisition intentions of the acquiring firm or not. Further, I am
unable to observe the communication difficulties or selective intervention. This is where future
studies using survey analysis could shed light. Finally, there are always limits to patent data as
the acquisition itself may affect the patenting activity.
118
In conclusion, this study has advanced our understanding of technological acquisitions as
a means for overcoming the time compression diseconomies of internal innovation. It shows the
significant effects that crossing national borders has on both integrative innovation and
independent innovation. Further, it extends our knowledge about how technological overlap
creates ‘common ground’ that facilitates distant knowledge exchange. On the other hand, it
shows that technological overlap can possess negative effects on independent innovation.
Therefore, this study on a whole shows the necessity for the acquiring firm to not only account
for the location of the target firm and its technological relatedness but also the manner in which
it plans to utilize the target firm’s technological knowledge.

119
TABLES
Table 4.1. Descriptive statistics and correlations
variables obs mean sd min max
1. Time to 1st integrative innovationa 77 20.58 22.45 0.07 103.20
2. Time to 1st independent innovationa 142 15.13 17.13 0.03 80.07
3. Geographic distance (1000 miles) 246 1.70 1.76 0.001 10.85
4. Cross-border acquisition 246 0.25 0.43 0 1
5. Target technological overlap 246 0.16 0.23 0 1
6. Acquirer technological overlap 246 0.03 0.08 0 0.73
7. Target technological capabilities 246 4.59 1.65 0.69 8.94
8. Acquirer technological capabilities 246 6.89 2.24 0 10.99
9. Relative size (knowledge bases) 246 0.55 1.99 0.0001 22.90
10. Relative size (employees) 246 -2.72 2.08 -8.39 3.50
11. Acquisition experience 246 5.70 9.00 0 54
12. Pre-acquisition citation dummy 246 0.23 0.42 0 1
variables 3 4 5 6 7 8 9 10 11
3. Geographic distance (1000 miles)
4. Cross-border acquisition 0.6370*
5. Target technological overlap 0.0018 -0.0546
6. Acquirer technological overlap -0.0032 0.0491 0.3120*
7. Target technological capabilities 0.0073 -0.1198 0.1774* 0.2194*
8. Acquirer technological capabilities 0.0271 -0.1166 0.2708* -0.2270* 0.2359*
9. Relative size (knowledge bases) -0.0226 0.0142 -0.1256* 0.0636 0.1063 -0.4303*
10. Relative size (employees) -0.0436 0.0511 -0.1390* 0.2291* -0.0066 -0.6370* 0.2617*
11. Acquisition experience 0.0376 -0.0900 0.1971* -0.1701* 0.0789 0.4238* -0.1102 -0.4723*
12. Pre-acquisition citation dummy -0.0817 -0.1321* 0.2762* 0.1134 0.4184* 0.3011* -0.0687 -0.0794 0.1572*
* correlation significant at 0.05 levela months.
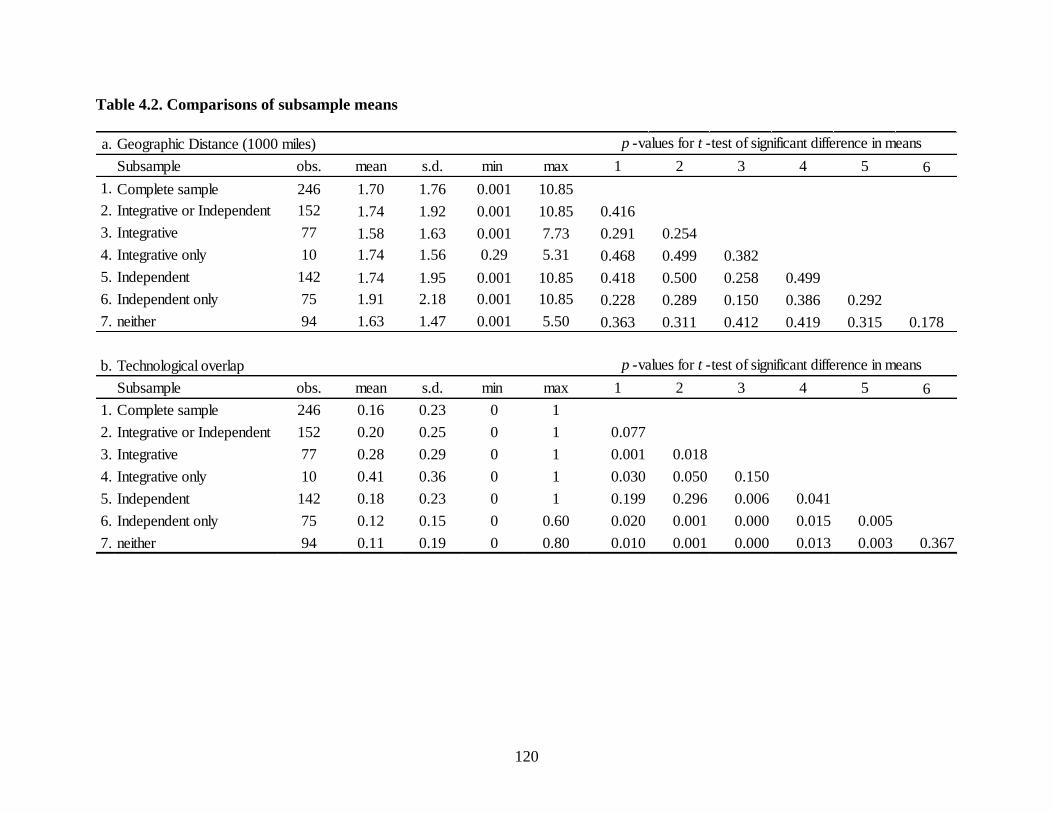
120
Table 4.2. Comparisons of subsample means
a. Geographic Distance (1000 miles)
Subsample obs. mean s.d. min max 1 2 3 4 5 6
1. Complete sample 246 1.70 1.76 0.001 10.85
2. Integrative or Independent 152 1.74 1.92 0.001 10.85 0.416
3. Integrative 77 1.58 1.63 0.001 7.73 0.291 0.254
4. Integrative only 10 1.74 1.56 0.29 5.31 0.468 0.499 0.382
5. Independent 142 1.74 1.95 0.001 10.85 0.418 0.500 0.258 0.499
6. Independent only 75 1.91 2.18 0.001 10.85 0.228 0.289 0.150 0.386 0.292
7. neither 94 1.63 1.47 0.001 5.50 0.363 0.311 0.412 0.419 0.315 0.178
b. Technological overlap
Subsample obs. mean s.d. min max 1 2 3 4 5 6
1. Complete sample 246 0.16 0.23 0 1
2. Integrative or Independent 152 0.20 0.25 0 1 0.077
3. Integrative 77 0.28 0.29 0 1 0.001 0.018
4. Integrative only 10 0.41 0.36 0 1 0.030 0.050 0.150
5. Independent 142 0.18 0.23 0 1 0.199 0.296 0.006 0.041
6. Independent only 75 0.12 0.15 0 0.60 0.020 0.001 0.000 0.015 0.005
7. neither 94 0.11 0.19 0 0.80 0.010 0.001 0.000 0.013 0.003 0.367
p -values for t -test of significant difference in means
p -values for t -test of significant difference in means

121
Table 4.3. Survival analysis on time to first integrative innovation
VARIABLES 1 2 3 4
Geographic distance -0.2448 -0.261 -0.2593 -0.4293
(0.20) (0.23) (0.21) (0.27)
Cross-border dummy 1.7189* 1.7283* 2.4011** 2.8664**
(0.93) (0.94) (1.10) (1.29)
Target technological overlap -2.3308*** -2.4435** -1.8931** -2.7587***
(0.76) (1.05) (0.80) (1.01)
Geographic distance 0.0658 0.6396
x Target technological overlap (0.40) (0.53)
Cross-border dummy -2.5887 -3.9929*
x Target technological overlap (1.78) (2.15)
Acquirer technological overlap -6.2958* -6.3130* -5.7656* -5.6235*
(3.25) (3.25) (3.42) (3.37)
Target technological capabilities -0.4380** -0.4386** -0.4682*** -0.4894***
(0.17) (0.17) (0.18) (0.18)
Acquirer technological capabilities -0.4731*** -0.4718*** -0.4612*** -0.4408**
(0.18) (0.18) (0.18) (0.18)
Relative size (knowledge bases) 0.3346 0.3388 0.344 0.3863
(0.30) (0.31) (0.29) (0.30)
Relative size (employees) -0.4118*** -0.4127*** -0.4250*** -0.4413***
(0.15) (0.15) (0.15) (0.15)
Acquisition experience -0.0031 -0.0035 -0.0022 -0.0051
(0.02) (0.02) (0.02) (0.02)
Pre-acquisition citation dummy -1.9346*** -1.9279*** -1.9942*** -1.9627***
(0.55) (0.55) (0.56) (0.56)
Industry dummies Included Included Included Included
Intercept 14.8372*** 14.5319*** 14.8417*** 14.7568***
(2.41) (2.17) (2.40) (2.23)
ln_sig 0.8166*** 0.8161*** 0.8191*** 0.8159***
(0.09) (0.09) (0.09) (0.09)
Wald chi-square 128.39 129.21 128.03 131.25
Observations 246 246 246 246
Robust standard errors in parentheses
*** p<0.01, ** p<0.05, * p<0.1
Lognormal Accelerated Failure-Time

122
Table 4.4. Survival analysis on time to first independent innovation
VARIABLES 5 6 7 8
Geographic distance 0.1479 0.035 0.1492 0.0516
(0.12) (0.14) (0.12) (0.14)
Cross-border dummy -1.0005** -0.9864** -1.3678** -1.1062*
(0.49) (0.49) (0.59) (0.61)
Target technological overlap 0.1782 -1.1321 -0.2381 -1.0897
(0.74) (0.97) (0.84) (0.95)
Geographic distance 0.7605 0.6608
x Target technological overlap (0.47) (0.48)
Cross-border dummy 2.4326 0.7606
x Target technological overlap (1.91) (1.98)
Acquirer technological overlap 0.154 -0.1611 -0.5621 -0.3343
(3.08) (3.01) (2.97) (2.99)
Target technological capabilities -0.9663*** -0.9605*** -0.9453*** -0.9546***
(0.13) (0.12) (0.13) (0.12)
Acquirer technological capabilities -0.0589 -0.0757 -0.07 -0.0778
(0.12) (0.13) (0.13) (0.13)
Relative size (knowledge bases) 0.0198 0.0172 0.0106 0.0142
(0.07) (0.07) (0.07) (0.07)
Relative size (employees) -0.1075 -0.1195 -0.1003 -0.1154
(0.11) (0.11) (0.11) (0.11)
Acquisition experience -0.0245 -0.025 -0.0236 -0.0246
(0.02) (0.02) (0.02) (0.02)
Pre-acquisition citation dummy 0.0152 0.1096 0.055 0.1113
(0.36) (0.36) (0.36) (0.36)
Industry dummies Included Included Included Included
Intercept 8.2381*** 12.6198*** 8.3378*** 12.5996***
(1.38) (1.56) (1.34) (1.56)
ln_gam 0.1835*** 0.1766** 0.1809*** 0.1765**
(0.07) (0.07) (0.07) (0.07)
Wald chi-square 142.38 156.01 149.15 155.96
Observations 246 246 246 246
Robust standard errors in parentheses
*** p<0.01, ** p<0.05, * p<0.1
Loglogistic Accelerated Failure-Time

123
Table 4.5. Robustness tests
VARIABLES 9 10 11 12 13 14 15 16
Geographic distance -0.3143 -0.2144 -0.3238 -0.3174 0.0892 0.067 0.0939 0.0891
(0.20) (0.24) (0.21) (0.27) (0.10) (0.11) (0.10) (0.13)
Cross-border dummy 1.9704** 1.9129** 2.6513** 2.6336** -0.1836 -0.1801 -0.3568 -0.3436
(0.88) (0.90) (1.03) (1.17) (0.41) (0.41) (0.55) (0.58)
Target technological overlap -1.2010* -0.5206 -0.7073 -0.675 1.8166*** 1.5906** 1.6753*** 1.6396**
(0.70) (0.92) (0.78) (0.90) (0.58) (0.73) (0.59) (0.72)
Geographic distance -0.3907 -0.0243 0.1394 0.0286
x Target technological overlap (0.33) (0.44) (0.38) (0.40)
Cross-border dummy -2.6719** -2.6171 0.9726 0.9021
x Target technological overlap (1.26) (1.67) (1.79) (1.83)
Acquirer technological overlap -8.4831*** -8.4641*** -8.0821*** -8.0897*** -1.9725 -2.0208 -2.2386 -2.23
(2.89) (2.95) (3.04) (3.05) (1.29) (1.30) (1.42) (1.40)
Target technological capabilities -0.0341 -0.0196 -0.0606 -0.0591 -0.5049*** -0.5096*** -0.5002*** -0.5014***
(0.17) (0.17) (0.17) (0.18) (0.13) (0.13) (0.12) (0.13)
Acquirer technological capabilities -0.5065*** -0.5232*** -0.4894*** -0.4908*** -0.0539 -0.0553 -0.0607 -0.0606
(0.17) (0.18) (0.18) (0.18) (0.11) (0.11) (0.11) (0.11)
Relative size (knowledge bases) 0.3782 0.3378 0.3806 0.3781 0.0191 0.0187 0.0144 0.0146
(0.30) (0.32) (0.30) (0.32) (0.06) (0.06) (0.06) (0.06)
Relative size (employees) -0.3657*** -0.3580*** -0.3734*** -0.3727*** -0.0026 -0.0048 0.0024 0.0016
(0.13) (0.13) (0.13) (0.13) (0.10) (0.10) (0.10) (0.10)
Acquisition experience -0.0062 -0.0029 -0.005 -0.0048 -0.0081 -0.0084 -0.0073 -0.0074
(0.02) (0.02) (0.02) (0.02) (0.02) (0.02) (0.02) (0.02)
Pre-acquisition citation dummy -1.6082*** -1.6323*** -1.6605*** -1.6609*** 0.5650* 0.5801* 0.5851* 0.5869*
(0.53) (0.53) (0.55) (0.54) (0.32) (0.33) (0.32) (0.33)
Industry dummies Included Included Included Included Included Included Included Included
Intercept 9.4025*** 9.2767*** 9.2977*** 9.2923*** 6.0862*** 6.1878*** 6.2043*** 6.2167***
(1.88) (1.92) (1.94) (1.95) (1.05) (1.11) (1.06) (1.11)
Lognormal Accelerated Failure-Time Loglogistic Accelerated Failure-Time
Failure = 1st post-acquisition integrative innovation Failure = 1st post acquisition independent innovation

124
Table 4.5. Continued.
ln_sig 0.6551*** 0.6564*** 0.6583*** 0.6583***
(0.10) (0.10) (0.10) (0.10)
ln_gam -0.2104*** -0.2118*** -0.2121*** -0.2122***
(0.07) (0.08) (0.07) (0.08)
Wald chi-square 110.32 106.53 104.61 105.21 73.92 74.65 75.25 77.86
Observations 152 152 152 152 152 152 152 152
Robust standard errors in parentheses
*** p<0.01, ** p<0.05, * p<0.1

125
Table 4.6. Summary of hypotheses and results.
Hypotheses Results
Hypothesis 1. The amount of time that elapses until the initial post-acquisition integrative innovation
increases with increases in geographic distance. Not supported
Hypothesis 2. The amount of time that elapses until the initial post-acquisition integrative innovation
increases with the acquisition being a cross-border acquisition rather than a domestic acquisition. Supported
Hypothesis 3. The amount of time that elapses until the initial post-acquisition integrative innovation
decreases with increases in technological overlap. Supported
Hypothesis 4. Increases in technological overlap weaken the positive relationship between geographic
distance and the amount of time that elapses until the initial post-acquisition integrative innovation. Not supported
Hypothesis 5. Increases in technological overlap weaken the positive relationship between cross-border
acquisitions and the amount of time that elapses until the initial post-acquisition integrative innovation. Supported
Hypothesis 6. The amount of time that elapses until the initial post-acquisition independent innovation
decreases with increases in geographic distance. Not supported
Hypothesis 7. The amount of time that elapses until the initial post-acquisition independent innovation
decreases with the acquisition being a cross-border acquisition rather than a domestic acquisition. Partial support
Hypothesis 8. The amount of time that elapses until the initial post-acquisition independent innovation
increases with increases in technological overlap. Partial support

126
Table 4.6. Continued.
Hypothesis 9. Increases in technological overlap weaken the negative relationship between geographic
distance and the amount of time that elapses until the initial post-acquisition independent innovation. Not supported
Hypothesis 10. Increases in technological overlap weaken the negative relationship between cross-
border acquisitions and the amount of time that elapses until the initial post-acquisition independent
innovation.
Not supported

127
CHAPTER 5
CONCLUSION
The objective of this dissertation was to advance our understanding of the factors that affect the
performance of the acquisition of small technology firms with an emphasis on the overlap in the
technological knowledge possessed by the target firm and the acquiring firm. In the three essays,
I advanced our understanding of technological overlap as a concept and measure, showed how it
can be used to understand the rationale behind the acquisition which matters for how the
capabilities of the target firm and acquiring firm will be utilized, and finally, advanced our
knowledge on how technological overlap and the physical location of the target firm in relation
to the acquiring firm affects the ability of the acquiring firm to utilize the target firm’s
knowledge in independent and integrative innovations. I summarize the main findings Table 5.1.
In the first essay, I submitted that the current conception of technological overlap is
incomplete. First, I extended technological overlap to encompass both target and acquirer
overlap, which may be asymmetric. Most empirical constructions of technological overlap have
measured what I call “target overlap”, the portion of the target’s knowledge already known by
the acquirer (Ahuja and Katila, 2001; Cloodt et al., 2006; Kapoor and Lim, 2007). However,
acquisitions also vary in the degree to which the acquirer’s existing knowledge is duplicated by
the target’s knowledge, what I call “acquirer overlap”. Second, while previous research has
tested the direct effect of either technological overlap (Ahuja and Katila, 2001; Cloodt et al.,
2006; Kapoor and Lim, 2007; Makri et al., 2010) or technological capabilities on acquisition
performance (King et al., 2008), I examined these factors jointly. By doing so, I showed how
acquirer and target overlap affect the acquirer’s ability to generate value post-acquisition from
both its own technological capabilities and those it acquires from the target firm.

128
The findings showed that acquirer and target overlap affect value creation separately and
jointly. High target overlap decreased the value created by the target’s technological resources
due to knowledge redundancy. High acquirer overlap diminished the value created by the
acquirer’s technological capabilities by exposing more of the acquirer’s knowledge workers to
disruption and conflict with the target’s knowledge workers. Indeed, for many firms, the negative
effects of high acquirer overlap exceeded any value created from acquiring new technological
resources and capabilities. High acquirer overlap also reduced the value created by the target’s
technological capabilities, but only when target overlap was also high, leading to conflict rather
than potential synergies.
In the second essay, I submitted that we must consider the rationale for the technological
acquisition as the lack of differentiation can explain prior conflicting results on whether the
target firm’s technological capabilities complement (e.g., Cassiman and Veugelers, 2006; Makri
et al., 2010; Veugelers, 1997) or substitute (e.g., Blonigen and Taylor, 2000; Hitt et al., 1990;
King et al., 2008) the technological capabilities of the acquiring firm. I considered whether the
acquiring firm was a technological leader or laggard and the degree of overlap between the
technological knowledge of the target firm and the acquiring firm. By creating a two-by-two
matrix, I identify the following four general rationales: strategic renewal (technological
laggard/low technological overlap), capability upgrading (technological laggard/ high
technological overlap), capability diversification (technological leader/low technological
overlap), and capability deepening (technological leader/high technological overlap).
I found that the target firm’s technological capabilities had a greater positive impact on
the creation of novel resource recombinations when there was less technological overlap between
the target firm and the acquiring firm. I also found that the acquiring firm’s technological

129
capabilities have an increasingly positive impact on the creation of novel resource
recombinations as the acquiring firm’s technological capabilities increased. Further, I found that
the acquiring firm created more shareholder value from the capabilities of the target firm and the
acquiring firm when there was less technological overlap between the target firm and the
acquiring firm and when the acquiring firm was a technological leader. Finally, and most
importantly, I found that an acquiring firm must be technologically capable for shareholders to
value the acquisition of external technology.
In the third essay, I addressed the effects that geographic distance, technological overlap,
and whether the acquiring firm and the target firm domicile in different countries have on the
amount of time it takes the post-acquisition firm to innovate utilizing the target firm’s pre-
acquisition technological knowledge. Further, I differentiated between two roles the target firm’s
knowledge workers play in terms of innovative activity within the post-acquisition firm:
integrative innovation and independent innovation. I found that crossing national borders has a
greater impact compared to geographic distance on the time elapsed until both the initial post-
acquisition integrative innovation and the initial post-acquisition independent innovation. While
I found that cross-border acquisitions take a longer amount of time to create an integrative
innovation compared to domestic acquisitions, technological overlap attenuates the negative
effect of crossing national borders. On the other hand, I found that cross-border acquisitions take
a shorter amount of time to create the first independent innovation compared to domestic
acquisitions. I also found evidence that technological overlap impedes independent innovation
while I found no evidence that technological overlap significantly interacts with either
geographic distance or cross-border acquisitions with independent innovation.

130
The emergence of acquisitions of small technology firms has allowed for the empirical
testing of the link between novel resource recombination creation and acquirer value
appropriation (Barney, 1988). In Appendix B, I duplicated the analysis on acquirer CAR in Essay
1 with the percentage change in patenting intensity as the dependent variable. The findings shed
light on the differences in measuring acquisition performance using patents instead of acquirer
CAR. The main difference in the results is that with simultaneous high target overlap and high
acquirer overlap there is a significant increase in patenting intensity but a significant decrease in
acquirer CAR. One explanation is that while the similarities allow for continuity in patenting
activity or the maintenance of a particular technological trajectory, the innovations (patents)
occurring in these acquisitions create only marginal added value compared to the innovations
(patents) created pre-acquisition. This explanation concurs with the Barney (1988) proposition.
While the hypotheses in the second and third essays focus on target overlap, the results of
acquirer overlap as a control variable give a more complete understanding of how acquirer
overlap differs from target overlap. In Essay 2, acquirer overlap was actually significant more
often than target overlap. This was seen in both patenting and abnormal returns analyses.
Additionally, acquirer overlap was only significant in the technological leader subsamples. In
both the patenting and abnormal returns analyses, acquirer overlap was significantly positive in
the high overlap/leader subsample (capability deepening). In Essay 3, acquirer overlap was
significant in all integrative innovation models. In the robustness tests of the integrative
innovation models, acquirer overlap was highly significant while target overlap was not
significant in three out of four models. Theoretically, the significance of acquirer overlap and
integrative innovation timing makes sense. The more central a role the target firm’s technology
is to the acquiring firm’s technology, the more importance the acquiring firm should put on

131
creating integrative innovations. The sum of the three essays lays out a nice foundation of how
acquirer overlap differs from target overlap in its effect on acquisition performance. The
following is a summary of the main findings on acquirer overlap:
1. Negatively impacts the value creation from both the target firm’s and the acquiring
firm’s technological capabilities (Essay 1),
2. Positively impacts patenting intensity and value creation when the acquisition is
characterized by both the acquiring firm being a technological leader and there being
high target overlap, and
3. Decreases the time elapsed to the initial post-acquisition integrative innovation.
LIMITATIONS
While I was able to build upon a large theoretical literature and rich empirical findings in
developing the hypotheses, I did not directly observe the underlying mechanisms. In particular, it
would be helpful to see how the levels of acquirer and target overlap influence the probability of
employees departing from the target and, especially, the acquiring firm (cf. Karim, 2006). The
same observation could be undertaken for asset divestitures at different levels of acquirer and
target overlap.
The analysis on acquirer CAR in the first two essays suffered the limitation of small
sample sizes. While currently there is not much that can be done as this is a limitation due to the
newness of the phenomenon, future studies will be able to overcome this shortcoming. Further,
the use of patents to construct the independent variables limited to sample. Therefore, future
studies could utilize alternative measures that could increase the sample size.
In the second essay, the main limitation was the inability to observe the rationale of the
acquisitions. I had to infer the general rationale from the target technological overlap and the

132
technological capabilities of the acquiring firm. Future work could systematically identify the
rationale using content analysis of the acquisition announcements. Further, the study does not
observe the resource recombination process. While patents do provide empirical evidence of
combining prior knowledge, I was unable to observe the reorganization and integration of
capabilities that a survey study would be able to observe. These limitations do provide
opportunities for future research to take a look inside the integration process to observe how
different rationales lead to different resource utilizations.
In the third essay, I was unable to observe the intent of the acquisition. While Mario
Mazzola stated that Cisco seeks to utilize the target firm’s knowledge workers in both
independent and integrative innovations, the acquisition announcements show that not all
acquiring firms have the same intent with how the target firm’s knowledge workers will be
utilized. While I was able to observe integrative innovations and independent innovations, I do
not know if these innovations were the pre-acquisition intentions of the acquiring firm.
I was also unable to observe the communication difficulties or selective intervention in
the third essay. This is where future studies using survey analysis could shed light. Another
method of measuring communication or selective intervention would be to track the
communication that takes place between the acquiring firm and the target firm. In respect to
selective intervention, excessive communication can be taken as a signal of excessive
intervention. Allatta and Singh (2011) were able to measure email communication post-
acquisition which could be utilized to measure excessive intervention and how it affects
innovation.
Finally, there are always limits to patent data as the acquisition itself may affect the
patenting activity. As patenting is part of a firm’s strategy, patenting activity may change due to
133
the change in decision makers in charge of whether and what to patent. Therefore, a spike in
target patenting could occur due to a change in ownership.
CONTRIBUTIONS
The dissertation as a whole makes significant contributions to the cumulative knowledge on the
why some technology acquisitions succeed and some do not. Further, the dissertation takes a
holistic view of success. I investigated acquisition success in terms of acquirer value creation,
knowledge creation, and the amount of time it takes to create new knowledge using the target’s
prior knowledge. Further, I used acquirer value creation and knowledge creation in identical
analyses which provided a picture of how knowledge creation and acquirer value creation are
linked.
One of the main contributions is the bifurcation of the technological overlap construct
into target overlap and acquirer overlap. From the results, we can see that these are indeed two
distinct constructs with their own unique effect on performance. Therefore, future research needs
to not only consider how much of the target firm the acquirer already knows, but also how much
of the acquirer the target firm already knows.
Another main contribution is that researchers and managers must recognize the rationale
for the acquisition to understand potential success for the acquisition. While prior research
differentiated by technological overlap (Haspeslagh and Jemison, 1991; Karim and Mitchell,
2000; Larsson and Finkelstein, 1999), I simultaneously introduced the classification of whether
the acquirer was a technological leader or laggard. By identifying four general rationales from
prior literature and testing for differences in how the target firm’s and the acquiring firm’s
technological capabilities are utilized, I show that not all rationales are equal in their use of
capabilities. This provides an explanation for conflicting results in prior studies into whether the

134
target firm’s capabilities complement (e.g., Cassiman and Veugelers, 2006; Makri et al., 2010;
Veugelers, 1997) or substitute (e.g., Blonigen and Taylor, 2000; Hitt et al., 1990; King et al.,
2008) the acquiring firm’s capabilities. Further, by differentiating between leaders and laggards,
I showed that it is only the laggards that significantly destroy value. Therefore, firms must
already possess sufficient technological capabilities to be able to utilize the capabilities they
acquire from the target firm.
Another contribution is the differentiation between integrative and independent
innovation. I show that whether and how technological overlap, geographic distance, and cross-
border acquisitions affect the time it takes to post-acquisition innovation utilizing the target
firm’s pre-acquisition knowledge depends on the type of innovation, integrative or independent.
This has implication for researchers and managers. For researchers, results could be confounded
due to a mix of intent for the use of the target firm’s knowledge workers. As the sample shows,
there are acquisitions that only develop independent innovations using the target firm, only
develop integrative innovations using the target firm, and those that develop both independent
and integrative innovation using the target firm. For managers, the results suggest that the
acquiring firm’s management must recognize how they plan to utilize the target firm’s
knowledge workers when considering the appropriateness of the target firm.
Finally, the dissertation contributes to our understanding of how distance affects
knowledge transfer. I show that acquisitions do not suffer the same intensity of frictions in
knowledge flows that market mechanisms and spillovers incur from geographic distance. Rather,
knowledge flows are impeded by the knowledge residing in different national contexts. I further
show that technological overlap can provide a commonality in the sources of knowledge that can
attenuate these difficulties.

135
In conclusion, the dissertation made numerous contributions to our understanding of what
leads to the success or failure of acquisitions of small technology firms. Technological overlap is
shown to be more than a one-dimensional construct. By broadening our understanding of
technological overlap and simultaneously considering other relevant variables (e.g., acquirer
technological capabilities, geographic distance, and crossing national borders), the dissertation
contributes to our understanding on how firms can more effectively acquire small technology
firms.

136
TABLE
Table 5.1. Summary of findings.
Research Question Main Finding
Essay 1
Does target overlap and acquirer overlap possess
their own unique effects on acquisition
performance?
Target capabilities create less value the greater the target
overlap
Target capabilities create less value the greater the
acquirer overlap only when target overlap is also high
Acquirer capabilities create less value the greater the
acquirer overlap
Essay 2
Do the target’s and the acquirer’s technological
capabilities contribute differently to post-
acquisition knowledge creation and value creation
depending on the rationale for acquisition?
Target and acquirer capabilities create value in capability
diversification rationale
Target capabilities create value and acquirer capabilities
lose value in strategic renewal rationale
Target capabilities lose value and acquirer capabilities
create value in capability deepening rationale
Target and acquirer capabilities lose value in capability
upgrading rationale
Essay 3
How does distance (technological, geographic,
and cultural) between the target firm and the
acquiring firm impact the amount of time it takes
the acquiring firm to utilize the target firm’s
technological knowledge?
Integrative innovations occur quicker in domestic
acquisitions and when there is greater target overlap
Target overlap can substitute for locational proximity in
integrative innovations
Independent innovations occur quicker in cross-border
acquisitions and when there is less target overlap

137
REFERENCES
Abernathy WJ, Utterback JM. 1978. Patterns of industrial innovation. Technology Review 80(7):
40-47.
Agarwal R, Helfat CE. 2009. Strategic renewal of organizations. Organization Science 20(2):
281-293.
Aguilera RV, Dencker JC. 2004. The role of human resource management in cross-border
mergers and acquisitions. The International Journal of Human Resource Management
15(8): 1355-1370.
Ahuja G, Katila R. 2001. Technological acquisitions and the innovation performance of
acquiring firms: A longitudinal study. Strategic Management Journal 22(3): 197-220.
Allatta JT, Singh H. 2011. Evolving communication patterns in response to an acquisition event.
Strategic Management Journal 32(10): 1099-1118.
Allen T. 1977. Managing the flow of technology. MIT Press: Cambridge, MA.
Almeida P, Phene A, Grant RM. 2003. Innovation and knowledge management: Scanning,
sourcing and integration. In Handbook of organizational learning and management.
Easterby-Smith M, Lyles M (eds.), Blackwell: Malden, MA.
Almeida P, Song J, Grant RM. 2002. Are firms superior to alliances and markets? An empirical
test of cross-border knowledge building. Organization Science 13(2): 147-161.
Argote L, Ingram P. 2000. Knowledge transfer: A basis for competitive advantage in firms.
Organizational behavior and human decision processes 82(1): 150-169.
Arikan AM, Capron L. 2010. Do newly public acquirers benefit or suffer from their pre ipo
affiliations with underwriters and vcs? Strategic Management Journal 31(12): 1257-
1289.
Barney JB. 1988. Returns to bidding firms in mergers and acquisitions: Reconsidering the
relatedness hypothesis. Strategic Management Journal 9(S1): 71-78.
Barney JB. 1989. Asset stocks and sustained competitive advantage: A comment. Management
science 35(12): 1511-1513.
Bartholomew S. 1997. National systems of biotechnology innovation: Complex interdependence
in the global system. Journal of International Business Studies 28(2): 241-266.
Benson D, Ziedonis RH. 2009. Corporate venture capital as a window on new technologies:
Implications for the performance of corporate investors when acquiring startups.
Organization Science 20(2): 329-351.

138
Birkinshaw J, Bresman H, Håkanson L. 2000. Managing the post‐acquisition integration process:
How the human iintegration and task integration processes interact to foster value
creation. Journal of Management Studies 37(3): 395-425.
Björkman I, Stahl GK, Vaara E. 2007. Cultural differences and capability transfer in cross-
border acquisitions: The mediating roles of capability complementarity, absorptive
capacity, and social integration. Journal of International Business Studies 38(4): 658-
672.
Blake R, Mouton J. 1985. How to achieve integration on the human side of the merger.
Organizational Dynamics 13(3): 41-56.
Blonigen BA, Taylor CT. 2000. R&d intensity and acquisitions in high technology industries:
Evidence from the us electronic and electrical equipment industries. The Journal of
Industrial Economics 48(1): 47-70.
Bresman H, Birkinshaw J, Nobel R. 1999. Knowledge transfer in international acquisitions.
Journal of international business studies 30(3): 439-462.
Brush TH. 1996. Predicted change in operational synergy and post-acquisition performance of
acquired businesses. Strategic Management Journal 17(1): 1-24.
Bruton GD, Oviatt BM, White MA. 1994. Performance of acquisitions of distressed firms. The
Academy of Management Journal 37(4): 972-989.
Cameron G. 1996. Innovation and economic growth. Centre for Economic Performance, London
School of Economics and Political Science.
Capron L, Dussauge P, Mitchell W. 1998. Resource redeployment following horizontal
acquisitions in europe and north america, 1988–1992. Strategic Management Journal
19(7): 631-661.
Capron L, Mitchell W. 2009. Selection capability: How capability gaps and internal social
frictions affect internal and external strategic renewal. Organization Science 20(2): 294-
312.
Capron L, Mitchell W, Swaminathan A. 2001. Asset divestiture following horizontal
acquisitions: A dynamic view. Strategic Management Journal 22(9): 817-844.
Capron L, Pistre N. 2002. When do acquirers earn abnormal returns? Strategic Management
Journal 23(9): 781-794.
Cassiman B, Veugelers R. 2006. In search of complementarity in innovation strategy: Internal
r&d and external knowledge acquisition. Management science 52(1): 68-82.
Child J, Faulkner D, Pitkethly R. 2001. The management of international acquisitions. Oxford
University Press: Oxford.

139
Cloodt M, Hagedoorn J, Van Kranenburg H. 2006. Mergers and acquisitions: Their effect on the
innovative performance of companies in high-tech industries. Research Policy 35(5):
642-654.
Coff RW. 2002. Human capital, shared expertise, and the likelihood of impasse in corporate
acquisitions. Journal of Management 28(1): 107.
Cohen WM, Levinthal DA. 1990. Absorptive capacity: A new perspective on learning and
innovation. Administrative science quarterly 35(1): 128-152.
Demsetz H. 1988. The theory of the firm revisited. Journal of Law, Economics, & Organization
4(1): 141-161.
Dierickx I, Cool K. 1989. Asset stock accumulation and sustainability of competitive advantage.
Management Science 35(12): 1504-1511.
Echambadi R, Hess JD. 2007. Mean-centering does not alleviate collinearity problems in
moderated multiple regression models. Marketing Science 26(3): 438-445.
Fama EF. 1970. Efficient capital markets: A review of theory and empirical work. The Journal of
Finance 25(2): 383-417.
Foss K, Foss NJ, Vázquez XH. 2006. ‘Tying the manager's hands’: Constraining opportunistic
managerial intervention. Cambridge Journal of Economics 30(5): 797-818.
Foss NJ. 2003. Selective intervention and internal hybrids: Interpreting and learning from the
rise and decline of the oticon spaghetti organization. Organization Science: 331-349.
Fowler KL, Schmidt DR. 1989. Determinants of tender offer post acquisition financial
performance. Strategic Management Journal 10(4): 339-350.
Freeman C. 1995. The ‘national system of innovation’ in historical perspective. Cambridge
Journal of Economics 19(1): 5-24.
Galbraith JR. 1973. Designing complex organizations. Addison-Wesley: Reading, MA.
Galbraith JR. 1977. Organizational design. Addison-Wesley: Reading, MA.
Galunic DC, Rodan S. 1998. Resource recombinations in the firm: Knowledge structures and the
potential for schumpeterian innovation. Strategic Management Journal 19(12): 1193-
1201.
Ghemawat P. 2001. Distance still matters. Harvard Business Review 79(8): 137-147.
Goranova M, Dharwadkar R, Brandes P. 2010. Owners on both sides of the deal: Mergers and
acquisitions and overlapping institutional ownership. Strategic Management Journal
31(10): 1114-1135.

140
Graebner ME. 2004. Momentum and serendipity: How acquired leaders create value in the
integration of technology firms. Strategic Management Journal 25: 751-777.
Graebner ME. 2009. Caveat venditor: Trust asymmetries in acquisitions of entrepreneurial firms.
The Academy of Management Journal 52(3): 435-472.
Graebner ME, Eisenhardt KM, Roundy PT. 2010. Success and failure in technology acquisitions:
Lessons for buyers and sellers. Academy of Management Perspectives 24(3): 73-92.
Granstrand O, Sjolander S. 1990. The acquisition of technology and small firms by large firms.
Journal of Economic Behavior & Organization 13(3): 367-386.
Grant RM. 1996a. Prospering in dynamically-competitive environments: Organizational
capability as knowledge integration. Organization Science: 375-387.
Grant RM. 1996b. Toward a knowledge-based view of the firm. Strategic Management Journal
17: 109-122.
Greenwood R, Hinings C, Brown J. 1994. Merging professional service firms. Organization
Science 5(2): 239-257.
Gupta AK, Govindarajan V. 2000. Knowledge flows within multinational corporations. Strategic
Management Journal 21(4): 473-496.
Haleblian J, Devers CE, McNamara G, Carpenter MA, Davison RB. 2009. Taking stock of what
we know about mergers and acquisitions: A review and research agenda. Journal of
Management 35(3): 469-502.
Hambrick DC, Cannella AA. 1993. Relative standing: A framework for understanding departures
of acquired executives. The Academy of Management Journal 36(4): 733-762.
Hansen MT. 1999. The search-transfer problem: The role of weak ties in sharing knowledge
across organization subunits. Administrative science quarterly 44(1): 82-111.
Haspeslagh PC, Jemison DB. 1991. Managing acquisitions: Creating value through corporate
renewal. Free Press: New York.
Helfat CE. 1994. Evolutionary trajectories in petroleum firm r&d. Management science 40(12):
1720-1747.
Henderson R, Cockburn I. 1996. Scale, scope, and spillovers: The determinants of research
productivity in drug discovery. The RAND Journal of Economics 27(1): 32-59.
Hitt MA, Hoskisson RE, Ireland RD. 1990. Mergers and acquisitions and managerial
commitment to innovation in m-form firms. Strategic Management Journal 11(4): 29-48.
Jaffe AB, Trajtenberg M, Henderson R. 1993. Geographic localization of knowledge spillovers
as evidenced by patent citations. The Quarterly Journal of Economics 108(3): 577-598.

141
Kalaitzandonakes NG. 2000. Agrobiotechnology and competitiveness. American Journal of
Agricultural Economics 82(5): 1224-1233.
Kapoor R, Lim K. 2007. The impact of acquisitions on the productivity of inventors at
semiconductor firms: A synthesis of knowledge-based and incentive-based perspectives.
Academy of Management Journal 50(5): 1133-1155.
Karim S. 2006. Modularity in organizational structure: The reconfiguration of internally
developed and acquired business units. Strategic Management Journal 27(9): 799.
Karim S. 2009. Business unit reorganization and innovation in new product markets.
Management Science 55(7): 1237-1254.
Karim S, Mitchell W. 2000. Path dependent and path breaking change: Reconfiguring business
resources following acquisitions in the u. S. Medical sector, 1978–1995. Strategic
Management Journal 21(1011): 1061-1081.
Kim DJ, Kogut B. 1996. Technological platforms and diversification. Organization Science 7(3):
283-301.
Kim J, Finkelstein S. 2009. The effects of strategic and market complementarity on acquisition
performance: Evidence from the us commercial banking industry, 1989--2001. Strategic
Management Journal 30(6): 617-646.
King DR, Dalton DR, Daily CM, Covin JG. 2004. Meta analyses of post acquisition
performance: Indications of unidentified moderators. Strategic Management Journal
25(2): 187-200.
King DR, Slotegraaf RJ, Kesner I. 2008. Performance implications of firm resource interactions
in the acquisition of r&d-intensive firms. Organization Science 19(2): 327-340.
Kneller R. 2003. Autarkic drug discovery in japanese pharmaceutical companies: Insights into
national differences in industrial innovation. Research Policy 32(10): 1805-1827.
Knott AM, Posen HE. 2009. Firm r&d behavior and evolving technology in established
industries. Organization Science 20(2): 352-367.
Kogut B, Zander U. 1992. Knowledge of the firm, combinative capabilities, and the replication
of technology. Organization Science 3(3): 383-397.
Kogut B, Zander U. 1993. Knowledge of the firm and the evolutionary theory of the
multinational corporation. Journal of International Business Studies 24(4): 625-645.
Krishnan HA, Miller A, Judge WQ. 1997. Diversification and top management team
complementarity: Is performance improved by merging similar or dissimilar teams?
Strategic Management Journal 18(5): 361-374.

142
Kusewitt Jr JB. 1985. An exploratory study of strategic acquisition factors relating to
performance. Strategic Management Journal 6(2): 151-169.
Lahey KE, Conn RL. 1990. Sensitivity of acquiring firms’ returns to alternative model
specification and disaggregation. Journal of Business Finance & Accounting 17(3): 421-
439.
Lam A. 2003. Organizational learning in multinationals: R&d networks of japanese and us mnes
in the uk*. Journal of Management Studies 40(3): 673-703.
Lam A. 2006. The tacit knowledge problem in multinational corporations: A comparative
analysis of japanese and us mncs’ transnational learning strategies. In Proceedings of the
OLKC 2006 Conference, University of Warwick.
Lane PJ, Lubatkin M. 1998. Relative absorptive capacity and interorganizational learning.
Strategic Management Journal 19(5): 461-477.
Lane PJ, Salk JE, Lyles MA. 2001. Absorptive capacity, learning, and performance in
international joint ventures. Strategic Management Journal 22(12): 1139-1161.
Larsson R, Finkelstein S. 1999. Integrating strategic, organizational, and human resource
perspectives on mergers and acquisitions: A case survey of synergy realization.
Organization Science 10(1): 1-26.
Levinthal D, March J. 1993. The myopia of learning. Strategic Management Journal 14(S2): 95-
112.
Makri M, Hitt MA, Lane PJ. 2010. Complementary technologies, knowledge relatedness, and
invention outcomes in high technology mergers and acquisitions. Strategic Management
Journal 31(6): 602-628.
Mayer KJ, Somaya D, Williamson IO. Forthcoming. Firm-specific, industry-specific and
occupational human capital, and the sourcing of knowledge work. Organization Science.
McWilliams A, Siegel D. 1997. Event studies in management research: Theoretical and
empirical issues. The Academy of Management Journal 40(3): 626-657.
Miles RE, Snow CC, Mathews JA, Miles G, Coleman Jr HJ. 1997. Organizing in the knowledge
age: Anticipating the cellular form. Academy of Management Executive 11(4): 7-24.
Miller DJ. 2004. Firms' technological resources and the performance effects of diversification: A
longitudinal study. Strategic Management Journal 25(11): 1097-1119.
Mirvis PH. 1985. Negotiations after the sale: The roots and ramifications of conflict in an
acquisition. Journal of Organizational Behavior 6(1): 65-84.
Mowery DC, Oxley JE, Silverman BS. 1996. Strategic alliances and interfirm knowledge
transfer. Strategic Management Journal 17: 77-91.

143
Mowery DC, Oxley JE, Silverman BS. 1998. Technological overlap and interfirm cooperation:
Implications for the resource-based view of the firm. Research Policy 27(5): 507-523.
Mowery DC, Ziedonis A. 2001. The geographic reach of market and non-market channels of
technology transfer: Comparing citations and licenses of university patents, National
Bureau of Economic Research: Cambridge, MA.
Nelson RR, Winter SG. 1982. An evolutionary theory of economic change. Harvard University
Press: Cambridge, MA.
Nickerson JA, Zenger TR. 2004. A knowledge-based theory of the firm: The problem-solving
perspective. Organization Science: 617-632.
Paruchuri S, Nerkar A, Hambrick DC. 2006. Acquisition integration and productivity losses in
the technical core: Disruption of inventors in acquired companies. Organization Science
17(5): 545-562.
Pavitt K, Robson M, Townsend J. 1987. The size distribution of innovating firms in the uk:
1945-1983. The Journal of Industrial Economics 35(3): 297-316.
Penrose ET. 1959. The theory of the growth of the firm. Wiley: New York.
Peterson PP. 1989. Event studies: A review of issues and methodology. Quarterly Journal of
Business and Economics 28(3): 36-66.
Phene A, Fladmoe-Lindquist K, Marsh L. 2006. Breakthrough innovations in the us
biotechnology industry: The effects of technological space and geographic origin.
Strategic Management Journal 27(4): 369-388.
Phene A, Tallman S, Almeida P. 2010. When do acquisitions facilitate technological exploration
and exploitation? Journal of Management doi:10.1177/0149206310369939.
Porter ME. 1990. The competitive advantage of nations. Free Press: New York.
Puranam P. 2001. Grafting innovation: The acquisition of entrepreneurial firms by established
firms. In The Wharton School. University of Pennsylvania: Philadelphia, PA.
Puranam P, Singh H, Chaudhuri S. 2009. Integrating acquired capabilities: When structural
integration is (un)necessary. Organization Science 20(2): 313-328.
Puranam P, Singh H, Zollo M. 2006. Organizing for innovation: Managing the coordination-
autonomy dilemma in technology acquisitions. Academy of Management Journal 49(2):
263-280.
Puranam P, Srikanth K. 2007. What they know vs. What they do: How acquirers leverage
technology acquisitions. Strategic Management Journal 28(8): 805-825.

144
Ragozzino R, Reuer JJ. 2011. Geographic distance and corporate acquisitions: Signals from ipo
firms. Strategic Management Journal 32(8): 876–894.
Ranft AL, Lord MD. 2000. Acquiring new knowledge:: The role of retaining human capital in
acquisitions of high-tech firms. The Journal of High Technology Management Research
11(2): 295-319.
Ranft AL, Lord MD. 2002. Acquiring new technologies and capabilities: A grounded model of
acquisition implementation. Organization Science 13: 420-441.
Rosenkopf L, Almeida P. 2003. Overcoming local search through alliances and mobility.
Management science 49(6): 751-766.
Rugman AM, Verbeke A. 2003. Extending the theory of the multinational enterprise:
Internalization and strategic management perspectives. Journal of International Business
Studies 34(2): 125-137.
Sampson RC. 2005. Experience effects and collaborative returns in r&d alliances. Strategic
Management Journal 26(11): 1009-1031.
Santos FM, Eisenhardt KM. 2009. Constructing markets and shaping boundaries:
Entrepreneurial power in nascent fields. The Academy of Management Journal 52(4):
643-671.
Sarkar M, Echambadi R, Agarwal R, Sen B. 2006. The effect of the innovative environment on
exit of entrepreneurial firms. Strategic Management Journal 27(6): 519-539.
Saxenian A. 1994. Regional advantage: Culture and competition in silicon valley and route 128.
Harvard University Press: Cambrigde, MA.
Schimmelpfennig D, King JL, Naseem A. 2003. Intellectual capital in a q-theory of ag-biotech
mergers. American Journal of Agricultural Economics 85(5): 1275-1282.
Scholes M, Williams J. 1977. Estimating betas from nonsynchronous data. Journal of Financial
Economics 5(3): 309-327.
Schumpeter JA. 1934. The theory of economic development. Harvard University Press:
Cambridge, MA.
Schweizer L. 2005. Organizational integration of acquired biotechnology companies into
pharmaceutical companies: The need for a hybrid approach. The Academy of
Management Journal 48(6): 1051-1074.
Sears JB. 2011. Technology overlap and the acquisition of external technology by leaders versus
laggards. In Proceedings of the Seventy-First Annual Meeting of the Academy of
Management, San Antonio, TX.

145
Sears JB, Aguilera RV, Dencker JC. 2012. The role of human resource management in cross-
border technological acquisitions. In Handbook of research in international human
resource management, 2nd ed. Stahl G, Björkman I, Morris S (eds.), Edward Elgar:
Northampton, MA.
Sears JB, Hoetker GP. 2012. Technological overlap, technological capabilities, and resource
recombination in technological acquisitions, University of Illinois: Champaign, IL.
Seth A. 1990. Sources of value creation in acquisitions: An empirical investigation. Strategic
Management Journal 11(6): 431-446.
Siggelkow N. 2002. Misperceiving interactions among complements and substitutes:
Organizational consequences. Management science 48(7): 900-916.
Sorensen JB, Stuart TE. 2000. Aging, obsolescence, and organizational innovation.
Administrative science quarterly 45(1): 81-112.
Sorenson O, Stuart TE. 2001. Syndication networks and the spatial distribution of venture capital
investments. American Journal of Sociology 106(6): 1546-1588.
Stuart TE, Sorenson O. 2003. Liquidity events and the geographic distribution of entrepreneurial
activity. Administrative Science Quarterly 48(2): 175-201.
Szulanski G. 1996. Exploring internal stickiness: Impediments to the transfer of best practice
within the firm. Strategic Management Journal 17: 27-43.
Tallman S, Phene A. 2007. Leveraging knowledge across geographic boundaries. Organization
Science 18(2): 252-260.
Teece DJ. 1977. Technology transfer by multinational firms: The resource cost of transferring
technological know-how. The Economic Journal 87: 242-261.
Thompson JD. 1967. Organizations in action. McGraw-Hill: New York.
Trajtenberg M. 1990. A penny for your quotes: Patent citations and the value of innovations. The
RAND Journal of Economics 21(1): 172-187.
Tripsas M, Gavetti G. 2000. Capabilities, cognition, and inertia: Evidence from digital imaging.
Strategic Management Journal 21(10-11): 1147-1161.
Tsai W. 2000. Social capital, strategic relatedness and the formation of intraorganizational
linkages. Strategic Management Journal 21(9): 925-939.
Tushman ML, Anderson P. 1986. Technological discontinuities and organizational
environments. Administrative science quarterly 31(3): 439-465.
Tushman ML, Nadler DA. 1978. Information processing as an integrating concept in
organizational design. Academy of Management Review 3(3): 613-624.

146
Uhlenbruck K, Hitt MA, Semadeni M. 2006. Market value effects of acquisitions involving
internet firms: A resource based analysis. Strategic Management Journal 27(10): 899-
913.
Veugelers R. 1997. Internal r & d expenditures and external technology sourcing. Research
Policy 26(3): 303-315.
Walsh JP. 1988. Top management turnover following mergers and acquisitions. Strategic
Management Journal 9(2): 173-183.
Walsh JP. 1989. Doing a deal: Merger and acquisition negotiations and their impact upon target
company top management turnover. Strategic Management Journal 10(4): 307-322.
Weick KE. 1976. Educational organizations as loosely coupled systems. Administrative Science
Quarterly 21(1): 1-19.
Williams C. 2007. Transfer in context: Replication and adaptation in knowledge transfer
relationships. Strategic Management Journal 28(9): 867-889.
Williamson OE. 1985. The economic institutions of capitalism. The Free Press: New York.
Williamson OE. 1988. The logic of economic organization. Journal of Law, Economics, &
Organization 4: 65-93.
Zahra SA, George G. 2002. Absorptive capacity: A review, reconceptualization, and extension.
Academy of Management Review 27(2): 185-203.
Zollo M, Meier D. 2008. What is m&a performance? Academy of Management Perspectives
22(3): 55-77.
Zollo M, Singh H. 2004. Deliberate learning in corporate acquisitions: Post acquisition strategies
and integration capability in us bank mergers. Strategic Management Journal 25(13):
1233-1256.

147
APPENDIX A
CUMULATIVE ABNORMAL RETURNS
The Scholes-Williams coefficients were calculated by estimating three OLS regressions:
for j = 1, 2, …, T (A.1)
for j = 1, 2, …, T-1 (A.2)
for j = 2, 3, …, T (A.3)
where
Rij = the rate of return for firm i on day j of the estimation window,
Rmj = the rate of return of the equally-weighted market index from the CRSP database on day j
of the estimation window,
Rmj+1 = the rate of return of the equally-weighted market index from the CRSP database on day
j+1 of the estimation window,
Rmj-1 = the rate of return of the equally-weighted market index from the CRSP database on day
j−1 of the estimation window, and
T = number of days in the estimation window.
I calculated the Scholes-Williams betas as:
( ) ( )⁄ (A.4)
where ρ is the serial correlation of market returns during the estimation window. The Scholes-
Williams intercept is calculated as:
( ⁄ )∑ ( ⁄ )∑
(A.5)
The abnormal returns using the Scholes-Williams alphas and betas are computed as:
( ) (A.6)

148
where
ARit = the abnormal return received by firm i on day t of the event window,
Rit = the rate of return on the share price of firm i on day t of the event window, and
Rmt = the rate of return of the equally-weighted market index from the CRSP database on day t
of the event window,
I then created CARi which is the sum of firm i’s ARit from t = -1 to t = +1. This is the dependent
variable in the regression models on value creation.
An additional step that is widely practiced as well as advised by McWilliams and Siegel
(1997) is to test whether the sample CARs are significantly different from zero. The first step to
this procedure is to standardize the abnormal returns:
⁄ (A.7)
with
(
[( )
∑ ( )
⁄ ]) (A.8)
where
sift = the standard error of the forecast for firm i on day t in the event window,
sie = the standard error of the estimate for firm i over the estimation window,
= the mean rate of return of the equally-weighted market index from the CRSP database.
Next I cumulate the SARs to get the standardized cumulative abnormal returns (SCARi):
( ⁄ )∑
(A.9)
where k is the number of days in the event window.
It is assumed that the SCARs have the same distributions and are independent. I divided
them by their standard deviation to make them identically distributed and then averaged them to
get the average standardized cumulative abnormal return (ASCAR):

149
⁄ [( ) ( )] ⁄ ∑ (A.10)
where n is the number of firms in the sample. The test statistic to evaluate whether the ASCAR is
significantly different from zero is computed as:
(A.11)
which has a standard normal distribution. To test for differences in the subsamples, the following
test statistic was computed:
√( ⁄ ⁄ )⁄
(A.12)
which has a standard normal distribution.

150
APPENDIX B
ESSAY 1 ANALYSIS USING PATENTING AS THE DEPENDENT VARIABLE
Following the call for the use of multiple measures of acquisition performance (Zollo and Meier,
2008), I provide the following analyses using patenting data to construct the dependent variable
instead of acquirer CAR. While many prior studies have constructed a post-acquisition
innovation performance measure using post-acquisition patent counts (Ahuja and Katila, 2001;
Cloodt et al., 2006; Kapoor and Lim, 2007; Makri et al., 2010), I construct a dependent variable
that measures how the acquisition affects the patenting rate by accounting for change in the pre-
versus post-acquisition patenting rates. I constructed the following dependent variable:
( )
⁄ ,
where
PP = the count of patents applied for and later granted by the post-acquisition firm in the
3-year window following the acquisition effective date, and
PT+A = the count of patents applied for and later granted by both the target firm and the
acquiring firm in the 3-year window preceding the acquisition effective date.
A positive number represents positive synergies as the post-acquisition firm creates more patents
in the post-acquisition window than the pre-acquisition target firm and the pre-acquisition
acquiring firm did in the pre-acquisition window combined. A negative number represents
negative synergies as the post-acquisition firm creates fewer patents than that of the combined
pre-acquisition target firm and the pre-acquisition acquiring firm.
151
Reproduction of Analysis I with Patenting Dependent Variable
Table A.1 presents the findings for the additional analysis that replicates Analysis I using the
percentage change in patenting rate as the dependent variable instead of acquirer CAR. Model 1A
through Model 5A correspond to Model 1 through Model 5 in Table 2.2 for the original Analysis
I. The analysis using patenting data does not closely imitate that of the analysis using acquirer
CAR. Consistent with Model 5 in Table 2, I find in Model 5A of Table A.1 that target overlap
negatively moderates the relationship between the target’s technological capabilities and the
percentage change in patenting rate. Beyond this finding, both overlap measures and both
technological capabilities measures did not significantly affect the percentage change in
patenting rate.
Reproduction of Analysis III with Patenting Dependent Variable
Table A.2 and Table A.3 present the findings for the additional analysis that replicates Analysis
III using the percentage change in patenting rate as the dependent variable instead of acquirer
CAR from Table 2.4 and Table 2.5. While the results are not identical to the analysis on acquirer
CAR, the results do show that target overlap and acquirer overlap each possess its own distinct
effect.
Given low acquirer overlap, increases in target overlap decreased the impact that the
target’s technological capabilities had on the change in patenting rate, consistent with acquirer
CAR. On the other hand, given high acquirer overlap, increases in target overlap increased the
impact that the target’s technological capabilities had on the change in patenting rate, contrary to
acquirer CAR.
Given low target overlap, increases in acquirer overlap decreased the impact that both the
target’s and the acquirer’s technological capabilities had on the change in patenting rate. For

152
acquirer CAR, increases in acquirer overlap only significantly moderated the impact of the
acquirer’s technological capabilities. Given high target overlap, increases in acquirer overlap
increased the impact that the target’s technological capabilities had on the change in patenting
rate while increases in acquirer overlap did not significantly affect the impact that the acquirer’s
technological capabilities had on the change in patenting rate. For acquirer CAR, increases in
acquirer overlap negatively moderated the impact that both the target’s and the acquirer’s
technological capabilities had.
These findings shed light on the differences in measuring acquisition performance using
patents instead of acquirer CAR. The main difference in the results is in the Quadrant 4s of Table
2.5 and Table A.3. In Quadrant 4 of Table A.3, the target’s technological capabilities’ impact on
the change in patenting rate is significantly greater than in Quadrants 2 and 3. On the other hand
in Quadrant 4 of Table 2.5, the target’s technological capabilities’ impact on acquirer CAR is
significantly less than in Quadrants 2 and 3. One explanation is that the similarities between the
target and the acquirer indicate that the acquirer is not changing its technological trajectory;
therefore, there will be less disruption in the patenting activity that takes place in the acquiring
firm. Another explanation is that while the similarities allow for continuity in patenting activity
or the maintenance of a particular technological trajectory, the innovations (patents) occurring in
these acquisitions create only marginal added value compared to the innovations (patents)
created pre-acquisition.

153
TABLES AND FIGURES
Table A.1. Duplication of Table 2.2 with patenting data
Dependent variable = % ∆ in patenting rate
Target technological overlap -0.166 -6.995 -0.170 -0.195 -8.172
(0.64) (4.90) (0.64) (0.68) (5.66)
Acquirer technological overlap -0.685 -0.357 0.713 -1.770 11.697
(1.50) (1.62) (4.01) (3.15) (8.71)
Target technological capabilities 0.124 -0.057 0.130 0.118 -0.038
(0.17) (0.10) (0.18) (0.18) (0.10)
Acquirer technological capabilities -0.156 -0.136 -0.151 -0.161 -0.111
(0.10) (0.09) (0.10) (0.10) (0.09)
Target technological capabilities 1.367 1.556
x Target technological overlap (1.06) (1.20)
Target technological capabilities -0.286 -3.789 *
x Acquirer technological overlap (0.98) (2.02)
Acquirer technological capabilities 0.244 1.460
x Acquirer technological overlap (0.82) (1.27)
Transaction value (100 million) -0.138 -0.490 -0.149 -0.112 -0.535
(1.99) (2.24) (2.01) (2.01) (2.33)
Pharma -0.524 -0.596 -0.520 -0.530 -0.590
(0.44) (0.45) (0.44) (0.44) (0.44)
% stock -0.159 -0.288 -0.153 -0.168 -0.270
(0.36) (0.42) (0.36) (0.36) (0.41)
Relative size (employees) -0.074 -0.016 -0.066 -0.082 0.043
(0.10) (0.10) (0.11) (0.11) (0.13)
(5A)(4A)(3A)(2A)(1A)

154
Table A.1. Continued.
Relative size (knowledge bases) -0.083 * -0.072 * -0.084 * -0.083 * -0.077 *
(0.04) (0.04) (0.04) (0.04) (0.04)
4-firm concentration ratio 1.173 1.016 1.205 1.135 1.201
(1.57) (1.49) (1.58) (1.59) (1.41)
Acquisition experience 0.011 0.007 0.011 0.011 0.009
(0.01) (0.01) (0.01) (0.01) (0.01)
Relative market share 1.427 2.415 1.457 1.409 2.852
(1.99) (1.96) (2.02) (2.01) (2.10)
Pre-1998 -0.223 -0.208 -0.221 -0.223 -0.187
(0.53) (0.48) (0.53) (0.52) (0.51)
Post-2000 0.063 0.060 0.076 0.054 0.172
(0.36) (0.34) (0.38) (0.37) (0.39)
Intercept 0.514 1.491 0.458 0.578 1.256
(1.02) (1.30) (1.08) (1.07) (1.21)
Observations 97 97 97 97 97
F-statistic 1.98 ** 1.80 ** 1.91 ** 1.88 ** 1.58 *
R-squared 0.08 0.16 0.08 0.08 0.18
Robust standard errors in parentheses
*** p<0.01, ** p<0.05, * p<0.1

155
Table A.2. Duplication of Table 2.4 with patenting data
Quadrant from Figure 1
Target overlap
Acquirer overlap
Dependent variable = % ∆ in patenting rate
Target technological capabilities 0.051 -0.314 -0.534 0.696
(0.11) (0.20) (0.36) (0.65)
Acquirer technological capabilities -0.009 -0.508 ** 0.277 0.045
(0.09) (0.22) (0.36) (0.38)
Transaction value (100 million) -0.018 0.026 -0.022 -0.036
(0.03) (0.02) (0.02) (0.07)
Pharma -0.027 -0.123 -0.781 -0.977
(0.54) (0.42) (0.71) (1.67)
% stock 0.428 1.063 * -0.958 -1.521
(0.62) (0.55) (0.67) (1.76)
Relative size (employees) -0.035 -0.081 -0.620 0.228
(0.21) (0.22) (0.62) (0.37)
Relative size (knowledge bases) -0.034 -0.027 4.527 0.924
(0.06) (0.43) (4.85) (1.92)
4-firm concentration ratio 3.610 0.915 -11.207 -13.139
(3.03) (2.79) (9.98) (10.44)
Acquisition experience -0.073 0.079 0.040 0.103
(0.06) (0.09) (0.03) (0.09)
Relative market share 5.209 8.596 ** -8.369 1.143
(6.82) (3.52) (8.65) (5.27)
Pre-1998 2.166 *** 0.529 -0.812
(0.69) (0.70) (0.76)
Post-2000 -0.033 -0.657 -0.700 0.471
(0.54) (0.48) (0.85) (1.16)
Intercept -1.515 4.053 3.815 2.704
(2.45) (2.53) (3.18) (6.05)
Observations 25 24 24 24
F-statistic 2.76 ** 16.15 *** 1.44 0.44
R-squared 0.6478 0.7324 0.4867 0.3913
Robust standard errors in parentheses
*** p<0.01, ** p<0.05, * p<0.1
Q1 Q2 Q3 Q4
High
(6A)
Low
Low
(9A)(8A)
Low
HighLow
High
(7A)
High

156
Table A.3. Duplication of Table 2.5 with patenting data.
Target
Technological
Capabilities =
0.051
Acquirer
Technological
Capabilities =
- 0.069
Target
Technological
Capabilities =
- 0.314
Acquirer
Technological
Capabilities =
- 0.508**
Target
Technological
Capabilities =
0.696
Acquirer
Technological
Capabilities =
0.045
Target
Technological
Capabilities =
- 0.534
Acquirer
Technological
Capabilities =
0.277
Low Acquirer
Technological Overlap
High Acquirer
Technological Overlap
High Target
Technological
Overlap
Low Target
Technological
Overlap
chi-square = 5.13
p-value = 0.0235
chi-square = 4.35
p-value = 0.0370
H1
H3
chi-square = 9.42
p-value = 0.0022
H3
chi-square = 0.40
p-value = 0.5251
H2
chi-square = 5.47
p-value = 0.0193
H2
chi-square = 5.46
p-value = 0.0194
Q1 Q2
Q3 Q4
* p < .10
** p < .05
*** p < .01
H2 & H3

157
APPENDIX C
INTERACTION INTERPRETATIONS USING ABNORMAL RETURNS AS THE
DEPENDENT VARIABLE
The traditional purpose for regressing independent variables on the abnormal returns was to
explain the cross-sectional variance in the abnormal returns among the sample (McWilliams and
Siegel, 1997). A model that regresses the independent variables on some form of abnormal
returns can be interpreted as an interaction model. To explain the logic, consider a base model
seen in Equation A.1:
(A.1)
where,
CAR = Cumulative abnormal returns,
ATC = Acquirer technological capabilities, and
TTC = Target technological capabilities.
With Equation A.1, I am able to test the impact that the targets’ technological capabilities and the
acquirers’ technological capabilities have on the size of the abnormal returns. If β1 is positive,
then the traditional view would interpret this result as cumulative abnormal returns increase with
increases in the acquirers’ technological capabilities. An alternative way to interpret this result
would be that the acquisition of the target firm increases the value of the acquiring firm’s
capabilities. Further, by creating a sample of target firms that only bring technology and
knowledge to the acquiring firm, this alternative interpretation is actually an interaction between
the acquisition of external technology and the valuation of the acquirers’ technological
capabilities.
Now consider the fully constituted interaction model below:

158
( ) ( ) (A.2)
where Event is a dummy variable that equals one if the acquisition occurs. Since all the
acquisitions occur in the sample, the Event dummy variable is always equal to one. Assuming an
efficient market (Fama, 1970), an acquirer’s stock price should already reflect the value of all
prior public information which includes the acquirer’s technological capabilities. Therefore,
since β3 and β4 represent the impact that the capabilities have on an acquirer’s stock price when
there is no acquisition, β3 and β4 equal zero as no new information has been released that would
cause either of these variables to be revalued since no acquisition occurred. This reduces
Equation A.2 to Equation A.1 because Event is always equal to one leaving β0 as the intercept or
the amount of value the acquisition creates when the target firm and the acquiring firm both
possess zero technological capabilities; β1 and β2 are reduced to reflecting the impact of ATC and
TTC, respectively, as Event always equals one; and β3 and β4 are dropped since no new
information is provided when the acquisition is not announced leaving β3 and β4 to always equal
zero.
What does this mean? And, why is this important? This allows researchers to test
interactive models without interacting variables. In this paper, since the sample is carefully
selected to only include small technology firms that are not contributing significant market share
that will affect the valuation of the acquisition, I am able to interpret the coefficients of the
acquirers’ technological capabilities and the targets’ technological capabilities as a test of
interaction. Therefore, a positive coefficient for the ATC would mean that acquiring the external
technology complements an acquirer’s own capabilities and a negative coefficient would mean
that acquiring the external technology substitutes an acquirer’s own capabilities (Siggelkow,
2002). Further, the TTC coefficient can be interpreted as increases in the technological

159
capabilities of the target firm increases the amount of acquirer shareholder value created from the
external technology.