zimmer holdings, inc. annual report 2012/media/files/z/zimmer...zimmer holdings, inc. annual report...
TRANSCRIPT

Zimmer Holdings, Inc., 345 East Main Street, P.O. Box 708, Warsaw, IN 46580, U.S.A.
Z IMMER HOLDINGS, INC. annual repor t 2012

Operating ProfitZimmer continued to deliver
exceptional operating profit
margins in 2012, driven by
progress in the Company’s
business transformation programs.
Operating Cash FlowThrough disciplined
management of capital, Zimmer
supported new product
innovation and delivered
increased value to stockholders
while maintaining high levels of
operating cash flow.
Diluted Earnings per ShareProgress in Zimmer’s value creation agenda supported double-digit growth in adjusted earnings per share for 2012.
Net SalesStrong performances from a
number of international
markets and new product
introductions across Zimmer’s
portfolio contributed to net
sales of $4.47 billion in 2012.
(1) “Constant Currency” refers to sales growth resulting from translating current and prior-period sales at the same predetermined foreign currency exchange rate. The translated results are then used to determine year-over-year percentage increases or decreases that exclude the effect of changes in foreign currency exchange rates. See the reconciliation of this non-GAAP financial measure to the most directly comparable GAAP measure on page 76.
(2) “Adjusted” refers to performance measures that exclude inventory step-up and other inventory charges, special items, the provision for certain Durom® Acetabular Component product claims, goodwill impairment, and net curtailment and settlement and related tax benefits and other certain tax adjustments. See the reconciliations of these non-GAAP financial measures to the most directly comparable GAAP measures on page 76.
% Change 2011-2012
ConstantSales b y Geographic Segment 2008 2009 2010 2011 2012 Reported Currency(1)
Americas $2,354 $2,372 $2,432 $2,441 $2,476 1% 2%
Europe 1,179 1,119 1,099 1,214 1,178 -3% 3%
Asia Pacific 588 604 689 797 818 3% 3%
Consolidated $4,121 $4,095 $4,220 $4,452 $4,472 0% 2%
% Change 2011-2012
ConstantSales b y Product Category 2008 2009 2010 2011 2012 Reported Currency(1)
Reconstructive $3,162 $3,120 $3,202 $3,344 $3,331 0% 1%
Knees 1,761 1,756 1,790 1,825 1,815 -1% 1%
Hips 1,280 1,228 1,262 1,356 1,342 -1% 1%
Extremities 121 136 150 163 174 6% 8%
Dental 227 205 219 248 238 -4% -2%
Trauma 222 235 246 286 308 8% 9%
Spine 230 253 234 225 209 -7% -6%
Surgical & Other 280 282 319 349 386 11% 12%
Consolidated $4,121 $4,095 $4,220 $4,452 $4,472 0% 2%
Financial Highlights (Dollars in millions except per-share amounts)
26%
18%
56%
8% 5%7%
5%
41%
30%
4%
11100908
4.05
3.94
3.72
3.32
4.33
2.97
1110090811100908
1,23
5
1,18
3
1,09
0
1,01
9
1,23
291
7
11100908 12 12 12
4.8
04.
03
12
5.3
04.
29
4,12
1
4,0
95
4,2
20
4,4
52
4,4
72 1,
269
1,0
24
1,31
91
,04
7
1,03
8
1,11
8
1,19
4
1,17
7
1,15
2
0% Reported
4% Adjusted(2)
2% Reported
-2% Reported
10% Adjusted(2)
6% Reported
$0
$50
$100
$150
2007 2008 2009 2010 2011 2012
Zimmer Holdings, Inc. $100 $61 $89 $81 $81 $102
S&P 500 Stock Index 100 63 80 92 94 109
S&P 500 Health Care Equipment Index 100 73 93 91 90 105
Corporate Information (As of March 21, 2013)
Board of Directors
John L. Mc Goldrick Chairman of the Board, Zimmer Holdings, Inc. Special Advisor, International AIDS Vaccine Initiative
Christopher B. Begley Retired Executive Chairman and Chief Executive Officer, Hospira, Inc.
Betsy J. Bernard Retired President, AT&T Corp.
Gail K. Boudreaux Chief Executive Officer, UnitedHealthcare Executive Vice President, UnitedHealth Group Marc N. Casper President and Chief Executive Officer, Thermo Fisher Scientific Inc.
David C. Dvorak President and Chief Executive Officer, Zimmer Holdings, Inc.
Larry C. Glasscock Retired Chairman, President and Chief Executive Officer, WellPoint, Inc.
Robert A. Hagemann Senior Vice President and Chief Financial Officer, Quest Diagnostics Incorporated
Arthur J. Higgins Consultant, Blackstone Healthcare Partners
Cecil B. Pickett, Ph.D. Retired President, Research and Development, Biogen Idec Inc.
Management Team
David C. Dvorak President and Chief Executive Officer
James T. Crines Executive Vice President, Finance and Chief Financial Officer
Joseph A. Cucolo President, Americas
Derek M. Davis Vice President, Finance and Corporate Controller and Chief Accounting Officer
Norman D. Finch Jr. Vice President, Associate General Counsel and Chief Compliance Officer
William P. Fisher Senior Vice President, Global Human Resources
Katarzyna Mazur-Hofsaess, M.D., Ph.D. President, Europe, Middle East and Africa Reconstructive
Jeffery A. McCaulley President, Zimmer Reconstructive
Bruno A. Melzi Chairman, Europe, Middle East and Africa
Emmanuel Nyakako Senior Vice President, Global Quality and Regulatory Affairs
Stephen H. L. Ooi President, Asia Pacific
Chad F. Phipps Senior Vice President, General Counsel and Secretary
Richard C. Stair Senior Vice President, Global Operations and Logistics
This annual report is printed on paper that contains 10% post-consumer waste.
Stock Performance Graph Comparison of Cumulative Total Return for years ended December 31
Assumes $100 was invested on December 31, 2007 in Zimmer common stock and each index and dividends were reinvested. Returns over the indicated period should not be considered indicative of future returns.
Stockholder Information
Headquarters Zimmer Holdings, Inc. 345 East Main Street Warsaw, IN 46580, U.S.A. +1-574-267-6131 www.zimmer.com
Stock Listing Zimmer is listed on the New York Stock Exchange and the SIX Swiss Exchange under the symbol ZMH.
Transfer Agent Communications concerning stock transfer requirements, loss of certificates and change of address should be directed to Zimmer’s Transfer Agent:
American Stock Transfer & Trust Company, LLC 6201 15th Avenue Brooklyn, NY 11219 +1-888-552-8493 (domestic) +1-718-921-8124 (international) Email: [email protected] Website: http://www.amstock.com
Investor Relations Zimmer invites stockholders, security analysts, portfolio managers and other interested parties to contact:
Robert J. Marshall Jr. Vice President, Investor Relations and Treasurer +1-574-371-8042 [email protected]
James T. Crines Executive Vice President, Finance and Chief Financial Officer +1-574-372-4264 [email protected]
To obtain a free copy of Zimmer’s annual report on form 10-K, quarterly reports on form 10-Q, news releases, earnings releases, proxy statements, or to obtain Zimmer’s financial calendar, access SEC filings, listen to earnings calls, or to look up Zimmer stock quotes, please visit http://investor.zimmer.com or call +1-866-688-7656.
Independent Auditors PricewaterhouseCoopers LLP Chicago, IL, U.S.A.
Dividend Reinvestment and Stock Purchase Plan
American Stock Transfer & Trust Company, LLC administers the Investors Choice Dividend Reinvestment and Stock Purchase Plan, which allows registered stockholders to purchase additional shares of Zimmer common stock through the automatic investment of dividends. The plan also allows registered stockhold-ers to purchase shares with optional cash investments of at least $25, either by check or by automatic deductions from checking or savings accounts. The maximum optional cash investment is $10,000 per transaction. Please direct inquiries concerning the plan to: Zimmer Holdings, Inc., c/o American Stock Transfer & Trust Company, LLC, P.O. Box 922, Wall Street Station, New York, NY 10269-0560, +1-888-552-8493 (domestic), +1-718-921-8124 (international)

To Our Stockholders:
For over 85 years, Zimmer has pioneered breakthrough technologies that improve the quality of life for patients suffering from various musculoskeletal conditions. Our success is founded on a culture of innovation, quality and exceptional customer service. Beyond our leading products, Zimmer has become the most trusted name in the industry for one simple reason — we are uniquely committed to the musculoskeletal healthcare market and to advancing the standard of musculoskeletal care.
As we work to build an even stronger Zimmer for the future, we are keenly focused on three key strategic priorities: our innovation and growth platform; our transformation initiatives; and a disciplined approach to capital allocation.
Success in these areas enabled Zimmer to deliver 2012 sales totaling $4.47 billion, with fully diluted adjusted earnings per share of $5.30, an increase of 10.4% over the prior year. These 2012 results were driven by strong performances in a number of geographies and product categories, as well as significant progress in executing our global transformation programs and broader operational excellence agenda.
In 2012, Zimmer once again achieved our financial commitments. But perhaps our most significant accomplishments related to product and technology innovation. Throughout the past year, we achieved significant milestones for a number of innovative products and technologies, in both our core franchises and in adjacent musculoskeletal markets. This array of new technologies positions the Company to accelerate growth in 2013 and beyond.
Innovation and Growth Across the Musculoskeletal Continuum of Care
Throughout Zimmer’s history, the Company has worked at the forefront of innovation in materials science and the design of implants and instrumentation, bringing to market a series of revolutionary technologies that have greatly expanded treatment options across the continuum of musculoskeletal healthcare. In 2012, Zimmer advanced a number of clinically differentiated new products through regulatory clearance and the initial stages of commercialization.
Of great significance, Zimmer gained regulatory approval of our next generation family of knee solutions, PersonaTM, The Personalized Knee System. Building on the clinical legacy of our NexGen® and Natural Knee® Systems, the Persona Knee enables surgeons to personalize each patient’s treatment. The fundamental design principle behind this differentiated system is to achieve the “forgotten knee” by improving fit for a more natural feeling knee. Zimmer employed a broad scientific approach in the design of the Persona Knee, drawing upon morphological science, kinesiology, psychology and materials science to develop a system that more closely replicates the natural biomechanics of the knee. Persona, The Personalized Knee System, also incorporates major advances in instrumentation technology and surgical kitting, supporting a more accurate and reproducible procedure, as well as providing a number of efficiency benefits to hospitals. Launching a system of this magnitude will involve multiple phases over the next several years, but we were pleased to begin its introduction in late 2012.
Complementing the Persona System, and strengthening the value proposition of more accurate and streamlined procedures, in 2012 Zimmer expanded our Intelligent Instrumentation offerings. In addition to Zimmer® Patient Specific Instruments and the eLIBRA® Dynamic Knee Balancing System, the Company received clearance for a new flagship technology in our Intelligent Instrument portfolio, iASSISTTM Knee, The Personalized Guidance SystemTM. This new platform technology delivers on the promise of accurate implant positioning and alignment validation without the cost and complexity associated with competitive navigation and robotic systems.

Also in 2012, Zimmer continued our expansion into new, adjacent categories of the musculoskeletal market. Laying the foundation for our entry into the lower extremities market, Zimmer received clearance for our Trabecular MetalTM Total Ankle, an exciting new system supporting an innovative lateral surgical approach. The Company also further established technologies acquired through external development efforts, including new generations of Zimmer Universal Power Equipment and the XtraFix® external fixation system for traumatic injuries.
Furthering our commitment to provide comprehensive solutions addressing the needs of patients across the continuum of musculoskeletal healthcare, Zimmer continued to build out our portfolio of early intervention products. These offerings extend our reach into joint preservation and the early treatment of arthritis. In addition to DeNovo® NT Natural Tissue Graft and Chondrofix® Osteochondral Allograft, Zimmer began the broader introduction of Gel-One® Cross-linked Hyaluronate in 2012. This product is used to relieve pain earlier in the treatment cycle for patients with osteoarthritis of the knee. Comprising a 3 mL single injection, Gel-One Hyaluronate offers the lowest total volume complete treatment available on the market.
Advancing Zimmer’s leadership in orthopaedic materials science, the Company introduced Vivacit-E® advanced bearing technology in 2012. A scientifically advanced bearing surface material incorporating Vitamin E, Vivacit-E offers extraordinary strength, ultra-low wear and exceptional oxidative stability for long-term performance. Applications of this exciting new proprietary technology include the Continuum® Acetabular System, the Zimmer® Unicompartmental Knee System and the Persona Knee System, with more applications on the horizon.
The remarkable range of new offerings Zimmer began introducing in 2012 represents the culmination of significant research and development investments, and is indicative of our continuing cycle of innovation. A number of these products address new anatomical sites for the Company, or are in adjacent market segments in which we had not previously competed, generating incremental revenues.
Transformation Initiatives: Responding to Change and Driving Growth
To generate the resources necessary to support investments in growth drivers, including research and development and product innovation, Zimmer continued to advance our global transformation and operational excellence program in 2012.
This Company-wide transformation agenda includes efficiency and quality initiatives across all corporate and commercial operations. Completed and ongoing programs include a management delayering,
Trabecular Triumph: Celebrating 15 Years of Clinical Success with Trabecular MetalTM Technology
In 2012, Zimmer celebrated the 15-year anniversary of our Trabecular Metal Technology, featured on the front cover of this report. A core platform technology for Zimmer, Trabecular Metal Technology represents one of the greatest innovations in orthopaedics. No other porous metal material is designed to so closely match the unique structure, function and physiology of trabecular bone. Trabecular Metal Material features unrivaled porosity, which helps living tissue and bone integrate with joint replacements and implants.
Since its introduction in 1997, Trabecular Metal Technology has been used in more than 800,000 surgeries worldwide. The technology has been featured in more than 250 clinical publications, and countless surgeons have adopted it for use with their patients.
Over the past 15 years, Zimmer has expanded the applications of Trabecular Metal Technology across our portfolio. From its first applications in hip replacement surgery, Trabecular Metal Technology has expanded to knee, shoulder and ankle replacements, trauma applications, spinal implants, dental implants and bone void fillers, and augments used for repair of oncology-related defects.
As a key differentiator for Zimmer, this platform technology positions the Company as the clear leader in biologic fixation, an emerging preference among the orthopaedic surgeon community. We continue to discover even more attributes of this unique technology, which can potentially support exciting and novel applications – the future is bright for Trabecular Metal Technology.
1 Bobyn JD, Hacking SA, Chan SP, et al. Characterization of new porous tantalum biomaterial for reconstructive orthopaedics. Scientific Exhibition: 66th Annual Meeting of the American Academy of Orthopaedic Surgeons; 1999; Anaheim, CA.
Gel-One® is a registered trademark of Seikagaku Corporation.

the establishment of shared service centers for many of our support functions and strategic sourcing and manufacturing excellence initiatives. We also are making progress against longer-term commercial excellence programs that will ultimately lead to more efficient sales, distribution and logistics performance.
As well as making Zimmer a more effective organization, our transformation programs support growth-driving investments and provide Zimmer with the opportunity to expand operating margins and enhance returns on capital investments. These savings also enable the Company to respond effectively to external challenges.
A significant example is the passage of the Affordable Care Act that imposed an onerous new tax on the medical device industry in the United States, effective as of January 1, 2013. Our intent is to fully offset the medical device excise tax with the savings from our transformation programs. Paying this tax draws upon resources that would otherwise be deployed in innovation programs and other job-creating, strategic priorities, and we will continue to work with our industry peers to petition for its full repeal. We believe there is growing bipartisan support in Congress to accomplish repeal.
Disciplined Capital Allocation: Creating Value for Stockholders
Zimmer’s capital deployment philosophy is well established – our goal is to enhance stockholder returns by delivering excess cash to stockholders through a combination of share repurchases and dividend payments. We also continue to seek investment opportunities within the musculoskeletal market that strengthen our leadership position in developed and emerging businesses and geographic markets, subject to rigorous return requirements.
In line with our commitment to return excess cash to stockholders, Zimmer continued our broad share repurchase program and initiated a dividend program in 2012, returning $94 million in cash dividends, an annual dividend of 72 cents per share.
In 2012, the Company completed several prudent bolt-on acquisitions that strengthen and extend our reach into adjacent markets. Early in 2012, we announced the acquisition of Synvasive Technology, the developer of the leading STABLECUT® surgical cutting technology, and the eLIBRA Dynamic Knee Balancing System, the industry’s premiere offering for flexion-gap and soft tissue balancing. In the second quarter, the Company completed the acquisition of Exopro, a manufacturer of differentiated dental implant offerings, developed in the PI Brånemark philosophy, for the Brazilian market. This acquisition strengthens our position in this important emerging market. Finally, at the close of the third quarter, Zimmer further expanded our surgical products portfolio through the acquisition of Dornoch Medical Systems. Dornoch offers a range of medical waste fluid disposal equipment and accessories, including its proprietary Transposal® integrated infectious fluid collection and disposal system.
Positioned for Success: Accelerated Growth in Established and Emerging Markets
The musculoskeletal market remains an exciting space with extraordinary growth potential in both established and emerging markets. The drivers of this growth are well documented, including aging populations around the globe. There also exists an increasing base of data indicating that the solutions Zimmer provides are cost-effective, generating savings relative to the management of chronic advanced-stage osteoarthritis.
Gel-One® is a registered trademark of Seikagaku Corporation.

With the industry’s most comprehensive portfolio of products addressing the entire continuum of musculoskeletal health, combined with an expanding global footprint supported by opportunistic acquisitions in key emerging markets, Zimmer is uniquely positioned to take advantage of present and future opportunities.
The coming years will be decisive for Zimmer, as we maximize the benefits of an unprecedented pipeline of new product and technology systems in our core franchises, and in a number of adjacent musculoskeletal markets, delivering new opportunities for expanded top-line growth.
With an unwavering focus on our strategic priorities, we will continue to create value for our stockholders, while serving our customers with pride. We are truly fortunate to work in an industry that delivers the promise of restored mobility and revitalized lives to millions of patients around the world.
John L. Mc Goldrick Chairman
David C. Dvorak President and Chief Executive Officer

UNITED STATES SECURITIES AND EXCHANGE COMMISSIONWashington, D.C. 20549
FORM 10-KANNUAL REPORT PURSUANT TO SECTION 13 OR 15(d)
OF THE SECURITIES EXCHANGE ACT OF 1934For year ended December 31, 2012
Commission file number 001-16407
ZIMMER HOLDINGS, INC.(Exact name of registrant as specified in its charter)
Delaware 13-4151777(State of Incorporation) (IRS Employer Identification No.)
345 East Main Street Warsaw, Indiana 46580
(Address of principal executive offices) (Zip Code)
Registrant’s telephone number, including area code: (574) 267-6131
Securities registered pursuant to Section 12(b) of the Act:
Title of each class Name of each exchange on which registeredCommon Stock, $.01 par value New York Stock Exchange
Securities registered pursuant to Section 12(g) of the Act: None
Indicate by check mark if the registrant is a well-known seasoned issuer, as defined in Rule 405 of the SecuritiesAct. Yes Í No ‘
Indicate by check mark if the registrant is not required to file reports pursuant to Section 13 or Section 15(d) of theAct. Yes ‘ No Í
Indicate by check mark whether the registrant (1) has filed all reports required to be filed by Section 13 or 15(d) of the SecuritiesExchange Act of 1934 during the preceding 12 months (or for such shorter period that the registrant was required to file suchreports), and (2) has been subject to such filing requirements for the past 90 days. Yes Í No ‘
Indicate by check mark whether the registrant has submitted electronically and posted on its corporate Web site, if any, everyInteractive Data File required to be submitted and posted pursuant to Rule 405 of Regulation S-T (§ 232.405 of this chapter) duringthe preceding 12 months (or for such shorter period that the registrant was required to submit and post suchfiles). Yes Í No ‘
Indicate by check mark if disclosure of delinquent filers pursuant to Item 405 of Regulation S-K is not contained herein, and will notbe contained, to the best of the registrant’s knowledge, in definitive proxy or information statements incorporated by reference inPart III of this Form 10-K or any amendment to this Form 10-K. ‘
Indicate by checkmark whether the registrant is a large accelerated filer, an accelerated filer, a non-accelerated filer or a smallerreporting company. See the definitions of “large accelerated filer”, “accelerated filer” and “smaller reporting company” in Rule12b-2 of the Exchange Act. (Check One):
Large accelerated filer Í Accelerated filer ‘ Non-accelerated filer ‘ Smaller reporting company ‘
(Do not check if a smaller reporting company)
Indicate by checkmark whether the registrant is a shell company (as defined Exchange Act Rule 12b-2). Yes ‘ No Í
The aggregate market value of shares held by non-affiliates was $11,217,437,561 (based on the closing price of these shares on theNew York Stock Exchange on June 29, 2012 and assuming solely for the purpose of this calculation that all directors and executiveofficers of the registrant are “affiliates”). As of February 15, 2013, 169,354,131 shares of the registrant’s $.01 par value commonstock were outstanding.
Documents Incorporated by ReferenceDocument Form 10-K
Portions of the Proxy Statement with respect to the 2013 Annual Meeting of Stockholders Part III

ZIMMER HOLDINGS, INC. 2012 FORM 10-K ANNUAL REPORT
Cautionary Note About Forward-Looking StatementsThis Annual Report on Form 10-K includes “forward-looking” statements within the meaning of federal securities laws.
Forward-looking statements can be identified by the fact that they do not relate strictly to historical or current facts. They ofteninclude words such as “may,” “will,” “should,” “would,” “could,” “anticipate,” “expect,” “plan,” “seek,” “believe,” “predict,”“estimate,” “potential,” “project,” “target,” “forecast,” “intend,” “strategy,” “future,” “opportunity,” and similar expressions.Forward-looking statements are based on current expectations and assumptions that are subject to risks and uncertainties whichmay cause actual results to differ materially from the forward-looking statements. A detailed discussion of risks and uncertaintiesthat could cause actual results and events to differ materially from such forward-looking statements is included in the section titled“Risk Factors” (refer to Part I, Item 1A of this report). Readers of this report are cautioned not to place undue reliance on theseforward-looking statements. While we believe the assumptions on which the forward-looking statements are based are reasonable,there can be no assurance that these forward-looking statements will prove to be accurate. We expressly disclaim any obligation toupdate or revise any forward-looking statements, whether as a result of new information, future events or otherwise. You areadvised, however, to consult any further disclosures we make on related subjects in our Quarterly Reports on Form 10-Q andCurrent Reports on Form 8-K.
Table of Contents Page
PART I 3
Item 1. Business 3
Item 1A. Risk Factors 9
Item 1B. Unresolved Staff Comments 14
Item 2. Properties 15
Item 3. Legal Proceedings 15
Item 4. Mine Safety Disclosures 15
PART II 16
Item 5. Market for the Registrant’s Common Equity, Related Stockholder Matters and Issuer Purchases of EquitySecurities 16
Item 6. Selected Financial Data 17
Item 7. Management’s Discussion and Analysis of Financial Condition and Results of Operations 18
Item 7A. Quantitative and Qualitative Disclosures About Market Risk 28
Item 8. Financial Statements and Supplementary Data 32
Item 9. Changes in and Disagreements With Accountants on Accounting and Financial Disclosure 66
Item 9A. Controls and Procedures 66
Item 9B. Other Information 66
PART III 67
Item 10. Directors, Executive Officers and Corporate Governance 67
Item 11. Executive Compensation 67
Item 12. Security Ownership of Certain Beneficial Owners and Management and Related Stockholder Matters 67
Item 13. Certain Relationships and Related Transactions and Director Independence 67
Item 14. Principal Accounting Fees and Services 67
PART IV 68
Item 15. Exhibits, Financial Statement Schedules 68
2
ZIMMER HOLDINGS, INC. 2012 FORM 10-K ANNUAL REPORT
PART I
ITEM 1. Business
OVERVIEW
We are a global leader in the design, development,manufacture and marketing of orthopaedic reconstructive,spinal and trauma devices, biologics, dental implants andrelated surgical products. We also provide other healthcarerelated services. In this report, “Zimmer,” “we,” “us,” “our” andsimilar words refer collectively to Zimmer Holdings, Inc. and itssubsidiaries. Zimmer Holdings refers to the parent companyonly.
Zimmer Holdings was incorporated in Delaware in 2001.Our history dates to 1927, when Zimmer ManufacturingCompany, a predecessor, was founded in Warsaw, Indiana. OnAugust 6, 2001, Zimmer Holdings was spun off from its formerparent and became an independent public company.
CUSTOMERS, SALES AND MARKETING
Our primary customers include orthopaedic surgeons,neurosurgeons, oral surgeons, dentists, hospitals, stockingdistributors, healthcare dealers and, in their capacity asagents, healthcare purchasing organizations or buying groups.These customers range from large multinational enterprises toindependent clinicians and dentists.
We have operations in more than 25 countries and marketproducts in more than 100 countries. We manage ouroperations through three major geographic segments – theAmericas, which is comprised principally of the U.S. andincludes other North, Central and South American markets;Europe, which is comprised principally of Europe and includesthe Middle East and Africa markets; and Asia Pacific, which iscomprised primarily of Japan and Australia and includes otherAsian and Pacific markets.
We market and sell products through three principalchannels: 1) direct to healthcare institutions, such as hospitalsor direct channel accounts; 2) through stocking distributorsand healthcare dealers; and 3) directly to dental practices anddental laboratories. With direct channel accounts, inventory isgenerally consigned to sales agents or customers. With sales tostocking distributors, healthcare dealers, dental practices anddental laboratories, title to product passes upon shipment orupon implantation of the product. Direct channel accountsrepresented approximately 75 percent of our net sales in 2012.No individual direct channel account, stocking distributor,healthcare dealer, dental practice or dental laboratoryaccounted for more than 1 percent of our net sales for 2012.
We stock inventory in our warehouse facilities and retaintitle to consigned inventory in sufficient quantities so thatproducts are available when needed for surgical procedures.Safety stock levels are determined based on a number offactors, including demand, manufacturing lead times andquantities required to maintain service levels. We also carrytrade accounts receivable balances based on credit terms thatare generally consistent with local market practices.
We utilize a network of sales associates, sales managersand support personnel, most of whom are employed orcontracted by independent distributors and sales agencies. Weinvest a significant amount of time and expense in trainingsales associates in how to use specific products and how tobest inform surgeons of product features and uses. Sales forcerepresentatives must have strong technical selling skills andmedical education to provide technical support for surgeons.
In response to the different healthcare systemsthroughout the world, our sales and marketing strategies andorganizational structures differ by region. We utilize a globalapproach to sales force training, marketing and medicaleducation to provide consistent, high quality service.Additionally, we keep current with key surgical developmentsand other issues related to orthopaedic surgeons,neurosurgeons, dentists and oral surgeons and the medicalprocedures they perform.
The following is a summary of our three reportablesegments. See Note 17 to the consolidated financial statementsfor more information regarding our segments.
Americas. The Americas is our largest geographicsegment, accounting for $2,476.3 million, or 56 percent, of2012 net sales, with the U.S. accounting for 92 percent of netsales in this region. The U.S. sales force consists of acombination of employees and independent sales agents, mostof whom sell products exclusively for Zimmer. The sales forcein the U.S. receives a commission on product sales and isresponsible for many operating decisions and costs.
In this region, we contract with group purchasingorganizations and managed care accounts and have promotedunit growth by offering volume discounts to customerhealthcare institutions within a specified group. Generally, weare designated as one of several preferred purchasing sourcesfor specified products, although members are not obligated topurchase our products. Contracts with group purchasingorganizations generally have a term of three years, withextensions as warranted.
In the Americas, we monitor and rank independent salesagents and our direct sales force across a range of performancemetrics, including the achievement of sales targets andmaintenance of efficient levels of working capital.
Europe. The European geographic segment accountedfor $1,177.4 million, or 26 percent, of 2012 net sales, withFrance, Germany, Italy, Spain, Switzerland and the UnitedKingdom collectively accounting for 70 percent of net sales inthe region. This segment also includes other key markets,including Benelux, Nordic, Central and Eastern Europe, theMiddle East and Africa. Our sales force in this segment iscomprised of direct sales associates, commissioned agents,independent distributors and sales support personnel. Weemphasize the advantages of our clinically proven, establisheddesigns and innovative solutions and new and enhancedmaterials and surfaces. In most European countries, healthcare
3

ZIMMER HOLDINGS, INC. 2012 FORM 10-K ANNUAL REPORT
is sponsored by the government and therefore governmentbudgets impact healthcare spending, which can affect our salesin this segment.
Asia Pacific. The Asia Pacific geographic segmentaccounted for $818.0 million, or 18 percent, of 2012 net sales,with Japan being the largest market within this segment,accounting for 51 percent of the region’s sales. This segmentalso includes key markets such as Australia, New Zealand,Korea, China, Taiwan, India, Thailand, Singapore, Hong Kongand Malaysia. In Japan and most countries in the Asia Pacificregion, we maintain a network of dealers, who act as orderagents on behalf of hospitals in the region, and salesassociates, who build and maintain relationships withorthopaedic surgeons, neurosurgeons and dental surgeons intheir markets. These sales associates cover over 7,000hospitals in the region. The knowledge and skills of these salesassociates play a critical role in providing service, productinformation and support to surgeons. In 2012, we opened aresearch and development center in Beijing, China, whichfocuses on products and technologies designed to meet theunique needs of Asian patients and their healthcare providers.
SEASONALITY
Our business is somewhat seasonal in nature, as many ofour products are used in elective procedures, which typicallydecline during the summer months and can increase at the endof the year once annual deductibles have been met on healthinsurance plans.
DISTRIBUTION
We operate distribution facilities domestically in Warsaw,Indiana; Southaven, Mississippi; and Carlsbad, California andinternationally in Australia, Austria, Belgium, Canada, theCzech Republic, China, Finland, France, Germany, Hong Kong,India, Italy, Japan, Korea, Malaysia, the Netherlands, NewZealand, Portugal, Russia, Singapore, South Africa, Spain,Sweden, Switzerland, Taiwan, Thailand and the UnitedKingdom.
We generally ship our orders via expedited courier. We donot consider our backlog of firm orders to be material to anunderstanding of our business.
PRODUCTS
Our products include orthopaedic reconstructiveimplants, spinal and trauma devices, biologics, dental implantsand related surgical products.
Orthopaedic reconstructive implants
Knee Implants
Total knee replacement surgeries typically include afemoral component, a patella (knee cap), a tibial tray and anarticular surface (placed on the tibial tray). Knee replacementsurgeries include first-time, or primary, joint replacementprocedures and revision procedures for the replacement,repair or enhancement of an implant or component from aprevious procedure. There are also procedures for partial
reconstruction of the knee, which treat limited kneedegeneration and involve the replacement of only one side, orcompartment, of the knee with a unicompartmental kneeprosthesis.
Our significant knee brands include the following:• NexGen® Complete Knee Solution• Natural-Knee® II System• Innex® Total Knee System• Persona™ The Personalized Knee System• Zimmer® Unicompartmental Knee System• Zimmer® Patient Specific Instruments• Zimmer® Segmental System
Hip Implants
Total hip replacement surgeries replace both the head ofthe femur and the socket portion of the pelvis (acetabulum) ofthe natural hip. Hip procedures include first time, or primary,joint replacement as well as revision procedures. Hip implantprocedures involve the use of bone cement to attach or affixthe prosthetic components to the surrounding bone, or arepress-fit into bone, which means that they have a surface thatbone affixes to through either ongrowth or ingrowthtechnologies.
Our significant hip brands include the following:• Zimmer® M/L Taper Hip Prosthesis and Zimmer M/L Taper
Hip Prosthesis with Kinectiv® Technology• Alloclassic® (Zweymüller®) Hip System• CLS® Spotorno® Hip System and CLS Brevius® Hip Stem
with Kinectiv Technology• Fitmore® Hip Stem• Continuum® Acetabular System• Trilogy® IT Acetabular System• Allofit® IT Alloclassic® Acetabular System• Trabecular MetalTM Modular Acetabular System
Extremity Implants
Our extremity portfolio, primarily shoulder and elbowproducts, is designed to treat arthritic conditions, soft tissueinjuries and fractures.
Our significant extremity brands include the following:• Trabecular Metal Reverse Shoulder System• Bigliani/Flatow® Complete Shoulder Solution Family• Zimmer® Anatomical Shoulder™ System• Zimmer® Trabecular Metal Total Ankle• Coonrad/Morrey Total Elbow
Dental Implants
Our dental products division manufactures and/ordistributes: (1) dental reconstructive implants — forindividuals who are totally without teeth or are missing one ormore teeth; (2) dental restorative products — aimed atproviding a more natural restoration to resemble the originalteeth; and (3) dental regenerative products — for soft tissueand bone rehabilitation.
Our significant dental brands include the following:• Tapered Screw-Vent® Implant System
4

ZIMMER HOLDINGS, INC. 2012 FORM 10-K ANNUAL REPORT
• Zimmer® Hex-Lock® Contour Abutment and RestorativeProducts
• Puros® Allograft Products1
Trauma
Trauma products include devices used to stabilizedamaged or broken bones and their surrounding tissues tosupport the body’s natural healing processes. Fractures aremost often stabilized using internal fixation devices such asplates, screws, nails, wires and pins, but may also be stabilizedusing external fixation devices. Biologics treatments are usedin conjunction with traditional trauma devices to encouragehealing and replace bone lost during an injury.
Our significant trauma brands include the following:• Zimmer® Natural Nail® System• NCB® Polyaxial Locking Plate System• XtraFix® External Fixation System• Zimmer® Periarticular Locking Plate System• Zimmer® Universal Locking System• Zimmer® Cable-Ready® System
Spine Implants
Our Spine products division designs, manufactures anddistributes medical devices and surgical instruments to delivercomprehensive solutions for those with back or neck paincaused by degenerative conditions, deformities or traumaticinjury of the spine.
Our significant spine brands include the following:• PathFinder NXT® Minimally Invasive Pedicle Screw System• Trabecular Metal Implants• Sequoia® Pedicle Screw System• Trinica® Select Anterior Cervical Plating System• Dynesys® Dynamic Stabilization System
Surgical
We develop, manufacture and market products thatsupport reconstructive, trauma, spine and dental implantprocedures, with a focus on bone cements, surgical wound sitemanagement and blood management.
Our significant surgical brands include the following:• PALACOS®2 Bone Cement• A.T.S.® Automatic Tourniquet Systems• Pulsavac® Plus, Pulsavac Plus AC and Pulsavac Plus LP
Wound Debridement Systems• Zimmer® Blood Reinfusion System• Hemovac® Blood Management System• Zimmer® Universal Power System
Biologics
Our research and development efforts include a Biologicsgroup based in Austin, Texas, with its own full-time staff anddedicated projects focusing on the development of a variety of
1 Manufactured for Zimmer Dental, Inc. by Tutogen Medical GmbH, anRTI Biologics, Inc. company2 Registered trademark of Heraeus Kulzer GmbH
biologic technologies for joint preservation and othermusculoskeletal applications. This group works on biologicalsolutions to repair and regenerate damaged or degeneratedmusculoskeletal tissues using biomaterials/cell therapies whichoffer the possibility of treating damaged joints by biologicalrepair rather than replacing them.
Significant biologics products we sell include thefollowing:• DeNovo® NT Natural Tissue Graft• Chondrofix® Osteochondral Allograft• Gel-One®3 Cross-linked Hyaluronate
RESEARCH AND DEVELOPMENT
We have extensive research and development activities todevelop new surgical techniques, materials, biologics andproduct designs. The research and development teams workclosely with our strategic brand marketing function. The rapidcommercialization of innovative new materials, biologicsproducts, implant and instrument designs and surgicaltechniques remains one of our core strategies and continues tobe an important driver of sales growth.
We are broadening our offerings in each of our productcategories and exploring new technologies with possibleapplications in multiple areas. Our primary research anddevelopment facility is located in Warsaw, Indiana. We haveother research and development personnel based in, amongother places, Beijing, China; Winterthur, Switzerland; Austin,Texas; Minneapolis, Minnesota; Carlsbad, California; Dover,Ohio; and Parsippany, New Jersey. As of December 31, 2012,we employed more than 1,000 research and developmentemployees worldwide.
We expect to continue to identify innovative technologies,which may include acquiring complementary products orbusinesses, establishing technology licensing arrangements orstrategic alliances.
GOVERNMENT REGULATION AND COMPLIANCE
We are subject to government regulation in the countriesin which we conduct business. In the U.S., numerous laws andregulations govern all the processes by which medical devicesare brought to market. These include, among others, theFederal Food, Drug and Cosmetic Act and regulations issuedor promulgated thereunder. The Food and DrugAdministration (FDA) has enacted regulations that control allaspects of the development, manufacture, advertising,promotion and postmarket surveillance of medical products,including medical devices. In addition, the FDA controls theaccess of products to market through processes designed toensure that only products that are safe and effective are madeavailable to the public.
Most of our new products fall into an FDA classificationthat requires the submission of a Premarket Notification(510(k)) to the FDA. This process requires us to demonstratethat the device to be marketed is at least as safe and effectiveas, that is, substantially equivalent to, a legally marketed
3 Registered trademark of Seikagaku Corporation
5
ZIMMER HOLDINGS, INC. 2012 FORM 10-K ANNUAL REPORT
device. We must submit information that supports oursubstantial equivalency claims. Before we can market the newdevice, we must receive an order from the FDA findingsubstantial equivalence and clearing the new device forcommercial distribution in the U.S.
Other devices we develop and market are in a category(class) for which the FDA has implemented stringent clinicalinvestigation and Premarket Approval (PMA) requirements.The PMA process requires us to provide clinical and laboratorydata that establishes that the new medical device is safe andeffective. The FDA will approve the new device for commercialdistribution if it determines that the data and information inthe PMA application constitute valid scientific evidence andthat there is reasonable assurance that the device is safe andeffective for its intended use(s).
All of our devices marketed in the U.S. have been clearedor approved by the FDA, with the exception of some deviceswhich were in commercial distribution prior to May 28, 1976.The FDA has grandfathered these devices, so new FDAsubmissions are not required.
Both before and after a product is commercially released,we have ongoing responsibilities under FDA regulations. TheFDA reviews design and manufacturing practices, labeling andrecord keeping, and manufacturers’ required reports ofadverse experiences and other information to identify potentialproblems with marketed medical devices. We are also subjectto periodic inspection by the FDA for compliance with theFDA’s Quality System regulations among other FDArequirements, such as restrictions on advertising andpromotion. The Quality System regulations govern themethods used in, and the facilities and controls used for, thedesign, manufacture, packaging and servicing of all finishedmedical devices intended for human use. If the FDA were toconclude that we are not in compliance with applicable laws orregulations, or that any of our medical devices are ineffectiveor pose an unreasonable health risk, the FDA could require usto notify healthcare professionals and others that the devicespresent unreasonable risks of substantial harm to the publichealth, order a recall, repair, replacement, or refund paymentof such devices, detain or seize adulterated or misbrandedmedical devices, or ban such medical devices.
The FDA may also impose operating restrictions, enjoinand/or restrain certain conduct resulting in violations ofapplicable law pertaining to medical devices, and assess civil orcriminal penalties against our officers, employees or us. TheFDA may also recommend prosecution to the U.S. Departmentof Justice.
The FDA, in cooperation with U.S. Customs and BorderProtection (CBP), administers controls over the import ofmedical devices into the U.S. The CBP imposes its ownregulatory requirements on the import of our products,including inspection and possible sanctions for noncompliance.We are also subject to foreign trade controls administered bycertain U.S. government agencies, including the Bureau ofIndustry and Security within the Commerce Department andthe Office of Foreign Assets Control within the TreasuryDepartment.
There are also requirements of state, local and foreigngovernments that we must comply with in the manufactureand marketing of our products.
In many of the foreign countries in which we market ourproducts, we are subject to local regulations affecting, amongother things, design and product standards, packagingrequirements and labeling requirements. Many of theregulations applicable to our devices and products in thesecountries are similar to those of the FDA. The membercountries of the European Union have adopted the EuropeanMedical Device Directive, which creates a single set of medicaldevice regulations for products marketed in all membercountries. Compliance with the Medical Device Directive andcertification to a quality system enable the manufacturer toplace a CE mark on its products. To obtain authorization toaffix the CE mark to a product, a recognized EuropeanNotified Body must assess a manufacturer’s quality systemsand the product’s conformity to the requirements of theMedical Device Directive. We are subject to inspection by theNotified Bodies for compliance with these requirements.
Further, we are subject to various federal and state lawsconcerning healthcare fraud and abuse, including false claimsand anti-kickback laws. These laws are administered by, amongothers, the U.S. Department of Justice, the Office of InspectorGeneral of the Department of Health and Human Services andstate attorneys general. Many of these agencies have increasedtheir enforcement activities with respect to medical devicemanufacturers in recent years. Violations of these laws arepunishable by criminal and/or civil sanctions, including, insome instances, fines, imprisonment and, within the U.S.,exclusion from participation in government healthcareprograms, including Medicare, Medicaid and VeteransAdministration (VA) health programs.
Our operations in foreign countries are subject to theextraterritorial application of the U.S. Foreign CorruptPractices Act (FCPA). Our global operations are also subjectto foreign anti-corruption laws, such as the UK Bribery Act,among others. As part of our global compliance program, weseek to address anti-corruption risks proactively.
Our facilities and operations are also subject to complexfederal, state, local and foreign environmental andoccupational safety laws and regulations, including thoserelating to discharges of substances in the air, water and land,the handling, storage and disposal of wastes and the clean-upof properties by pollutants. We do not expect that the ongoingcosts of compliance with these environmental requirementswill have a material impact on our consolidated earnings,capital expenditures or competitive position.
COMPETITION
The orthopaedics and broader musculoskeletal careindustry is highly competitive. In the global markets forreconstructive implants, trauma and related surgical products,our major competitors include: the DePuy Synthes Companiesof Johnson & Johnson, Stryker Corporation, Biomet, Inc.,Smith & Nephew plc, Wright Medical Group, Inc. and Tornier,Inc.
6

ZIMMER HOLDINGS, INC. 2012 FORM 10-K ANNUAL REPORT
In the Americas geographic segment, we and the DePuySynthes Companies, Stryker Corporation, Biomet, Inc.,Smith & Nephew, Inc. (a subsidiary of Smith & Nephew plc)and Wright Medical Group, Inc. account for a large majority ofthe total reconstructive and trauma implant sales.
The European reconstructive implant and trauma productmarkets are more fragmented than the Americas or the AsiaPacific segments. The variety of philosophies held byEuropean surgeons regarding hip reconstruction, for example,has fostered the existence of many regional Europeancompanies, including Aesculap AG (a subsidiary of B. Braun),Waldemar LINK GmbH & Co., KG and Mathys AG, which, inaddition to the global competitors, compete with us. Many hipimplants sold in Europe are products developed specifically forthe European market. We intend to continue to develop andproduce specially tailored products to meet specific Europeanneeds.
In the Asia Pacific market for reconstructive implant andtrauma products, we compete primarily with the DePuySynthes Companies, Stryker Corporation, Smith & Nephew plcand Biomet, Inc., as well as regional companies, including JapanMedical Materials Corporation and Japan Medical DynamicMarketing, Inc. Factors, such as the dealer system and complexregulatory environments, make it difficult for smallercompanies, particularly those that are non-regional, to competeeffectively with the market leaders in the Asia Pacific region.
In the spinal implant category, we compete globallyprimarily with the spinal and biologic business of Medtronic,Inc., the DePuy Synthes Companies, Stryker Corporation,Biomet Spine (a subsidiary of Biomet, Inc.), NuVasive, Inc. andGlobus Medical, Inc.
In the dental implant category, we compete primarily withNobel Biocare Holding AG, Straumann Holding AG, DentsplyInternational and Biomet 3i (a subsidiary of Biomet, Inc.).
Competition within the industry is primarily based ontechnology, innovation, quality, reputation and customerservice. A key factor in our continuing success in the futurewill be our ability to develop new products and improveexisting products and technologies.
MANUFACTURING AND RAW MATERIALS
We manufacture our products at various sites. Oursignificant manufacturing locations include Warsaw, Indiana;Winterthur, Switzerland; Ponce, Puerto Rico; Dover, Ohio;Carlsbad, California; Parsippany, New Jersey; Shannon,Ireland; and Beijing, China. We also strategically outsourcesome manufacturing to qualified suppliers who are highlycapable of producing components.
We believe that our manufacturing facilities are among thebest in our industry in terms of automation and productivityand have the flexibility to accommodate future growth. Themanufacturing operations at these facilities are designed toincorporate the cellular concept for production and toimplement tenets of a manufacturing philosophy focused oncontinuous improvement efforts in product quality, lead timereduction and capacity optimization. Our continuous
improvement efforts are driven by Lean and Six Sigmamethodologies. In addition, at certain of our manufacturingfacilities, many of the employees are cross-trained to perform abroad array of operations.
We generally target operating our manufacturing facilitiesat optimal levels of total capacity. We continually evaluate thepotential to in-source and out-source production as part of ourmanufacturing strategy to provide value to our stakeholders.
We have improved our manufacturing processes to protectour profitability and offset the impact of inflationary costs. Wehave, for example, employed computer-assisted robots andmulti-axis grinders to precision polish medical devices;automated certain manufacturing and inspection processes,including on-machine inspection and processcontrols; purchased state-of-the-art equipment; in-sourcedcore products and processes; and negotiated cost reductionsfrom third-party suppliers.
We use a diverse and broad range of raw materials in themanufacturing of our products. We purchase all of our rawmaterials and select components used in manufacturing ourproducts from external suppliers. In addition, we purchasesome supplies from single sources for reasons of qualityassurance, sole source availability, cost effectiveness orconstraints resulting from regulatory requirements. We workclosely with our suppliers to assure continuity of supply whilemaintaining high quality and reliability. To date, we have notexperienced any significant difficulty in locating and obtainingthe materials necessary to fulfill our production schedules.
INTELLECTUAL PROPERTY
Patents and other proprietary rights are important to thecontinued success of our business. We also rely upon tradesecrets, know-how, continuing technological innovation andlicensing opportunities to develop and maintain ourcompetitive position. We protect our proprietary rightsthrough a variety of methods, including confidentialityagreements and proprietary information agreements withvendors, employees, consultants and others who may haveaccess to proprietary information. We own or control throughlicensing arrangements more than 4,500 issued patents andpatent applications throughout the world that relate to aspectsof the technology incorporated in many of our products.
EMPLOYEES
As of December 31, 2012, we employed more than 9,300employees worldwide, including more than 1,000 employeesdedicated to research and development. Approximately 5,000employees are located within the U.S. and approximately4,300 employees are located outside of the U.S., primarilythroughout Europe and in Japan. We have approximately 3,800employees dedicated to manufacturing our productsworldwide. The Warsaw, Indiana production facility employsapproximately 1,500 employees.
7

ZIMMER HOLDINGS, INC. 2012 FORM 10-K ANNUAL REPORT
Approximately 150 U.S. employees are members of atrade union covered by a collective bargaining agreement. Wehave a collective bargaining agreement with the United Steel,Paper and Forestry, Rubber, Manufacturing, Energy, Allied
Industrial and Service Workers International Union, AFL-CIO,CLC for and on behalf of Local 2737-15 covering employees atthe Dover, Ohio facility, which continues in effect untilMay 15, 2015.
EXECUTIVE OFFICERS
The following table sets forth certain information with respect to our executive officers as of February 20, 2013.
Name Age Position
David C. Dvorak 49 President and Chief Executive Officer
James T. Crines 53 Executive Vice President, Finance and Chief Financial Officer
Joseph A. Cucolo 53 President, Americas Sales
Derek M. Davis 44 Vice President, Finance and Corporate Controller and Chief Accounting Officer
Jeffery A. McCaulley 47 President, Zimmer Reconstructive
Bruno A. Melzi 65 Chairman, Europe, Middle East and Africa
Stephen H.L. Ooi 59 President, Asia Pacific
Jeffrey B. Paulsen 52 Group President, Global Businesses
Chad F. Phipps 41 Senior Vice President, General Counsel and Secretary
Mr. Dvorak was appointed President, Chief Executive Officerand a member of the Board of Directors in May 2007. FromDecember 2005 to April 2007, he served as Group President,Global Businesses and Chief Legal Officer. Prior to that, he hadserved as Executive Vice President, Corporate Services, ChiefCounsel and Secretary, as well as Chief Compliance Officer,since October 2003. Mr. Dvorak joined Zimmer in 2001.
Mr. Crines was appointed Executive Vice President, Financeand Chief Financial Officer in May 2007. From December 2005to April 2007, he served as Senior Vice President, Finance,Operations and Corporate Controller and Chief AccountingOfficer. Prior to that, he had served as Senior Vice President,Finance/Controller and Information Technology since October2003. Mr. Crines joined Zimmer in 1995.
Mr. Cucolo was appointed President, Americas Sales inSeptember 2012. He is responsible for sales and managementof the direct and indirect sales channels in the Americasregion, including the United States, Canada and LatinAmerica. From 1997 until he joined Zimmer as President,Americas Sales, Mr. Cucolo was sole owner and President ofZimmer New England, Inc., an independent third-partydistributor of Zimmer products in the northeast region of theUnited States. Prior to that, Mr. Cucolo was employed byZimmer as a sales representative and territory manager in theNew York area from 1987 to 1997.
Mr. Davis was appointed Vice President, Finance and CorporateController and Chief Accounting Officer in May 2007. He hasresponsibility for internal and external reporting, planning andanalysis, and corporate and business unit accounting. FromMarch 2006 to May 2007, he served as Director, FinancialPlanning and Accounting. Prior to that, he had served asDirector, Finance, Operations and Logistics since December2003. Mr. Davis joined Zimmer in 2003.
Mr. McCaulley was appointed President, Zimmer Reconstructivein November 2008. He has overall responsibility for the GlobalReconstructive Division, including direct responsibility forGlobal Brand Management, Product Research andDevelopment, Quality and Regulatory Affairs, and MedicalTraining and Education, as well as Americas MarketingManagement. Prior to joining Zimmer, he served as Presidentand Chief Executive Officer of the Health Division of Wolters
Kluwer from 2005, Vice President and General Manager of theDiabetes Division of Medtronic, Inc. from 2002, and spent 14years with GE Healthcare in numerous positions of increasingresponsibility, including President and Chief Executive Officerof GE Clinical Services from 2000.
Mr. Melzi was appointed Chairman, Europe, Middle East andAfrica in October 2003. He is responsible for the sales,marketing and distribution of products in the European,Middle Eastern and African regions. Mr. Melzi joined Zimmerin 1990. Mr. Melzi has announced his intention to retire fromhis current positions as of March 31, 2013. We have enteredinto a post-retirement directorship agreement with Mr. Melzi,whereby he will perform consulting services for us for a three-year period beginning May 1, 2013.
Mr. Ooi was appointed President, Asia Pacific in December2005. He is responsible for the sales, marketing anddistribution of products in the Asia Pacific region. Prior tothat, he had served as President, Australasia since September2003. Mr. Ooi joined Zimmer in 1986.
Mr. Paulsen was appointed Group President, Global Businessesin December 2009. He has responsibility for Zimmer Spine,Zimmer Dental, Zimmer Trauma and Zimmer Surgical. Prior tojoining Zimmer, Mr. Paulsen served as Chief Operating Officerof MPS Group, Inc., a privately held environmental servicesand facility management firm, from September 2008 toDecember 2009. Prior to that, he served as Group President ofTriMas Corporation, a specialty manufacturing company, fromJanuary 2007 to June 2008. Previously, Mr. Paulsen had held anumber of increasingly responsible executive roles at StrykerCorporation from 1996 to December 2006, including President,Orthopaedic Reconstructive Division.
Mr. Phipps was appointed Senior Vice President, GeneralCounsel and Secretary in May 2007. He has globalresponsibility for our legal affairs and he serves as Secretary tothe Board of Directors. Mr. Phipps also oversees ourGovernment Affairs, Corporate Marketing andCommunications and Public Relations activities. FromDecember 2005 to May 2007, he served as Associate GeneralCounsel and Corporate Secretary. Prior to that, he had servedas Associate Counsel and Assistant Secretary since September2003. Mr. Phipps joined Zimmer in 2003.
8
ZIMMER HOLDINGS, INC. 2012 FORM 10-K ANNUAL REPORT
AVAILABLE INFORMATION
Our Internet address is www.zimmer.com. We routinelypost important information for investors on our website in the“Investor Relations” section, which may be accessed from ourhomepage at www.zimmer.com or directly at http://investor.zimmer.com. We use this website as a means ofdisclosing material, non-public information and for complyingwith our disclosure obligations under Regulation FD.Accordingly, investors should monitor the Investor Relationssection of our website, in addition to following our pressreleases, Securities and Exchange Commission (SEC) filings,public conference calls, presentations and webcasts. Our goalis to maintain the Investor Relations website as a portalthrough which investors can easily find or navigate to pertinentinformation about us, free of charge, including:• our Annual Reports on Form 10-K, Quarterly Reports on
Form 10-Q, Current Reports on Form 8-K and amendmentsto those reports filed or furnished pursuant to Section 13(a)or 15(d) of the Securities Exchange Act of 1934, asamended (Exchange Act), as soon as reasonably practicableafter we electronically file that material with or furnish it tothe SEC;
• announcements of investor conferences and events at whichour executives talk about our products and competitivestrategies. Podcasts and archives of these events are alsoavailable;
• press releases on quarterly earnings, productannouncements, legal developments and other materialnews that we may post from time to time;
• corporate governance information including our CorporateGovernance Guidelines, Code of Business Conduct, Code ofEthics for Chief Executive Officer and Senior FinancialOfficers, information concerning our Board of Directors andits committees, including the charters of the AuditCommittee, Compensation and Management DevelopmentCommittee, Corporate Governance Committee andResearch, Innovation and Technology Committee, and othergovernance-related policies;
• stockholder services information, including ways to contactour transfer agent and information on how to sign up fordirect deposit of dividends or enroll in our dividendreinvestment plan; and
• opportunities to sign up for email alerts and RSS feeds tohave information provided in real time.
The information available on our website is notincorporated by reference in, or a part of, this or any otherreport we file with or furnish to the SEC.
ITEM 1A. Risk Factors
Risk factors which could cause actual results to differ
from our expectations and which could negatively impact
our financial condition and results of operations are
discussed below and elsewhere in this report. Additional
risks and uncertainties not presently known to us or that
are currently not believed to be significant to our business
may also affect our actual results and could harm our
business, financial condition and results of operations. If
any of the risks or uncertainties described below or any
additional risks and uncertainties actually occur, our
business, results of operations and financial condition
could be materially and adversely affected.
Our success depends on our ability to effectively
develop and market our products against those of our
competitors.
We operate in a highly competitive environment. Ourpresent or future products could be rendered obsolete oruneconomical by technological advances by one or more of ourpresent or future competitors or by other therapies, includingbiological therapies. To remain competitive, we must continueto develop and acquire new products and technologies.Competition is primarily on the basis of:• technology;• innovation;• quality;• reputation; and• customer service.
In markets outside of the U.S., other factors influencecompetition as well, including:• local distribution systems;• complex regulatory environments; and• differing medical philosophies and product preferences.
Our competitors may:• have greater financial, marketing and other resources than
us;• respond more quickly to new or emerging technologies;• undertake more extensive marketing campaigns;• adopt more aggressive pricing policies; or• be more successful in attracting potential customers,
employees and strategic partners.Any of these factors, alone or in combination, could cause
us to have difficulty maintaining or increasing sales of ourproducts.
If we do not introduce new products in a timely
manner, our products may become obsolete over time,
customers may not buy our products and our revenue
and profitability may decline.
Demand for our products may change, in certain cases, inways we may not anticipate because of:• evolving customer needs;• changing demographics;• slowing industry growth rates;• declines in the reconstructive implant market;• the introduction of new products and technologies;• evolving surgical philosophies; and• evolving industry standards.
Without the timely introduction of new products andenhancements, our products may become obsolete over time.If that happens, our revenue and operating results wouldsuffer. The success of our new product offerings will dependon several factors, including our ability to:• properly identify and anticipate customer needs;• commercialize new products in a timely manner;• manufacture and deliver instruments and products in
sufficient volumes on time;
9
ZIMMER HOLDINGS, INC. 2012 FORM 10-K ANNUAL REPORT
• differentiate our offerings from competitors’ offerings;• achieve positive clinical outcomes for new products;• satisfy the increased demands by healthcare payors,
providers and patients for shorter hospital stays, faster post-operative recovery and lower-cost procedures;
• innovate and develop new materials, product designs andsurgical techniques; and
• provide adequate medical education relating to newproducts.
In addition, new materials, product designs and surgicaltechniques that we develop may not be accepted quickly, insome or all markets, because of, among other factors:• entrenched patterns of clinical practice;• the need for regulatory clearance; and• uncertainty with respect to third-party reimbursement.
Moreover, innovations generally require a substantialinvestment in research and development before we candetermine their commercial viability and we may not have thefinancial resources necessary to fund the production. Inaddition, even if we are able to successfully developenhancements or new generations of our products, theseenhancements or new generations of products may notproduce revenue in excess of the costs of development andthey may be quickly rendered obsolete by changing customerpreferences or the introduction by our competitors of productsembodying new technologies or features.
If third-party payors decline to reimburse our
customers for our products or reduce reimbursement
levels, the demand for our products may decline and our
ability to sell our products profitably may be harmed.
We sell our products and services to hospitals, doctors,dentists and other healthcare providers, all of which receivereimbursement for the healthcare services provided to theirpatients from third-party payors, such as domestic andinternational government programs, private insurance plansand managed care programs. These third-party payors maydeny reimbursement if they determine that a device used in aprocedure was not in accordance with cost-effective treatmentmethods, as determined by the third-party payor, or was usedfor an unapproved indication. Third-party payors may alsodecline to reimburse for experimental procedures and devices.If our products are not considered cost-effective by third-partypayors, our customers may not be reimbursed for our products.
In addition, third-party payors are increasingly attemptingto contain healthcare costs by limiting both coverage and thelevel of reimbursement for medical products and services. Ifthird-party payors reduce reimbursement levels to hospitalsand other healthcare providers for our products, demand forour products may decline, or we may experience increasedpressure to reduce the prices of our products, which couldhave a material adverse effect on our sales and results ofoperations.
We have also experienced downward pressure on productpricing and other effects of healthcare reform in ourinternational markets. If key participants in governmenthealthcare systems reduce the reimbursement levels for ourproducts, our sales and results of operations may be adverselyaffected.
U.S. healthcare reform legislation includes
provisions that may materially adversely affect our
business and results of operations.
As the 2010 U.S. healthcare law continues to be phased in,we believe the law will have an impact on various aspects ofour business operations. Imposition of the 2.3 percent medicaldevice excise tax effective 2013 has forced, and will continueto force us to identify ways to reduce spending in other areasto offset the expected earnings impact due to the tax. We donot expect to be able to pass along the cost of the tax tohospitals, which continue to face cuts to their Medicarereimbursement per the healthcare law and the recentlyenacted fiscal cliff legislation. Nor do we expect to be able tooffset the cost of the tax through higher sales volumesresulting from the expansion of health insurance coveragebecause of the demographics of the current uninsuredpopulation. The medical device excise tax regulations andinterim guidance issued late 2012 by the U.S. Department ofTreasury did little to lessen the burden of complying with theexcise tax statute. In addition, the law’s Medicare paymentreforms, such as accountable care organizations and bundledpayments, could provide additional incentives for healthcareproviders to reduce spending on our medical device productsand reduce utilization of hospital procedures that use ourproducts. Accordingly, while it is still too early to fullyunderstand and predict the ultimate impact of the law on ourbusiness, ongoing implementation of this legislation could havea material adverse effect on our results of operations and cashflows.
The ongoing cost-containment efforts of healthcare
purchasing organizations may have a material adverse
effect on our results of operations.
Many customers for our products have formed grouppurchasing organizations in an effort to contain costs. Grouppurchasing organizations negotiate pricing arrangements withmedical supply manufacturers and distributors, and thesenegotiated prices are made available to a group purchasingorganization’s affiliated hospitals and other members. If we arenot one of the providers selected by a group purchasingorganization, affiliated hospitals and other members may beless likely to purchase our products, and, if the grouppurchasing organization has negotiated a strict compliancecontract for another manufacturer’s products, we may beprecluded from making sales to members of the grouppurchasing organization for the duration of the contractualarrangement. Our failure to respond to the cost-containmentefforts of group purchasing organizations may cause us to losemarket share to our competitors and could have a materialadverse effect on our sales and results of operations.
We are subject to various governmental regulations
relating to the manufacturing, labeling and marketing of
our products, non-compliance with which could
adversely affect our business, financial condition and
results of operations.
The medical devices we design, develop, manufacture andmarket are subject to rigorous regulation by the FDA andnumerous other federal, state and foreign governmentalauthorities. The process of obtaining regulatory approvals to
10

ZIMMER HOLDINGS, INC. 2012 FORM 10-K ANNUAL REPORT
market a medical device can be costly and time consuming andapprovals might not be granted for future products on a timelybasis, if at all. Delays in receipt of, or failure to obtain,approvals for future products could result in delayedrealization of product revenues or in substantial additionalcosts.
Both before and after a product is commercially released,we have ongoing responsibilities under FDA regulations.Compliance with the FDA’s requirements, including theQuality System regulation, recordkeeping regulations, labelingand promotional requirements and adverse event reportingregulations, is subject to continual review and is monitoredrigorously through periodic inspections by the FDA, which mayresult in observations on Form 483, and in some cases warningletters, that require corrective action, or other forms ofenforcement. If the FDA were to conclude that we are not incompliance with applicable laws or regulations, or that any ofour medical devices are ineffective or pose an unreasonablehealth risk, the FDA could ban such medical devices, detain orseize adulterated or misbranded medical devices, order arecall, repair, replacement, or refund of payment of suchdevices, refuse to grant pending premarket approvalapplications, refuse to provide certificates to foreigngovernments for exports, and/or require us to notify healthcareprofessionals and others that the devices present unreasonablerisks of substantial harm to the public health. The FDA mayalso impose operating restrictions on a company-wide basis,enjoin and restrain certain violations of applicable lawpertaining to medical devices and assess civil or criminalpenalties against our officers, employees or us. The FDA mayalso recommend prosecution to the U.S. Department ofJustice. Any adverse regulatory action, depending on itsmagnitude, may restrict us from effectively marketing andselling our products.
Our products and operations are also often subject to therules of industrial standards bodies, such as the InternationalStandards Organization. If we fail to adequately address any ofthese regulations, our business could be harmed.
We are subject to healthcare fraud and abuse
regulations on an ongoing basis that could require us to
change our business practices and restrict our
operations in the future.
Our industry is subject to various federal and state lawspertaining to healthcare fraud and abuse, including false claimslaws, the federal Anti-Kickback Statute, similar state laws andphysician self-referral laws. Violations of these laws arepunishable by criminal and/or civil sanctions, including, insome instances, fines, imprisonment and, within the U.S.,exclusion from participation in government healthcareprograms, including Medicare, Medicaid and VeteransAdministration (VA) health programs. The interpretation andenforcement of these laws and regulations are uncertain andsubject to rapid change.
New regulations related to conflict minerals may
adversely affect the sourcing, availability and pricing of
materials used in the manufacture of our products, may
increase our costs, cause our profitability to decline
and harm our reputation.
In August 2012, as mandated by the Dodd-Frank WallStreet Reform and Consumer Protection Act of 2010, the SECadopted new disclosure regulations for public companies thatmanufacture products that contain certain minerals and theirderivatives, namely tin, tantalum, tungsten or gold, known asconflict minerals, if these minerals are necessary to thefunctionality or production of the company’s products. Theseregulations require such companies to report annually whetheror not the minerals originate from the Democratic Republic ofCongo (DRC) and adjoining countries and in some cases toperform extensive due diligence on their supply chains for theminerals. The implementation of these new requirementscould adversely affect the sourcing, availability and pricing ofconflict minerals used in the manufacture of medical devices,including our products. In addition, we may incur additionalcosts to comply with the disclosure requirements, includingcosts related to determining the source of any of the relevantminerals used in our products. Since our supply chain iscomplex, the procedures that we implement may not enable usto ascertain the origins for these minerals or determine thatthese minerals are DRC conflict free, which may harm ourreputation. These new requirements also could have the effectof limiting the pool of suppliers from which we source theseminerals, and we may be unable to obtain conflict-freeminerals at competitive prices, which could increase our costsand adversely affect our manufacturing operations and ourprofitability.
We conduct a significant amount of our sales
activity outside of the U.S., which subjects us to
additional business risks and may cause our
profitability to decline due to increased costs.
We sell our products in more than 100 countries andderived almost 50 percent of our net sales in 2012 from outsidethe U.S. We intend to continue to pursue growth opportunitiesin sales internationally, including in emerging markets, whichcould expose us to additional risks associated withinternational sales and operations. Our international operationsare, and will continue to be, subject to a number of risks andpotential costs, including:• changes in foreign medical reimbursement policies and
programs;• unexpected changes in foreign regulatory requirements;• differing local product preferences and product
requirements;• fluctuations in foreign currency exchange rates;• diminished protection of intellectual property in some
countries outside of the U.S.;• trade protection measures and import or export
requirements that may prevent us from shipping products toa particular market and may increase our operating costs;
• foreign exchange controls that might prevent us fromrepatriating cash earned in countries outside the U.S.;
• complex data privacy requirements and labor relations laws;
11

ZIMMER HOLDINGS, INC. 2012 FORM 10-K ANNUAL REPORT
• extraterritorial effects of U.S. laws such as the ForeignCorrupt Practices Act;
• effects of foreign anti-corruption laws, such as the UKBribery Act;
• difficulty in staffing and managing foreign operations;• labor force instability;• potentially negative consequences from changes in tax laws;
and• political and economic instability.
Violations of foreign laws or regulations could result infines, criminal sanctions against us, our officers or ouremployees, prohibitions on the conduct of our business anddamage to our reputation.
We may have additional tax liabilities.
We are subject to income taxes in the U.S. and manyforeign jurisdictions. Significant judgment is required indetermining our worldwide provision for income taxes. In theordinary course of our business, there are many transactionsand calculations where the ultimate tax determination isuncertain. We regularly are under audit by tax authorities.Although we believe our tax estimates are reasonable, the finaldetermination of tax audits and any related litigation could bematerially different from our historical income tax provisionsand accruals. The results of an audit or litigation could have amaterial effect on our financial statements in the period orperiods for which that determination is made.
We earn a significant amount of our operating incomefrom outside the U.S., and any repatriation of fundsrepresenting earnings of foreign subsidiaries may significantlyimpact our effective tax rates. In addition, there have beenproposals to change U.S. tax laws that would significantlyimpact how U.S. multinational corporations are taxed onforeign earnings. Although we cannot predict whether or inwhat form this proposed legislation will pass, if enacted itcould have a material adverse impact on our tax expense andcash flow.
Challenging global economic conditions could
adversely affect our results of operations.
During 2012, growth in the healthcare industry and ourrevenue growth were adversely affected by continuingchallenges in the global economy. Although the U.S. economyis recovering from the worst recession in decades,unemployment remains high and consumer confidenceremains low, resulting in reduced numbers of insured patientsand the deferral of elective reconstructive procedures. Globaleconomic conditions, particularly in Europe, our second-largest operating segment, remain uncertain. We believe thatEuropean austerity measures implemented to address theongoing financial crisis contributed to decreased healthcareutilization and increased pricing pressure for some of ourproducts. We cannot assure you that challenges in the globaleconomy will not continue to negatively impact procedurevolumes, average selling prices and reimbursement rates fromthird-party payors, any of which could adversely affect ourresults of operations. In addition, we have experienced delaysin the collection of receivables from hospitals in certaincountries that have national healthcare systems, includingcertain regions in Spain, Italy, Greece and Portugal, which are
the countries most directly affected by the Euro zone crisis.Repayment of these receivables is dependent upon thefinancial stability of the economies of those countries.Continuing high unemployment in the U.S., a worsening of theEuropean financial crisis or a failure to receive payment of allor a significant portion of our European receivables couldadversely affect our results of operations.
We are subject to risks arising from currency
exchange rate fluctuations, which can increase our
costs, cause our profitability to decline and expose us
to counterparty risks.
A substantial portion of our foreign revenues is generatedin Europe and Japan. The U.S. dollar value of our foreign-generated revenues varies with currency exchange ratefluctuations. Significant increases in the value of the U.S. dollarrelative to the Euro or the Japanese Yen, as well as othercurrencies, could have a material adverse effect on our resultsof operations. Although we address currency risk managementthrough regular operating and financing activities, and, on alimited basis, through the use of derivative financialinstruments, those actions may not prove to be fully effective.
Pending and future product liability claims and
litigation could adversely impact our financial condition
and results of operations and impair our reputation.
Our business exposes us to potential product liability risksthat are inherent in the design, manufacture and marketing ofmedical devices. In the ordinary course of business, we are thesubject of product liability lawsuits alleging that componentfailures, manufacturing flaws, design defects or inadequatedisclosure of product-related risks or product-relatedinformation resulted in an unsafe condition or injury topatients. As previously reported, we temporarily suspendedthe marketing and distribution of our Durom® AcetabularComponent (Durom Cup) in the U.S. in July 2008.Subsequently, a number of product liability lawsuits and otherclaims have been asserted against us. We have settled some ofthese claims and the others are still pending. Additional claimsmay be asserted in the future. We are also currently defendinga number of other product liability lawsuits and claims relatedto various other products. Any product liability claim broughtagainst us, with or without merit, can be costly to defend.Product liability lawsuits and claims, safety alerts or productrecalls, regardless of their ultimate outcome, could have amaterial adverse effect on our business and reputation and onour ability to attract and retain customers.
Although we maintain third-party product liabilityinsurance coverage, we have substantial self-insured retentionamounts that we must pay in full before obtaining anyinsurance proceeds to satisfy a judgment or settlement.Furthermore, even if any product liability loss is covered byour insurance, it is possible that claims against us may exceedthe coverage limits of our insurance policies and we wouldhave to pay the amount of any settlement or judgment that isin excess of our policy limits. Product liability claims in excessof applicable insurance could have a material adverse effect onour business, financial condition and results of operations.
12

ZIMMER HOLDINGS, INC. 2012 FORM 10-K ANNUAL REPORT
We are involved in legal proceedings that may
result in adverse outcomes.
In addition to intellectual property and product liabilityclaims and lawsuits, we are involved in various commerciallitigation and claims and other legal proceedings that arisefrom time to time in the ordinary course of our business.Although we believe we have substantial defenses in thesematters, litigation and other claims are subject to inherentuncertainties and management’s view of these matters maychange in the future. Given the uncertain nature of legalproceedings generally, we are not able in all cases to estimatethe amount or range of loss that could result from anunfavorable outcome. We could in the future incur judgmentsor enter into settlements of claims that could have a materialadverse effect on our results of operations in any particularperiod.
We may fail to adequately protect our proprietary
technology and other intellectual property, which would
allow competitors or others to take advantage of our
research and development efforts.
Our long-term success largely depends on our ability tomarket technologically competitive products. If we fail toobtain or maintain adequate intellectual property protection,we may not be able to prevent third parties from using ourproprietary technologies. Also, our currently pending or futurepatent applications may not result in issued patents, andissued patents are subject to claims concerning priority, scopeand other issues.
The U.S. Patent and Trademark Office and the courts havenot consistently treated the breadth of claims allowed orinterpreted in orthopaedic reconstructive implant andbiotechnology patents. Future changes in, or unexpectedinterpretations of, the patent laws may adversely affect ourability to enforce our patent position.
In addition, intellectual property rights may be unavailableor of limited effect in some foreign countries. If we do notobtain sufficient international protection for our intellectualproperty, our competitiveness in international markets couldbe impaired, which could limit our growth and revenue.
We also attempt to protect our trade secrets, proprietaryknow-how and continuing technological innovation withsecurity measures, including the use of confidentialityagreements with our employees, consultants and collaborators.These measures may prove to be ineffective and any remediesavailable to us may be insufficient to compensate our damages.
Pending and future intellectual property litigation
and infringement claims could cause us to incur
significant expenses or prevent us from selling our
products.
A successful claim of patent or other intellectual propertyinfringement against us could adversely affect our growth andprofitability, in some cases materially. From time to time, wereceive notices from third parties of potential infringement andreceive claims of potential infringement. We may be unawareof intellectual property rights of others that may cover some ofour technology. If someone claims that our products infringedtheir intellectual property rights, any resulting litigation couldbe costly and time consuming and would divert the attention of
management and key personnel from other business issues. Ifwe were to lose such litigation involving material intellectualproperty rights, such loss could result in significant damageawards and injunctions that could prevent our manufactureand sale of affected products or require us to pay significantroyalties in order to continue to manufacture or sell affectedproducts.
If we fail to retain the independent agents and
distributors upon whom we rely heavily to market our
products, customers may not buy our products and our
revenue and profitability may decline.
Our marketing success in the U.S. and abroad dependssignificantly upon our agents’ and distributors’ sales andservice expertise in the marketplace. Many of these agentshave developed professional relationships with existing andpotential customers because of the agents’ detailed knowledgeof products and instruments. A loss of a significant number ofthese agents could have a material adverse effect on ourbusiness and results of operations.
We depend on a limited number of suppliers for
some key raw materials and outsourced activities.
We use a number of suppliers for raw materials that weneed to manufacture our products and to outsource some keymanufacturing activities. These suppliers must provide thematerials and perform the activities to our standards for us tomeet our quality and regulatory requirements. Some key rawmaterials and outsourced activities can only be obtained from asingle source or a limited number of sources. A prolongeddisruption or other inability to obtain these materials oroutsource key manufacturing activities could materially andadversely affect our ability to satisfy demand for our products.
Future material impairments in the carrying value
of our intangible assets, including goodwill, would
negatively affect our operating results.
Our assets include intangible assets, primarily goodwill.The goodwill results from our acquisition activity andrepresents the excess of the consideration transferred over thefair value of the net assets acquired. We assess at leastannually whether events or changes in circumstances indicatethat the carrying value of our intangible assets may not berecoverable. If the operating performance at one or more ofour business units falls significantly below current levels, ifcompeting or alternative technologies emerge, or if marketconditions or future cash flow estimates for one or more of ourbusinesses decline, we could be required, under current U.S.accounting rules, to record a non-cash charge to operatingearnings for the amount of the impairment. Any write-off of amaterial portion of our unamortized intangible assets wouldnegatively affect our results of operations.
We are increasingly dependent on sophisticated
information technology and if we fail to effectively
maintain or protect the integrity of our information
systems and data, our business could be adversely
affected.
We are increasingly dependent on sophisticatedinformation technology for our products and infrastructure. Asa result of technology initiatives, recently enacted regulations,changes in our system platforms and integration of new
13

ZIMMER HOLDINGS, INC. 2012 FORM 10-K ANNUAL REPORT
business acquisitions, we have been consolidating andintegrating the number of systems we operate and haveupgraded and expanded our information systems capabilities.Our information systems require an ongoing commitment ofsignificant resources to maintain, protect, and enhanceexisting systems and develop new systems to keep pace withcontinuing changes in information technology, evolvingsystems and regulatory standards, and the increasing need toprotect patient and customer information. In addition, thirdparties may attempt to hack into our products or systems andmay obtain data relating to patients with our products or ourproprietary information. If we fail to maintain or protect ourinformation systems and data integrity effectively, we couldlose existing customers, have difficulty attracting newcustomers, have problems in determining product costestimates and establishing appropriate pricing, have difficultypreventing, detecting, and controlling fraud, have disputeswith customers, physicians, and other healthcare professionals,have regulatory sanctions or penalties imposed, have increasesin operating expenses, incur expenses or lose revenues as aresult of a data privacy breach, or suffer other adverseconsequences. While we have invested heavily in theprotection of data and information technology, there can be noassurance that our process of consolidating the number ofsystems we operate, upgrading and expanding our informationsystems capabilities, protecting and enhancing our systemsand developing new systems to keep pace with continuingchanges in information processing technology will besuccessful or that systems issues will not arise in the future.Any significant breakdown, intrusion, interruption, corruption,
or destruction of these systems could have a material adverseeffect on our business.
We may make additional acquisitions or enter into
strategic alliances that could increase our costs or
liabilities or be disruptive.
We intend to continue to look for additional strategicacquisitions of other businesses that are complementary to ourbusinesses and other companies with whom we could formstrategic alliances or enter into other arrangements to developor exploit intellectual property rights. These activities involverisks, including the following:• we may need to divert more management resources to
integration than we planned, which may adversely affect ourability to pursue other more profitable activities;
• the difficulties of integrating acquired businesses may beincreased if we need to integrate geographically separatedorganizations, personnel with disparate businessbackgrounds and companies with different corporatecultures;
• we may not recognize expected cost savings or theanticipated benefits of acquisitions or strategic alliances;
• our acquisition candidates or strategic partners may haveunexpected liabilities or prove unable to meet theirobligations to us or the joint venture; and
• the priorities of our strategic partners may proveincompatible with ours.
ITEM 1B. Unresolved Staff Comments
Not Applicable.
14

ZIMMER HOLDINGS, INC. 2012 FORM 10-K ANNUAL REPORT
ITEM 2. Properties
We have the following properties:Location Use Owned /Leased Square Feet
Warsaw, Indiana Research & Development, Manufacturing, Warehousing, Marketing &
Administration . . . . . . . . . . . . . . . . . . . . . . . . . . . . . . . . . . . . . . . . . . . . . . . . . . . . Owned 1,400,000
Warsaw, Indiana Corporate Headquarters & The Zimmer Institute . . . . . . . . . . . . . . . . . . . . . . . Owned 117,000
Warsaw, Indiana Offices, Manufacturing & Warehousing . . . . . . . . . . . . . . . . . . . . . . . . . . . . . . . . Leased 90,000
Carlsbad, California Offices, Research & Development & Manufacturing . . . . . . . . . . . . . . . . . . . . . Leased 125,000
Minneapolis, Minnesota Offices & Research & Development . . . . . . . . . . . . . . . . . . . . . . . . . . . . . . . . . . . Owned 51,000
Southaven, Mississippi Distribution Center . . . . . . . . . . . . . . . . . . . . . . . . . . . . . . . . . . . . . . . . . . . . . . . . Leased 189,000
Dover, Ohio Research & Development, Manufacturing & . . . . . . . . . . . . . . . . . . . . . . . . . . . . Owned 140,000
Warehousing . . . . . . . . . . . . . . . . . . . . . . . . . . . . . . . . . . . . . . . . . . . . . . . . . . . . . Leased 61,000
Parsippany, New Jersey Office, Research & Development, Manufacturing, Warehousing & The
Zimmer Institute . . . . . . . . . . . . . . . . . . . . . . . . . . . . . . . . . . . . . . . . . . . . . . . . . . Leased 135,000
Memphis, Tennessee Offices & Warehousing . . . . . . . . . . . . . . . . . . . . . . . . . . . . . . . . . . . . . . . . . . . . . Leased 30,000
Austin, Texas Offices, Administration, Research & Development . . . . . . . . . . . . . . . . . . . . . . Leased 70,000
Sydney, Australia Offices & Warehousing . . . . . . . . . . . . . . . . . . . . . . . . . . . . . . . . . . . . . . . . . . . . . Leased 33,000
Mississauga, Canada Offices & Warehousing . . . . . . . . . . . . . . . . . . . . . . . . . . . . . . . . . . . . . . . . . . . . . Leased 52,000
Beijing, China Offices & Manufacturing . . . . . . . . . . . . . . . . . . . . . . . . . . . . . . . . . . . . . . . . . . . . Leased 88,000
Xianning, China Offices, Research & Development & Manufacturing . . . . . . . . . . . . . . . . . . . . . Leased 53,000
Shanghai, China Offices & Warehousing . . . . . . . . . . . . . . . . . . . . . . . . . . . . . . . . . . . . . . . . . . . . . Leased 45,000
Etupes, France Offices, Manufacturing & Warehousing . . . . . . . . . . . . . . . . . . . . . . . . . . . . . . . . Owned 90,000
Saint Priest, France Offices & Warehousing . . . . . . . . . . . . . . . . . . . . . . . . . . . . . . . . . . . . . . . . . . . . . Leased 13,000
Eschbach, Germany Distribution Center . . . . . . . . . . . . . . . . . . . . . . . . . . . . . . . . . . . . . . . . . . . . . . . . Owned 94,000
Freiburg, Germany Offices & Warehousing . . . . . . . . . . . . . . . . . . . . . . . . . . . . . . . . . . . . . . . . . . . . . Leased 75,000
Shannon, Ireland Offices & Manufacturing . . . . . . . . . . . . . . . . . . . . . . . . . . . . . . . . . . . . . . . . . . . . Owned 125,000
Milan, Italy Offices & Warehousing . . . . . . . . . . . . . . . . . . . . . . . . . . . . . . . . . . . . . . . . . . . . . Leased 55,000
Gotemba, Japan Offices, Service Center & Warehousing . . . . . . . . . . . . . . . . . . . . . . . . . . . . . . . . Owned 87,000
Tokyo, Japan Offices & Warehousing . . . . . . . . . . . . . . . . . . . . . . . . . . . . . . . . . . . . . . . . . . . . . Leased 20,000
Seoul, Korea Offices & Warehousing . . . . . . . . . . . . . . . . . . . . . . . . . . . . . . . . . . . . . . . . . . . . . Leased 33,000
Ponce, Puerto Rico Offices, Manufacturing & Warehousing . . . . . . . . . . . . . . . . . . . . . . . . . . . . . . . . Owned 225,000
Singapore Offices & Warehousing . . . . . . . . . . . . . . . . . . . . . . . . . . . . . . . . . . . . . . . . . . . . . Leased 19,000
Barcelona, Spain Offices & Warehousing . . . . . . . . . . . . . . . . . . . . . . . . . . . . . . . . . . . . . . . . . . . . . Leased 27,000
Winterthur, Switzerland Offices, Research & Development & Manufacturing . . . . . . . . . . . . . . . . . . . . . Leased 394,000
Münsingen, Switzerland Offices & Warehousing . . . . . . . . . . . . . . . . . . . . . . . . . . . . . . . . . . . . . . . . . . . . . Owned 76,000
Swindon, United Kingdom Offices & Warehousing . . . . . . . . . . . . . . . . . . . . . . . . . . . . . . . . . . . . . . . . . . . . . Leased 10,000
We believe the current facilities, including manufacturing, warehousing, research and development and office space, providesufficient capacity to meet ongoing demands.
In addition to the above, we maintain more than 100 other offices and warehouse facilities in more than 25 countries aroundthe world, including the U.S., Japan, Australia, France, Russia, India, Germany, Italy, Switzerland and China. We believe that all ofthe facilities and equipment are in good condition, well maintained and able to operate at present levels.
ITEM 3. Legal Proceedings
Information pertaining to legal proceedings in which we are involved can be found in Note 19 to our consolidated financialstatements (see Part II, Item 8 of this report).
ITEM 4. Mine Safety Disclosures
Not Applicable.
15

ZIMMER HOLDINGS, INC. 2012 FORM 10-K ANNUAL REPORT
PART II
ITEM 5. Market for the Registrant’s Common Equity, Related Stockholder Matters and Issuer Purchases of
Equity Securities
Our common stock is traded on the New York Stock Exchange and the SIX Swiss Exchange under the symbol “ZMH.” The highand low sales prices for our common stock on the New York Stock Exchange and the dividends declared for the calendar quartersof fiscal years 2012 and 2011 are set forth as follows:
Quarterly High-Low Share Prices and Declared Dividends High LowDeclaredDividends
Year Ended December 31, 2012:First Quarter $64.81 $52.70 $ –Second Quarter $66.41 $58.23 $0.18Third Quarter $67.90 $57.46 $0.18Fourth Quarter $69.09 $61.97 $0.18
Year Ended December 31, 2011:First Quarter $65.22 $52.15 $ –Second Quarter $69.93 $59.49 $ –Third Quarter $66.03 $49.92 $ –Fourth Quarter $55.43 $47.00 $0.18
We expect to continue paying cash dividends on a quarterly basis; however, future dividends are subject to approval of theBoard of Directors and may be adjusted as business needs or market conditions change.
The number of holders of our common stock on February 15, 2013 was approximately 237,000. On February 15, 2013, theclosing price of the common stock, as reported on the New York Stock Exchange, was $75.90 per share.
The information required by this Item concerning equity compensation plans is incorporated by reference to Item 12 of thisreport.
The following table summarizes repurchases of common stock settled during the three months ended December 31, 2012:
Total Number ofShares Purchased
Average PricePaid per Share
Total Number of SharesPurchased as Part ofPublicly Announced
Plans or Programs (1)
Approximate Dollar Value ofShares that May Yet Be
Purchased Under Plans orPrograms (1)
October 2012 – $ – – $1,154,341,726November 2012 1,108,700 64.93 1,108,700 1,082,354,658December 2012 1,000,000 67.77 1,000,000 1,014,582,321
Total 2,108,700 $66.28 2,108,700 $1,014,582,321
(1) Includes repurchases made under the current program authorizing $1.5 billion of repurchases through December 31, 2014.
16

ZIMMER HOLDINGS, INC. 2012 FORM 10-K ANNUAL REPORT
ITEM 6. Selected Financial Data
The financial information for each of the past five years ended December 31 is set forth below (in millions, except per shareamounts):
Summary of Operations 2012 2011 2010 2009 2008
Net sales $4,471.7 $4,451.8 $4,220.2 $4,095.4 $4,121.1Net earnings of Zimmer Holdings, Inc. 755.0 760.8 596.9 717.4 848.6Earnings per common share
Basic $ 4.32 $ 4.05 $ 2.98 $ 3.34 $ 3.73Diluted 4.29 4.03 2.97 3.32 3.72
Dividends declared per share of common stock $ 0.54 $ 0.18 $ – $ – $ –Average common shares outstanding
Basic 174.9 187.6 200.0 215.0 227.3Diluted 176.0 188.7 201.1 215.8 228.3
Balance Sheet DataTotal assets $9,012.4 $8,515.3 $7,999.9 $7,785.5 $7,239.0Long-term debt 1,720.8 1,576.0 1,142.1 1,127.6 460.1Other long-term obligations 559.3 557.4 384.0 328.5 353.9Stockholders’ equity 5,866.3 5,514.8 5,771.3 5,638.7 5,653.9
17

ZIMMER HOLDINGS, INC. 2012 FORM 10-K ANNUAL REPORT
ITEM 7. Management’s Discussion and Analysis of Financial Condition and Results of Operations
The following discussion and analysis should be read inconjunction with the consolidated financial statements and thecorresponding notes included elsewhere in this Form 10-K.Certain percentages presented in this discussion and analysisare calculated from the underlying whole-dollar amounts andtherefore may not recalculate from the rounded numbers usedfor disclosure purposes. Certain amounts in the 2011 and 2010consolidated financial statements have been reclassified toconform to the 2012 presentation.
EXECUTIVE LEVEL OVERVIEW
2012 Results
Our 2012 results reflect what we believe was abovemarket sales growth in our Europe and Asia Pacific reportingsegments and below market growth in our Americas reportingsegment in the musculoskeletal markets in which we compete.As a result, 2012 net sales were flat when compared to 2011.We believe 2012 net sales reflected strong commercialexecution in the Europe and Asia Pacific reporting segmentsand under-performance in some areas of the Americasreporting segment. We are focusing on improving those areas.
During 2012, we made substantial investments in a seriesof operational excellence initiatives. We began implementingthese initiatives on a company-wide basis in 2010. They areintended to improve our future operating results and includecentralizing or outsourcing certain functions, improvingquality, distribution, sourcing, manufacturing and ourinformation technology systems. We began realizing savingsfrom these operational initiatives in 2012 as indicated in the 80basis point decline in our selling, general and administrative(SG&A) expense as a percent of sales. Additionally, researchand development (R&D) spending was lower in 2012 as wecompleted certain significant projects and realized someoperational savings from these initiatives.
We also recognized unanticipated expenses in 2012 forgoodwill impairment related to our U.S. Spine operations and“Certain claims”. However, this was partially offset by afavorable effective tax rate. We recorded a $34.3 million nettax benefit related to restructuring of certain internationaloperations that resulted in the lower tax rate.
In total, our 2012 net earnings were slightly lower than2011 primarily due to the significant investments in ouroperational excellence initiatives and were lower than weexpected primarily due to the goodwill impairment.
2013 Outlook
We estimate our net sales will grow between 2 and 4percent in 2013. This assumes the market for knee and hipprocedures will remain stable and grow in low single digits. Weexpect pricing to have a negative effect on sales growth ofapproximately 2 percent, and foreign currency exchange rates
to have a negative effect on sales growth of approximately 0.5percent based upon December 31, 2012 rates.
Assuming currency rates remain at December 31, 2012levels, we expect our gross margin to be between 74.5 and75.5 percent of sales in 2013. This range assumes that foreigncurrency hedge losses will be lower in 2013 than in 2012. Therange also takes into consideration the impact of the new 2.3percent excise tax on a majority of our U.S. sales resultingfrom U.S. healthcare reform. Pursuant to the tax regulations,the excise tax is imposed on the first sale in the U.S. by themanufacturer, producer or importer of a medical device toeither a third party or an affiliated distribution entity. Wedistribute a majority of our musculoskeletal products throughan affiliated distribution entity. Under U.S. GAAP, excise taxesincurred to get inventory to its current location can beincluded in the cost of the inventory. Accordingly, a majorityof the excise tax will be capitalized in inventory and theexpense will be deferred until that inventory is sold on a first-in-first-out basis. Therefore, while we started paying the tax inJanuary 2013, it will not significantly increase our cost ofproducts sold expense in our consolidated statement ofearnings until later in the year. Once our cost of products soldstarts reflecting this excise tax, we estimate the cost to be $10to $15 million on a quarterly basis. The range of 74.5 to 75.5percent does not take into consideration inventory step-up orother inventory charges related to acquisitions or operationalexcellence initiatives in 2013.
We do not expect to be able to offset the full impact of theexcise tax on net earnings through higher pricing on ourproducts or through higher sales volumes resulting from theexpansion of health insurance coverage. However, we doexpect to offset the tax with cost savings from our operationalexcellence initiatives.
We expect to continue making investments in R&D ofapproximately 5 percent of sales in 2013. SG&A as a percentof sales is expected to be between 39.5 and 40.0 percent in2013 as we realize efficiencies from our operational excellenceinitiatives and further leverage revenue growth.
We expect to incur $120 to $130 million of expenses in2013 related to our operational excellence initiatives. Theseprograms are targeted at streamlining the organization andbusiness processes. They are expected to be mostly completedin 2013. We also expect to incur $5 to $15 million for certainacquisition and integration costs connected with recentacquisitions. We expect to recognize the majority of theseexpenses in “Special items” on our statement of earnings, butsome will be related to inventory and be reflected in costs ofproducts sold. The gross margin and SG&A percentagesdiscussed above do not include these expenses.
Assuming variable interest rates remain at December 31,2012 levels, we expect interest income and expense, net, to beapproximately $60 million in 2013, which is similar to 2012.
18

ZIMMER HOLDINGS, INC. 2012 FORM 10-K ANNUAL REPORT
RESULTS OF OPERATIONS
Net Sales by Reportable Segment
The following tables present net sales by reportable segment and the components of the percentage changes (dollars inmillions):
Year Ended December 31,Volume/
Mix
Foreign
Exchange2012 2011 % Inc/(Dec) Price
Americas $2,476.3 $2,440.8 1% 4% (2)% (1)%
Europe 1,177.4 1,214.5 (3) 4 (1) (6)
Asia Pacific 818.0 796.5 3 5 (2) –
Total $4,471.7 $4,451.8 – 4 (2) (2)
Year Ended December 31,Volume/
Mix
Foreign
Exchange2011 2010 % Inc Price
Americas $2,440.8 $2,431.6 -% 2% (2)% –%
Europe 1,214.5 1,099.5 10 5 – 5
Asia Pacific 796.5 689.1 16 7 (1) 10
Total $4,451.8 $4,220.2 5 4 (1) 2
“Foreign Exchange” as used in the tables in this report represents the effect of changes in foreign currency exchange rates onsales growth.
Net Sales by Product Category
The following tables present net sales by product category and the components of the percentage changes (dollars in millions):
Year Ended December 31,Volume/
Mix
Foreign
Exchange2012 2011 % Inc (Dec) Price
ReconstructiveKnees $1,814.8 $1,825.1 (1)% 4% (3)% (2)%Hips 1,342.0 1,355.6 (1) 4 (3) (2)Extremities 173.8 163.4 6 9 (1) (2)
Total 3,330.6 3,344.1 – 4 (3) (1)
Dental 237.7 248.1 (4) (4) 2 (2)Trauma 307.9 285.8 8 10 (1) (1)Spine 208.9 225.0 (7) (2) (4) (1)Surgical and other 386.6 348.8 11 12 – (1)
Total $4,471.7 $4,451.8 – 4 (2) (2)
Year Ended December 31,Volume/
Mix
Foreign
Exchange2011 2010 % Inc (Dec) Price
ReconstructiveKnees $1,825.1 $1,789.9 2% 1% (2)% 3%Hips 1,355.6 1,262.3 7 6 (2) 3Extremities 163.4 150.1 9 8 (1) 2
Total 3,344.1 3,202.3 4 3 (2) 3
Dental 248.1 219.0 13 5 7 1Trauma 285.8 245.5 16 13 – 3Spine 225.0 234.4 (4) (4) (2) 2Surgical and other 348.8 319.0 9 6 – 3
Total $4,451.8 $4,220.2 5 4 (1) 2
19

ZIMMER HOLDINGS, INC. 2012 FORM 10-K ANNUAL REPORT
The following table presents net sales by product category by region (dollars in millions):
Year Ended December 31, 2012 2011 2010
2012 vs. 2011
% Inc (Dec)
2011 vs. 2010
% Inc (Dec)
ReconstructiveKnees
Americas $1,058.9 $1,067.5 $1,110.5 (1)% (4)%Europe 447.3 462.6 418.7 (3) 10Asia Pacific 308.6 295.0 260.7 5 13
HipsAmericas 606.7 600.7 589.7 1 2Europe 446.0 470.5 433.2 (5) 9Asia Pacific 289.3 284.4 239.4 2 19
ExtremitiesAmericas 133.8 125.0 115.9 7 8Europe 29.0 27.5 24.4 6 13Asia Pacific 11.0 10.9 9.8 1 12
Total 3,330.6 3,344.1 3,202.3 – 4
DentalAmericas 137.8 134.7 113.9 2 18Europe 79.8 85.3 80.0 (6) 7Asia Pacific 20.1 28.1 25.1 (29) 12
TraumaAmericas 155.2 145.5 130.1 7 12Europe 69.5 63.5 50.2 10 26Asia Pacific 83.2 76.8 65.2 8 18
SpineAmericas 140.0 150.9 166.5 (7) (9)Europe 49.3 53.5 51.5 (8) 4Asia Pacific 19.6 20.6 16.4 (5) 25
Surgical and otherAmericas 243.9 216.5 205.0 13 6Europe 56.5 51.6 41.5 10 24Asia Pacific 86.2 80.7 72.5 7 11
Total $4,471.7 $4,451.8 $4,220.2 – 5
20

ZIMMER HOLDINGS, INC. 2012 FORM 10-K ANNUAL REPORT
Demand (Volume and Mix) Trends
Increased volume and changes in the mix of product salescontributed 4 percentage points of 2012 sales growth, which isthe same rate of growth from 2011 compared to 2010.
Consistent with our expectations, procedure volumes inthe broader musculoskeletal market remained stable in 2012relative to 2011 at low to mid-single digit growth rates. Webelieve long-term indicators point toward sustained growthdriven by an aging global population, growth in emergingmarkets, obesity, proven clinical benefits, new materialtechnologies, advances in surgical techniques and more activelifestyles, among other factors. In addition, the ongoing shift indemand to premium products and the introduction of patientspecific devices is expected to continue to positively affectsales growth.
Pricing Trends
Global average selling prices declined by 2 percent in 2012compared to 2011. In all reporting segments, we continued tosee pricing pressure from governmental healthcare costcontainment efforts and from local hospitals and healthsystems. For example, in Japan a biennial price adjustmentwent into effect in April 2012 which lowered pricing. TheJapan downward price adjustment was greater than we hadanticipated coming into the year. For 2013, we estimate thatselling prices will have a negative effect of approximately 2percent.
Foreign Currency Exchange Rates
For 2012, foreign currency exchange rates resulted in a 2percent decline in sales. This was most notable in Europe dueto the strengthening of the U.S. Dollar versus the Euro year-over-year. If foreign currency exchange rates remainconsistent with 2012 year end rates, we estimate that astronger U.S. Dollar versus foreign currency exchange rateswill have a negative effect in 2013 of approximately 0.5 percenton sales. We address currency risk through regular operatingand financing activities and through the use of forwardcontracts and options solely to manage foreign currencyvolatility and risk. Changes to foreign currency exchange ratesaffect sales growth, but due to gains/losses on hedge contractsand options, which are recorded in cost of products sold, theeffect on net earnings in the near term is expected to beminimal.
Knees
Knee sales experienced a 1 percent decline in 2012compared to a 2 percent increase in 2011. However, most ofthat change was caused by the impact of fluctuations in foreigncurrency exchange rates. In Europe, changes in foreigncurrency exchange rates affected knee sales in 2012 and 2011by negative 6 percent and positive 4 percent, respectively. InAsia Pacific, changes in foreign currency exchange rates had aminimal effect on knee sales in 2012 and had a positive 9percent effect in 2011.
We estimate that industry procedure volumes wereslightly positive on a global basis in 2012, while pricing wasnegative. We also believe our Europe and Asia Pacificreporting segments grew above the market, but in theAmericas we were lower than the market due tounderperformance in some areas. We are cautiously optimisticthat volume/mix trends will continue to remain stable in 2013.
The NexGen Complete Knee Solution product line,including Gender Solutions® Knee Femoral Implants, theNexGen LPS-Flex Knee and the NexGen CR-Flex Knee, ledknee sales in 2012. In addition, sales of our knee revisionsystems, the Zimmer Unicompartmental High Flex Knee andZimmer Patient Specific Instruments exhibited growth.
Hips
Hip sales declined by 1 percent in 2012 compared to anincrease of 7 percent in 2011. A significant portion of thatchange was caused by the impact of fluctuations in foreigncurrency exchange rates. In Europe, changes in foreigncurrency exchange rates affected hip sales in 2012 and 2011 bynegative 6 percent and positive 6 percent, respectively. In AsiaPacific, changes in foreign currency exchange rates positivelyaffected hip sales in 2012 and 2011 by 1 percent and 10percent, respectively.
Also, we experienced some specific positive growthdrivers in 2011, such as new product introductions andproduct specific issues at competitors. Without these factors in2012, our results were more reflective of market growth. Weestimate that industry procedure volumes were slightlypositive on a global basis in 2012, while pricing was negative.
Sales in 2012 were driven primarily by the Zimmer M/LTaper Hip Prosthesis and the Zimmer M/L Taper HipProsthesis with Kinectiv Technology, Fitmore Hip Stems, andour Continuum Acetabular System, Trilogy IT AcetabularSystem and Allofit IT Alloclassic Acetabular System. Otherleading products in our hips portfolio were the CLS Spotorno
Stem from the CLS Hip System and the Alloclassic
Zweymüller Hip Stem. We also commercialized ourVivacit-E® Highly Crosslinked Polyethylene Liners in 2012and expect this to drive sales growth in 2013.
Extremities
Extremities delivered solid sales growth the past twoyears. The Zimmer Trabecular Metal Reverse ShoulderSystem led extremities sales. Reverse shoulder procedurescontinue to gain popularity as a solution for patients withrotator cuff damage.
Dental
Dental sales declined by 4 percent in 2012 compared to anincrease of 13 percent in 2011. While the Americas salesincreased in 2012, the overall performance of our dentalfranchise was impacted by several factors, including softeningin certain international markets and lower inventory levelsmaintained by our stocking distributors. Also, Americas salesgrowth was aided by the acquisition of a small Brazilian dental
21

ZIMMER HOLDINGS, INC. 2012 FORM 10-K ANNUAL REPORT
company. Sales were led by the Tapered Screw-Vent ImplantSystem. In addition, sales of our recently released Zimmer
Trabecular Metal Dental Implant positively affected sales.2011 sales were buoyed by a change in a distributionarrangement under which we started capturing end-user salesas compared to the prior agreement where we only received acommission on end-user sales.
Trauma
Trauma sales increased by 8 percent and 16 percent in2012 and 2011, respectively, compared to the same prior yearperiods. In 2011, we continued the launch of the Zimmer
Natural Nail System, which contributed significantly to ourtrauma sales in 2011 and 2012. In addition to the Zimmer
Natural Nail System, the Zimmer Periarticular LockingPlates System led trauma sales, while sales of the Zimmer
Universal Locking System also made a strong contribution in2012.
Spine
We experienced mid-single digit sales declines in Spineeach of the past two years. This product category continues toface challenges related to utilization, pricing pressure andpayor approvals. Overall, solid sales of the PathFinder NXT
and Sequoia Pedicle Screw Systems, our Universal ClampTM
Spinal Fixation System and Trabecular Metal Technologyproducts partly offset a decline in sales of the Dynesys Systemand other products.
Surgical and other
Surgical and other delivered solid sales growth the pasttwo years. Surgical and other sales were led by PALACOS
Bone Cement and tourniquet products. Our wounddebridement products, powered instruments, DeNovo NTNatural Tissue Graft, Chondrofix Osteochondral Allograft andGel-One Cross-linked Hyaluronate also made a positivecontribution to sales results. Additionally, our January 2012acquisition of Synvasive Technology, Inc. and October 2012acquisition of Dornoch Medical Systems, Inc. provided growthin this product category.
The following table presents estimated* 2012 globalmarket size and market share information (dollars in billions):
Global
Market
Size
Global Market
% Growth**
Zimmer
Market
Share
Zimmer
Market
Position
ReconstructiveKnees $ 7.3 3% 25% 1Hips 6.4 1 21 2Extremities 1.4 9 12 3
Total $15.1 3 22 1
Dental $ 3.3 (1) 7 5Trauma $ 5.5 2 6 4Spine*** $ 8.9 – 2 6
* Estimates are not precise and are based on competitor annual filings, WallStreet equity research and Company estimates** Excludes the effect of changes in foreign currency exchange rates onsales growth*** Spine includes related orthobiologics
Expenses as a Percent of Net Sales
Year Ended December 31, 2012 2011 2010
2012 vs. 2011
Inc (Dec)
2011 vs. 2010
Inc (Dec)
Cost of products sold 25.2% 25.2% 24.0% – 1.2Research and
development 5.0 5.4 5.2 (0.4) 0.2Selling, general and
administrative 40.4 41.2 41.6 (0.8) (0.4)Certain claims 0.3 3.5 1.8 (3.2) 1.7Goodwill impairment 2.1 – 4.8 2.1 (4.8)Special items 3.5 1.7 0.8 1.8 0.9Operating margin 23.4 23.0 21.7 0.4 1.3
Cost of Products Sold
Gross margin was the same in 2012 compared to 2011.Our foreign currency hedging program had a favorable impactto gross margin in 2012. Under the program, for derivativeswhich qualify as hedges of future cash flows, the effectiveportion of changes in fair value is temporarily recorded inother comprehensive income and then recognized in cost ofproducts sold when the hedged item affects earnings. Due tothe strengthening of the U.S. Dollar in 2012, foreign currencyhedge losses in costs of products sold were less in 2012 thanthey were in 2011. Additionally, lower inventory step-upcharges from acquisitions were recognized in 2012 whencompared to 2011 based on the timing of acquisitions. Thisfavorability was offset by the effect of lower prices on grossmargin.
Gross margin declined in 2011 from 2010. The mostsignificant impact on gross margin in 2011 was from ourforeign currency hedging program. Due to the weakening ofthe U.S. Dollar in 2011, we recognized foreign currency hedgelosses in costs of products sold versus hedge gains in 2010.Also in 2011, lower selling prices, higher average costs per unitsold, and higher inventory step-up charges all contributed tolower gross margins.
The following table reconciles the gross margin changesfor 2012 and 2011:
Year Ended December 31, 2012 2011
Prior year gross margin 74.8% 76.0%Lower average selling prices (0.5) (0.2)Average cost per unit (0.1) (0.2)Excess and obsolete inventory (0.1) –Foreign currency exchange impact, net 0.4 (1.0)Inventory step-up 0.2 (0.2)Other 0.1 0.4
Current year gross margin 74.8% 74.8%
Operating Expenses
R&D expenses and R&D as a percent of sales decreased in2012 compared to 2011 after increases in 2011 when comparedto 2010. In 2012, R&D spending benefitted from the effect ofour operational excellence initiatives, as well as a naturaldecline related to certain large projects that achieved fullcommercialization, including Persona, The Personalized KneeSystem, and the Trabecular Metal Total Ankle, among otherproducts. The increase in 2011 was in line with our strategy to
22

ZIMMER HOLDINGS, INC. 2012 FORM 10-K ANNUAL REPORT
invest in new product development activities across nearly allof our product categories, as well as to increase spending onexternal research, clinical, regulatory and quality initiatives.We expect R&D spending in 2013 to be approximately 5percent of sales for the year.
In 2012, SG&A decreased in dollars terms and as a percentof sales. Changes in foreign currency exchange rates due tothe strengthening of the U.S. Dollar relative to 2011 loweredSG&A expense.
Absent the effects of foreign currency exchange rates,selling and distribution expenses were higher due to highersales. Other unfavorable items included increased intangibleamortization from business combinations, higher employeerecruiting and relocation costs, increased legal costs andhigher bad debt expense. These were offset by favorableproduct liability claims, lower instrument excess andobsolescence charges and lower advertising spend. SG&A as apercent of sales decreased 80 basis points compared to theprior year, reflecting disciplined discretionary spending andthe effect of our operational excellence initiatives, which haslowered expenses such as salaries, wages and benefits.
In 2011, SG&A increased in dollar terms, but decreased asa percent of sales from 2010. The increase in dollars wasprimarily due to variable selling and distribution expenses fromhigher sales, increased intangible asset amortization fromacquisitions completed in December 2010 and higher bad debtexpenses primarily from our Europe operating segment. Thesewere partially offset by lower product liability chargesrecorded in SG&A related to the Durom Cup. For moreinformation regarding Durom Cup claims, see Note 19 to theconsolidated financial statements. SG&A as a percent of salesin 2011 decreased by 40 basis points from 2010 reflectingdisciplined spending and the effect of our operationalexcellence initiatives.
“Certain claims” expense is a provision for estimatedliabilities to Durom Cup patients undergoing revisionsurgeries. Provisions of $157.8 million, $75.0 million, $35.0million and $69.0 million were originally recorded during 2011,2010, 2009 and 2008, respectively, with an additional $15.0million recorded during 2012, bringing the total provision to$351.8 million for these claims, excluding a subset of Durom
Cup claims that were recorded in SG&A. The additionalexpense in 2012 was primarily for more estimated claimsoutside the U.S. than were previously expected, as well ashigher estimated legal costs. For more information regardingthese claims, see Note 19 to the consolidated financialstatements.
In connection with our annual goodwill impairment testsperformed in the fourth quarters of 2012 and 2010, we notedthat the carrying values of the net assets of our U.S. Spinereporting unit were in excess of the reporting unit’s estimatedfair value. As a result, we recorded goodwill impairmentcharges of $96.0 million and $204.0 million in 2012 and 2010,respectively. For more information regarding goodwillimpairment and the factors that led to the impairment, seeNote 9 to the consolidated financial statements.
“Special items” expenses for the years endedDecember 31, 2012, 2011 and 2010 were $155.4 million, $75.2million, and $34.7 million, respectively.
“Special items” in 2012 included significant expensesincurred for consulting and professional fees and dedicatedproject personnel for our operational excellence initiatives.These initiatives are intended to improve our future operatingresults and include centralizing or outsourcing certainfunctions, improving quality, distribution, sourcing,manufacturing and our information technology systems. Othersignificant expenses in 2012 were from impairments fromintangible assets acquired in business combinations,settlement of various legal matters, including royalty disputes,and severance expenses related to various organizationalchanges as well as facility closures.
“Special items” in 2011 resulted from a continuedreduction in management layers and restructuring in certainareas, resulting in $23.1 million of severance and termination-related expenses. In 2011, we also incurred $26.0 million inconsulting and professional fees associated with acquisitionsand our operational excellence initiatives. As a result of ouracquisitions and operational excellence initiatives, we alsoincurred asset impairments, facility and employee relocationcosts, contract termination expenses and other costs.
“Special items” in 2010 included expenses related torestructuring of our information technology infrastructure aswell as our management structure. This resulted in $7.7 millionof asset impairment charges and $6.7 million of employeeseverance and termination-related expenses. In 2010, we alsoincurred consulting and professional fees, facility andemployee relocation costs, contract termination expenses andother various expenses resulting from acquisitions. “Specialitems” also included the impairment of an available-for-salesecurity that was acquired as part of a business acquisition andcertain litigation related matters.
See Note 2 to the consolidated financial statements formore information regarding “Special items” charges.
Interest Income, Interest Expense, Income Taxes and
Net Earnings
Interest expense increased in 2012 compared to 2011primarily due to the $550 million offering of senior notes wecompleted in November 2011. Interest expense decreased in2011 compared to 2010 as the result of interest rate swapagreements we entered into in late 2010 and early 2011 toconvert a portion of our fixed-rate debt into variable-rate debt.Interest income has increased the last two years due to higherbalances of cash and cash equivalents and short-term and long-term investments upon which interest income is being earned.
Our effective tax rate (ETR) on earnings before incometaxes for the years ended December 31, 2012, 2011 and 2010was 24.0 percent, 22.4 percent and 30.6 percent, respectively.The variation of our ETR has largely been affected by “Certainclaims”, goodwill impairment charges and a $34.3 millionbenefit from the recognition of deferred tax assets related to a
23

ZIMMER HOLDINGS, INC. 2012 FORM 10-K ANNUAL REPORT
legal entity restructuring. “Certain claims” expense favorablyaffects our ETR because it lowers the income within our U.S.operations relative to our foreign operations. Goodwillimpairment charges negatively affect our ETR because no taxbenefit is recorded on such charges. Additionally, in 2011 and2010 our ETR was favorably impacted by the resolution ofcertain tax contingencies. These discrete items account for themajority of the variation in our ETRs in the past three years.
Our ETR for 2013 will reflect certain tax benefits resultingfrom the enactment in January 2013 of U.S. federal lawsextending the R&D credit and other tax benefits applicable tous. The extension applies to both 2012 and 2013, and as aresult of the timing of the law’s enactment, the 2012 tax yearbenefits must be recognized in the first quarter of 2013 forfinancial reporting purposes. As a result, our 2013 financialresults will reflect a reduction to our ETR of approximately 0.3percent related to the 2012 tax year benefits.
As a result of the revenues and expenses discussedpreviously, net earnings in 2012 decreased 1 percent comparedto 2011. In 2011, net earnings increased 27 percent comparedto 2010. Basic and diluted earnings per share increased 7percent and 6 percent, respectively, in 2012 compared to 2011,while 2011 basic and diluted earnings per share increased 36percent from 2010. The disproportionate change in earningsper share as compared to net earnings is attributed to theeffect of share repurchases.
Non-GAAP operating performance measures
We use non-GAAP financial measures to evaluate ouroperating performance that differ from financial measuresdetermined in accordance with U.S. generally acceptedaccounting principles (GAAP). Our non-GAAP financialmeasures exclude the impact of inventory step-up and otherinventory charges, “Special items,” “Certain claims,” goodwillimpairment, and the taxes on those items in addition to certainother tax adjustments. We use this information internally andbelieve it is helpful to investors because it allows moremeaningful period-to-period comparisons of our ongoingoperating results, it helps to perform trend analysis and tobetter identify operating trends that may otherwise be maskedor distorted by these types of items, and it provides a higherdegree of transparency of certain items. Certain of these non-GAAP financial measures are used as metrics for our incentivecompensation programs.
Our non-GAAP adjusted net earnings used for internalmanagement purposes for the years ended December 31, 2012,2011 and 2010 were $932.5 million, $905.6 million, and $871.6million, respectively, and our non-GAAP adjusted dilutedearnings per share were $5.30, $4.80, and $4.33, respectively.
The following are reconciliations from our GAAP netearnings and diluted earnings per share to our non-GAAPadjusted net earnings and non-GAAP adjusted diluted earningsper share used for internal management purposes (in millions,except per share amounts).
Year ended December 31, 2012 2011 2010
Net Earnings of Zimmer Holdings, Inc. $755.0 $760.8 $596.9Inventory step-up and other inventory
charges 4.8 11.4 1.4Certain claims 15.0 157.8 75.0Goodwill impairment 96.0 – 204.0Special items 155.4 75.2 34.7Taxes on above items and other certain
tax adjustments* (93.7) (99.6) (40.4)
Adjusted Net Earnings $932.5 $905.6 $871.6
* The tax effect is calculated based upon the statutory rates for thejurisdictions where the items were incurred.
Year ended December 31, 2012 2011 2010
Diluted EPS $ 4.29 $ 4.03 $ 2.97Inventory step-up and other inventory
charges 0.03 0.06 0.01Certain claims 0.09 0.84 0.37Goodwill impairment 0.54 – 1.01Special items 0.88 0.40 0.17Taxes on above items and other certain tax
adjustments* (0.53) (0.53) (0.20)
Adjusted Diluted EPS $ 5.30 $ 4.80 $ 4.33
* The tax effect is calculated based upon the statutory rates for thejurisdictions where the items were incurred.
LIQUIDITY AND CAPITAL RESOURCES
Cash flows provided by operating activities were $1,151.9million in 2012, compared to $1,176.9 million in 2011. Theprincipal source of cash from operating activities in 2012 wasnet earnings. Non-cash charges included in net earningsaccounted for another $454.1 million of operating cash. Allother items of operating cash flows in 2012 were outflows of$55.1 million of cash. The lower cash flows provided byoperating activities in 2012 were primarily due to increasedinvestments in inventory to support significant new productlaunches and increased product liability payments. We paidapproximately $90 million, $60 million and $45 million in 2012,2011 and 2010, respectively, related to Durom Cup productliability claims. We estimate the net remaining liability afterinsurance recovery for Durom Cup claims as of December 31,2012, is $162.8 million. We expect to pay the majority of thisamount over the next five years.
24

ZIMMER HOLDINGS, INC. 2012 FORM 10-K ANNUAL REPORT
At December 31, 2012, we had 64 days of salesoutstanding in trade accounts receivable, which was the sameas December 31, 2011. At December 31, 2012, we had 301 daysof inventory on hand, an increase of 24 days compared toDecember 31, 2011. Days of inventory on hand have increaseddue to significant new product launches.
Cash flows used in investing activities were $592.1 millionin 2012, compared to $624.4 million in 2011. Additions toinstruments and additions to other property, plant andequipment did not change significantly year-over-year. In 2013,instrument additions are expected to be in a range of $125 to$145 million and property, plant and equipment additions areexpected to be in a range of $115 to $135 million. We feel thislevel of capital spending is necessary to support new product-related investments and replacement of older machinery andequipment. We invest some of our cash and cash equivalents inhighly-rated debt securities. The purchases and any sales ormaturities of these investments are reflected as cash flowsfrom investing activities. The timing of these investments canvary from year to year depending on the maturity of the debtsecurities and other cash and cash equivalent needs. Acquiredintellectual property rights relate to lump-sum payments madeto certain healthcare professionals and institutions in place offuture royalty payments that otherwise would have been dueunder the terms of prior contractual arrangements. In the pastthree years, we have made various business acquisitionsincluding Dornoch Medical Systems, Inc., SynvasiveTechnology, Inc., ExtraOrtho, Inc., Beijing Montagne MedicalDevice Co., Ltd., Sodem Diffusion S.A. and certain foreign-based distributors.
Cash flows used in financing activities were $436.5 millionfor 2012, compared to $455.8 million in 2011. In 2012, wereturned cash to our stockholders in the form of cashdividends of $94.4 million and share repurchases of $485.6million. In 2012 as it relates to our senior credit facility, weconverted some of the outstanding debt to a term loan and weborrowed $100.0 million to repurchase shares as well as fundother corporate cash needs. We plan to repay that $100.0million in the first quarter of 2013. In 2011, we issued seniorunsecured notes in public offerings and used some of theproceeds to repurchase shares.
In 2012, we paid cash dividends quarterly, starting inApril, at an annualized rate of $0.72 per share. We expect tocontinue paying cash dividends on a quarterly basis; however,future dividends are subject to approval of the Board ofDirectors and may be adjusted as business needs or marketconditions change. In December 2012, our Board of Directorsdeclared a cash dividend of $0.18 per share that was paid inJanuary 2013.
We have four tranches of senior notes outstanding: $250million aggregate principal amount of 1.4 percent notes dueNovember 30, 2014, $500 million aggregate principal amount of4.625 percent notes due November 30, 2019, $300 millionaggregate principal amount of 3.375 percent notes dueNovember 30, 2021 and $500 million aggregate principalamount of 5.75 percent notes due November 30, 2039. Intereston each series is payable on May 30 and November 30 of eachyear until maturity.
We may redeem the senior notes at our election in wholeor in part at any time prior to maturity at a redemption priceequal to the greater of 1) 100 percent of the principal amountof the notes being redeemed; or 2) the sum of the presentvalues of the remaining scheduled payments of principal andinterest (not including any portion of such payments ofinterest accrued as of the date of redemption), discounted tothe date of redemption on a semi-annual basis at the TreasuryRate (as defined in the debt agreement), plus 15 basis pointsin the case of the 2014 notes, 20 basis points in the case of the2019 and 2021 notes, and 25 basis points in the case of the2039 notes. We would also pay the accrued and unpaid intereston the senior notes to the redemption date.
In May 2012, we entered into a new five-year $1,350million revolving, multi-currency, Senior Credit Facilitymaturing May 9, 2017. The Senior Credit Facility replaced aprevious credit facility with similar terms that was due tomature on November 30, 2012. As of December 31, 2012, wehad $100.0 million outstanding under the Senior Credit Facilityand an availability of $1,250.0 million.
We and certain of our wholly owned foreign subsidiariesare the borrowers under the Senior Credit Facility. Borrowingsunder the Senior Credit Facility bear interest at a LIBOR-basedrate plus an applicable margin determined by reference to oursenior unsecured long-term credit rating and the amountsdrawn under the Senior Credit Facility, at an alternate baserate, or at a fixed-rate determined through a competitive bidprocess. The Senior Credit Facility contains customaryaffirmative and negative covenants and events of default for anunsecured financing arrangement, including, among otherthings, limitations on consolidations, mergers and sales ortransfers of assets. Financial covenants include a maximumleverage ratio of 3.0 to 1.0. If we fall below an investment gradecredit rating, additional restrictions would result, includingrestrictions on investments, payment of dividends and stockrepurchases. We were in compliance with all covenants underthe Senior Credit Facility as of December 31, 2012.Commitments under the Senior Credit Facility are subject tocertain fees, including a facility and a utilization fee.Borrowings under the Senior Credit Facility at December 31,2012 are U.S. Dollar-based.
Borrowings of 11.7 billion Japanese Yen outstanding underthe previous credit facility were converted to the Senior CreditFacility. On May 24, 2012, we refinanced these borrowings byentering into a separate Term Loan agreement with one of thelenders under the Senior Credit Facility for 11.7 billionJapanese Yen and we repaid the outstanding borrowings underthe Senior Credit Facility.
The Term Loan will mature on May 31, 2016. Borrowingsunder the Term Loan bear interest at a fixed rate of 0.61percent per annum until maturity.
We also have available uncommitted credit facilitiestotaling $79.1 million.
We place our cash and cash equivalents in highly-ratedfinancial institutions and limit the amount of credit exposure toany one entity. We invest only in high-quality financialinstruments in accordance with our internal investment policy.
25

ZIMMER HOLDINGS, INC. 2012 FORM 10-K ANNUAL REPORT
As of December 31, 2012, we had short-term and long-term investments in debt securities with a fair value of $915.7million. These investments are in debt securities of manydifferent issuers and therefore we have no significantconcentration of risk with a single issuer. All of these debtsecurities remain highly-rated and we believe the risk ofdefault by the issuers is low.
As of December 31, 2012, $1,063.1 million of our cash andcash equivalents and short-term and long-term investments areheld in jurisdictions outside of the U.S. and are expected to beindefinitely reinvested for continued use in foreign operations.Repatriation of these assets to the U.S. may have taxconsequences. $829.8 million of this amount is denominated inU.S. Dollars and therefore bears no foreign currencytranslation risk. The balance of these assets is denominated incurrencies of the various countries where we operate.
We may use excess cash to repurchase common stockunder our share repurchase program. As of December 31,2012, $1,014.6 million remained authorized under a $1.5 billionrepurchase program, which will expire on December 31, 2014.
Management believes that cash flows from operations andavailable borrowings under the Senior Credit Facility aresufficient to meet our working capital, capital expenditure anddebt service needs, as well as return cash to stockholders inthe form of dividends and share repurchases. Shouldinvestment opportunities arise, we believe that our earnings,balance sheet and cash flows will allow us to obtain additionalcapital, if necessary.
CONTRACTUAL OBLIGATIONS
We have entered into contracts with various third partiesin the normal course of business that will require futurepayments. The following table illustrates our contractualobligations (in millions):
Contractual Obligations Total 2013
2014
and
2015
2016
and
2017
2018
and
Thereafter
Long-term debt $1,688.6 $ – $250.0 $138.6 $1,300.0
Interest payments 1,045.4 67.7 132.0 126.4 719.3
Operating leases 192.0 45.9 59.5 39.5 47.1
Purchaseobligations 12.0 12.0 – – –
Other long-termliabilities 295.7 – 148.1 106.7 40.9
Total contractualobligations $3,233.7 $125.6 $589.6 $411.2 $2,107.3
$48.1 million of the other long-term liabilities on ourbalance sheet as of December 31, 2012, are liabilities related todefined benefit pension plans. Defined benefit plan liabilitiesare based upon the underfunded status of the respective plans;they are not based upon future contributions. Due touncertainties regarding future plan asset performance,changes in interest rates and our intentions with respect tovoluntary contributions, we are unable to reasonably estimatefuture contributions beyond 2013. Therefore, this table doesnot include any amounts related to future contributions to our
plans. See Note 14 to our consolidated financial statements forfurther information on our defined benefit plans.
Also included in other long-term liabilities on our balancesheet are liabilities related to unrecognized tax benefits andcorresponding interest and penalties thereon. Due to theuncertainties inherent in these liabilities, such as the ultimatetiming and resolution of tax audits, we are unable toreasonably estimate the amount or period in which potentialtax payments related to these positions will be made.Therefore, this table does not include any obligations relatedto unrecognized tax benefits. See Note 15 to our consolidatedfinancial statements for further information on theseunrecognized tax benefits.
We have entered into various agreements that may resultin future payments dependent upon various events such as theachievement of certain product R&D milestones, salesmilestones, or at our discretion to maintain exclusive rights todistribute a product. Since there is uncertainty on the timingor whether such payments will have to be made, we have notincluded them in this table. These payments could range from$0 to $54 million.
CRITICAL ACCOUNTING ESTIMATES
Our financial results are affected by the selection andapplication of accounting policies and methods. Significantaccounting policies which require management’s judgment arediscussed below.
Excess Inventory and Instruments – We mustdetermine as of each balance sheet date how much, if any, ofour inventory may ultimately prove to be unsaleable orunsaleable at our carrying cost. Similarly, we must alsodetermine if instruments on hand will be put to productive useor remain undeployed as a result of excess supply.Accordingly, inventory and instruments are written down totheir net realizable value. To determine the appropriate netrealizable value, we evaluate current stock levels in relation tohistorical and expected patterns of demand for all of ourproducts and instrument systems and components. The basisfor the determination is generally the same for all inventoryand instrument items and categories except forwork-in-process inventory, which is recorded at cost. Obsoleteor discontinued items are generally destroyed and completelywritten off. Management evaluates the need for changes toinventory and instruments net realizable values based onmarket conditions, competitive offerings and other factors on aregular basis.
Income Taxes – Our income tax expense, deferredtax assets and liabilities and reserves for unrecognized taxbenefits reflect management’s best assessment of estimatedfuture taxes to be paid. We are subject to income taxes in theU.S. and numerous foreign jurisdictions. Significant judgmentsand estimates are required in determining the consolidatedincome tax expense.
We estimate income tax expense and income tax liabilitiesand assets by taxable jurisdiction. Realization of deferred taxassets in each taxable jurisdiction is dependent on our abilityto generate future taxable income sufficient to realize the
26

ZIMMER HOLDINGS, INC. 2012 FORM 10-K ANNUAL REPORT
benefits. We evaluate deferred tax assets on an ongoing basisand provide valuation allowances unless we determine it is“more likely than not” that the deferred tax benefit will berealized. Federal income taxes are provided on the portion ofthe income of foreign subsidiaries that is expected to beremitted to the U.S.
The calculation of our tax liabilities involves dealing withuncertainties in the application of complex tax laws andregulations in a multitude of jurisdictions across our globaloperations. We are subject to regulatory review or audit invirtually all of those jurisdictions and those reviews and auditsmay require extended periods of time to resolve. We recordour income tax provisions based on our knowledge of allrelevant facts and circumstances, including existing tax laws,our experience with previous settlement agreements, thestatus of current examinations and our understanding of howthe tax authorities view certain relevant industry andcommercial matters.
We recognize tax liabilities in accordance with theFinancial Accounting Standards Board’s (FASB) guidance onincome taxes and we adjust these liabilities when our judgmentchanges as a result of the evaluation of new information notpreviously available. Due to the complexity of some of theseuncertainties, the ultimate resolution may result in a paymentthat is materially different from our current estimate of the taxliabilities. These differences will be reflected as increases ordecreases to income tax expense in the period in which theyare determined.
Commitments and Contingencies – Accruals forproduct liability and other claims are established with theassistance of internal and external legal counsel based oncurrent information and historical settlement information forclaims, related legal fees and for claims incurred but notreported. We use an actuarial model to assist management indetermining an appropriate level of accruals for productliability claims. Historical patterns of claim loss developmentover time are statistically analyzed to arrive at factors whichare then applied to loss estimates in the actuarial model.
In addition to our general product liability, we haverecorded provisions totaling $403.2 million related to theDurom Cup, including $15.0 million in 2012. See Note 19 toour consolidated financial statements for further discussion ofthe Durom Cup.
Goodwill and Intangible Assets – We evaluate thecarrying value of goodwill and indefinite life intangible assetsannually, or whenever events or circumstances indicate thecarrying value may not be recoverable. We evaluate thecarrying value of finite life intangible assets whenever eventsor circumstances indicate the carrying value may not berecoverable. Significant assumptions are required to estimate
the fair value of goodwill and intangible assets, most notablyestimated future cash flows generated by these assets. Assuch, these fair valuation measurements use significantunobservable inputs. Changes to these assumptions couldrequire us to record impairment charges on these assets.
In the fourth quarter of 2012, we determined our U.S.Spine reporting unit’s carrying value was in excess of itsestimated fair value. Fair value was determined using an equalweighting of income and market approaches. Fair value underthe income approach was determined by discounting topresent value the estimated future cash flows of the reportingunit. Fair value under the market approach utilized theguideline public company methodology, which uses valuationindicators determined from other businesses that are similar toour U.S. Spine reporting unit.
As a result, we recorded a goodwill impairment charge forthe U.S. Spine reporting unit of $96.0 million in 2012. In 2010,we also recorded an impairment charge related to thisreporting unit of $204.0 million. See Note 8 to our consolidatedfinancial statements for further discussion and the factors thatcontributed to these impairment charges and the factors thatcould lead to further impairment.
We have six other reporting units with goodwill assignedto them. We estimated the fair value of those reporting unitsusing the income approach by discounting to present value theestimated future cash flows of the reporting unit, or by doing aqualitative assessment of changes in fair value from the prioryear’s income approach. For each of those six reporting units,the estimated fair value substantially exceeded the carryingvalue.
Share-based Payment – We measure share-basedpayment expense at the grant date based on the fair value ofthe award and recognize expense over the requisite serviceperiod. Determining the fair value of share-based awards at thegrant date requires judgment, including estimating theexpected life of stock options and the expected volatility of ourstock. Additionally, we must estimate the amount of share-based awards that are expected to be forfeited. We estimateexpected volatility based upon the implied volatility of activelytraded options on our stock. The expected life of stock optionsand estimated forfeitures are based upon our employees’historical exercise and forfeiture behaviors. The assumptionsused in determining the grant date fair value and the expectedforfeitures represent management’s best estimates.
RECENT ACCOUNTING PRONOUNCEMENTS
See Note 2 to our consolidated financial statements to seehow recent accounting pronouncements have affected or mayaffect our financial position, results of operations or cash flows.
27
ZIMMER HOLDINGS, INC. 2012 FORM 10-K ANNUAL REPORT
ITEM 7A. Quantitative and Qualitative Disclosures About Market Risk
MARKET RISK
We are exposed to certain market risks as part of ourongoing business operations, including risks from changes inforeign currency exchange rates, interest rates and commodityprices that could affect our financial condition, results ofoperations and cash flows. We manage our exposure to theseand other market risks through regular operating andfinancing activities and through the use of derivative financialinstruments. We use derivative financial instruments solely asrisk management tools and not for speculative investmentpurposes.
FOREIGN CURRENCY EXCHANGE RISK
We operate on a global basis and are exposed to the riskthat our financial condition, results of operations and cashflows could be adversely affected by changes in foreigncurrency exchange rates. We are primarily exposed to foreigncurrency exchange rate risk with respect to transactions andnet assets denominated in Euros, Swiss Francs, Japanese Yen,British Pounds, Canadian Dollars, Australian Dollars, KoreanWon, Swedish Krona, Czech Koruna, Thai Baht, TaiwanDollars, South African Rand, Russian Rubles and IndianRupees. We manage the foreign currency exposure centrally,on a combined basis, which allows us to net exposures and totake advantage of any natural offsets. To reduce theuncertainty of foreign currency exchange rate movements ontransactions denominated in foreign currencies, we enter intoderivative financial instruments in the form of foreigncurrency exchange forward contracts and options with majorfinancial institutions. These forward contracts and options aredesigned to hedge anticipated foreign currency transactions,primarily intercompany sale and purchase transactions, forperiods consistent with commitments. Realized and unrealizedgains and losses on these contracts and options that qualify ascash flow hedges are temporarily recorded in othercomprehensive income, then recognized in cost of productssold when the hedged item affects net earnings.
For contracts outstanding at December 31, 2012, we hadobligations to purchase U.S. Dollars and sell Euros, JapaneseYen, British Pounds, Canadian Dollars, Australian Dollars,Korean Won, Swedish Krona, Czech Koruna, Thai Baht,Taiwan Dollars, South African Rand, Russian Rubles andIndian Rupees and purchase Swiss Francs and sell U.S. Dollarsat set maturity dates ranging from January 2013 through June2015. The notional amounts of outstanding forward contractsentered into with third parties to purchase U.S. Dollars atDecember 31, 2012 were $1,548.8 million. The notionalamounts of outstanding forward contracts entered into withthird parties to purchase Swiss Francs at December 31, 2012were $303.9 million. The weighted average contract ratesoutstanding at December 31, 2012 were Euro:USD 1.33, Swiss
Franc:USD 1.08, USD:Japanese Yen 78.27, British Pound:USD1.58, USD:Canadian Dollar 1.01, Australian Dollar:USD 0.96,USD:Korean Won 1,169, USD:Swedish Krona 6.85, USD:CzechKoruna 18.66, USD:Thai Baht 32.09, USD:Taiwan Dollar 29.01,USD:South African Rand 8.72, USD:Russian Ruble 33.42 andUSD:Indian Ruppee 54.58.
We maintain written policies and procedures governingour risk management activities. Our policy requires thatcritical terms of hedging instruments be the same as hedgedforecasted transactions. On this basis, with respect to cashflow hedges, changes in cash flows attributable to hedgedtransactions are generally expected to be completely offset bychanges in the fair value of hedge instruments. As part of ourrisk management program, we also perform sensitivityanalyses to assess potential changes in revenue, operatingresults, cash flows and financial position relating tohypothetical movements in currency exchange rates. Asensitivity analysis of changes in the fair value of foreigncurrency exchange forward contracts outstanding atDecember 31, 2012 indicated that, if the U.S. Dollar uniformlychanged in value by 10 percent relative to the variouscurrencies, with no change in the interest differentials, the fairvalue of those contracts would increase or decrease earningsbefore income taxes in periods through June 2016, dependingon the direction of the change, by the following averageapproximate amounts (in millions):
Currency
Average
Amount
Euro $68.2Swiss Franc 30.0Japanese Yen 35.1British Pound 14.5Canadian Dollar 11.4Australian Dollar 12.5Korean Won 3.2Swedish Krona 3.0Czech Koruna 0.6Thai Baht 1.2Taiwan Dollars 2.1South African Rand 0.7Russian Rubles 2.1Indian Rupees 1.0
Any change in the fair value of foreign currency exchangeforward contracts as a result of a fluctuation in a currencyexchange rate is expected to be largely offset by a change inthe value of the hedged transaction. Consequently, foreigncurrency exchange contracts would not subject us to materialrisk due to exchange rate movements because gains and losseson these contracts offset gains and losses on the assets,liabilities and transactions being hedged.
28
ZIMMER HOLDINGS, INC. 2012 FORM 10-K ANNUAL REPORT
We had net investment exposures to net foreign currencydenominated assets and liabilities of $2,494.5 million atDecember 31, 2012, primarily in Euros and Japanese Yen.$1,320.9 million of the net asset exposure at December 31,2012 relates to goodwill recorded in the Europe and AsiaPacific geographic segments.
We enter into foreign currency forward exchangecontracts with terms of one month to manage currencyexposures for monetary assets and liabilities denominated in acurrency other than an entity’s functional currency. As aresult, foreign currency remeasurement gains/lossesrecognized in earnings are generally offset with gains/losses onthe foreign currency forward exchange contracts in the samereporting period.
COMMODITY PRICE RISK
We purchase raw material commodities such as cobaltchrome, titanium, tantalum, polymer and sterile packaging. Weenter into supply contracts generally with terms of 12 to 24months, where available, on these commodities to alleviate theeffect of market fluctuation in prices. As part of our riskmanagement program, we perform sensitivity analyses relatedto potential commodity price changes. A 10 percent pricechange across all these commodities would not have a materialeffect on our consolidated financial position, results ofoperations or cash flows.
INTEREST RATE RISK
In the normal course of business, we are exposed tomarket risk from changes in interest rates that could affect ourresults of operations and financial condition. We manage ourexposure to interest rate risks through our regular operationsand financing activities.
We invest our cash and cash equivalents primarily inhighly-rated corporate commercial paper and bank deposits.We also have short-term and long-term investments in highly-rated corporate debt securities, U.S. government and agencydebt securities, U.S. government treasury funds, municipalbonds, foreign government debt securities, commercial paperand certificates of deposit. The primary investment objective isto ensure capital preservation of our invested principal funds.Currently, we do not use derivative financial instruments inour investment portfolio.
We are exposed to interest rate risk on our debtobligations and our cash and cash equivalents. Presently, all ofour debt outstanding under the Senior Credit Facility bearsinterest at short-term variable rates.
In 2010, we entered into interest rate swap agreementswith a consolidated notional amount of $250 million that hedgea portion of our $500 million 4.625 percent Senior Notes dueNovember 30, 2019. On the interest rate swap agreementsoutstanding as of December 31, 2012, we receive a fixedinterest rate of 4.625 percent and we pay variable interestequal to the three-month LIBOR plus an average of 133 basispoints.
The interest rate swap agreements are to manage ourexposure to interest rate movements by converting fixed-ratedebt into variable-rate debt. The objective of the instruments isto more closely align interest expense with interest incomereceived on cash and cash equivalents.
These derivative instruments are designated as fair valuehedges under U.S. GAAP. Changes in the fair value of thederivative instrument are recorded in earnings and are offsetby gains or losses on the underlying debt instrument.
Based upon our overall interest rate exposure as ofDecember 31, 2012, a change of 10 percent in interest rates,assuming the amount outstanding remains constant, would nothave a material effect on net interest expense. This analysisdoes not consider the effect of the change in the level ofoverall economic activity that could exist in such anenvironment.
CREDIT RISK
Financial instruments, which potentially subject us toconcentrations of credit risk, are primarily cash and cashequivalents, short-term and long-term investments, derivativeinstruments, counterparty transactions and accountsreceivable.
We place our investments in highly-rated financialinstitutions or highly-rated debt securities and limit theamount of credit exposure to any one entity. We believe we donot have any significant credit risk on our cash and cashequivalents and investments.
We are exposed to credit loss if the financial institutionsor counterparties issuing the debt security fail to perform.However, this loss is limited to the amounts, if any, by whichthe obligations of the counterparty to the financial instrumentcontract exceed our obligation. We also minimize exposure tocredit risk by dealing with a diversified group of major financialinstitutions. We manage credit risk by monitoring the financialcondition of our counterparties using standard creditguidelines. We do not anticipate any nonperformance by any ofthe counterparties.
Our concentrations of credit risks with respect to tradeaccounts receivable is limited due to the large number ofcustomers and their dispersion across a number of geographicareas and by frequent monitoring of the creditworthiness ofthe customers to whom credit is granted in the normal courseof business. Substantially all of our trade receivables areconcentrated in the public and private hospital and healthcareindustry in the U.S. and internationally or with distributors ordealers who operate in international markets and, accordingly,are exposed to their respective business, economic andcountry specific variables.
Our ability to collect accounts receivable in somecountries depends in part upon the financial stability of thesehospital and healthcare sectors and the respective countries’national economic and healthcare systems. Most notably, inEurope healthcare is typically sponsored by the government.Since we sell products to public hospitals in those countries,we are indirectly exposed to government budget constraints.
29

ZIMMER HOLDINGS, INC. 2012 FORM 10-K ANNUAL REPORT
The ongoing financial crisis in the Euro zone continues toimpact the indirect credit exposure we have to thosegovernments through their public hospitals. We haveexperienced an increasing number of days sales outstanding insome European countries compared to levels in 2010. As ofDecember 31, 2012, in Greece, Italy, Portugal and Spain,countries that have been widely recognized as presenting thehighest risk, our gross short-term and long-term tradeaccounts receivable combined were $209.2 million. Withallowances for doubtful accounts of $7.8 million recorded inthose countries, the net balance was $201.4 million,representing 24 percent of our total consolidated short-termand long-term trade accounts receivable balance, net. Italy andSpain account for $191.6 million of that net amount. We areactively monitoring the situations in these countries. Wemaintain contact with these customers on a regular basis. We
continue to receive payments, albeit at a slower rate than inthe past. We believe our allowance for doubtful accounts isadequate in these countries, as ultimately we believe thegovernments in these countries will be able to pay. As evidenceof this, in Spain we received significant payments in July 2012,to settle certain past due accounts receivable. To the extentthese governments’ ability to fund their public hospitalprograms deteriorates, we may have to record significant baddebt expenses in the future.
While we are exposed to risks from the broader healthcareindustry in Europe and around the world, there is nosignificant net exposure due to any individual customer.Exposure to credit risk is controlled through credit approvals,credit limits and monitoring procedures and we believe thatreserves for losses are adequate.
30
ZIMMER HOLDINGS, INC. 2012 FORM 10-K ANNUAL REPORT
Management’s Report on Internal Control Over Financial Reporting
The management of Zimmer Holdings, Inc. is responsible for establishing and maintaining adequate internal control overfinancial reporting. Internal control over financial reporting is defined in Rules 13a-15(f) or 15d-15(f) promulgated under theSecurities Exchange Act of 1934 as a process designed by, or under the supervision of, the company’s principal executive andprincipal financial officers and effected by the company’s Board of Directors, management and other personnel, to providereasonable assurance regarding the reliability of financial reporting and the preparation of financial statements for externalpurposes in accordance with U.S. generally accepted accounting principles and includes those policies and procedures that:
• Pertain to the maintenance of records that in reasonable detail accurately and fairly reflect the transactions and dispositionsof the assets of the company;
• Provide reasonable assurance that transactions are recorded as necessary to permit preparation of financial statements inaccordance with U.S. generally accepted accounting principles, and that receipts and expenditures of the company are beingmade only in accordance with authorizations of management and directors of the company; and
• Provide reasonable assurance regarding prevention or timely detection of unauthorized acquisition, use or disposition of thecompany’s assets that could have a material effect on the financial statements.
Because of its inherent limitations, the company’s internal control over financial reporting may not prevent or detectmisstatements. Also, projections of any evaluation of effectiveness to future periods are subject to the risk that controls maybecome inadequate because of changes in conditions, or that the degree of compliance with the policies or procedures maydeteriorate.
The company’s management assessed the effectiveness of the company’s internal control over financial reporting as ofDecember 31, 2012. In making this assessment, the company’s management used the criteria set forth by the Committee ofSponsoring Organizations of the Treadway Commission (COSO) in Internal Control-Integrated Framework.
Based on that assessment, management has concluded that, as of December 31, 2012, the company’s internal control overfinancial reporting is effective based on those criteria.
The company’s independent registered public accounting firm has audited the effectiveness of the company’s internal controlover financial reporting as of December 31, 2012, as stated in its report which appears in Item 8 of this Annual Report onForm 10-K.
31

ZIMMER HOLDINGS, INC. 2012 FORM 10-K ANNUAL REPORT
ITEM 8. Financial Statements and Supplementary Data
Zimmer Holdings, Inc.Index to Consolidated Financial Statements
Financial Statements: Page
Report of Independent Registered Public Accounting Firm 33
Consolidated Statements of Earnings for the Years Ended December 31, 2012, 2011 and 2010 34
Consolidated Statements of Comprehensive Income for the Years Ended December 31, 2012, 2011 and 2010 35
Consolidated Balance Sheets as of December 31, 2012 and 2011 36
Consolidated Statements of Stockholders’ Equity for the Years Ended December 31, 2012, 2011 and 2010 37
Consolidated Statements of Cash Flows for the Years Ended December 31, 2012, 2011 and 2010 38
Notes to Consolidated Financial Statements 39
32

ZIMMER HOLDINGS, INC. 2012 FORM 10-K ANNUAL REPORT
Report of Independent Registered Public Accounting Firm
To the Stockholders and Board of Directors of Zimmer Holdings, Inc.:
In our opinion, the consolidated financial statements listed in the index appearing under Item 15(a)(1) present fairly, in allmaterial respects, the financial position of Zimmer Holdings, Inc. and its subsidiaries at December 31, 2012 and 2011, and theresults of their operations and their cash flows for each of the three years in the period ended December 31, 2012 in conformitywith accounting principles generally accepted in the United States of America. In addition, in our opinion, the financial statementschedule listed in the accompanying index appearing under Item 15(a)(2) presents fairly, in all material respects, the informationset forth therein when read in conjunction with the related consolidated financial statements. Also in our opinion, the Companymaintained, in all material respects, effective internal control over financial reporting as of December 31, 2012, based on criteriaestablished in Internal Control - Integrated Framework issued by the Committee of Sponsoring Organizations of the TreadwayCommission (COSO). The Company’s management is responsible for these financial statements and financial statement schedule,for maintaining effective internal control over financial reporting and for its assessment of the effectiveness of internal control overfinancial reporting, included in the accompanying Management’s Report on Internal Control Over Financial Reporting. Ourresponsibility is to express opinions on these financial statements, on the financial statement schedule, and on the Company’sinternal control over financial reporting based on our integrated audits. We conducted our audits in accordance with the standardsof the Public Company Accounting Oversight Board (United States). Those standards require that we plan and perform the auditsto obtain reasonable assurance about whether the financial statements are free of material misstatement and whether effectiveinternal control over financial reporting was maintained in all material respects. Our audits of the financial statements includedexamining, on a test basis, evidence supporting the amounts and disclosures in the financial statements, assessing the accountingprinciples used and significant estimates made by management, and evaluating the overall financial statement presentation. Ouraudit of internal control over financial reporting included obtaining an understanding of internal control over financial reporting,assessing the risk that a material weakness exists, and testing and evaluating the design and operating effectiveness of internalcontrol based on the assessed risk. Our audits also included performing such other procedures as we considered necessary in thecircumstances. We believe that our audits provide a reasonable basis for our opinions.
A company’s internal control over financial reporting is a process designed to provide reasonable assurance regarding thereliability of financial reporting and the preparation of financial statements for external purposes in accordance with generallyaccepted accounting principles. A company’s internal control over financial reporting includes those policies and procedures that(i) pertain to the maintenance of records that, in reasonable detail, accurately and fairly reflect the transactions and dispositions ofthe assets of the company; (ii) provide reasonable assurance that transactions are recorded as necessary to permit preparation offinancial statements in accordance with generally accepted accounting principles, and that receipts and expenditures of thecompany are being made only in accordance with authorizations of management and directors of the company; and (iii) providereasonable assurance regarding prevention or timely detection of unauthorized acquisition, use, or disposition of the company’sassets that could have a material effect on the financial statements.
Because of its inherent limitations, internal control over financial reporting may not prevent or detect misstatements. Also,projections of any evaluation of effectiveness to future periods are subject to the risk that controls may become inadequate becauseof changes in conditions, or that the degree of compliance with the policies or procedures may deteriorate.
PricewaterhouseCoopers LLPChicago, IllinoisFebruary 27, 2013
33

ZIMMER HOLDINGS, INC. 2012 FORM 10-K ANNUAL REPORT
Consolidated Statements of Earnings
(in millions, except per share amounts)
For the Years Ended December 31, 2012 2011 2010
Net Sales $4,471.7 $4,451.8 $4,220.2Cost of products sold 1,125.2 1,122.0 1,012.2
Gross Profit 3,346.5 3,329.8 3,208.0
Research and development 225.6 238.4 218.5Selling, general and administrative 1,807.1 1,834.3 1,759.1Certain claims (Note 19) 15.0 157.8 75.0Goodwill impairment (Note 8) 96.0 – 204.0Special items (Note 2) 155.4 75.2 34.7
Operating expenses 2,299.1 2,305.7 2,291.3
Operating Profit 1,047.4 1,024.1 916.7Interest income 15.6 10.1 3.7Interest expense (72.9) (55.3) (60.2)
Earnings before income taxes 990.1 978.9 860.2Provision for income taxes 237.2 218.9 263.3
Net earnings 752.9 760.0 596.9Less: Net loss attributable to noncontrolling interest (2.1) (0.8) –
Net Earnings of Zimmer Holdings, Inc. $ 755.0 $ 760.8 $ 596.9
Earnings Per Common Share – Basic $ 4.32 $ 4.05 $ 2.98
Earnings Per Common Share – Diluted $ 4.29 $ 4.03 $ 2.97
Weighted Average Common Shares OutstandingBasic 174.9 187.6 200.0
Diluted 176.0 188.7 201.1Cash Dividends Declared Per Common Share $0.54 $0.18 $ –
The accompanying notes are an integral part of these consolidated financial statements.
34

ZIMMER HOLDINGS, INC. 2012 FORM 10-K ANNUAL REPORT
Consolidated Statements of Comprehensive Income
(in millions)
For the Years Ended December 31, 2012 2011 2010
Net Earnings $752.9 $760.0 $596.9
Other Comprehensive Income (Loss):
Foreign currency cumulative translation adjustments 46.1 4.6 (38.6)
Unrealized cash flow hedge gains/(losses), net of tax effects of (4.3) in 2012, 4.3 in 2011 and 10.1 in2010 10.9 (30.6) 21.6
Reclassification adjustments on cash flow hedges, net of tax effects of (8.9) in 2012, (16.7) in 2011and (4.3) in 2010 3.3 24.5 (11.6)
Unrealized gains/(losses) on securities, net of tax effects of 0.0 in 2012, 0.0 in 2011 and 0.3 in 2010 0.4 0.2 (0.8)
Reclassification adjustments on securities, net of tax effects of (1.2) in 2010 – – 2.2
Adjustments to prior service cost and unrecognized actuarial assumptions, net of tax effects of(8.5) in 2012, 23.0 in 2011 and 4.4 in 2010 11.8 (48.3) (10.4)
Total Other Comprehensive Income (Loss) 72.5 (49.6) (37.6)
Comprehensive Income 825.4 710.4 559.3
Comprehensive Loss Attributable to Noncontrolling Interest (2.2) (0.9) –
Comprehensive Income Attributable to Zimmer Holdings, Inc. $827.6 $711.3 $559.3
The accompanying notes are an integral part of these consolidated financial statements.
35

ZIMMER HOLDINGS, INC. 2012 FORM 10-K ANNUAL REPORT
Consolidated Balance Sheets
(in millions)
As of December 31, 2012 2011
ASSETSCurrent Assets:
Cash and cash equivalents $ 884.3 $ 768.3Short-term investments 671.6 455.5Accounts receivable, less allowance for doubtful accounts 884.6 838.8Inventories 995.3 929.8Prepaid expenses and other current assets 76.3 73.7Deferred income taxes 196.6 210.5
Total Current Assets 3,708.7 3,276.6Property, plant and equipment, net 1,210.7 1,207.3Goodwill 2,571.8 2,626.0Intangible assets, net 740.7 798.5Other assets 780.5 606.9
Total Assets $ 9,012.4 $ 8,515.3
LIABILITIES AND STOCKHOLDERS’ EQUITYCurrent Liabilities:
Accounts payable $ 184.1 $ 143.3Income taxes 22.8 8.6Short-term debt 100.1 143.3Other current liabilities 559.0 571.9
Total Current Liabilities 866.0 867.1
Other long-term liabilities 559.3 557.4
Long-term debt 1,720.8 1,576.0
Total Liabilities 3,146.1 3,000.5
Commitments and Contingencies (Note 19)Stockholders’ Equity:
Common stock, $0.01 par value, one billion shares authorized,257.1 million (255.9 million in 2011) issued 2.6 2.5
Paid-in capital 3,500.6 3,399.2Retained earnings 7,085.9 6,426.8Accumulated other comprehensive income 343.9 271.4Treasury stock, 85.5 million shares (77.9 million shares in 2011) (5,072.1) (4,592.7)
Total Zimmer Holdings, Inc. stockholders’ equity 5,860.9 5,507.2Noncontrolling interest 5.4 7.6
Total Stockholders’ Equity 5,866.3 5,514.8
Total Liabilities and Stockholders’ Equity $ 9,012.4 $ 8,515.3
The accompanying notes are an integral part of these consolidated financial statements.
36

ZIMMER HOLDINGS, INC. 2012 FORM 10-K ANNUAL REPORT
Consolidated Statements of Stockholders’ Equity
(in millions)
Zimmer Holdings, Inc. Stockholders
AccumulatedOther Total
Common Shares Paid-in Retained Comprehensive Treasury Shares Noncontrolling Stockholders’
Number Amount Capital Earnings Income Number Amount Interest Equity
Balance January 1, 2010 254.1 $2.5 $3,214.6 $5,102.5 $358.6 (49.9) $(3,039.5) $ – $ 5,638.7Net earnings – – – 596.9 – – – – 596.9Other comprehensive loss – – – – (37.6) – – – (37.6)Stock compensation plans, including
tax benefits 0.5 – 78.9 – – – – – 78.9Share repurchases – – – – – (9.1) (505.6) – (505.6)
Balance December 31, 2010 254.6 2.5 3,293.5 5,699.4 321.0 (59.0) (3,545.1) – 5,771.3Net earnings – – – 760.8 – – – (0.8) 760.0Other comprehensive loss – – – – (49.6) – – (0.1) (49.7)Business combination with a
noncontrolling interest – – – – – – – 8.5 8.5Cash dividend declared of $0.18 per
share of common stock – – – (32.1) – – – – (32.1)Stock compensation plans, including
tax benefits 1.3 – 105.7 (1.3) – – 2.4 – 106.8Share repurchases – – – – – (18.9) (1,050.0) – (1,050.0)
Balance December 31, 2011 255.9 2.5 3,399.2 6,426.8 271.4 (77.9) (4,592.7) 7.6 5,514.8Net earnings – – – 755.0 – – – (2.1) 752.9Other comprehensive income – – – – 72.5 – – (0.1) 72.4Cash dividend declared of $0.54 per
share of common stock – – – (93.3) – – – – (93.3)Stock compensation plans, including
tax benefits 1.2 0.1 101.4 (2.6) – 0.1 6.2 – 105.1Share repurchases – – – – – (7.7) (485.6) – (485.6)
Balance December 31, 2012 257.1 $2.6 $3,500.6 $7,085.9 $343.9 (85.5) $(5,072.1) $ 5.4 $ 5,866.3
The accompanying notes are an integral part of these consolidated financial statements.
37

ZIMMER HOLDINGS, INC. 2012 FORM 10-K ANNUAL REPORT
Consolidated Statements of Cash Flows
(in millions)
For the Years Ended December 31, 2012 2011 2010
Cash flows provided by (used in) operating activities:
Net earnings $ 752.9 $ 760.0 $ 596.9
Adjustments to reconcile net earnings to net cash provided by operating activities:
Depreciation and amortization 363.1 359.9 340.2
Goodwill impairment 96.0 – 204.0
Share-based compensation 55.0 60.5 62.0
Income tax benefit from stock option exercises 11.0 12.9 4.2
Excess income tax benefit from stock option exercises (2.7) (5.0) (1.3)
Inventory step-up and other inventory charges 4.8 11.4 1.4
Deferred income tax provision (64.8) (19.7) (72.5)
Changes in operating assets and liabilities, net of acquired assets and liabilitiesIncome taxes payable 59.2 14.6 7.7Receivables (45.5) (63.2) (33.0)Inventories (67.5) 7.2 25.8Accounts payable and accrued liabilities 47.8 20.0 (0.8)Other assets and liabilities (57.4) 18.3 58.9
Net cash provided by operating activities 1,151.9 1,176.9 1,193.5
Cash flows provided by (used in) investing activities:
Additions to instruments (148.9) (155.4) (192.5)
Additions to other property, plant and equipment (114.7) (113.8) (79.2)
Acquisition of intellectual property rights (0.9) (18.9) (8.5)
Purchases of investments (1,130.1) (662.1) (413.3)
Sales of investments 878.5 394.8 67.5
Other business combination investments (59.0) (56.8) (82.6)
Investments in other assets (17.0) (12.2) (18.3)
Net cash used in investing activities (592.1) (624.4) (726.9)
Cash flows provided by (used in) financing activities:
Proceeds from issuance of notes – 549.3 –
Net proceeds (payments) under revolving credit facilities (50.1) 0.5 (2.2)
Proceeds from term loans 147.3 – –
Dividends paid to stockholders (94.4) – –
Debt issuance costs (3.3) (4.0) –
Proceeds from employee stock compensation plans 46.9 43.4 16.9
Excess income tax benefit from stock option exercises 2.7 5.0 1.3
Repurchase of common stock (485.6) (1,050.0) (505.6)
Net cash used in financing activities (436.5) (455.8) (489.6)
Effect of exchange rates on cash and cash equivalents (7.3) 2.7 0.2
Increase (decrease) in cash and cash equivalents 116.0 99.4 (22.8)Cash and cash equivalents, beginning of year 768.3 668.9 691.7
Cash and cash equivalents, end of year $ 884.3 $ 768.3 $ 668.9
The accompanying notes are an integral part of these consolidated financial statements.
38

ZIMMER HOLDINGS, INC. 2012 FORM 10-K ANNUAL REPORT
Notes to Consolidated Financial Statements
1. BUSINESS
We design, develop, manufacture and market orthopaedicreconstructive, spinal and trauma devices, biologics, dentalimplants and related surgical products. We also provide otherhealthcare related services. Orthopaedic reconstructivedevices restore function lost due to disease or trauma in jointssuch as knees, hips, shoulders and elbows. Dentalreconstructive implants restore function and aesthetics inpatients who have lost teeth due to trauma or disease. Spinaldevices are utilized by orthopaedic surgeons andneurosurgeons in the treatment of degenerative diseases,deformities and trauma in all regions of the spine. Traumaproducts are devices used primarily to reattach or stabilizedamaged bone and tissue to support the body’s natural healingprocess. Our related surgical products include surgicalsupplies and instruments designed to aid in orthopaedicsurgical procedures and post-operation rehabilitation. We haveoperations in more than 25 countries and market our productsin more than 100 countries. We operate in a single industry buthave three reportable geographic segments, the Americas,Europe and Asia Pacific.
The words “we,” “us,” “our” and similar words refer toZimmer Holdings, Inc. and its subsidiaries. Zimmer Holdingsrefers to the parent company only.
2. SIGNIFICANT ACCOUNTING POLICIES
Basis of Presentation – The consolidated financialstatements include the accounts of Zimmer Holdings and itssubsidiaries in which it holds a controlling financial interest.Investments in companies in which we exercise significantinfluence over the operating and financial affairs, but do notcontrol, are accounted for under the equity method. Under theequity method, we record the investment at cost and adjustthe carrying amount of the investment by our proportionateshare of the investee’s net earnings or losses. All significantintercompany accounts and transactions are eliminated. Theconsolidated financial statements for some of our internationalsubsidiaries are for an annual period that ended onDecember 25, 2012, 2011 and 2010. Certain amounts in the2011 and 2010 consolidated financial statements have beenreclassified to conform to the 2012 presentation.
Use of Estimates – The consolidated financial statementsare prepared in conformity with accounting principlesgenerally accepted in the U.S. which require us to makeestimates and assumptions that affect the reported amounts ofassets and liabilities and disclosure of contingent assets andliabilities at the date of the financial statements and thereported amounts of revenues and expenses during thereporting period. Actual results could differ from thoseestimates.
Foreign Currency Translation – The financial statementsof our foreign subsidiaries are translated into U.S. dollars usingperiod-end exchange rates for assets and liabilities and average
exchange rates for operating results. Unrealized translationgains and losses are included in accumulated othercomprehensive income in stockholders’ equity. When atransaction is denominated in a currency other than thesubsidiary’s functional currency, we recognize a transactiongain or loss when the transaction is settled. Foreign currencytransaction gains and losses included in net earnings for theyears ended December 31, 2012, 2011 and 2010 were notsignificant.
Revenue Recognition – We sell product through threeprincipal channels: 1) direct to healthcare institutions, referredto as direct channel accounts; 2) through stocking distributorsand healthcare dealers; and 3) directly to dental practices anddental laboratories. The direct channel accounts representapproximately 75 percent of our net sales. Through thischannel, inventory is generally consigned to sales agents orcustomers so that products are available when needed forsurgical procedures. No revenue is recognized upon theplacement of inventory into consignment as we retain title andmaintain the inventory on our balance sheet. Uponimplantation, we issue an invoice and revenue is recognized.Pricing for products is generally predetermined by contractswith customers, agents acting on behalf of customer groups orby government regulatory bodies, depending on the market.Price discounts under group purchasing contracts aregenerally linked to volume of implant purchases by customerhealthcare institutions within a specified group. At negotiatedthresholds within a contract buying period, price discountsmay increase.
Sales to stocking distributors, healthcare dealers, dentalpractices and dental laboratories account for approximately25 percent of our net sales. With these types of sales, revenueis recognized when title to product passes, either uponshipment of the product or in some cases upon implantation ofthe product. Product is generally sold at contractually fixedprices for specified periods. Payment terms vary by customer,but are typically less than 90 days.
If sales incentives are earned by a customer forpurchasing a specified amount of our product, we estimatewhether such incentives will be achieved and, if so, recognizethese incentives as a reduction in revenue in the same periodthe underlying revenue transaction is recognized. Occasionallyproducts are returned and, accordingly, we maintain anestimated sales return reserve that is recorded as a reductionin revenue. Product returns were not significant for the yearsended December 31, 2012, 2011 and 2010.
Taxes collected from customers and remitted togovernmental authorities are presented on a net basis andexcluded from revenues.
Shipping and Handling – Amounts billed to customersfor shipping and handling of products are reflected in net salesand are not significant. Expenses incurred related to shippingand handling of products are reflected in selling, general andadministrative and were $139.5 million, $142.1 million and
39

ZIMMER HOLDINGS, INC. 2012 FORM 10-K ANNUAL REPORT
Notes to Consolidated Financial Statements (Continued)
$129.1 million for the years ended December 31, 2012, 2011and 2010, respectively.
Research and Development – We expense all researchand development costs as incurred. Research and developmentcosts include salaries, prototypes, depreciation of equipmentused in research and development, consultant fees and servicefees paid to collaborative partners. Where contingentmilestone payments are due to third parties under researchand development arrangements, the milestone paymentobligations are expensed when the milestone results areachieved.
Litigation – We record a liability for contingent losses,including future legal costs, settlements and judgments, whenwe consider it is probable a liability has been incurred and theamount of the loss can be reasonably estimated.
Special Items – We recognize expenses resulting directlyfrom our business combinations, employee terminationbenefits, certain contract terminations, consulting andprofessional fees and asset impairment charges connected withglobal restructuring and operational excellence initiatives, andother items as “Special items” in our consolidated statement ofearnings. “Special items” included (in millions):
For the Years Ended December 31, 2012 2011 2010
Impairment of assets $ 14.6 $ 8.4 $11.4Consulting and professional fees 90.1 26.0 4.9Employee severance and retention, including
share-based compensation acceleration 8.2 23.1 6.7Dedicated project personnel 15.1 3.2 2.0Information technology integration – 0.5 0.1Relocated facilities 1.8 – 0.2Distributor acquisitions 0.8 2.0 1.9Certain litigation matters 13.7 0.1 (0.3)Contract terminations 6.6 6.3 3.9Contingent consideration adjustments (2.8) – –Accelerated software amortization 4.5 – –Other 2.8 5.6 3.9
Special items $155.4 $75.2 $34.7
Impairment of assets relates to impairment of intangibleassets that were acquired in business combinations orimpairment of other assets related to various reasons.
Consulting and professional fees relate to third-partyconsulting, professional fees and contract labor related to ouroperational excellence initiatives, third-party consulting feesrelated to certain information system implementations, third-party integration consulting performed in a variety of areassuch as tax, compliance, logistics and human resources for ourbusiness combinations, third-party fees related to severanceand termination benefits matters and legal fees related tocertain product liability matters. Our operational excellenceinitiatives are across the company and include improvementsin quality, distribution, sourcing, manufacturing, andinformation technology, among other areas.
In 2012, 2011 and 2010, we terminated some employees aswe reduced management layers, restructured certain areas,announced closures of certain facilities, and commencedinitiatives to focus on business opportunities that best supportour strategic priorities. In 2012, 2011 and 2010, approximately
400, 500 and 60 positions, respectively, from across the globewere affected by these actions. As a result of these changes inour work force and headcount reductions from acquisitions, weincurred expenses related to severance benefits, redundantsalaries as we worked through transition periods, share-basedcompensation acceleration and other employee termination-related costs. The majority of these termination benefits wereprovided in accordance with our existing or local governmentpolicies and are considered ongoing benefits. These costs wereaccrued when they became probable and estimable and wererecorded as part of other current liabilities. The majority ofthese costs were paid during the year they were incurred.
Dedicated project personnel are the salary, benefits, travelexpenses and other costs directly associated with employeeswho are 100 percent dedicated to our operational excellenceinitiatives or integration of acquired businesses.
Information technology integration relates to the non-capitalizable costs associated with integrating the informationsystems of acquired businesses.
Relocated facilities expenses are the moving costs and thelease expenses incurred during the relocation period related torelocating certain office facilities.
Over the past few years we have acquired a number ofU.S. and foreign-based distributors. We have incurred variouscosts related to the consummation and integration of thosebusinesses.
Certain litigation matters relate to costs and adjustmentsrecognized during the year for the estimated or actualsettlement of various legal matters, including royalty disputes,patent litigation matters, commercial litigation matters andmatters arising from our acquisitions of certain competitivedistributorships in prior years.
Contract termination costs relate to terminatedagreements in connection with the integration of acquiredcompanies and changes to our distribution model as part ofbusiness restructuring and operational excellence initiatives.The terminated contracts primarily relate to sales agents anddistribution agreements.
Contingent consideration adjustments are the changes inthe fair value of contingent consideration obligations to be paidto the prior owners of acquired businesses.
Accelerated software amortization is the incrementalamortization caused by changing the estimated life of certainsoftware. In 2012, we approved a plan to replace certainsoftware. As a result, the estimated economic useful life of theexisting software was decreased to represent the period oftime expected to implement replacement software. As a result,the amortization from the shortened life of this software issubstantially higher than the previous amortization beingrecognized.
Cash and Cash Equivalents – We consider all highlyliquid investments with an original maturity of three months orless to be cash equivalents. The carrying amounts reported inthe balance sheet for cash and cash equivalents are valued atcost, which approximates their fair value.
40

ZIMMER HOLDINGS, INC. 2012 FORM 10-K ANNUAL REPORT
Notes to Consolidated Financial Statements (Continued)
Investments – We invest our excess cash and cashequivalents in debt securities. Our investments includecorporate debt securities, U.S. government and agency debtsecurities, municipal bonds, foreign government debtsecurities, commercial paper and certificates of deposit andare classified and accounted for as available-for-sale. Available-for-sale debt securities are recorded at fair value on ourconsolidated balance sheet. Investments with a contractualmaturity of less than one year are classified as short-terminvestments on our consolidated balance sheet, or in othernon-current assets if the contractual maturity is greater thanone year. Changes in fair value for available-for-sale securitiesare recorded, net of taxes, as a component of accumulatedother comprehensive loss on our consolidated balance sheet.We review our investments for other-than-temporaryimpairment at each reporting period. If an unrealized loss forany investment is considered to be other-than-temporary, theloss will be recognized in the consolidated statement ofearnings in the period the determination is made. See Note 7for more information regarding our investments.
Accounts Receivable – Accounts receivable consists oftrade and other miscellaneous receivables. We grant credit tocustomers in the normal course of business and maintain anallowance for doubtful accounts for potential credit losses. Wedetermine the allowance for doubtful accounts by geographicmarket and take into consideration historical creditexperience, creditworthiness of the customer and otherpertinent information. We make concerted efforts to collect allaccounts receivable, but sometimes we have to write-off theaccount against the allowance when we determine the accountis uncollectible. The allowance for doubtful accounts was $22.8million and $17.2 million as of December 31, 2012 and 2011,respectively.
Inventories – Inventories are stated at the lower of cost ormarket, with cost determined on a first-in first-out basis.
Property, Plant and Equipment – Property, plant andequipment is carried at cost less accumulated depreciation.Depreciation is computed using the straight-line method basedon estimated useful lives of ten to forty years for buildings andimprovements and three to eight years for machinery andequipment. Maintenance and repairs are expensed as incurred.We review property, plant and equipment for impairmentwhenever events or changes in circumstances indicate that thecarrying value of an asset may not be recoverable. Animpairment loss would be recognized when estimated futureundiscounted cash flows relating to the asset are less than itscarrying amount. An impairment loss is measured as theamount by which the carrying amount of an asset exceeds itsfair value.
Software Costs – We capitalize certain computer softwareand software development costs incurred in connection withdeveloping or obtaining computer software for internal usewhen both the preliminary project stage is completed and it isprobable that the software will be used as intended.Capitalized software costs generally include external direct
costs of materials and services utilized in developing orobtaining computer software and compensation and relatedbenefits for employees who are directly associated with thesoftware project. Capitalized software costs are included inproperty, plant and equipment on our balance sheet andamortized on a straight-line or weighted average estimateduser basis when the software is ready for its intended use overthe estimated useful lives of the software, which approximatethree to ten years.
Instruments – Instruments are hand-held devices used bysurgeons during total joint replacement and other surgicalprocedures. Instruments are recognized as long-lived assetsand are included in property, plant and equipment.Undeployed instruments are carried at cost or realizable value.Instruments in the field are carried at cost less accumulateddepreciation. Depreciation is computed using the straight-linemethod based on average estimated useful lives, determinedprincipally in reference to associated product life cycles,primarily five years. We review instruments for impairmentwhenever events or changes in circumstances indicate that thecarrying value of an instrument may not be recoverable.Depreciation of instruments is recognized as selling, generaland administrative expense.
Goodwill – Goodwill is not amortized but is subject toannual impairment tests. Goodwill has been assigned toreporting units. We perform annual impairment tests by eithercomparing a reporting unit’s estimated fair value to its carryingamount or doing a qualitative assessment of a reporting unit’sfair value from the last quantitative assessment to determine ifthere is potential impairment. We may do a qualitativeassessment when the results of the previous quantitative testindicated the reporting unit’s estimated fair value wassignificantly in excess of the carrying value of its net assetsand we do not believe there have been significant changes inthe reporting unit’s operations that would significantlydecrease its estimated fair value or significantly increase itsnet assets. If a quantitative assessment is performed, the fairvalue of the reporting unit and the implied fair value ofgoodwill are determined based upon a discounted cash flowanalysis and/or use of a market approach by looking at marketvalues of comparable companies. Significant assumptions areincorporated into our discounted cash flow analyses such asestimated growth rates and risk-adjusted discount rates. Weperform this test in the fourth quarter of the year or wheneverevents or changes in circumstances indicate that the carryingvalue of the reporting unit’s assets may not be recoverable. Ifthe fair value of the reporting unit is less than its carryingvalue, an impairment loss is recorded to the extent that theimplied fair value of the reporting unit goodwill is less than thecarrying value of the reporting unit goodwill. During the yearsended December 31, 2012 and 2010, we recorded goodwillimpairment charges of $96.0 million and $204.0 million,respectively, related to our U.S. Spine reporting unit. See Note9 for more information regarding goodwill and goodwillimpairment.
41

ZIMMER HOLDINGS, INC. 2012 FORM 10-K ANNUAL REPORT
Notes to Consolidated Financial Statements (Continued)
Intangible Assets – Intangible assets are initiallymeasured at their fair value. We have determined the fair valueof our intangible assets either by the fair value of theconsideration exchanged for the intangible asset or theestimated after-tax discounted cash flows expected to begenerated from the intangible asset. Intangible assets with anindefinite life, including certain trademarks and trade names,are not amortized. Indefinite life intangible assets are assessedannually to determine whether events and circumstancescontinue to support an indefinite life. Intangible assets with afinite life, including core and developed technology, certaintrademarks and trade names, customer-related intangibles,intellectual property rights and patents and licenses areamortized on a straight-line basis over their estimated usefullife, ranging from less than one year to 40 years. Intangibleassets with a finite life are tested for impairment wheneverevents or circumstances indicate that the carrying amount maynot be recoverable.
Intangible assets with an indefinite life are tested forimpairment annually or whenever events or circumstancesindicate that the carrying amount may not be recoverable. Animpairment loss is recognized if the carrying amount exceedsthe estimated fair value of the asset. The amount of theimpairment loss to be recorded would be determined basedupon the excess of the asset’s carrying value over its fair value.The fair values of indefinite lived intangible assets aredetermined based upon a discounted cash flow analysis usingthe relief from royalty method or a qualitative assessment maybe performed for any changes to the asset’s fair value from thelast quantitative assessment. The relief from royalty methodestimates the cost savings associated with owning, rather thanlicensing, assets. Significant assumptions are incorporated intothese discounted cash flow analyses such as estimated growthrates, royalty rates and risk-adjusted discount rates. We maydo a qualitative assessment when the results of the previousquantitative test indicated the asset’s fair value wassignificantly in excess of its carrying value.
In determining the useful lives of intangible assets, weconsider the expected use of the assets and the effects ofobsolescence, demand, competition, anticipated technologicaladvances, changes in surgical techniques, market influencesand other economic factors. For technology-based intangibleassets, we consider the expected life cycles of products, absentunforeseen technological advances, which incorporate thecorresponding technology. Trademarks and trade names thatdo not have a wasting characteristic (i.e., there are no legal,regulatory, contractual, competitive, economic or other factorswhich limit the useful life) are assigned an indefinite life.Trademarks and trade names that are related to productsexpected to be phased out are assigned lives consistent withthe period in which the products bearing each brand areexpected to be sold. For customer relationship intangibleassets, we assign useful lives based upon historical levels ofcustomer attrition. Intellectual property rights are assigneduseful lives that approximate the contractual life of any related
patent or the period for which we maintain exclusivity over theintellectual property.
Income Taxes – We account for income taxes under theasset and liability method, which requires the recognition ofdeferred tax assets and liabilities for the expected future taxconsequences of events that have been included in thefinancial statements. Under this method, deferred tax assetsand liabilities are determined based on the differencesbetween the financial statements and tax basis of assets andliabilities using enacted tax rates in effect for the year in whichthe differences are expected to reverse. The effect of a changein tax rates on deferred tax assets and liabilities is recognizedin income in the period that includes the enactment date.
We reduce our deferred tax assets by a valuationallowance if it is more likely than not that we will not realizesome portion or all of the deferred tax assets. In making suchdetermination, we consider all available positive and negativeevidence, including future reversals of existing taxabletemporary differences, projected future taxable income, taxplanning strategies and recent financial operations. In theevent we were to determine that we would be able to realizeour deferred income tax assets in the future in excess of theirnet recorded amount, we would make an adjustment to thevaluation allowance which would reduce the provision forincome taxes. Federal income taxes are provided on theportion of the income of foreign subsidiaries that is expectedto be remitted to the U.S.
We operate on a global basis and are subject to numerousand complex tax laws and regulations. Our income tax filingsare regularly under audit in multiple federal, state and foreignjurisdictions. Income tax audits may require an extendedperiod of time to reach resolution and may result in significantincome tax adjustments when interpretation of tax laws orallocation of company profits is disputed. Because income taxadjustments in certain jurisdictions can be significant, werecord accruals representing management’s best estimate ofthe probable resolution of these matters. To the extentadditional information becomes available, such accruals areadjusted to reflect the revised estimated probable outcome.
Derivative Financial Instruments – We measure allderivative instruments at fair value and report them on ourconsolidated balance sheet as assets or liabilities. We maintainwritten policies and procedures that permit, under appropriatecircumstances and subject to proper authorization, the use ofderivative financial instruments solely for hedging purposes.The use of derivative financial instruments for trading orspeculative purposes is prohibited by our policy. See Note 13for more information regarding our derivative and hedgingactivities.
Other Comprehensive Income – Other comprehensiveincome refers to revenues, expenses, gains and losses thatunder generally accepted accounting principles are included incomprehensive income but are excluded from net earnings asthese amounts are recorded directly as an adjustment tostockholders’ equity. Other comprehensive income is
42

ZIMMER HOLDINGS, INC. 2012 FORM 10-K ANNUAL REPORT
Notes to Consolidated Financial Statements (Continued)
comprised of foreign currency translation adjustments,unrealized gains and losses on cash flow hedges, unrealizedgains and losses on available-for-sale securities andamortization of prior service costs and unrecognized gains andlosses in actuarial assumptions.
Treasury Stock – We account for repurchases of commonstock under the cost method and present treasury stock as areduction of stockholders’ equity. We reissue common stockheld in treasury only for limited purposes.
Noncontrolling Interest – In 2011, we made aninvestment in a company in which we acquired a controllingfinancial interest, but not 100 percent of the equity. Furtherinformation related to the noncontrolling interests of thatinvestment has not been provided as it is not significant to ourconsolidated financial statements.
Accounting Pronouncements – In 2011, the FinancialAccounting Standards Board (FASB) issued an accountingstandard update (ASU) requiring companies to present netincome and other comprehensive income in either a singlecontinuous statement or in two separate, but consecutive,statements of net income and of comprehensive income. Thisrequirement became effective for us January 1, 2012. The ASUchanges the presentation, but not the accountingrequirements, of other comprehensive income and thereforehad no effect on our financial position, results of operations orcash flows.
In 2012, the FASB issued an ASU that allowed companieswhen performing their annual indefinite lived intangible assetimpairment test to do a qualitative assessment to evaluatewhether impairment has occurred versus performing aquantitative calculation of estimated fair value. We elected toearly adopt this standard and performed a qualitativeassessment on one of our intangible assets that in the prioryear had an estimated fair value that was substantially inexcess of its carrying value. This ASU just changed themethodology of testing for impairment and would not affectthe outcome of impairment testing. Therefore, it did not havean effect on our financial position, results of operations or cashflows.
There are no other recently issued accountingpronouncements that we have not yet adopted that areexpected to have a material effect on our financial position,results of operations or cash flows.
3. SHARE-BASED COMPENSATION
Our share-based payments primarily consist of stockoptions, restricted stock, restricted stock units (RSUs), and anemployee stock purchase plan. Share-based compensationexpense is as follows (in millions):
For the Years Ended December 31, 2012 2011 2010
Stock options $ 32.4 $ 41.7 $ 47.6
RSUs and other 22.6 18.8 14.4
Total expense, pre-tax 55.0 60.5 62.0
Tax benefit related to awards (16.6) (17.8) (16.2)
Total expense, net of tax $ 38.4 $ 42.7 $ 45.8
Share-based compensation cost capitalized as part ofinventory for the years ended December 31, 2012, 2011 and2010 was $6.1 million, $8.8 million, and $12.2 million,respectively. As of December 31, 2012 and 2011,approximately $3.3 million and $4.8 million of capitalized costsremained in finished goods inventory.
Stock Options
We had two equity compensation plans in effect atDecember 31, 2012: the 2009 Stock Incentive Plan (2009 Plan)and the Stock Plan for Non-Employee Directors. The 2009 Plansucceeds the 2006 Stock Incentive Plan (2006 Plan) and theTeamShare Stock Option Plan (TeamShare Plan). No furtherawards have been granted under the 2006 Plan or under theTeamShare Plan since May 2009, and shares remainingavailable for grant under those plans have been merged intothe 2009 Plan. Vested and unvested stock options andunvested restricted stock and RSUs previously granted underthe 2006 Plan, the TeamShare Plan and another prior plan, the2001 Stock Incentive Plan, remained outstanding as ofDecember 31, 2012. We have reserved the maximum numberof shares of common stock available for award under the termsof each of these plans. We have registered 57.9 million sharesof common stock under these plans. The 2009 Plan providesfor the grant of nonqualified stock options and incentive stockoptions, long-term performance awards in the form ofperformance shares or units, restricted stock, RSUs and stockappreciation rights. The Compensation and ManagementDevelopment Committee of the Board of Directors determines
43

ZIMMER HOLDINGS, INC. 2012 FORM 10-K ANNUAL REPORT
Notes to Consolidated Financial Statements (Continued)
the grant date for annual grants under our equitycompensation plans. The date for annual grants under the2009 Plan to our executive officers is expected to occur in thefirst quarter of each year following the earningsannouncements for the previous quarter and full year. TheStock Plan for Non-Employee Directors provides for awards ofstock options, restricted stock and RSUs to non-employeedirectors. It has been our practice to issue shares of commonstock upon exercise of stock options from previously unissuedshares, except in limited circumstances where they are issuedfrom treasury stock. The total number of awards which may begranted in a given year and/or over the life of the plan undereach of our equity compensation plans is limited. AtDecember 31, 2012, an aggregate of 8.7 million shares wereavailable for future grants and awards under these plans.
Stock options granted to date under our plans generallyvest over four years and generally have a maximumcontractual life of 10 years. As established under our equitycompensation plans, vesting may accelerate upon retirementafter the first anniversary date of the award if certain criteriaare met. We recognize expense related to stock options on astraight-line basis over the requisite service period, lessawards expected to be forfeited using estimated forfeiturerates. Due to the accelerated retirement provisions, therequisite service period of our stock options range from one tofour years. Stock options are granted with an exercise priceequal to the market price of our common stock on the date ofgrant, except in limited circumstances where local law maydictate otherwise.
A summary of stock option activity for the year ended December 31, 2012 is as follows (options in thousands):
Weighted
Average
Exercise
Weighted
Average
Remaining
Contractual
Intrinsic
Value
Stock Options Price Life (in millions)
Outstanding at January 1, 2012 16,748 $68.04
Options granted 1,720 64.26
Options exercised (933) 46.05
Options cancelled (239) 60.21
Options expired (658) 75.43
Outstanding at December 31, 2012 16,638 $68.74 4.8 $64.2
Vested or expected to vest as of December 31, 2012 16,169 $68.94 4.7 $61.9
Exercisable at December 31, 2012 12,977 $71.34 3.9 $38.0
We use a Black-Scholes option-pricing model todetermine the fair value of our stock options. Expectedvolatility was derived from the implied volatility of tradedoptions on our stock that were actively traded around thegrant date of the stock options with exercise prices similar tothe stock options and maturities of over one year. Theexpected term of the stock options has been derived fromhistorical employee exercise behavior. The risk-free interestrate was determined using the implied yield currently availablefor zero-coupon U.S. government issues with a remaining termapproximating the expected life of the options. We beganpaying dividends in 2012. Accordingly, prior to 2012 weassumed no dividend yield. Starting in 2012, the dividend yieldwas determined by using an estimated annual dividend anddividing it by the market price of our stock on the grant date.
The following table presents information regarding theweighted average fair value for stock options granted, theassumptions used to determine fair value, and the intrinsicvalue of options exercised in the indicated year:
For the Years Ended December 31, 2012 2011 2010
Dividend yield 1.1 % —% —%
Volatility 25.6% 26.1% 26.3%
Risk-free interest rate 1.5 % 2.2 % 2.8 %
Expected life (years) 6.1 6.1 5.9
Weighted average fair value of optionsgranted $15.40 $18.33 $18.17
Intrinsic value of options exercised (inmillions) $ 17.1 $ 27.5 $ 8.5
As of December 31, 2012, there was $38.4 million ofunrecognized share-based payment expense related tononvested stock options granted under our plans. Thatexpense is expected to be recognized over a weighted averageperiod of 2.5 years.
44
ZIMMER HOLDINGS, INC. 2012 FORM 10-K ANNUAL REPORT
Notes to Consolidated Financial Statements (Continued)
RSUs
We have awarded RSUs to our employees. The terms ofthe awards have been three to five years. Some of the awardshave only service conditions while some have performance andmarket conditions as well. The service condition awards vestratably on the anniversary date of the award. The awards thathave performance and market conditions vest all at once onthe third anniversary date. Future service conditions may bewaived if an employee retires after the first anniversary date ofthe award, but performance and market conditions continue toapply. Accordingly, the requisite service period used for share-based payment expense ranges from one to five years.
A summary of nonvested RSU activity for the year endedDecember 31, 2012 is as follows (in thousands):
Weighted Average
Grant Date
RSUs Fair Value
Outstanding at January 1, 2012 1,187 $56.25
Granted 685 65.91
Vested (299) 52.92
Forfeited (363) 64.58
Outstanding at December 31, 2012 1,210 60.03
For the RSUs with service conditions only, the fair value ofthe awards was determined based upon the fair market valueof our common stock on the date of grant. For the RSUs withmarket conditions, a Monte Carlo valuation technique was usedto simulate the market conditions of the awards. The outcomeof the simulation was used to determine the fair value of theawards.
We are required to estimate the number of RSUs that willvest and recognize share-based payment expense on a straight-line basis over the requisite service period. As of December 31,2012, we estimate that approximately 1,113,000 outstandingRSUs will vest. If our estimate were to change in the future,the cumulative effect of the change in estimate will berecorded in that period. Based upon the number of RSUs thatwe expect to vest, the unrecognized share-based paymentexpense as of December 31, 2012 was $38.9 million and isexpected to be recognized over a weighted-average period of2.3 years. The fair value of RSUs vesting during the yearsended December 31, 2012, 2011 and 2010 based upon ourstock price on the date of vesting was $18.9 million, $11.8million and $3.2 million, respectively.
4. INVENTORIES
Inventories consisted of the following (in millions):
As of December 31, 2012 2011
Finished goods $786.3 $743.0
Work in progress 52.3 47.8
Raw materials 156.7 139.0
Inventories $995.3 $929.8
Amounts charged to the consolidated statement ofearnings for excess and obsolete inventory in the years endedDecember 31, 2012, 2011 and 2010 were $55.1 million, $47.6million and $45.8 million, respectively.
5. PROPERTY, PLANT AND EQUIPMENT
Property, plant and equipment consisted of the following(in millions):
As of December 31, 2012 2011
Land $ 22.1 $ 22.3
Building and equipment 1,232.8 1,196.8
Capitalized software costs 241.8 208.4
Instruments 1,579.8 1,509.2
Construction in progress 117.8 76.4
3,194.3 3,013.1
Accumulated depreciation (1,983.6) (1,805.8)
Property, plant and equipment, net $ 1,210.7 $ 1,207.3
Depreciation expense was $266.0 million, $266.1 millionand $247.9 million for the years ended December 31, 2012,2011 and 2010, respectively.
6. ACQUISITIONS
We made a number of business acquisitions during theyears 2012, 2011 and 2010. In January 2012, we acquiredSynvasive Technology, Inc. (Synvasive). The Synvasiveacquisition enhanced our product portfolio through theaddition of the STABLECUT® surgical saw blades, as well asthe eLIBRA® Dynamic Knee Balancing SystemTM for soft tissuebalancing. In October 2012, we acquired Dornoch MedicalSystems, Inc. (Dornoch). The Dornoch acquisition enhancesour product portfolio through the addition of a medical wastefluid management and disposal technology. In November 2011,we acquired ExtraOrtho, Inc. (ExtraOrtho). The ExtraOrthoacquisition enhances our position in the estimated $820 millionexternal fixation market. In December 2010, we acquiredBeijing Montagne Medical Device Co., Ltd. (Montagne) andSodem Diffusion S.A. (Sodem). The Montagne acquisitionmakes us a significant provider of orthopaedic solutions inChina and provides product lines tailored exclusively to therapidly growing Chinese market. The Sodem acquisitionbroadens our portfolio of surgical power tools and strengthensour position in the estimated $1 billion surgical power toolmarket. Additionally, we have acquired a number of foreign-based distributors during the three year period.
The results of operations of the acquired companies havebeen included in our consolidated results of operationssubsequent to the transaction dates, and the respective assetsand liabilities of the acquired companies have been recorded attheir estimated fair values in our consolidated statement offinancial position as of the transaction dates, with any excesspurchase price being recorded as goodwill. Pro forma financial
45

ZIMMER HOLDINGS, INC. 2012 FORM 10-K ANNUAL REPORT
Notes to Consolidated Financial Statements (Continued)
information and other information required have not beenincluded as the acquisitions, individually and in the aggregate,did not have a material impact upon our financial position orresults of operations.
7. INVESTMENTS
We invest in short and long-term investments classified asavailable-for-sale securities. Information regarding ourinvestments is as follows (in millions):
Amortized
Cost
Gross UnrealizedFair
valueGains Losses
As of December 31, 2012Corporate debt securities $383.6 $0.3 $(0.1) $383.8U.S. government and agency debt
securities 295.8 0.1 – 295.9Foreign government debt
securities 5.0 – – 5.0Commercial paper 138.7 – – 138.7Certificates of deposit 92.2 0.1 – 92.3
Total short and long-terminvestments $915.3 $0.5 $(0.1) $915.7
As of December 31, 2011Corporate debt securities $324.8 $0.2 $(0.3) $324.7U.S. government and agency debt
securities 177.1 0.1 – 177.2Municipal bonds 1.0 – – 1.0Foreign government debt
securities 6.8 – – 6.8Commercial paper 74.5 – – 74.5Certificates of deposit 88.5 – – 88.5
Total short and long-terminvestments $672.7 $0.3 $(0.3) $672.7
The following table shows the fair value and grossunrealized losses for all available-for-sale securities in anunrealized loss position deemed to be temporary (in millions):
As of December 31, 2012 As of December 31, 2011
Fair
Value
Unrealized
Losses
Fair
value
Unrealized
Losses
Corporate debt securities $144.2 $(0.1) $164.5 $(0.3)
All securities in the table above have been in an unrealizedloss position for less than twelve months. A total of 79securities were in an unrealized loss position as ofDecember 31, 2012.
The unrealized losses on our investments in corporatedebt securities were caused by increases in interest yieldsresulting from changes in the global credit markets. We believethe unrealized losses associated with our available-for-salesecurities as of December 31, 2012 are temporary because wedo not intend to sell these investments before maturity, and wedo not believe we will be required to sell them before recoveryof their amortized cost basis.
The amortized cost and fair value of our available-for-salefixed-maturity securities by contractual maturity are as follows(in millions):
As of December 31, 2012 Amortized Cost
Fair
Value
Due in one year or less $671.3 $671.6Due after one year through two years 244.0 244.1
Total $915.3 $915.7
8. FAIR VALUE MEASUREMENTS OF ASSETS AND LIABILITIES
The following financial assets and liabilities are recordedat fair value on a recurring basis (in millions):
As of December 31, 2012
Fair Value Measurements at Reporting Date Using:
Description
Recorded
Balance
Quoted Prices
in Active
Markets for
Identical
Assets
(Level 1)
Significant Other
Observable
Inputs
(Level 2)
Significant
Unobservable
Inputs
(Level 3)
Assets
Available-for-salesecurities
Corporate debtsecurities $383.8 $– $383.8 $–
U.S. government andagency debtsecurities 295.9 – 295.9 –
Foreign governmentdebt securities 5.0 – 5.0 –
Commercial paper 138.7 – 138.7 –
Certificates ofdeposit 92.3 – 92.3 –
Totalavailable-for-salesecurities 915.7 – 915.7 –
Derivatives, currentand long-term
Foreign currencyforward contractsand options 28.4 – 28.4 –
Interest rate swaps 33.9 – 33.9 –
$978.0 $– $978.0 $–
Liabilities
Derivatives, currentand long-term
Foreign currencyforward contracts $ 10.8 $– $ 10.8 $–
46

ZIMMER HOLDINGS, INC. 2012 FORM 10-K ANNUAL REPORT
Notes to Consolidated Financial Statements (Continued)
As of December 31, 2011
Fair Value Measurements at Reporting Date Using:
Description
Recorded
Balance
Quoted Prices
in Active
Markets for
Identical
Assets
(Level 1)
Significant Other
Observable
Inputs
(Level 2)
Significant
Unobservable
Inputs
(Level 3)
Assets
Available-for-salesecurities
Corporate debtsecurities $324.7 $– $324.7 $–
U.S. government andagency debtsecurities 177.2 – 177.2 –
Municipal bonds 1.0 – 1.0 –
Foreign governmentdebt securities 6.8 – 6.8 –
Commercial paper 74.5 – 74.5 –
Certificates ofdeposit 88.5 – 88.5 –
Total available-for-sale securities 672.7 – 672.7 –
Derivatives, currentand long-term
Foreign currencyforward contractsand options 18.3 – 18.3 –
Interest rate swaps 27.8 – 27.8 –
$718.8 $ – $718.8 $ –
Liabilities
Derivatives, currentand long-term
Foreign currencyforward contracts $ 25.2 $ – $ 25.2 $ –
Cross-currencyinterest rate swaps 8.2 – 8.2 –
$ 33.4 $ – $ 33.4 $ –
We value our available-for-sale securities using a marketapproach based on broker prices for identical assets in over-the-counter markets and we perform ongoing assessments ofcounterparty credit risk.
We value our foreign currency forward contracts andforeign currency options using a market approach based onforeign currency exchange rates obtained from active marketsand we perform ongoing assessments of counterparty creditrisk.
We value our interest rate swaps using a market approachbased on publicly available market yield curves and the termsof our swaps and we perform ongoing assessments ofcounterparty credit risk.
We valued our cross-currency interest rate swaps using amarket approach based upon publicly available market yield
curves, foreign currency exchange rates obtained from activemarkets and the terms of our swaps. We also performedongoing assessments of counterparty credit risk.
The following nonfinancial assets were measured at fairvalue on a nonrecurring basis (in millions):
Fair Value Measurements Using:
Description Total
Quoted Prices
in Active
Markets for
Identical
Assets
(Level 1)
Significant
Other
Observable
Inputs
(Level 2)
Significant
Unobservable
Inputs
(Level 3)
Total
Losses
Year Ended December 31, 2012
Goodwill $ 41.0 $ 41.0 $ 96.0
Indefinite-livedintangibleassets 24.2 – – 24.2 11.6
Year Ended December 31, 2010
Goodwill 137.0 – – 137.0 204.0
We conduct our annual goodwill impairment test in thefourth quarter of every year or whenever events occur orcircumstances change that would more likely than not reducethe fair value of a reporting unit below its carrying amount. Ineach of 2012 and 2010, it was determined that our U.S. Spinereporting unit’s carrying value was in excess of its fair value. In2012, the goodwill for this reporting unit was written down toits implied fair value of $41.0 million from its previous carryingvalue of $137.0 million, resulting in a $96.0 million non-cashimpairment charge. In 2010, the goodwill was written down toits implied fair value of $137.0 million from its previouscarrying value of $341.0 million, resulting in a $204.0 millionnon-cash impairment charge. The implied fair value of goodwillequals the estimated fair value of a reporting unit minus thefair value of the reporting unit’s net assets. In determining theimplied fair value of the U.S. Spine reporting unit’s goodwill,we used unobservable inputs to estimate the fair value of thereporting unit and its assets and liabilities. Fair value wasdetermined using an equal weighting of income and marketapproaches.
Fair value under the income approach was determined bydiscounting to present value the estimated future cash flows ofthe reporting unit. Fair value under the market approachutilized the guideline public company methodology, which usesvaluation indicators from publicly traded companies that aresimilar to our U.S. Spine reporting unit and considers controlpremiums that would result from a sale of the reporting unitand the level of assets in the reporting unit versus thecomparable companies.
47

ZIMMER HOLDINGS, INC. 2012 FORM 10-K ANNUAL REPORT
Notes to Consolidated Financial Statements (Continued)
In estimating the future cash flows of the reporting unit,we utilized a combination of market and company specificinputs that a market participant would use in assessing the fairvalue of the reporting unit. The primary market input wasrevenue growth rates. These rates were based upon historicaltrends and estimated future growth drivers such as an agingglobal population, obesity and more active lifestyles.Significant company specific inputs included assumptionsregarding how the reporting unit could leverage operatingexpenses as revenue grows and the impact any new productswill have on revenues.
Under the guideline public company methodology, wetook into consideration specific risk differences between ourreporting unit and the comparable companies, such as recentfinancial performance, size risks and product portfolios, amongother considerations. Based upon our reporting unit’s recentfinancial performance, market share and product portfolio, wevalued ourselves near the bottom of the valuation indicators ofthe comparable companies.
The fair value of the reporting unit’s assets and liabilitieswas determined by using the same methods that are used inbusiness combination purchase accounting.
Factors that contributed to impairment of the U.S. Spinereporting unit include broader market issues as well ascompany specific issues. The U.S. spine market has been underpressure due to a constrained economic environment leadingto continuing high unemployment and payer pushback on thenecessity of certain procedures. Additionally, pricing hascontinued to decline across the industry. Company specificissues have included turnover with our independent salesagents and lack of execution in developing new, competitiveproducts which has resulted in a less than optimal productportfolio in our U.S. Spine reporting unit.
The U.S. spine market five years ago was growing in thelow double digits, but now we estimate is flat or in the lowsingle digits. Previous goodwill impairment tests forecastedsome recovery in the market which has not come to fruition.Through the first three quarters of 2012, while U.S. Spine saleswere lower than we expected, cash flows were not significantlylower as expenses were favorable and net working capital wasbetter than planned. As we completed our annual operatingplan in the fourth quarter of 2012, it became clearer that theU.S. spine market recovery may take longer than we planned,including the persistence of significant negative pricingpressures. Additionally, we concluded that new productintroductions made in 2012 will not have as significant of apositive effect as we had previously forecasted. As a result, wehave tempered our expectations of recovery in the U.S. marketand for our U.S. Spine reporting unit and have recognized animpairment charge.
In 2010, the implied fair value of goodwill was determinedusing similar methodologies utilized in the 2012 valuation. Animpairment charge was caused by similar market andcompany-specific factors discussed above.
We have six other reporting units with goodwill assignedto them. We estimate the fair value of those reporting unitsusing the income approach by discounting to present value theestimated future cash flows of the reporting unit. For each ofthose six reporting units, the estimated fair value substantiallyexceeded its carrying value.
We will continue to monitor the fair value of our U.S.Spine reporting unit as well as our other six reporting units inour interim and annual reporting periods. If our estimated cashflows for these reporting units decrease, we may have torecord further impairment charges in the future. Factors thatcould result in our cash flows being lower than our currentestimates include: 1) decreased revenues caused byunforeseen changes in the healthcare market, or our inabilityto generate new product revenue from our research anddevelopment activities, and 2) our inability to achieve theestimated operating margins in our forecasts due tounforeseen factors. Additionally, changes in the broadereconomic environment could cause changes to our estimateddiscount rates or comparable company valuation indicators,which may impact our estimated fair values.
In 2012, we also recorded $11.6 million of impairmentcharges in “Special items” related to certain indefinite livedintangible assets. The impairment was a result of lower futureestimated revenues from products using certain trademarks.The lower future estimated revenue resulted from ourchallenges in the global spine market and from negativepublicity in the marketplace related to certain hip devices thathave adversely affected sales of these products. Furtherinformation regarding how the fair value of these indefinitelived trademarks was determined has not been provided as wedo not believe this non-cash charge was significant to ourresults for 2012.
48
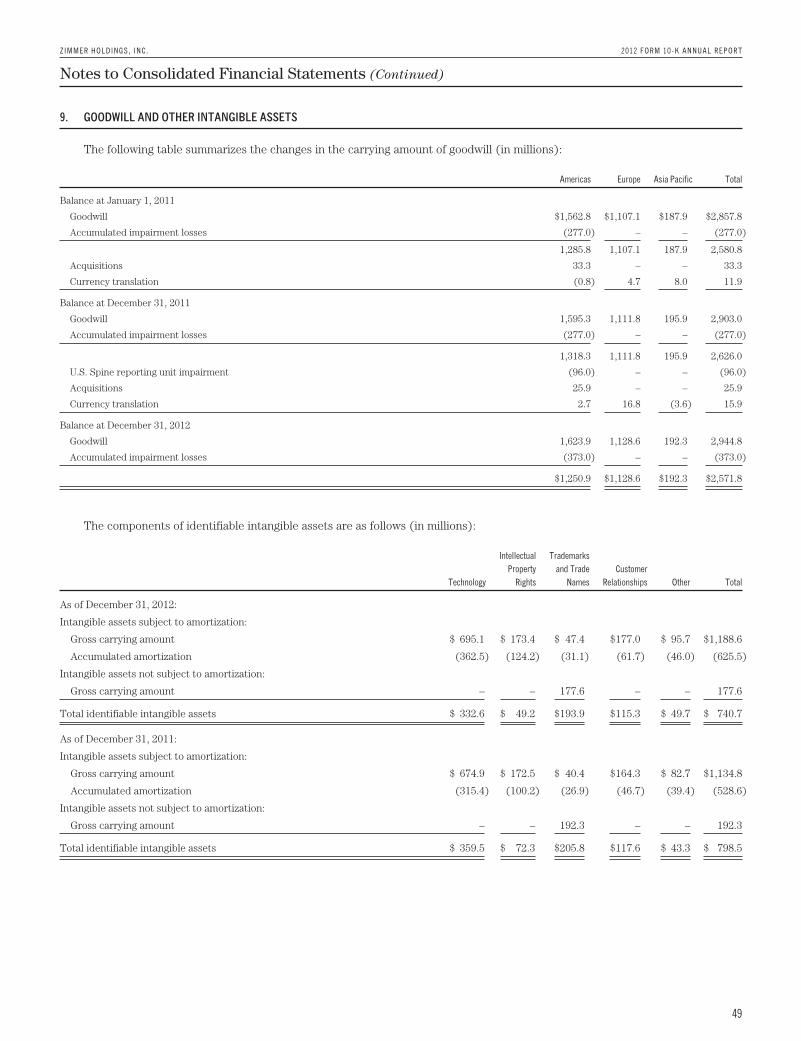
ZIMMER HOLDINGS, INC. 2012 FORM 10-K ANNUAL REPORT
Notes to Consolidated Financial Statements (Continued)
9. GOODWILL AND OTHER INTANGIBLE ASSETS
The following table summarizes the changes in the carrying amount of goodwill (in millions):
Americas Europe Asia Pacific Total
Balance at January 1, 2011
Goodwill $1,562.8 $1,107.1 $187.9 $2,857.8
Accumulated impairment losses (277.0) – – (277.0)
1,285.8 1,107.1 187.9 2,580.8
Acquisitions 33.3 – – 33.3
Currency translation (0.8) 4.7 8.0 11.9
Balance at December 31, 2011
Goodwill 1,595.3 1,111.8 195.9 2,903.0
Accumulated impairment losses (277.0) – – (277.0)
1,318.3 1,111.8 195.9 2,626.0
U.S. Spine reporting unit impairment (96.0) – – (96.0)
Acquisitions 25.9 – – 25.9
Currency translation 2.7 16.8 (3.6) 15.9
Balance at December 31, 2012
Goodwill 1,623.9 1,128.6 192.3 2,944.8
Accumulated impairment losses (373.0) – – (373.0)
$1,250.9 $1,128.6 $192.3 $2,571.8
The components of identifiable intangible assets are as follows (in millions):
Technology
Intellectual
Property
Rights
Trademarks
and Trade
Names
Customer
Relationships Other Total
As of December 31, 2012:
Intangible assets subject to amortization:
Gross carrying amount $ 695.1 $ 173.4 $ 47.4 $177.0 $ 95.7 $1,188.6
Accumulated amortization (362.5) (124.2) (31.1) (61.7) (46.0) (625.5)
Intangible assets not subject to amortization:
Gross carrying amount – – 177.6 – – 177.6
Total identifiable intangible assets $ 332.6 $ 49.2 $193.9 $115.3 $ 49.7 $ 740.7
As of December 31, 2011:
Intangible assets subject to amortization:
Gross carrying amount $ 674.9 $ 172.5 $ 40.4 $164.3 $ 82.7 $1,134.8
Accumulated amortization (315.4) (100.2) (26.9) (46.7) (39.4) (528.6)
Intangible assets not subject to amortization:
Gross carrying amount – – 192.3 – – 192.3
Total identifiable intangible assets $ 359.5 $ 72.3 $205.8 $117.6 $ 43.3 $ 798.5
49

ZIMMER HOLDINGS, INC. 2012 FORM 10-K ANNUAL REPORT
Notes to Consolidated Financial Statements (Continued)
Intangible amortization expense was recorded as follows(in millions):
For the Years Ended December 31, 2012 2011 2010
Cost of products sold $24.0 $26.7 $33.1
Sellling, general and administrative 73.1 67.1 59.2
Total intangible amortization $97.1 $93.8 $92.3
Estimated annual amortization expense based uponintangible assets recognized as of December 31, 2012 for theyears ending December 31, 2013 through 2017 is (in millions):
For the Years Ending December 31,
2013 $94.1
2014 91.3
2015 77.3
2016 67.8
2017 61.8
10. OTHER CURRENT AND LONG-TERM LIABILITIES
Other current and long-term liabilities consisted of thefollowing (in millions):
As of December 31, 2012 2011
Other current liabilities:
License and service agreements $ 92.3 $106.1
Certain claims accrual (Note 19) 50.0 50.0
Salaries, wages and benefits 118.8 116.5
Accrued liabilities 297.9 299.3
Total other current liabilities $559.0 $571.9
Other long-term liabilities:
Long-term income tax payable $213.0 $125.8
Certain claims accrual (Note 19) 210.8 261.1
Other long-term liabilities 135.5 170.5
Total other long-term liabilities $559.3 $557.4
11. DEBT
Our debt consisted of the following (in millions):
As of December 31, 2012 2011
Short-term debt
Senior Credit Facility $ 100.0 $ 143.0
Other short-term debt 0.1 0.3
Total short-term debt $ 100.1 $ 143.3
Long-term debt
Senior Notes due 2014 $ 250.0 $ 250.0
Senior Notes due 2019 500.0 500.0
Senior Notes due 2021 300.0 300.0
Senior Notes due 2039 500.0 500.0
Term Loan 138.6 –
Debt discount (1.7) (1.8)
Adjustment related to interest rate swaps 33.9 27.8
Total long-term debt $1,720.8 $1,576.0
In May 2012, we entered into a new five-year $1,350million revolving, multi-currency, senior unsecured creditfacility maturing May 9, 2017 (Senior Credit Facility). As ofDecember 31, 2012, we had $100.0 million outstanding underthe Senior Credit Facility and an availability of $1,250.0million. The Senior Credit Facility replaced a previous creditfacility with similar terms that was due to mature onNovember 30, 2012.
Borrowings of 11.7 billion Japanese Yen outstanding underthe previous credit facility were converted to the Senior CreditFacility. On May 24, 2012, we refinanced these borrowings byentering into a separate term loan agreement with one of thelenders under the Senior Credit Facility (Term Loan) for 11.7billion Japanese Yen and we repaid the outstanding borrowingsunder the Senior Credit Facility.
The Term Loan will mature on May 31, 2016. Borrowingsunder the Term Loan bear interest at a fixed rate of 0.61percent per annum until maturity. The estimated fair value ofthe Term Loan as of December 31, 2012, based upon publiclyavailable market yield curves and the terms of the debt (Level2), was $138.1 million.
We and certain of our wholly owned foreign subsidiariesare the borrowers under the Senior Credit Facility. Borrowingsunder the Senior Credit Facility bear interest at a LIBOR-basedrate plus an applicable margin determined by reference to oursenior unsecured long-term credit rating and the amountsdrawn under the Senior Credit Facility, at an alternate baserate, or at a fixed-rate determined through a competitive bidprocess. The Senior Credit Facility contains customaryaffirmative and negative covenants and events of default for anunsecured financing arrangement, including, among otherthings, limitations on consolidations, mergers and sales ortransfers of assets. Financial covenants include a maximum
50

ZIMMER HOLDINGS, INC. 2012 FORM 10-K ANNUAL REPORT
Notes to Consolidated Financial Statements (Continued)
leverage ratio of 3.0 to 1.0. If we fall below an investment gradecredit rating, additional restrictions would result, includingrestrictions on investments, payment of dividends and stockrepurchases. We were in compliance with all covenants underthe Senior Credit Facility as of December 31, 2012.Commitments under the Senior Credit Facility are subject tocertain fees, including a facility and a utilization fee.Borrowings under the Senior Credit Facility at December 31,2012 are U.S. Dollar-based.
We have four tranches of senior notes outstanding: $250million aggregate principal amount of 1.4 percent notes dueNovember 30, 2014, $500 million aggregate principal amount of4.625 percent notes due November 30, 2019, $300 millionaggregate principal amount of 3.375 percent notes dueNovember 30, 2021 and $500 million aggregate principalamount of 5.75 percent notes due November 30, 2039. Intereston each series is payable on May 30 and November 30 of eachyear until maturity. The estimated fair value of our SeniorNotes as of December 31, 2012, based on quoted prices for thespecific securities from transactions in over-the-countermarkets (Level 2), was $1,745.8 million.
We may redeem the Senior Notes at our election in wholeor in part at any time prior to maturity at a redemption priceequal to the greater of 1) 100 percent of the principal amountof the notes being redeemed; or 2) the sum of the presentvalues of the remaining scheduled payments of principal andinterest (not including any portion of such payments ofinterest accrued as of the date of redemption), discounted tothe date of redemption on a semi-annual basis at the TreasuryRate (as defined in the debt agreement), plus 15 basis pointsin the case of the 2014 Notes, 20 basis points in the case of the2019 Notes and 2021 Notes, and 25 basis points in the case ofthe 2039 Notes. We would also pay the accrued and unpaidinterest on the Senior Notes to the redemption date.
We have entered into interest rate swap agreementswhich we designated as fair value hedges of underlying fixed-rate obligations on our Senior Notes due 2019. See Note 13 foradditional information regarding the interest rate swapagreements.
We also have available uncommitted credit facilitiestotaling $79.1 million.
At December 31, 2012, the weighted average interest ratefor short-term and long-term borrowings was 1.1 percent and3.5 percent, respectively. We paid $67.8 million, $55.0 millionand $59.8 million in interest during 2012, 2011 and 2010,respectively.
12. ACCUMULATED OTHER COMPREHENSIVE INCOME
Accumulated other comprehensive income itemsrepresent certain amounts that are reported as components ofstockholders’ equity in our consolidated balance sheet,including foreign currency translation adjustments, unrealizedgains and losses, net of tax, on available-for-sale investmentsand hedging instruments and pension liability adjustments.
Accumulated other comprehensive income consisted ofthe following (in millions):
As of December 31, 2012 2011
Foreign currency translation $ 445.5 $ 399.4Cash flow hedges 4.1 (10.1)Unrealized loss on securities 0.4 –Unrecognized prior service cost and unrecognized
loss in actuarial assumptions (106.1) (117.9)
Accumulated other comprehensive income $ 343.9 $ 271.4
13. DERIVATIVE INSTRUMENTS AND HEDGING ACTIVITIES
We are exposed to certain market risks relating to ourongoing business operations, including foreign currencyexchange rate risk, commodity price risk, interest rate risk andcredit risk. We manage our exposure to these and other marketrisks through regular operating and financing activities.Currently, the only risks that we manage through the use ofderivative instruments are interest rate risk and foreigncurrency exchange rate risk.
Interest Rate Risk
Derivatives Designated as Fair Value Hedges
We use interest rate derivative instruments to manage ourexposure to interest rate movements by converting fixed-ratedebt into variable-rate debt. Under these agreements, we agreeto exchange, at specified intervals, the difference betweenfixed and variable interest amounts calculated by reference toan agreed-upon notional principal amount. The objective of theinstruments is to more closely align interest expense withinterest income received on cash and cash equivalents. Thesederivative instruments are designated as fair value hedgesunder GAAP. Changes in the fair value of the derivativeinstrument are recorded in current earnings and are offset bygains or losses on the underlying debt instrument.
In 2010, we entered into multiple nine-year fixed-to-variable interest rate swap agreements with a total notionalamount of $250 million. These interest rate swap agreementswere designated as fair value hedges of the fixed interest rateobligation of our 2019 Notes. We receive a fixed interest rate of4.625 percent and pay variable interest equal to the three-month LIBOR plus an average of 133 basis points on theseinterest rate swap agreements.
Foreign Currency Exchange Rate Risk
We operate on a global basis and are exposed to the riskthat our financial condition, results of operations and cashflows could be adversely affected by changes in foreigncurrency exchange rates. To reduce the potential effects offoreign currency exchange rate movements on net earnings,we enter into derivative financial instruments in the form offoreign currency exchange forward contracts and options withmajor financial institutions. We are primarily exposed to
51

ZIMMER HOLDINGS, INC. 2012 FORM 10-K ANNUAL REPORT
Notes to Consolidated Financial Statements (Continued)
foreign currency exchange rate risk with respect totransactions and net assets denominated in Euros, SwissFrancs, Japanese Yen, British Pounds, Canadian Dollars,Australian Dollars, Korean Won, Swedish Krona, CzechKoruna, Thai Baht, Taiwan Dollars, South African Rand,Russian Rubles and Indian Rupees. We do not use derivativefinancial instruments for trading or speculative purposes.
Derivatives Designated as Cash Flow Hedges
Our revenues are generated in various currenciesthroughout the world. However, a significant amount of ourinventory is produced in U.S. Dollars. Therefore, movementsin foreign currency exchange rates may have differentproportional effects on our revenues compared to our cost ofproducts sold. To minimize the effects of foreign currencyexchange rate movements on cash flows, we hedgeintercompany sales of inventory expected to occur within thenext 30 months with foreign currency exchange forwardcontracts and options. We designate these derivativeinstruments as cash flow hedges.
We perform quarterly assessments of hedge effectivenessby verifying and documenting the critical terms of the hedgeinstrument and that forecasted transactions have not changedsignificantly. We also assess on a quarterly basis whether therehave been adverse developments regarding the risk of acounterparty default. For derivatives which qualify as hedgesof future cash flows, the effective portion of changes in fairvalue is temporarily recorded in other comprehensive incomeand then recognized in cost of products sold when the hedgeditem affects net earnings. The ineffective portion of aderivative’s change in fair value, if any, is immediatelyreported in cost of products sold.
For forward contracts and options outstanding atDecember 31, 2012, we have obligations to purchase U.S.Dollars and sell Euros, Japanese Yen, British Pounds,Canadian Dollars, Australian Dollars, Korean Won, SwedishKrona, Czech Koruna, Thai Baht, Taiwan Dollars, SouthAfrican Rand, Russian Rubles and Indian Rupees and purchaseSwiss Francs and sell U.S. Dollars at set maturity datesranging from January 2013 through June 2015. As ofDecember 31, 2012, the notional amounts of outstandingforward contracts and options entered into with third partiesto purchase U.S. Dollars were $1,548.8 million. As ofDecember 31, 2012, the notional amounts of outstandingforward contracts and options entered into with third partiesto purchase Swiss Francs were $303.9 million.
Derivatives Not Designated as Hedging Instruments
We enter into foreign currency forward exchangecontracts with terms of one month to manage currencyexposures for monetary assets and liabilities denominated in acurrency other than an entity’s functional currency. As aresult, any foreign currency remeasurement gains/losses
recognized in earnings are generally offset with gains/losses onthe foreign currency forward exchange contracts in the samereporting period. These offsetting gains/losses are recorded incost of products sold as the underlying assets and liabilitiesexposed to remeasurement include inventory-relatedtransactions. These contracts are settled on the last day ofeach reporting period. Therefore, there is no outstandingbalance related to these contracts recorded on the balancesheet as of the end of the reporting period. The notionalamounts of these contracts are typically in a range of $1.2billion to $1.7 billion per quarter.
Foreign Currency Exchange and Interest Rate Risk
Derivatives Designated as Cash Flow Hedges
In 2011, our subsidiary in Japan, with a functionalcurrency of Japanese Yen, borrowed variable-rate debt of$143.0 million denominated in U.S. Dollars under our previouscredit facility. To manage the foreign currency exchange riskassociated with remeasuring the debt to Japanese Yen and theinterest rate risk associated with the variable-rate debt, weentered into multiple cross-currency interest rate swapagreements with a total notional amount of 11,798 millionJapanese Yen. We designated these swaps as cash flow hedgesof the foreign currency exchange and interest rate risks. Theeffective portion of changes in fair value of the cross-currencyinterest rate swaps was temporarily recorded in othercomprehensive income and then recognized in interestexpense when the hedged item affected net earnings. Thecross-currency interest rate swap agreements matured in 2012and we paid off the subsidiary’s U.S. Dollar debt with JapaneseYen debt borrowed under our previous credit facility.
Income Statement Presentation
Derivatives Designated as Fair Value Hedges
Derivative instruments designated as fair value hedgeshad the following effects on our consolidated statement ofearnings (in millions):
Gain on
Instrument
Loss on Hedged
Item
Location on
Statement of
Earnings
Year Ended
December 31,
Year Ended
December 31,
Derivative
Instrument 2012 2011 2010 2012 2011 2010
Interestrateswaps
Interestexpense $6.1 $26.3 $1.5 $(6.1) $(26.3) $(1.5)
We had no ineffective fair value hedging instruments norany amounts excluded from the assessment of hedgeeffectiveness during the years ended December 31, 2012, 2011and 2010.
52

ZIMMER HOLDINGS, INC. 2012 FORM 10-K ANNUAL REPORT
Notes to Consolidated Financial Statements (Continued)
Derivatives Designated as Cash Flow Hedges
Derivative instruments designated as cash flow hedges had the following effects on other comprehensive income (OCI) on ourconsolidated balance sheet and our consolidated statement of earnings (in millions):
Amount of Gain / (Loss)
Recognized in OCI
Amount of Gain / (Loss)
Reclassified from OCI
Year Ended December 31, Year Ended December 31,
Derivative Instrument 2012 2011 2010 Location on Statement of Earnings 2012 2011 2010
Foreign exchange forward contracts $16.3 $(34.9) $ 11.2 Cost of products sold $(12.0) $(32.9) $7.3
Foreign exchange options (1.1) (0.2) 0.3 Cost of products sold (0.4) – –
Cross-currency interest rate swaps – 0.2 – Interest expense 0.2 (8.3) –
$15.2 $(34.9) $11.5 $(12.2) $(41.2) $7.3
The net amount recognized in earnings during the years ended December 31, 2012, 2011 and 2010 due to ineffectiveness andamounts excluded from the assessment of hedge effectiveness were not significant.
The fair value of outstanding derivative instruments designated as cash flow hedges and recorded on the balance sheet atDecember 31, 2012, together with settled derivatives where the hedged item has not yet affected earnings, was a net unrealized gainof $4.8 million, or $4.1 million after taxes, which is deferred in accumulated other comprehensive income. Of the net unrealized gain,losses of $5.3 million, or $4.5 million after taxes, are expected to be reclassified to earnings over the next twelve months.
Derivatives Not Designated as Hedging Instruments
The following gains/(losses) from these derivative instruments were recognized on our consolidated statement of earnings (inmillions):
Location on
Statement of Earnings
Year Ended December 31,
Derivative Instrument 2012 2011 2010
Foreign exchange forward contracts Cost of products sold $(2.0) $2.7 $3.3
This impact does not include any offsetting gains/losses recognized in earnings as a result of foreign currency remeasurementof monetary assets and liabilities denominated in a currency other than an entity’s functional currency.
Balance Sheet Presentation
As of December 31, 2012 and December 31, 2011, all derivative instruments designated as fair value hedges and cash flowhedges are recorded at fair value on the balance sheet. On our consolidated balance sheet, we recognize individual forwardcontracts and options with the same counterparty on a net asset/liability basis if we have a master netting agreement with thecounterparty. The fair value of derivative instruments on a gross basis is as follows (in millions):
As of December 31, 2012 As of December 31, 2011
Balance Sheet Location
Fair
Value Balance Sheet Location
Fair
Value
Asset Derivatives
Foreign exchange forward contracts Other current assets $29.7 Other current assets $24.9
Foreign exchange options Other current assets 0.6 Other current assets 1.4
Foreign exchange forward contracts Other assets 19.8 Other assets 14.5
Foreign exchange options Other assets – Other assets 1.0
Interest rate swaps Other assets 33.9 Other assets 27.8
Total asset derivatives $84.0 $69.6
Liability Derivatives
Foreign exchange forward contracts Other current liabilities $20.2 Other current liabilities $35.6
Cross-currency interest rate swaps Other current liabilities – Other current liabilities 8.2
Foreign exchange forward contracts Other long-term liabilities 12.3 Other long-term liabilities 13.1
Total liability derivatives $32.5 $56.9
53

ZIMMER HOLDINGS, INC. 2012 FORM 10-K ANNUAL REPORT
Notes to Consolidated Financial Statements (Continued)
14. RETIREMENT BENEFIT PLANS
We have defined benefit pension plans covering certain U.S. and Puerto Rico employees. The employees who are notparticipating in the defined benefit plans receive additional benefits under our defined contribution plans. Plan benefits areprimarily based on years of credited service and the participant’s average eligible compensation. In addition to the U.S. and PuertoRico defined benefit pension plans, we sponsor various non-U.S. pension arrangements, including retirement and terminationbenefit plans required by local law or coordinated with government sponsored plans.
We use a December 31 measurement date for our benefit plans.
Defined Benefit Plans
The components of net pension expense for our defined benefit retirement plans are as follows (in millions):
U.S. and Puerto Rico Non-U.S.
For the Years Ended December 31, 2012 2011 2010 2012 2011 2010
Service cost $ 11.4 $ 11.4 $ 10.9 $15.0 $16.8 $14.6
Interest cost 13.3 13.0 11.5 6.1 7.3 6.7
Expected return on plan assets (25.5) (21.9) (18.1) (7.6) (9.6) (8.0)
Settlement 0.7 — — — — —
Amortization of prior service cost (2.0) — (0.1) (0.9) (0.8) (0.7)
Amortization of unrecognized actuarial loss 11.4 6.2 2.4 1.9 1.2 1.2
Net periodic benefit cost $ 9.3 $ 8.7 $ 6.6 $14.5 $14.9 $13.8
The weighted average actuarial assumptions used to determine net pension expense for our defined benefit retirement planswere as follows:
U.S. and Puerto Rico Non-U.S.
For the Years Ended December 31, 2012 2011 2010 2012 2011 2010
Discount rate 4.97% 5.82% 6.26% 2.58% 2.82% 3.19%
Rate of compensation increase 3.81% 3.81% 3.80% 2.77% 2.64% 2.63%
Expected long-term rate of return on plan assets 7.75% 7.75% 7.50% 3.51% 4.01% 4.12%
54

ZIMMER HOLDINGS, INC. 2012 FORM 10-K ANNUAL REPORT
Notes to Consolidated Financial Statements (Continued)
The expected long-term rate of return on plan assets is based on the historical and estimated future rates of return on thedifferent asset classes held in the plans. The expected long-term rate of return is the weighted average of the target asset allocationof each individual asset class. We believe that historical asset results approximate expected market returns applicable to thefunding of a long-term benefit obligation.
Discount rates were determined for each of our defined benefit retirement plans at their measurement date to reflect the yieldof a portfolio of high quality bonds matched against the timing and amounts of projected future benefit payments.
Changes in projected benefit obligations and plan assets were (in millions):
U.S. and Puerto Rico Non-U.S.
For the Years Ended December 31, 2012 2011 2012 2011
Projected benefit obligation – beginning of year $290.0 $227.1 $235.1 $226.5Service cost 11.4 11.4 15.0 16.8Interest cost 13.3 13.0 6.1 7.3Plan amendments (17.1) – – –Employee contributions – – 17.5 15.9Benefits paid (7.0) (4.5) (21.3) (36.7)Settlement (1.1) – – –Actuarial (gain) loss 24.8 43.0 6.9 0.4Prior service cost – – (3.7) (1.6)Expenses paid – – (0.2) (0.1)Translation loss – – 4.0 6.6
Projected benefit obligation – end of year $314.3 $290.0 $259.4 $235.1
Plan assets at fair market value – beginning of year $275.1 $244.9 $205.1 $206.0Actual return on plan assets 40.7 (2.1) 11.4 (2.5)Employer contributions 54.2 36.8 15.5 16.0Employee contributions – – 17.5 15.9Benefits paid (7.0) (4.5) (21.3) (36.7)Expenses paid – – (0.2) (0.1)Translation gain – – 3.6 6.5
Plan assets at fair market value – end of year $363.0 $275.1 $231.6 $205.1
Funded status $ 48.7 $(14.9) $(27.8) $(30.0)
Amounts recognized in consolidated balance sheet:Prepaid pension $ 61.9 $ – $ 7.5 $ 4.3Short-term accrued benefit liability (0.4) (1.0) – –Long-term accrued benefit liability (12.8) (13.9) (35.3) (34.3)
Net amount recognized $ 48.7 $(14.9) $(27.8) $(30.0)
Amounts recognized in accumulated other comprehensive income:Unrecognized prior service cost $(14.5) $ 0.6 $ (9.6) $ (6.7)Unrecognized actuarial loss 136.9 140.4 35.9 45.5
Total amount recognized $122.4 $141.0 $ 26.3 $ 38.8
We estimate the following amounts recorded as part of accumulated other comprehensive income will be recognized as part ofour net pension expense during 2013 (in millions):
U.S. and
Puerto Rico Non-U.S.
Unrecognized prior service cost $(2.6) $(1.3)
Unrecognized actuarial loss 15.4 1.9
$12.8 $ 0.6
55

ZIMMER HOLDINGS, INC. 2012 FORM 10-K ANNUAL REPORT
Notes to Consolidated Financial Statements (Continued)
The weighted average actuarial assumptions used to determine the projected benefit obligation for our defined benefitretirement plans were as follows:
U.S. and Puerto Rico Non-U.S .
For the Years Ended December 31, 2012 2011 2010 2012 2011 2010
Discount rate 4.32% 5.05% 5.82% 2.15% 2.49% 2.82%
Rate of compensation increase 3.29% 3.81% 3.80% 2.75% 2.76% 2.61%
Plans with projected benefit obligations in excess of plan assets were as follows (in millions):
U.S. and Puerto Rico Non-U.S.
As of December 31, 2012 2011 2012 2011
Projected benefit obligation $29.3 $290.0 $233.1 $211.5
Plan assets at fair market value 16.0 275.1 197.7 177.3
Plans with accumulated benefit obligations in excess of plan assets were as follows (in millions):
U.S. and Puerto Rico Non-U.S.
As of December 31, 2012 2011 2012 2011
Accumulated benefit obligation $26.9 $22.4 $191.9 $190.4
Plan assets at fair market value 16.0 13.0 168.8 168.7
The accumulated benefit obligation for U.S. and PuertoRico defined benefit retirement pension plans was $268.7million and $241.3 million as of December 31, 2012 and 2011,respectively. The accumulated benefit obligation for non-U.S.defined benefit retirement plans was $244.9 million and$219.9 million as of December 31, 2012 and 2011, respectively.
The benefits expected to be paid out in each of the nextfive years and for the five years combined thereafter are asfollows (in millions):
For the Years Ending December 31,
U.S. and
Puerto Rico Non-U.S.
2013 $ 8.9 $ 16.2
2014 10.4 14.2
2015 11.4 16.3
2016 13.1 16.1
2017 14.6 16.4
2018-2022 96.5 109.7
The U.S. and Puerto Rico defined benefit retirementplans’ overall investment strategy is to maximize total returnsby emphasizing long-term growth of capital while mitigatingrisk. We have established target ranges of assets held by theplans of 45 to 50 percent for equity securities, 35 to 40 percentfor debt securities and 5 to 15 percent in non-traditionalinvestments. The plans strive to have sufficiently diversifiedassets so that adverse or unexpected results from one assetclass will not have an unduly detrimental impact on the entireportfolio. We regularly review the investments in the plans andwe may rebalance them from time-to-time based upon thetarget asset allocation of the plans.
For the U.S. and Puerto Rico plans, we maintain aninvestment policy statement that guides the investment
allocation in the plans. The investment policy statementdescribes the target asset allocation positions described above.We have a benefits committee to monitor compliance with andadminister the investment policy statement and the plans’assets and oversee the general investment strategy andobjectives of the plans. The benefits committee generallymeets quarterly to review performance and to ensure that thecurrent investment allocation is within the parameters of theinvestment policy statement.
The investment strategies of non-U.S. based plans varyaccording to the plan provisions and local laws. The majorityof the assets in non-U.S. based plans are located inSwitzerland-based plans. These assets are held in trusts andare commingled with the assets of other Swiss companies withrepresentatives of all the companies making the investmentdecisions. The overall strategy is to maximize total returnswhile avoiding risk. The trustees of the assets have establishedtarget ranges of assets held by the plans of 30 to 50 percent indebt securities, 20 to 37 percent in equity securities, 15 to 24percent in real estate, 3 to 15 percent in cash funds and 0 to12 percent in other funds.
56

ZIMMER HOLDINGS, INC. 2012 FORM 10-K ANNUAL REPORT
Notes to Consolidated Financial Statements (Continued)
The fair value of our U.S. and Puerto Rico pension planassets by asset category was as follows (in millions):
As of December 31, 2012
Fair Value Measurements at Reporting Date Using:
Asset Category Total
Quoted Pricesin Active
Markets forIdentical
Assets(Level 1)
SignificantOther
ObservableInputs
(Level 2)
SignificantUnobservable
Inputs(Level 3)
Cash and cash equivalents $ 3.2 $3.2 $ – $–
Equity securities:
U.S. large-cap 60.3 – 60.3 –
U.S. small-cap 22.1 – 22.1 –
International 87.5 – 87.5 –
Real estate 29.5 – 29.5 –
Commodity-linked mutualfunds 38.3 – 38.3 –
Intermediate fixed incomesecurities 122.1 – 122.1 –
Total $363.0 $3.2 $359.8 $–
As of December 31, 2011
Fair Value Measurements at Reporting Date Using:
Asset Category Total
Quoted Pricesin Active
Markets forIdentical
Assets(Level 1)
SignificantOther
ObservableInputs
(Level 2)
SignificantUnobservable
Inputs(Level 3)
Cash and cash equivalents $ 1.4 $1.4 $ – $–
Equity securities:
U.S. large-cap 52.9 – 52.9 –
U.S. small-cap 17.4 – 17.4 –
International 50.0 – 50.0 –
Real estate 18.7 – 18.7 –
Commodity-linkedmutual funds 25.0 – 25.0 –
Intermediate fixed incomesecurities 109.7 – 109.7 –
Total $275.1 $1.4 $273.7 $–
The fair value of our non-U.S. pension plan assets was asfollows (in millions):
As of December 31, 2012
Fair Value Measurements at Reporting Date Using:
Asset Category Total
Quoted Pricesin Active
Markets forIdentical
Assets(Level 1)
SignificantOther
ObservableInputs
(Level 2)
SignificantUnobservable
Inputs(Level 3)
Cash and cash equivalents $ 12.7 $12.7 $ – $ –Equity securities:
Energy 1.7 1.7 – –
Materials 2.6 2.6 – –
Industrials 4.1 4.1 – –
Consumer discretionary 2.2 2.2 – –
Consumer staples 3.0 3.0 – –
Healthcare 4.9 4.9 – –
Financials 7.3 7.3 – –
Information technology 2.5 2.5 – –
Telecommunication services 1.0 1.0 – –
Utilities 1.6 1.6 – –
Other 35.1 32.5 2.6 –Fixed income securities:
Government bonds 44.9 – 44.9 –
Corporate bonds 37.9 – 37.9 –
Asset-backed securities 13.2 – 13.2 –
Other debt 1.0 – 1.0 –Other types of investments:
Mortgage loans 5.4 – 5.4 –
Insurance contracts 5.9 – 5.9 –
Other investments 7.5 – 7.5 –Real estate 37.1 – – 37.1
Total $231.6 $76.1 $118.4 $37.1
As of December 31, 2011
Fair Value Measurements at Reporting Date Using:
Asset Category Total
Quoted Pricesin Active
Markets forIdentical
Assets(Level 1)
SignificantOther
ObservableInputs
(Level 2)
SignificantUnobservable
Inputs(Level 3)
Cash and cash equivalents $ 10.8 $10.8 $ – $ –
Equity securities:
Energy 1.9 1.9 – –
Materials 2.0 2.0 – –
Industrials 3.7 3.7 – –
Consumer discretionary 2.1 2.1 – –
Consumer staples 4.0 4.0 – –
Healthcare 6.0 6.0 – –
Financials 5.8 5.8 – –
Information technology 2.3 2.3 – –
Telecommunication services 1.0 1.0 – –
Utilities 1.6 1.6 – –
Other 28.9 26.6 2.3 –
Fixed income securities:
Government bonds 42.5 – 42.5 –
Corporate bonds 35.5 – 35.5 –
Asset-backed securities 8.4 – 8.4 –
Other debt 1.1 – 1.1 –
Other types of investments:
Mortgage loans 5.2 – 5.2 –
Insurance contracts 5.5 – 5.5 –
Other investments 5.0 – 5.0 –
Real estate 31.8 – – 31.8
Total $205.1 $67.8 $105.5 $31.8
57

ZIMMER HOLDINGS, INC. 2012 FORM 10-K ANNUAL REPORT
Notes to Consolidated Financial Statements (Continued)
As of December 31, 2012 and 2011, our defined benefitpension plans’ assets did not hold any direct investment inZimmer Holdings common stock.
Equity securities are valued using a market approach,based on quoted prices for the specific security fromtransactions in active exchange markets (Level 1), or in somecases where we are invested in mutual or collective funds,based upon the net asset value per unit of the fund which isdetermined from quoted market prices of the underlyingsecurities in the fund’s portfolio (Level 2). Fixed incomesecurities are valued using a market approach, based uponquoted prices for the specific security or from institutional bidevaluations. Some fixed income securities are in funds with anet asset value per unit which is determined using similartechniques for the underlying securities in the fund’s portfolio.Real estate is valued by discounting to present value the cashflows expected to be generated by the specific properties.
The following table provides a reconciliation of thebeginning and ending balances of our non-U.S. pension planassets measured at fair value that used significantunobservable inputs (Level 3) (in millions):
December 31,
2012
Beginning Balance 31.8Gains on assets sold 0.2Change in fair value of assets 0.9Net purchases and sales 3.3Translation gain 0.9
Ending Balance $37.1
We expect that we will have no legally required minimumfunding requirements in 2013 for the qualified U.S. and PuertoRico defined benefit retirement plans. We expect to voluntarilycontribute between $24 million and $42 million to these plansduring 2013. Contributions to non-U.S. defined benefit plansare estimated to be approximately $16 million in 2013. We donot expect the assets in any of our plans to be returned to us inthe next year.
Defined Contribution Plans
We also sponsor defined contribution plans forsubstantially all of the U.S. and Puerto Rico employees andcertain employees in other countries. The benefits offeredunder these plans are reflective of local customs and practicesin the countries concerned. We expensed $26.5 million, $25.7million and $24.4 million related to these plans for the yearsended December 31, 2012, 2011 and 2010, respectively.
15. INCOME TAXES
The components of earnings before income taxes consistof the following (in millions):
For the Years Ended December 31, 2012 2011 2010
United States operations $409.9 $485.7 $382.4
Foreign operations 580.2 493.2 477.8
Total $990.1 $978.9 $860.2
The provision for income taxes consists of (in millions):
Current:
Federal $179.8 $148.4 $235.3
State 13.8 14.3 19.5
Foreign 108.4 75.9 81.0
302.0 238.6 335.8
Deferred:
Federal (58.8) (2.6) (54.9)
State 0.7 (0.9) (2.0)
Foreign (6.7) (16.2) (15.6)
(64.8) (19.7) (72.5)
Provision for income taxes $237.2 $218.9 $263.3
Income taxes paid during 2012, 2011 and 2010 were$227.6 million, $236.4 million and $330.6 million, respectively.
A reconciliation of the U.S. statutory income tax rate toour effective tax rate is as follows:
For the Years Ended December 31, 2012 2011 2010
U.S. statutory income tax rate 35.0% 35.0% 35.0%
State taxes, net of federal deduction 1.0 0.7 1.3
Tax impact of foreign operations,including foreign tax credits (10.4) (11.0) (10.6)
Tax impact of significant non-recurring transactions (3.5) – –
Tax benefit relating to U.S.manufacturer’s deduction andexport sales (1.9) (1.6) (2.6)
R&D credit – (0.5) (0.8)
Goodwill impairment 3.4 – 8.3
Other 0.4 (0.2) –
Effective income tax rate 24.0% 22.4% 30.6%
Our operations in Puerto Rico, Switzerland and the Stateof Indiana benefit from various tax incentive grants. Unlessthese grants are extended, they will expire between fiscalyears 2016 and 2026.
Deferred income taxes reflect the net tax effects oftemporary differences between the carrying amounts of assetsand liabilities for financial reporting purposes and the amountsused for income tax purposes. Valuation allowances arerecorded to reduce deferred income tax assets when it is morelikely than not that an income tax benefit will not be realized.
58
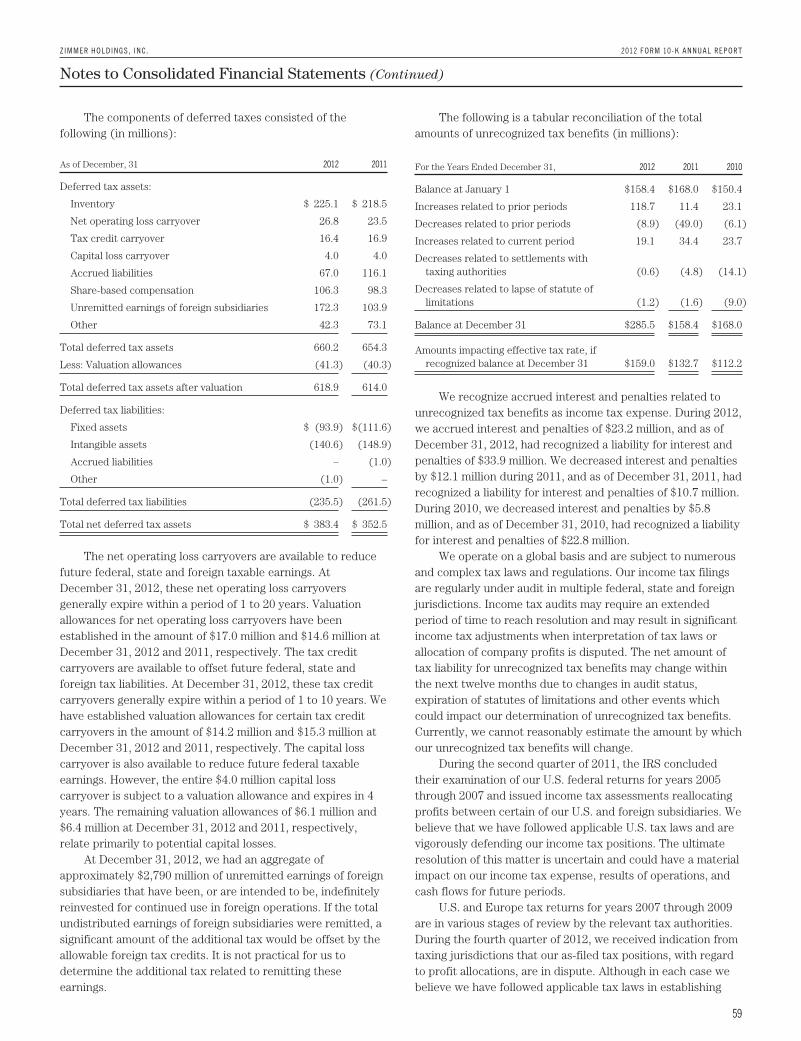
ZIMMER HOLDINGS, INC. 2012 FORM 10-K ANNUAL REPORT
Notes to Consolidated Financial Statements (Continued)
The components of deferred taxes consisted of thefollowing (in millions):
As of December, 31 2012 2011
Deferred tax assets:
Inventory $ 225.1 $ 218.5
Net operating loss carryover 26.8 23.5
Tax credit carryover 16.4 16.9
Capital loss carryover 4.0 4.0
Accrued liabilities 67.0 116.1
Share-based compensation 106.3 98.3
Unremitted earnings of foreign subsidiaries 172.3 103.9
Other 42.3 73.1
Total deferred tax assets 660.2 654.3
Less: Valuation allowances (41.3) (40.3)
Total deferred tax assets after valuation 618.9 614.0
Deferred tax liabilities:
Fixed assets $ (93.9) $(111.6)
Intangible assets (140.6) (148.9)
Accrued liabilities – (1.0)
Other (1.0) –
Total deferred tax liabilities (235.5) (261.5)
Total net deferred tax assets $ 383.4 $ 352.5
The net operating loss carryovers are available to reducefuture federal, state and foreign taxable earnings. AtDecember 31, 2012, these net operating loss carryoversgenerally expire within a period of 1 to 20 years. Valuationallowances for net operating loss carryovers have beenestablished in the amount of $17.0 million and $14.6 million atDecember 31, 2012 and 2011, respectively. The tax creditcarryovers are available to offset future federal, state andforeign tax liabilities. At December 31, 2012, these tax creditcarryovers generally expire within a period of 1 to 10 years. Wehave established valuation allowances for certain tax creditcarryovers in the amount of $14.2 million and $15.3 million atDecember 31, 2012 and 2011, respectively. The capital losscarryover is also available to reduce future federal taxableearnings. However, the entire $4.0 million capital losscarryover is subject to a valuation allowance and expires in 4years. The remaining valuation allowances of $6.1 million and$6.4 million at December 31, 2012 and 2011, respectively,relate primarily to potential capital losses.
At December 31, 2012, we had an aggregate ofapproximately $2,790 million of unremitted earnings of foreignsubsidiaries that have been, or are intended to be, indefinitelyreinvested for continued use in foreign operations. If the totalundistributed earnings of foreign subsidiaries were remitted, asignificant amount of the additional tax would be offset by theallowable foreign tax credits. It is not practical for us todetermine the additional tax related to remitting theseearnings.
The following is a tabular reconciliation of the totalamounts of unrecognized tax benefits (in millions):
For the Years Ended December 31, 2012 2011 2010
Balance at January 1 $158.4 $168.0 $150.4
Increases related to prior periods 118.7 11.4 23.1
Decreases related to prior periods (8.9) (49.0) (6.1)
Increases related to current period 19.1 34.4 23.7
Decreases related to settlements withtaxing authorities (0.6) (4.8) (14.1)
Decreases related to lapse of statute oflimitations (1.2) (1.6) (9.0)
Balance at December 31 $285.5 $158.4 $168.0
Amounts impacting effective tax rate, ifrecognized balance at December 31 $159.0 $132.7 $112.2
We recognize accrued interest and penalties related tounrecognized tax benefits as income tax expense. During 2012,we accrued interest and penalties of $23.2 million, and as ofDecember 31, 2012, had recognized a liability for interest andpenalties of $33.9 million. We decreased interest and penaltiesby $12.1 million during 2011, and as of December 31, 2011, hadrecognized a liability for interest and penalties of $10.7 million.During 2010, we decreased interest and penalties by $5.8million, and as of December 31, 2010, had recognized a liabilityfor interest and penalties of $22.8 million.
We operate on a global basis and are subject to numerousand complex tax laws and regulations. Our income tax filingsare regularly under audit in multiple federal, state and foreignjurisdictions. Income tax audits may require an extendedperiod of time to reach resolution and may result in significantincome tax adjustments when interpretation of tax laws orallocation of company profits is disputed. The net amount oftax liability for unrecognized tax benefits may change withinthe next twelve months due to changes in audit status,expiration of statutes of limitations and other events whichcould impact our determination of unrecognized tax benefits.Currently, we cannot reasonably estimate the amount by whichour unrecognized tax benefits will change.
During the second quarter of 2011, the IRS concludedtheir examination of our U.S. federal returns for years 2005through 2007 and issued income tax assessments reallocatingprofits between certain of our U.S. and foreign subsidiaries. Webelieve that we have followed applicable U.S. tax laws and arevigorously defending our income tax positions. The ultimateresolution of this matter is uncertain and could have a materialimpact on our income tax expense, results of operations, andcash flows for future periods.
U.S. and Europe tax returns for years 2007 through 2009are in various stages of review by the relevant tax authorities.During the fourth quarter of 2012, we received indication fromtaxing jurisdictions that our as-filed tax positions, with regardto profit allocations, are in dispute. Although in each case webelieve we have followed applicable tax laws in establishing
59

ZIMMER HOLDINGS, INC. 2012 FORM 10-K ANNUAL REPORT
Notes to Consolidated Financial Statements (Continued)
our filed tax positions, this new information impacted ourdetermination of unrecognized tax benefits resulting in anincrease in both the net amount of tax liability forunrecognized tax benefits and income tax expense. Theultimate resolution of this matter is uncertain and could have amaterial impact on our income tax expense, results ofoperations, and cash flows for future periods.
State income tax returns are generally subject toexamination for a period of 3 to 5 years after filing of therespective return. The state impact of any federal changesgenerally remains subject to examination by various states fora period of up to one year after formal notification to thestates. We have various state income tax returns in the processof examination, administrative appeals or litigation.
Our tax returns are currently under examination invarious foreign jurisdictions. Foreign jurisdictions havestatutes of limitations generally ranging from 3 to 5 years.Years still open to examination by foreign tax authorities inmajor jurisdictions include: Australia (2008 onward), Canada(2006 onward), France (2010 onward), Germany (2009onward), Ireland (2008 onward), Italy (2006 onward), Japan(2010 onward), Korea (2007 onward), Puerto Rico (2008onward), Switzerland (2011 onward), and the United Kingdom(2011 onward).
16. CAPITAL STOCK AND EARNINGS PER SHARE
We are authorized to issue 250 million shares of preferredstock, none of which were issued or outstanding as ofDecember 31, 2012.
The numerator for both basic and diluted earnings pershare is net earnings available to common stockholders. Thedenominator for basic earnings per share is the weightedaverage number of common shares outstanding during theperiod. The denominator for diluted earnings per share isweighted average shares outstanding adjusted for the effect ofdilutive stock options and other equity awards. The following isa reconciliation of weighted average shares for the basic anddiluted share computations (in millions):
For the Years Ended December 31, 2012 2011 2010
Weighted average shares outstanding for basicnet earnings per share 174.9 187.6 200.0
Effect of dilutive stock options and otherequity awards 1.1 1.1 1.1
Weighted average shares outstanding fordiluted net earnings per share 176.0 188.7 201.1
For the year ended December 31, 2012, an average of11.9 million options to purchase shares of common stock werenot included in the computation of diluted earnings per shareas the exercise prices of these options were greater than theaverage market price of the common stock. For the yearsended December 31, 2011 and 2010, an average of 13.2 millionand 13.7 million options, respectively, were not included.
During 2012, we repurchased 7.7 million shares of ourcommon stock at an average price of $63.39 per share for atotal cash outlay of $485.6 million, including commissions. Asof December 31, 2012, $1,014.6 million remained authorizedunder a $1.5 billion repurchase program, which will expire onDecember 31, 2014.
17. SEGMENT DATA
We design, develop, manufacture and market orthopaedicreconstructive implants, biologics, dental implants, spinalimplants, trauma products and related surgical products whichinclude surgical supplies and instruments designed to aid insurgical procedures and post-operation rehabilitation. We alsoprovide other healthcare-related services. We manageoperations through three major geographic segments – theAmericas, which is comprised principally of the U.S. andincludes other North, Central and South American markets;Europe, which is comprised principally of Europe and includesthe Middle East and African markets; and Asia Pacific, which iscomprised primarily of Japan and includes other Asian andPacific markets. This structure is the basis for our reportablesegment information discussed below. Management evaluatesreportable segment performance based upon segmentoperating profit exclusive of operating expenses pertaining toshare-based payment expense, inventory step-up and othercertain inventory charges, “Certain claims,” goodwillimpairment, “Special items,” and global operations andcorporate functions. Global operations and corporate functionsinclude research, development engineering, medical education,brand management, corporate legal, finance, and humanresource functions, U.S., Puerto Rico and Ireland-basedmanufacturing operations and logistics and intangible assetamortization resulting from business combination accounting.Intercompany transactions have been eliminated from segmentoperating profit. Management reviews accounts receivable,inventory, property, plant and equipment, goodwill andintangible assets by reportable segment exclusive of U.S.,Puerto Rico and Ireland-based manufacturing operations andlogistics and corporate assets.
60

ZIMMER HOLDINGS, INC. 2012 FORM 10-K ANNUAL REPORT
Notes to Consolidated Financial Statements (Continued)
Net sales and other information by segment is as follows (in millions):
Americas Europe
Asia
Pacific
Global
Operations
and
Corporate
Functions Total
As of and for the Year Ended December 31, 2012
Net sales $2,476.3 $1,177.4 $818.0 $ – $4,471.7Depreciation and amortization 73.7 73.6 36.3 179.5 363.1Segment operating profit 1,256.3 369.1 311.1 (562.9) 1,373.6
Share-based payment expense (55.0)Inventory step-up and other inventory charges (4.8)Certain claims (15.0)Goodwill impairment (96.0)Special items (155.4)
Operating profit 1,047.4Long-lived assets 776.0 326.1 108.6 – 1,210.7Total assets 2,690.6 2,308.0 578.3 3,435.5 9,012.4Additions to instruments – 14.0 7.1 127.8 148.9Additions to other property, plant and equipment 0.7 21.9 6.4 85.7 114.7
As of and for the Year Ended December 31, 2011
Net sales $2,440.8 $1,214.5 $796.5 $ – $4,451.8Depreciation and amortization 81.0 74.9 36.3 167.7 359.9Segment operating profit 1,220.4 411.5 290.6 (593.5) 1,329.0
Share-based payment expense (60.5)Inventory step-up (11.4)Certain claims (157.8)Special items (75.2)
Operating profit 1,024.1Long-lived assets 769.0 330.6 107.7 – 1,207.3Total assets 2,571.6 2,345.5 602.4 2,995.8 8,515.3Additions to instruments – 15.2 7.7 132.5 155.4Additions to other property, plant and equipment 1.3 23.8 4.7 84.0 113.8
As of and for the Year Ended December 31, 2010
Net sales $2,431.6 $1,099.5 $689.1 $ – $4,220.2Depreciation and amortization 78.1 70.5 30.0 161.6 340.2Segment operating profit 1,214.6 398.0 259.9 (578.7) 1,293.8
Share-based payment expense (62.0)Inventory step-up (1.4)Certain claims (75.0)Goodwill impairment (204.0)Special items (34.7)
Operating profit 916.7Long-lived assets 841.5 281.7 90.6 – 1,213.8Total assets 2,578.0 2,210.8 561.4 2,649.7 7,999.9Additions to instruments – 22.9 5.2 164.4 192.5Additions to other property, plant and equipment 0.3 16.9 7.6 54.4 79.2
61

ZIMMER HOLDINGS, INC. 2012 FORM 10-K ANNUAL REPORT
Notes to Consolidated Financial Statements (Continued)
The Americas long-lived tangible assets are locatedprimarily in the U.S. $226.1 million of Europe long-livedtangible assets as of December 31, 2012 are located inSwitzerland.
For segment reporting purposes, deployed instrumentsare included in the measurement of reportable segment assetswhile undeployed instruments at U.S. and Puerto Rico-basedmanufacturing operations and logistics are included in globaloperations and corporate functions. The majority ofinstruments are purchased by U.S., Puerto Rico and Ireland-based manufacturing operations and logistics and are deployedto the reportable segments as needed for the business.Therefore, the reportable segment assets include deployedinstruments even though that reportable segment may notreport the instrument addition.
U.S. sales were $2,280.7 million, $2,263.7 million and$2,277.2 million for the years ended December 31, 2012, 2011and 2010, respectively. Sales within any other individualcountry were less than 10 percent of our consolidated sales.Sales are attributable to a country based upon the customer’scountry of domicile.
Net sales by product category are as follows (in millions):
For the Years Ended December 31, 2012 2011 2010
Reconstructive
Knees $1,814.8 $1,825.1 $1,789.9
Hips 1,342.0 1,355.6 1,262.3
Extremities 173.8 163.4 150.1
3,330.6 3,344.1 3,202.3
Dental 237.7 248.1 219.0
Trauma 307.9 285.8 245.5
Spine 208.9 225.0 234.4
Surgical and other 386.6 348.8 319.0
Total $4,471.7 $4,451.8 $4,220.2
18. LEASES
Total rent expense for the years ended December 31,2012, 2011 and 2010 aggregated $46.3 million, $47.0 millionand $46.2 million, respectively.
Future minimum rental commitments under non-cancelable operating leases in effect as of December 31, 2012were (in millions):
For the Years Ending December 31,
2013 $45.9
2014 33.1
2015 26.4
2016 21.3
2017 18.2
Thereafter 47.1
19. COMMITMENTS AND CONTINGENCIES
Product Liability-Related Claims
We are subject to product liability claims arising in theordinary course of our business. We establish standardaccruals for product liability claims in conjunction with outsidecounsel based on current information and historical settlementinformation for open claims, related legal fees and claimsincurred but not reported. These standard product liabilityaccruals are recognized in selling, general and administrativeexpense. We may also establish provisions for certain productliability claims outside of the standard accruals that arerecorded separately on our statement of earnings, such as theprovision for claims related to the Durom Cup discussedbelow. We maintain insurance, subject to self-insured retentionrequirements, for losses from these and other claims.
On July 22, 2008, we temporarily suspended marketingand distribution of the Durom Cup in the U.S. Subsequently, anumber of product liability lawsuits and other claims havebeen asserted against us. We have settled some of these claimsand the others are still pending. Additional claims may beasserted in the future.
Initially, we estimated that any revision surgeries requiredwould manifest themselves within two years of the originalsurgery. In the second quarter of 2010, based upon morerecent claims information available, we revised our estimate toinclude all claims for revisions of original surgeries performedbefore July 22, 2008 (i.e., before our temporary suspension) ona worldwide basis, regardless of the amount of time betweenthe revision surgery and the original surgery. In the fourthquarter of 2011, as additional claims information becameavailable, we revised our estimates and methodology again toconsolidate all estimated liabilities associated with Durom
Cup-related claims regardless of whether the original surgeryoccurred before or after our temporary sales suspension. Werecognized estimated claims that met the parameters noted inthis paragraph during that time period as “Certain claims” onour statement of earnings. We recognized estimated claimsoutside these parameters as part of selling, general andadministrative expense. The following table shows the line ofour statement of earnings and the period in which Durom
Cup-related claims were recognized:
For the Years Ended December 31, 2012 2011 2010 2009 2008 Total
Certain claims $15.0 $157.8 $75.0 $35.0 $69.0 $351.8
Selling, general andadministrative – 4.2 15.4 24.6 7.2 51.4
Total $15.0 $162.0 $90.4 $59.6 $76.2 $403.2
As noted above, we maintain insurance for productliability claims, subject to self-insurance retentionrequirements. In 2008, we notified our insurance carriers ofpotential claims related to the Durom Cup. Based upon ourmost recent estimates for liabilities associated with the Durom
62

ZIMMER HOLDINGS, INC. 2012 FORM 10-K ANNUAL REPORT
Notes to Consolidated Financial Statements (Continued)
Cup, as detailed above, we believe we may exhaust our self-insured retention under our insurance program. In this event,we would have a claim for insurance proceeds for ultimatelosses which exceed the self-insured retention amount, subjectto a 20 percent co-payment requirement and a cap. We believeour contracts with the insurance carriers are enforceable forthese claims and therefore we believe it is highly probable thatwe would recover some amount from our insurance carriers ifour ultimate losses exceed our self-insured retention.Accordingly, we have recognized a $98.0 million receivable in“other assets” on our consolidated balance sheet that reduced“Certain claims” expense for estimated insurance recoveries.As is customary in this process, our insurance carriers havereserved all rights under their respective policies and couldstill ultimately deny coverage for some or all of our insuranceclaims.
Our estimate, as of December 31, 2012, of the remainingliability for all Durom Cup-related claims is $260.8 million, ofwhich $50.0 million is classified as short-term in “Other currentliabilities” and $210.8 million is classified as long-term in“Other long-term liabilities” on our consolidated balance sheet.We expect to pay the majority of the Durom Cup-relatedclaims within the next five years.
Our understanding of clinical outcomes with the Durom
Cup and other large diameter hip cups continues to evolve. Werely on significant estimates in determining the provisions forDurom Cup-related claims, including the number of claimsthat we will receive and the average amount we will pay perclaim. The actual number of claims that we receive and theamount we pay per claim may differ from our estimates. Sinceour understanding of the clinical outcomes is still evolving, wecannot reasonably estimate the possible loss or range of lossthat may result from Durom Cup-related claims in excess ofthe losses we have accrued.
On August 20, 2008, Margo and Daniel Polett filed anaction against us and an unrelated third party, PublicCommunications, Inc. (PCI), in the Court of Common Pleas,Philadelphia, Pennsylvania seeking an unspecified amount ofdamages for injuries and loss of consortium allegedly sufferedby Mrs. Polett and her spouse, respectively. The complaintalleged that defendants were negligent in connection withMrs. Polett’s participation in a promotional video featuring oneof our knee products. The case was tried in November 2010and the jury returned a verdict in favor of plaintiffs. The juryawarded $27.6 million in compensatory damages andapportioned fault 30 percent to plaintiffs, 34 percent to us and36 percent to PCI. Under applicable law, we may be liable forany portion of the damages apportioned to PCI that it does notpay. On December 2, 2010, we and PCI filed a Motion for Post-Trial Relief seeking a judgment notwithstanding the verdict, anew trial or a remittitur. On June 10, 2011, the trial courtentered an order denying our Motion for Post-Trial Relief andaffirming the jury verdict in full and entered judgment for$20.3 million against us and PCI. On June 29, 2011, we filed aNotice of Appeal to the Superior Court of Pennsylvania and
posted a bond for the verdict amount plus interest. Oralargument before the appellate court in Philadelphia,Pennsylvania was held on March 13, 2012. A ruling has not yetbeen issued. We do not believe the facts and evidence supportthe jury’s verdict. Although we believe we have strong groundsto reverse the jury’s verdict, the ultimate resolution of thismatter is uncertain and could result in a loss of up to $20million in excess of the amount accrued.
Following a wide-spread advertising campaign conductedby certain law firms beginning in 2010, a number of productliability lawsuits have been filed against us in variousjurisdictions. The plaintiffs seek damages for personal injury,alleging that certain products within the NexGen Knee Systemsuffer from defects that cause them to loosen prematurely. Themajority of the cases are currently pending in a federalMultidistrict Litigation in the Northern District of Illinois.Other cases are pending in other state and federal courts, andadditional lawsuits may be filed. As of December 31, 2012,discovery in these lawsuits was underway and no trial dateshad been set. We expect initial bellwether trials to commencesometime in mid-to-late 2014. We have not accrued anestimated loss relating to these lawsuits because we believethe plaintiffs’ allegations are not consistent with the record ofclinical success for these products. As a result, we do notbelieve that it is probable that we have incurred a liability, andwe cannot reasonably estimate any loss that might eventuallybe incurred. Although we intend to vigorously defend theselawsuits, their ultimate resolution is uncertain.
Intellectual Property-Related Claims
We are involved in certain ongoing contractual and otherdisputes pertaining to certain royalty arrangements. We intendto defend ourselves vigorously against these claims. Thesematters are in varying stages of dispute resolution processes.In the twelve month period ended December 31, 2012, weaccrued losses related to one of these matters. With respect tothe other matters, we cannot reasonably estimate the possibleloss, if any, we may incur. An adverse result in any of thesematters could have an adverse effect on our results ofoperations in any particular period.
On December 10, 2010, Stryker Corporation and relatedentities (Stryker) filed suit against us in the U.S. District Courtfor the Western District of Michigan, alleging that certain ofour Pulsavac Plus wound debridement products infringe threeU.S. patents assigned to Stryker. The case was tried beginningon January 15, 2013, and on February 5, 2013, the jury foundthat we infringed certain claims of the subject patents. Thejury awarded $70.0 million in monetary damages for lostprofits. The jury also found that we willfully infringed thesubject patents. Final judgment has not yet been entered. Weintend to file a number of post-trial motions challenging theverdict. Following the trial court’s rulings on these post-trialmotions and entry of final judgment, we intend to timelyappeal the unfavorable verdict. We have not accrued anestimated loss related to this matter in our consolidated
63

ZIMMER HOLDINGS, INC. 2012 FORM 10-K ANNUAL REPORT
Notes to Consolidated Financial Statements (Continued)
statement of earnings for the year ended December 31, 2012,because we do not believe that it is probable that we haveincurred a liability. Although we believe we have stronggrounds to reverse the jury’s verdict, the ultimate resolution ofthis matter is uncertain. In the future we could be required torecord a charge of up to $70.0 million that could have amaterial adverse effect on our results of operations in anyparticular period.
Putative Class Action Closure
On November 20, 2008, a complaint was filed in theU.S. District Court for the Northern District of Indiana,Dewald v. Zimmer Holdings, Inc., et al., naming us and certainof our current and former directors and employees asdefendants. The complaint related to a putative class action onbehalf of all persons who were participants in or beneficiariesof our U.S. or Puerto Rico Savings and Investment Programs(plans) between October 5, 2007 and the date of filing andwhose accounts included investments in our common stock.The complaint alleged, among other things, that thedefendants breached their fiduciary duties in violation of theEmployee Retirement Income Security Act of 1974, asamended, by continuing to offer Zimmer stock as aninvestment option in the plans when the stock purportedly wasno longer a prudent investment and that defendants failed toprovide plan participants with complete and accurateinformation sufficient to advise them of the risks of investingtheir retirement savings in Zimmer stock. The plaintiff soughtan unspecified monetary payment to the plans, injunctive andequitable relief, attorneys’ fees, costs and other relief. OnJanuary 23, 2009, the plaintiff filed an amended complaint thatalleged the same claims and clarified that the class period wasOctober 5, 2007 through September 2, 2008. The defendantsfiled a motion to dismiss the amended complaint on March 23,2009. On June 12, 2009, the U.S. Judicial Panel on MultidistrictLitigation entered an order transferring the Dewald case to theU.S. District Court for the Southern District of Indiana. OnDecember 23, 2011, the Court granted the defendants’ motionto dismiss the amended complaint. On January 20, 2012, theplaintiff filed a motion for leave to file a second amendedcomplaint. On November 16, 2012, the Court denied theplaintiff’s motion for leave to amend the amended complaintand dismissed the case with prejudice. The plaintiff’s deadlineto challenge the Court’s decision has passed. The case is nowclosed and we will not be reporting the status of this matter inthe future.
Government Investigation Closure
In September 2007, the Staff of the U.S. Securities andExchange Commission (SEC) informed us that it wasconducting an investigation regarding potential violations ofthe Foreign Corrupt Practices Act (FCPA) in the sale ofmedical devices in a number of foreign countries by companiesin the medical device industry. In November 2007, we received
a letter from the U.S. Department of Justice (DOJ) requestingthat any information provided to the SEC also be provided tothe DOJ on a voluntary basis. In the first quarter of 2011, wereceived a subpoena from the SEC seeking documents andother records pertaining to our business activities insubstantially all countries in the Asia Pacific region where weoperate. We produced documents responsive to the subpoenaand reported to the government concerning the results of ourown reviews regarding FCPA compliance. During a meeting inDecember 2012, representatives from the agencies informed usthat the SEC and the DOJ planned to close their investigationwithout pursuing any enforcement action against us. The DOJand SEC formally notified us through letters of declinationdated December 19, 2012 and February 1, 2013, respectively,that the agencies have closed their inquiries into this matter.While we are pleased with the government’s declinationdecision in this matter, we are committed to continuing toenhance our global anti-corruption compliance program.
Regulatory Matter
In September 2012, we received a warning letter from theU.S. Food and Drug Administration (FDA) citing concernsrelating to certain manufacturing and validation processespertaining to Trilogy® Acetabular System productsmanufactured at our Ponce, Puerto Rico manufacturingfacility. We have provided detailed responses to the FDA as toour corrective actions and will continue to work expeditiouslyto address the issues identified by the FDA. Until the violationsare corrected, we may be subject to additional regulatoryaction by the FDA, including seizure, injunction and/or civilmonetary penalties. Additionally, requests for Certificates toForeign Governments related to products manufactured at thePonce facility may not be granted and premarket approvalapplications for Class III devices to which the Quality Systemregulation deviations are reasonably related will not beapproved until the violations have been corrected.
64

ZIMMER HOLDINGS, INC. 2012 FORM 10-K ANNUAL REPORT
Notes to Consolidated Financial Statements (Continued)
20. QUARTERLY FINANCIAL INFORMATION (UNAUDITED)
(in millions, except per share data)
2012 Quarter Ended 2011 Quarter Ended
Mar Jun Sep Dec Mar Jun Sep Dec
Net sales $1,140.7 $1,125.0 $1,025.5 $1,180.5 $1,115.6 $1,137.4 $1,031.5 $1,167.3
Gross profit 852.0 843.1 769.8 881.6 836.6 849.5 779.6 864.1
Net earnings of Zimmer Holdings, Inc. 209.6 214.5 178.1 152.8 208.9 203.8 191.5 156.6
Earnings per common share
Basic 1.18 1.22 1.02 0.88 1.08 1.06 1.02 0.88
Diluted 1.17 1.22 1.02 0.88 1.08 1.06 1.01 0.87
The quarter ending December 31, 2012 includes a $96.0 million goodwill impairment charge.
65
ZIMMER HOLDINGS, INC. 2012 FORM 10-K ANNUAL REPORT
ITEM 9. Changes in and Disagreements With Accountants on Accounting and Financial Disclosure
None
ITEM 9A. Controls and Procedures
We maintain disclosure controls and procedures (asdefined in Rule 13a-15(e) under the Exchange Act) that aredesigned to provide reasonable assurance that informationrequired to be disclosed in the reports that we file or submitunder the Exchange Act is recorded, processed, summarizedand reported within the time periods specified in the SEC’srules and forms, and that such information is accumulated andcommunicated to our management, including our ChiefExecutive Officer and Chief Financial Officer, as appropriateto allow timely decisions regarding required disclosures.Because of inherent limitations, disclosure controls andprocedures, no matter how well designed and operated, canprovide only reasonable, and not absolute, assurance that theobjectives of disclosure controls and procedures are met.
Our management, with the participation of our ChiefExecutive Officer and Chief Financial Officer, evaluated theeffectiveness of the design and operation of our disclosurecontrols and procedures. Based on that evaluation, our ChiefExecutive Officer and Chief Financial Officer concluded that,as of the end of the period covered by this report, ourdisclosure controls and procedures are effective at areasonable assurance level.
During 2012, we continued transitioning work to a third-party service provider to outsource certain finance functionsthat historically have been performed in multiple countriesthroughout Europe and in the U.S. We also continued
centralizing other finance functions that historically have beenperformed in a decentralized manner. This outsourcing andcentralization are part of our ongoing operational excellenceinitiatives, and we plan to finalize transitioning work to theservice provider and the centralized finance departmentsduring 2013.
Also in 2012, we implemented and tested new software toconsolidate our worldwide financial information. We will startto use this software for our consolidated financial statementsstarting in the first quarter of 2013. This softwareimplementation is part of our operational excellence initiativesin order to improve the overall efficiency and effectiveness ofour financial reporting process.
In connection with the outsourcing, centralization offinance functions, and software implementation and theresulting business process changes, we continue to enhancethe design and documentation of our internal controlprocesses to ensure suitable controls over our financialreporting. There were no other changes in our internal controlover financial reporting (as defined in Rule 13a-15(f) of theExchange Act) that occurred during the quarter endedDecember 31, 2012 that have materially affected, or arereasonably likely to materially affect, our internal control overfinancial reporting. Management’s report on internal controlover financial reporting appears in this report at theconclusion of Part II, Item 7A.
ITEM 9B. Other Information
During the fourth quarter of 2012, the Audit Committee ofour Board of Directors approved the engagement ofPricewaterhouseCoopers LLP, our independent registeredpublic accounting firm, to perform certain non-audit servicesrelated to certain tax matters. This disclosure is madepursuant to Section 10A(i)(2) of the Exchange Act.
66
ZIMMER HOLDINGS, INC. 2012 FORM 10-K ANNUAL REPORT
PART III
ITEM 10. Directors, Executive Officers and Corporate Governance
Information required by this item regarding our Directors is incorporated by reference from the section entitled “ProposalNo. 1: Election of Directors” in our definitive Proxy Statement for the annual meeting of stockholders to be held on May 7, 2013(the “2013 Proxy Statement”). Information about our Audit Committee is incorporated by reference from the section entitled“Committees of the Board” in our 2013 Proxy Statement. Information regarding the procedures by which stockholders mayrecommend nominees to the Board of Directors is incorporated by reference from the section entitled “Corporate Governance –Nominations for Directors” in our 2013 Proxy Statement. Information regarding our executive officers is set forth in Item 1 of Part Iof this report under the caption “Executive Officers.” Information about compliance with Section 16(a) of the Exchange Act isincorporated by reference from the section entitled “Section 16(a) Beneficial Ownership Reporting Compliance” in our 2013 ProxyStatement.
We have adopted the Zimmer Code of Ethics for Chief Executive Officer and Senior Financial Officers (the “finance code ofethics”), a code of ethics that applies to our Chief Executive Officer, Chief Financial Officer, Chief Accounting Officer andCorporate Controller, and other finance organization senior employees. The finance code of ethics is publicly available in theInvestor Relations section of our website, which may be accessed from our homepage at www.zimmer.com or directly at http://investor.zimmer.com. If we make any substantive amendments to the finance code of ethics or grant any waiver, including anyimplicit waiver, from a provision of the code to our Chief Executive Officer, Chief Financial Officer, or Chief Accounting Officer andCorporate Controller, we will disclose the nature of that amendment in the Investor Relations section of our website.
ITEM 11. Executive Compensation
Information required by this item is incorporated by reference from the sections entitled “Committees of the Board”,“Compensation of Directors” and “Executive Compensation” in our 2013 Proxy Statement.
ITEM 12. Security Ownership of Certain Beneficial Owners and Management and Related Stockholder Matters
Information required by this item is incorporated by reference from the sections entitled “Security Ownership of CertainBeneficial Owners,” “Security Ownership of Directors and Executive Officers” and “Equity Compensation Plan Information” in our2013 Proxy Statement.
ITEM 13. Certain Relationships and Related Transactions and Director Independence
Information required by this item is incorporated by reference from the sections entitled “Corporate Governance – CertainRelationships and Related Person Transactions” and “Corporate Governance – Director Independence” in our 2013 ProxyStatement.
ITEM 14. Principal Accounting Fees and Services
Information required by this item is incorporated by reference from the sections entitled “Audit and Non-Audit Fees” and“Audit Committee Pre-Approval of Services of Independent Registered Public Accounting Firm” in “Proposal No. 3” of our 2013Proxy Statement.
67

ZIMMER HOLDINGS, INC. 2012 FORM 10-K ANNUAL REPORT
PART IV
ITEM 15. Exhibits, Financial Statement Schedules
(a) 1. Financial Statements
The following consolidated financial statements of Zimmer Holdings, Inc. and its subsidiaries are set forth in Part II,Item 8.
Report of Independent Registered Public Accounting Firm
Consolidated Statements of Earnings for the Years Ended December 31, 2012, 2011 and 2010
Consolidated Statements of Comprehensive Income for the Years Ended December 31, 2012, 2011 and 2010
Consolidated Balance Sheets as of December 31, 2012 and 2011
Consolidated Statements of Stockholders’ Equity for the Years Ended December 31, 2012, 2011 and 2010
Consolidated Statements of Cash Flows for the Years Ended December 31, 2012, 2011 and 2010
Notes to Consolidated Financial Statements
2. Financial Statement Schedules
Schedule II. Valuation and Qualifying Accounts
Other financial statement schedules are omitted because they are not applicable or the required information is shown inthe financial statements or the notes thereto.
3. Exhibits
A list of exhibits required to be filed as part of this report is set forth in the Index to Exhibits, which immediately precedessuch exhibits and is incorporated herein by reference.
68

ZIMMER HOLDINGS, INC. 2012 FORM 10-K ANNUAL REPORT
Signatures
Pursuant to the requirements of Section 13 or 15(d) of the Securities Exchange Act of 1934, the registrant has duly caused thisreport to be signed on its behalf by the undersigned, thereunto duly authorized.
ZIMMER HOLDINGS, INC.
By: /S/ DAVID C. DVORAK
David C. DvorakPresident and Chief Executive Officer
Dated: February 27, 2013
Pursuant to the requirements of the Securities Exchange Act of 1934, this report has been signed below by the following persons onbehalf of the registrant and in the capacities and on the dates indicated.
Signature Title Date
/s/ DAVID C. DVORAK
David C. Dvorak
President, Chief Executive Officer and Director (PrincipalExecutive Officer)
February 27, 2013
/s/ JAMES T. CRINES
James T. Crines
Executive Vice President, Finance and Chief Financial Officer(Principal Financial Officer)
February 27, 2013
/s/ DEREK M. DAVIS
Derek M. Davis
Vice President, Finance, and Corporate Controller and ChiefAccounting Officer (Principal Accounting Officer)
February 27, 2013
/s/ CHRISTOPHER B. BEGLEY
Christopher B. Begley
Director February 27, 2013
/s/ BETSY J. BERNARD
Betsy J. Bernard
Director February 27, 2013
/s/ GAIL K. BOUDREAUX
Gail K. Boudreaux
Director February 27, 2013
/s/ MARC N. CASPER
Marc N. Casper
Director February 27, 2013
/s/ LARRY C. GLASSCOCK
Larry C. Glasscock
Director February 27, 2013
/s/ ROBERT A. HAGEMANN
Robert A. Hagemann
Director February 27, 2013
/s/ ARTHUR J. HIGGINS
Arthur J. Higgins
Director February 27, 2013
/s/ JOHN L. MCGOLDRICK
John L. McGoldrick
Director February 27, 2013
/s/ CECIL B. PICKETT, PH.D.
Cecil B. Pickett, Ph.D.
Director February 27, 2013
69

ZIMMER HOLDINGS, INC. 2012 FORM 10-K ANNUAL REPORT
Index to Exhibits
Exhibit No Description
3.1 Restated Certificate of Incorporation of Zimmer Holdings, Inc. dated May 13, 2008 (incorporated by reference toExhibit 3.1 to the Registrant’s Quarterly Report on Form 10-Q filed August 5, 2008)
3.2 Restated By-Laws of Zimmer Holdings, Inc. effective May 8, 2012 (incorporated by reference to Exhibit 3.1 to theRegistrant’s Current Report on Form 8-K filed May 14, 2012)
4.1 Specimen Common Stock certificate (incorporated by reference to Exhibit 4.1 to the Registrant’s Quarterly Report onForm 10-Q filed November 6, 2012)
4.2 Indenture dated as of November 17, 2009 between Zimmer Holdings, Inc. and WellsFargo Bank, National Association, as Trustee (incorporated by reference to the form filed as Exhibit 4.8 to theRegistrant’s Registration Statement on Form S-3 filed November 12, 2009)
4.3 First Supplemental Indenture to the Indenture dated as of November 17, 2009 betweenZimmer Holdings, Inc. and Wells Fargo Bank, National Association, as Trustee (incorporated by reference to Exhibit4.2 to the Registrant’s Current Report on Form 8-K filed November 17, 2009)
4.4 Form of 4.625% Note due 2019 (incorporated by reference to Exhibit 4.3 above)
4.5 Form of 5.750% Note due 2039 (incorporated by reference to Exhibit 4.3 above)
4.6 Second Supplemental Indenture dated as of November 10, 2011, to the Indenture dated as of November 17, 2009between Zimmer Holdings, Inc. and Wells Fargo Bank, National Association, as Trustee (incorporated by reference toExhibit 4.1 to the Registrant’s Current Report on Form 8-K filed November 10, 2011)
4.7 Form of 1.400% Note due 2014 (incorporated by reference to Exhibit 4.6 above)
4.8 Form of 3.375% Note due 2021 (incorporated by reference to Exhibit 4.6 above)
10.1* Zimmer Holdings, Inc. 2001 Stock Incentive Plan (incorporated by reference to Appendix B to the Registrant’sdefinitive Proxy Statement on Schedule 14A filed March 24, 2003)
10.2* First Amendment to the Zimmer Holdings, Inc. 2001 Stock Incentive Plan (incorporated by reference to Exhibit 10.1to the Registrant’s Current Report on Form 8-K filed December 15, 2005)
10.3* Zimmer Holdings, Inc. 2006 Stock Incentive Plan, as amended (incorporated by reference to Exhibit 10.1 to theRegistrant’s Current Report on Form 8-K filed December 13, 2006)
10.4* Zimmer Holdings, Inc. Executive Performance Incentive Plan, as amended (incorporated by reference to Appendix Bto the Registrant’s definitive Proxy Statement on Schedule 14A filed March 20, 2008)
10.5* Restated Zimmer, Inc. Long-Term Disability Income Plan for Highly Compensated Employees (incorporated byreference to Exhibit 10.9 to the Registrant’s Annual Report on Form 10-K filed February 28, 2007)
10.6* Change in Control Severance Agreement with David C. Dvorak (incorporated by reference to Exhibit 10.10 to theRegistrant’s Annual Report on Form 10-K filed February 27, 2009)
10.7* Form of Change in Control Severance Agreement with Bruno A. Melzi (incorporated by reference to Exhibit 10.3 tothe Registrant’s Quarterly Report on Form 10-Q filed May 8, 2002)
10.8* Form of Change in Control Severance Agreement with James T. Crines (incorporated by reference to Exhibit 10.12 tothe Registrant’s Annual Report on Form 10-K filed February 27, 2009)
10.9* Form of Change in Control Severance Agreement with Jeffery A. McCaulley and Chad F. Phipps (incorporated byreference to Exhibit 10.13 to the Registrant’s Annual Report on Form 10-K filed February 27, 2009)
10.10* Form of Change in Control Severance Agreement with Jeffrey B. Paulsen and Joseph A. Cucolo (incorporated byreference to Exhibit 10.1 to the Registrant’s Quarterly Report on Form 10-Q filed May 5, 2010)
10.11* Change in Control Severance Agreement with Stephen Hong Liang, Ooi (incorporated by reference to Exhibit 10.21 tothe Registrant’s Annual Report on Form 10-K filed March 12, 2003)
10.12* Change in Control Severance Agreement with Derek M. Davis (incorporated by reference to Exhibit 10.14 to theRegistrant’s Annual Report on Form 10-K filed February 27, 2009)
10.13* Restated Benefit Equalization Plan of Zimmer Holdings, Inc. and Its Subsidiary or Affiliated Corporations Participatingin the Zimmer Holdings, Inc. Savings and Investment Program (incorporated by reference to Exhibit 10.16 to theRegistrant’s Annual Report on Form 10-K filed February 27, 2009)
10.14* Restated Benefit Equalization Plan of Zimmer Holdings, Inc. and Its Subsidiary or Affiliated Corporations Participatingin the Zimmer Holdings, Inc. Retirement Income Plan or the Zimmer Puerto Rico Retirement Income Plan(incorporated by reference to Exhibit 10.17 to the Registrant’s Annual Report on Form 10-K filed February 27, 2009)
70

ZIMMER HOLDINGS, INC. 2012 FORM 10-K ANNUAL REPORT
Exhibit No Description
10.15* Form of Confidentiality, Non-Competition and Non-Solicitation Agreement with U.S.-Based Executive Officers(incorporated by reference to Exhibit 10.2 to the Registrant’s Quarterly Report on Form 10-Q filed November 6, 2012)
10.16* Non-Disclosure, Non-Competition and Non-Solicitation Employment Agreement with Stephen Hong Liang, Ooi(incorporated by reference to Exhibit 10.2 to the Registrant’s Current Report on Form 8-K filed March 27, 2006)
10.17* Confidentiality, Non-Competition and Non-Solicitation Agreement with Bruno A. Melzi (incorporated by reference toExhibit 10.3 to the Registrant’s Current Report on Form 8-K filed March 27, 2006)
10.18* Agreement by and between Bruno A. Melzi, Zimmer S.r.l. and Zimmer, Inc. dated December 12, 2012
10.19* Agreement by Private Deed between Zimmer S.r.l. and Bruno A. Melzi dated December 12, 2012
10.20* Form of Nonqualified Stock Option Award Letter under the Zimmer Holdings, Inc. 2001 Stock Incentive Plan(incorporated by reference to Exhibit 10.3 to the Registrant’s Current Report on Form 8-K filed January 11, 2006)
10.21* Form of Nonqualified Performance-Conditioned Stock Option Grant Award Letter under the Zimmer Holdings, Inc.2001 Stock Incentive Plan (incorporated by reference to Exhibit 10.1 to the Registrant’s Current Report on Form 8-Kfiled January 21, 2005)
10.22* Zimmer Holdings, Inc. Stock Plan for Non-Employee Directors, as amended (incorporated by reference to Appendix Cto the Registrant’s Definitive Proxy Statement filed March 20, 2009)
10.23* Form of Nonqualified Stock Option Award Letter under the Zimmer Holdings, Inc. Stock Plan for Non-EmployeeDirectors (incorporated by reference to Exhibit 10.2 to the Registrant’s Current Report on Form 8-K filed April 5,2005)
10.24* Form of Restricted Stock Unit Award Letter under the Zimmer Holdings, Inc. Stock Plan for Non-Employee Directors(incorporated by reference to Exhibit 10.1 to the Registrant’s Current Report on Form 8-K filed February 21, 2006)
10.25* Form of Nonqualified Stock Option Award Letter under the Zimmer Holdings, Inc. 2006 Stock Incentive Plan(incorporated by reference to Exhibit 10.2 to the Registrant’s Current Report on Form 8-K filed December 13, 2006)
10.26* Form of Nonqualified Stock Option Award Letter for Non-U.S. Employees under the Zimmer Holdings, Inc. 2006 StockIncentive Plan (incorporated by reference to Exhibit 10.3 to the Registrant’s Current Report on Form 8-K filedDecember 13, 2006)
10.27* Form of Restricted Stock Award Letter under the Zimmer Holdings, Inc. 2006 Stock Incentive Plan (five-year vesting)(incorporated by reference to Exhibit 10.4 to the Registrant’s Current Report on Form 8-K filed December 13, 2006)
10.28* Form of Performance-Based Restricted Stock Unit Award Letter under the Zimmer Holdings, Inc. 2006 StockIncentive Plan (incorporated by reference to Exhibit 10.1 to the Registrant’s Current Report on Form 8-K filedFebruary 17, 2009)
10.29* Restated Zimmer Holdings, Inc. Deferred Compensation Plan for Non-Employee Directors (incorporated by referenceto Appendix D to the Registrant’s Definitive Proxy Statement filed March 20, 2009)
10.30* Zimmer Holdings, Inc. 2009 Stock Incentive Plan (incorporated by reference to Appendix B to the Registrant’sDefinitive Proxy Statement filed March 20, 2009)
10.31* Form of Nonqualified Stock Option Award Letter under the Zimmer Holdings, Inc. 2009 Stock Incentive Plan(incorporated by reference to Exhibit 10.1 to the Registrant’s Quarterly Report on Form 10-Q filed May 5, 2011)
10.32* Form of Nonqualified Stock Option Award Letter for Non-U.S. Employees under the Zimmer Holdings, Inc. 2009 StockIncentive Plan (incorporated by reference to Exhibit 10.2 to the Registrant’s Quarterly Report on Form 10-Q filedMay 5, 2011)
10.33* Form of Performance-Based Restricted Stock Unit Award Letter (one-year performance period) under the ZimmerHoldings, Inc. 2009 Stock Incentive Plan (incorporated by reference to Exhibit 10.3 to the Registrant’s QuarterlyReport on Form 10-Q filed May 5, 2011)
10.34* Form of Performance-Based Restricted Stock Unit Award Letter for Non-U.S. Employees (one-year performanceperiod) under the Zimmer Holdings, Inc. 2009 Stock Incentive Plan (incorporated by reference to Exhibit 10.4 to theRegistrant’s Quarterly Report on Form 10-Q filed May 5, 2011)
10.35* Form of Restricted Stock Unit Award Letter (five-year vesting) under the Zimmer Holdings, Inc. 2009 Stock IncentivePlan (incorporated by reference to Exhibit 10.32 to the Registrant’s Annual Report on Form 10-K filed February 25,2010)
71

ZIMMER HOLDINGS, INC. 2012 FORM 10-K ANNUAL REPORT
Exhibit No Description
10.36* Form of Performance-Based Restricted Stock Unit Award Letter (three-year performance period) under the ZimmerHoldings, Inc. 2009 Stock Incentive Plan (incorporated by reference to Exhibit 10.34 to the Registrant’s AnnualReport on Form 10-K filed February 27, 2012)
10.37* Form of Indemnification Agreement with Non-Employee Directors and Officers (incorporated by reference to Exhibit10.1 to the Registrant’s Current Report on Form 8-K filed July 31, 2008)
10.38 $1,350,000,000 Credit Agreement dated as of May 9, 2012 (incorporated by reference to Exhibit 10.1 to theRegistrant’s Current Report on Form 8-K filed May 15, 2012)
10.39 Term Loan Agreement ¥11,700,000,000 dated as of May 24, 2012 (incorporated by reference to Exhibit 10.1 to theRegistrant’s Current Report on Form 8-K filed May 31, 2012)
10.40 Letter of Guarantee dated as of May 24, 2012 (incorporated by reference to Exhibit 10.2 to the Registrant’s CurrentReport on Form 8-K filed May 31, 2012)
21 List of Subsidiaries of Zimmer Holdings, Inc.
23 Consent of PricewaterhouseCoopers LLP
31.1 Certification pursuant to Rule 13a-14(a)/15d-14(a) of the Securities Exchange Act of 1934 of the Chief ExecutiveOfficer, as adopted pursuant to Section 302 of the Sarbanes-Oxley Act of 2002
31.2 Certification pursuant to Rule 13a-14(a)/15d-14(a) of the Securities Exchange Act of 1934 of the Chief FinancialOfficer, as adopted pursuant to Section 302 of the Sarbanes-Oxley Act of 2002
32 Certification pursuant to 18 U.S.C. Section 1350, as adopted pursuant to Section 906 of the Sarbanes-Oxley Act of2002
101.INS XBRL Instance Document
101.SCH XBRL Taxonomy Extension Schema Document
101.CAL XBRL Taxonomy Extension Calculation Linkbase Document
101.LAB XBRL Taxonomy Extension Label Linkbase Document
101.PRE XBRL Taxonomy Extension Presentation Linkbase Document
101.DEF XBRL Taxonomy Extension Definition Linkbase Document
* Management contract or compensatory plan or arrangement
Schedule II
Valuation and Qualifying Accounts
(in millions)
Description
Balance at
Beginning
of Period
Additions
Charged
(Credited)
to Expense
Deductions
to Reserve
Effects of
Foreign
Currency
Acquired
Allowances
Balance at
End of
Period
Allowance for Doubtful Accounts:
Year Ended December 31, 2010 18.8 (1.0) (3.1) (0.6) 0.3 14.4
Year Ended December 31, 2011 14.4 4.5 (1.7) – – 17.2
Year Ended December 31, 2012 17.2 7.1 (1.8) – 0.3 22.8
72

ZIMMER HOLDINGS, INC. 2012 FORM 10-K ANNUAL REPORT
Exhibit 31.1
Certification Pursuant to Rule 13a-14(a)/15d-14(a) of the Securities Exchange Act
of 1934, as Adopted Pursuant to Section 302 of the Sarbanes-Oxley Act of 2002
I, David C. Dvorak, certify that:
1. I have reviewed this Annual Report on Form 10-K of Zimmer Holdings, Inc.;
2. Based on my knowledge, this report does not contain any untrue statement of a material fact or omit to state a material factnecessary to make the statements made, in light of the circumstances under which such statements were made, not misleadingwith respect to the period covered by this report;
3. Based on my knowledge, the financial statements, and other financial information included in this report, fairly present in allmaterial respects the financial condition, results of operations and cash flows of the registrant as of, and for, the periodspresented in this report;
4. The registrant’s other certifying officer and I are responsible for establishing and maintaining disclosure controls andprocedures (as defined in Exchange Act Rules 13a-15(e) and 15d-15(e)) and internal control over financial reporting (asdefined in Exchange Act Rules 13a-15(f) and 15d-15(f)) for the registrant and have:
a. Designed such disclosure controls and procedures, or caused such disclosure controls and procedures to be designedunder our supervision, to ensure that material information relating to the registrant, including its consolidatedsubsidiaries, is made known to us by others within those entities, particularly during the period in which this report isbeing prepared;
b. Designed such internal control over financial reporting, or caused such internal control over financial reporting to bedesigned under our supervision, to provide reasonable assurance regarding the reliability of financial reporting and thepreparation of financial statements for external purposes in accordance with generally accepted accounting principles;
c. Evaluated the effectiveness of the registrant’s disclosure controls and procedures and presented in this report ourconclusions about the effectiveness of the disclosure controls and procedures, as of the end of the period covered by thisreport based on such evaluation; and
d. Disclosed in this report any change in the registrant’s internal control over financial reporting that occurred during theregistrant’s most recent fiscal quarter (the registrant’s fourth fiscal quarter in the case of an annual report) that hasmaterially affected, or is reasonably likely to materially affect, the registrant’s internal control over financial reporting; and
5. The registrant’s other certifying officer and I have disclosed, based on our most recent evaluation of internal control overfinancial reporting, to the registrant’s auditors and the audit committee of registrant’s board of directors:
a. All significant deficiencies and material weaknesses in the design or operation of internal control over financial reportingwhich are reasonably likely to adversely affect the registrant’s ability to record, process, summarize and report financialinformation; and
b. Any fraud, whether or not material, that involves management or other employees who have a significant role in theregistrant’s internal control over financial reporting.
Date: February 27, 2013
David C. DvorakPresident and Chief Executive Officer
73

ZIMMER HOLDINGS, INC. 2012 FORM 10-K ANNUAL REPORT
Exhibit 31.2
Certification Pursuant to Rule 13a-14(a)/15d-14(a) of the Securities Exchange Act
of 1934, as Adopted Pursuant to Section 302 of the Sarbanes-Oxley Act of 2002
I, James T. Crines, certify that:
1. I have reviewed this Annual Report on Form 10-K of Zimmer Holdings, Inc.;
2. Based on my knowledge, this report does not contain any untrue statement of a material fact or omit to state a material factnecessary to make the statements made, in light of the circumstances under which such statements were made, not misleadingwith respect to the period covered by this report;
3. Based on my knowledge, the financial statements, and other financial information included in this report, fairly present in allmaterial respects the financial condition, results of operations and cash flows of the registrant as of, and for, the periodspresented in this report;
4. The registrant’s other certifying officer and I are responsible for establishing and maintaining disclosure controls andprocedures (as defined in Exchange Act Rules 13a-15(e) and 15d-15(e)) and internal control over financial reporting (asdefined in Exchange Act Rules 13a-15(f) and 15d-15(f)) for the registrant and have:
a. Designed such disclosure controls and procedures, or caused such disclosure controls and procedures to be designedunder our supervision, to ensure that material information relating to the registrant, including its consolidatedsubsidiaries, is made known to us by others within those entities, particularly during the period in which this report isbeing prepared;
b. Designed such internal control over financial reporting, or caused such internal control over financial reporting to bedesigned under our supervision, to provide reasonable assurance regarding the reliability of financial reporting and thepreparation of financial statements for external purposes in accordance with generally accepted accounting principles;
c. Evaluated the effectiveness of the registrant’s disclosure controls and procedures and presented in this report ourconclusions about the effectiveness of the disclosure controls and procedures, as of the end of the period covered by thisreport based on such evaluation; and
d. Disclosed in this report any change in the registrant’s internal control over financial reporting that occurred during theregistrant’s most recent fiscal quarter (the registrant’s fourth fiscal quarter in the case of an annual report) that hasmaterially affected, or is reasonably likely to materially affect, the registrant’s internal control over financial reporting; and
5. The registrant’s other certifying officer and I have disclosed, based on our most recent evaluation of internal control overfinancial reporting, to the registrant’s auditors and the audit committee of registrant’s board of directors:
a. All significant deficiencies and material weaknesses in the design or operation of internal control over financial reportingwhich are reasonably likely to adversely affect the registrant’s ability to record, process, summarize and report financialinformation; and
b. Any fraud, whether or not material, that involves management or other employees who have a significant role in theregistrant’s internal control over financial reporting.
Date: February 27, 2013
James T. CrinesExecutive Vice President, Finance and
Chief Financial Officer
74

ZIMMER HOLDINGS, INC. 2012 FORM 10-K ANNUAL REPORT
Exhibit 32
Certification Pursuant to 18 U.S.C. Section 1350, as Adopted
Pursuant to Section 906 of the Sarbanes-Oxley Act of 2002
In connection with the Annual Report of Zimmer Holdings, Inc. (the “Company”) on Form 10-K for the period ending December 31,2012 as filed with the Securities and Exchange Commission on the date hereof (the “Report”), each of the undersigned certify,pursuant to 18 U.S.C. § 1350, as adopted pursuant to § 906 of the Sarbanes-Oxley Act of 2002, that:
(1) The Report fully complies with the requirements of section 13(a) or 15(d) of the Securities Exchange Act of 1934;and
(2) The information contained in the Report fairly presents, in all material respects, the financial condition and results ofoperations of the Company.
David C. DvorakPresident and Chief Executive Officer
February 27, 2013
James T. CrinesExecutive Vice President, Finance and
Chief Financial Officer
February 27, 2013
75

ZIMMER HOLDINGS, INC. 2012 FORM 10-K ANNUAL REPORT
Reconciliations
Reconciliation of Operating Profit to Adjusted Operating Profit for the Years Ended December 31, 2012, 2011, 2010, 2009 and 2008 (in millions, unaudited)
For the Years Ended December 31,
2012 2011 2010 2009 2008
Operating Profit . . . . . . . . . . . . . . . . . . . . . . . . . . . . . . . . . . . . . . . . . . . . . . . . . . . . $1,047.4 $1,024.1 $ 916.7 $1,018.8 $1,090.0Inventory step-up and other inventory charges . . . . . . . . . . . . . . . . . . . . . . . . . . 4.8 11.4 1.4 12.5 7.0Certain claims . . . . . . . . . . . . . . . . . . . . . . . . . . . . . . . . . . . . . . . . . . . . . . . . . . . . . . 15.0 157.8 75.0 35.0 69.0Goodwill impairment . . . . . . . . . . . . . . . . . . . . . . . . . . . . . . . . . . . . . . . . . . . . . . . . 96.0 — 204.0 73.0 —Special items . . . . . . . . . . . . . . . . . . . . . . . . . . . . . . . . . . . . . . . . . . . . . . . . . . . . . . 155.4 75.2 34.7 75.3 68.5Net curtailment and settlement . . . . . . . . . . . . . . . . . . . . . . . . . . . . . . . . . . . . . . . — — — (32.1) —
Adjusted Operating Profit . . . . . . . . . . . . . . . . . . . . . . . . . . . . . . . . . . . . . . . . . . . . $1,318.6 $1,268.5 $1,231.8 $1,182.5 $1,234.5
Reconciliation of Diluted EPS to Adjusted Diluted EPS for the Years Ended December 31, 2012, 2011, 2010, 2009 and 2008 (unaudited)
For the Years Ended December 31,
2012 2011 2010 2009 2008
Diluted EPS . . . . . . . . . . . . . . . . . . . . . . . . . . . . . . . . . . . . . . . . . . . . . . . . . . . . . . . . . . . . . . . . $ 4.29 $ 4.03 $ 2.97 $ 3.32 $ 3.72Inventory step-up and other inventory charges . . . . . . . . . . . . . . . . . . . . . . . . . . . . . . . . . . 0.03 0.06 0.01 0.06 0.03Certain claims . . . . . . . . . . . . . . . . . . . . . . . . . . . . . . . . . . . . . . . . . . . . . . . . . . . . . . . . . . . . . . 0.09 0.84 0.37 0.16 0.30Goodwill impairment . . . . . . . . . . . . . . . . . . . . . . . . . . . . . . . . . . . . . . . . . . . . . . . . . . . . . . . . 0.54 — 1.01 0.34 —Special items . . . . . . . . . . . . . . . . . . . . . . . . . . . . . . . . . . . . . . . . . . . . . . . . . . . . . . . . . . . . . . . 0.88 0.40 0.17 0.35 0.30Net curtailment and settlement . . . . . . . . . . . . . . . . . . . . . . . . . . . . . . . . . . . . . . . . . . . . . . . — — — (0.15) —Taxes on above items and other certain tax adjustments* . . . . . . . . . . . . . . . . . . . . . . . . . . (0.53) (0.53) (0.20) (0.14) (0.30)
Adjusted Diluted EPS . . . . . . . . . . . . . . . . . . . . . . . . . . . . . . . . . . . . . . . . . . . . . . . . . . . . . . . . $ 5.30 $ 4.80 $ 4.33 $ 3.94 $ 4.05
* The tax effect is calculated based upon the statutory rates for the jurisdictions where the items were incurred.
Reconciliation of Sales Growth Rate to Constant Currency Sales Growth Rate for the Year Ended December 31, 2012 (unaudited)
For the Year Ended December 31, 2012
Reported
% Growth
Foreign
Exchange
Impact
Constant
Currency
% Growth
Geographic Segment
Americas . . . . . . . . . . . . . . . . . . . . . . . . . . . . . . . . . . . . . . . . . . . . . . . . . . . . . . . . . . . . . . . . . . . . . . . . . . . . . . . . . . . . 1% (1)% 2%Europe . . . . . . . . . . . . . . . . . . . . . . . . . . . . . . . . . . . . . . . . . . . . . . . . . . . . . . . . . . . . . . . . . . . . . . . . . . . . . . . . . . . . . . (3) (6) 3Asia Pacific . . . . . . . . . . . . . . . . . . . . . . . . . . . . . . . . . . . . . . . . . . . . . . . . . . . . . . . . . . . . . . . . . . . . . . . . . . . . . . . . . . 3 — 3
Consolidated . . . . . . . . . . . . . . . . . . . . . . . . . . . . . . . . . . . . . . . . . . . . . . . . . . . . . . . . . . . . . . . . . . . . . . . . . . . . . . . — (2) 2Product Category
Reconstructive . . . . . . . . . . . . . . . . . . . . . . . . . . . . . . . . . . . . . . . . . . . . . . . . . . . . . . . . . . . . . . . . . . . . . . . . . . . . . . . — (1) 1Knees . . . . . . . . . . . . . . . . . . . . . . . . . . . . . . . . . . . . . . . . . . . . . . . . . . . . . . . . . . . . . . . . . . . . . . . . . . . . . . . . . . . . . (1) (2) 1Hips . . . . . . . . . . . . . . . . . . . . . . . . . . . . . . . . . . . . . . . . . . . . . . . . . . . . . . . . . . . . . . . . . . . . . . . . . . . . . . . . . . . . . . (1) (2) 1Extremities . . . . . . . . . . . . . . . . . . . . . . . . . . . . . . . . . . . . . . . . . . . . . . . . . . . . . . . . . . . . . . . . . . . . . . . . . . . . . . . . 6 (2) 8
Dental . . . . . . . . . . . . . . . . . . . . . . . . . . . . . . . . . . . . . . . . . . . . . . . . . . . . . . . . . . . . . . . . . . . . . . . . . . . . . . . . . . . . . . (4) (2) (2)Trauma . . . . . . . . . . . . . . . . . . . . . . . . . . . . . . . . . . . . . . . . . . . . . . . . . . . . . . . . . . . . . . . . . . . . . . . . . . . . . . . . . . . . . 8 (1) 9Spine . . . . . . . . . . . . . . . . . . . . . . . . . . . . . . . . . . . . . . . . . . . . . . . . . . . . . . . . . . . . . . . . . . . . . . . . . . . . . . . . . . . . . . . (7) (1) (6)Surgical and Other . . . . . . . . . . . . . . . . . . . . . . . . . . . . . . . . . . . . . . . . . . . . . . . . . . . . . . . . . . . . . . . . . . . . . . . . . . . . 11 (1) 12
Consolidated . . . . . . . . . . . . . . . . . . . . . . . . . . . . . . . . . . . . . . . . . . . . . . . . . . . . . . . . . . . . . . . . . . . . . . . . . . . . . . . — (2) 2
76

Operating ProfitZimmer continued to deliver
exceptional operating profit
margins in 2012, driven by
progress in the Company’s
business transformation programs.
Operating Cash FlowThrough disciplined
management of capital, Zimmer
supported new product
innovation and delivered
increased value to stockholders
while maintaining high levels of
operating cash flow.
Diluted Earnings per ShareProgress in Zimmer’s value creation agenda supported double-digit growth in adjusted earnings per share for 2012.
Net SalesStrong performances from a
number of international
markets and new product
introductions across Zimmer’s
portfolio contributed to net
sales of $4.47 billion in 2012.
(1) “Constant Currency” refers to sales growth resulting from translating current and prior-period sales at the same predetermined foreign currency exchange rate. The translated results are then used to determine year-over-year percentage increases or decreases that exclude the effect of changes in foreign currency exchange rates. See the reconciliation of this non-GAAP financial measure to the most directly comparable GAAP measure on page 76.
(2) “Adjusted” refers to performance measures that exclude inventory step-up and other inventory charges, special items, the provision for certain Durom® Acetabular Component product claims, goodwill impairment, and net curtailment and settlement and related tax benefits and other certain tax adjustments. See the reconciliations of these non-GAAP financial measures to the most directly comparable GAAP measures on page 76.
% Change 2011-2012
ConstantSales b y Geographic Segment 2008 2009 2010 2011 2012 Reported Currency(1)
Americas $2,354 $2,372 $2,432 $2,441 $2,476 1% 2%
Europe 1,179 1,119 1,099 1,214 1,178 -3% 3%
Asia Pacific 588 604 689 797 818 3% 3%
Consolidated $4,121 $4,095 $4,220 $4,452 $4,472 0% 2%
% Change 2011-2012
ConstantSales b y Product Category 2008 2009 2010 2011 2012 Reported Currency(1)
Reconstructive $3,162 $3,120 $3,202 $3,344 $3,331 0% 1%
Knees 1,761 1,756 1,790 1,825 1,815 -1% 1%
Hips 1,280 1,228 1,262 1,356 1,342 -1% 1%
Extremities 121 136 150 163 174 6% 8%
Dental 227 205 219 248 238 -4% -2%
Trauma 222 235 246 286 308 8% 9%
Spine 230 253 234 225 209 -7% -6%
Surgical & Other 280 282 319 349 386 11% 12%
Consolidated $4,121 $4,095 $4,220 $4,452 $4,472 0% 2%
Financial Highlights (Dollars in millions except per-share amounts)
26%
18%
56%
8% 5%7%
5%
41%
30%
4%
11100908
4.05
3.94
3.72
3.32
4.33
2.97
1110090811100908
1,23
5
1,18
3
1,09
0
1,01
9
1,23
291
7
11100908 12 12 12
4.8
04.
03
12
5.3
04.
29
4,12
1
4,0
95
4,2
20
4,4
52
4,4
72 1,
269
1,0
24
1,31
91
,04
7
1,03
8
1,11
8
1,19
4
1,17
7
1,15
2
0% Reported
4% Adjusted(2)
2% Reported
-2% Reported
10% Adjusted(2)
6% Reported
$0
$50
$100
$150
2007 2008 2009 2010 2011 2012
Zimmer Holdings, Inc. $100 $61 $89 $81 $81 $102
S&P 500 Stock Index 100 63 80 92 94 109
S&P 500 Health Care Equipment Index 100 73 93 91 90 105
Corporate Information (As of March 21, 2013)
Board of Directors
John L. Mc Goldrick Chairman of the Board, Zimmer Holdings, Inc. Special Advisor, International AIDS Vaccine Initiative
Christopher B. Begley Retired Executive Chairman and Chief Executive Officer, Hospira, Inc.
Betsy J. Bernard Retired President, AT&T Corp.
Gail K. Boudreaux Chief Executive Officer, UnitedHealthcare Executive Vice President, UnitedHealth Group Marc N. Casper President and Chief Executive Officer, Thermo Fisher Scientific Inc.
David C. Dvorak President and Chief Executive Officer, Zimmer Holdings, Inc.
Larry C. Glasscock Retired Chairman, President and Chief Executive Officer, WellPoint, Inc.
Robert A. Hagemann Senior Vice President and Chief Financial Officer, Quest Diagnostics Incorporated
Arthur J. Higgins Consultant, Blackstone Healthcare Partners
Cecil B. Pickett, Ph.D. Retired President, Research and Development, Biogen Idec Inc.
Management Team
David C. Dvorak President and Chief Executive Officer
James T. Crines Executive Vice President, Finance and Chief Financial Officer
Joseph A. Cucolo President, Americas
Derek M. Davis Vice President, Finance and Corporate Controller and Chief Accounting Officer
Norman D. Finch Jr. Vice President, Associate General Counsel and Chief Compliance Officer
William P. Fisher Senior Vice President, Global Human Resources
Katarzyna Mazur-Hofsaess, M.D., Ph.D. President, Europe, Middle East and Africa Reconstructive
Jeffery A. McCaulley President, Zimmer Reconstructive
Bruno A. Melzi Chairman, Europe, Middle East and Africa
Emmanuel Nyakako Senior Vice President, Global Quality and Regulatory Affairs
Stephen H. L. Ooi President, Asia Pacific
Chad F. Phipps Senior Vice President, General Counsel and Secretary
Richard C. Stair Senior Vice President, Global Operations and Logistics
This annual report is printed on paper that contains 10% post-consumer waste.
Stock Performance Graph Comparison of Cumulative Total Return for years ended December 31
Assumes $100 was invested on December 31, 2007 in Zimmer common stock and each index and dividends were reinvested. Returns over the indicated period should not be considered indicative of future returns.
Stockholder Information
Headquarters Zimmer Holdings, Inc. 345 East Main Street Warsaw, IN 46580, U.S.A. +1-574-267-6131 www.zimmer.com
Stock Listing Zimmer is listed on the New York Stock Exchange and the SIX Swiss Exchange under the symbol ZMH.
Transfer Agent Communications concerning stock transfer requirements, loss of certificates and change of address should be directed to Zimmer’s Transfer Agent:
American Stock Transfer & Trust Company, LLC 6201 15th Avenue Brooklyn, NY 11219 +1-888-552-8493 (domestic) +1-718-921-8124 (international) Email: [email protected] Website: http://www.amstock.com
Investor Relations Zimmer invites stockholders, security analysts, portfolio managers and other interested parties to contact:
Robert J. Marshall Jr. Vice President, Investor Relations and Treasurer +1-574-371-8042 [email protected]
James T. Crines Executive Vice President, Finance and Chief Financial Officer +1-574-372-4264 [email protected]
To obtain a free copy of Zimmer’s annual report on form 10-K, quarterly reports on form 10-Q, news releases, earnings releases, proxy statements, or to obtain Zimmer’s financial calendar, access SEC filings, listen to earnings calls, or to look up Zimmer stock quotes, please visit http://investor.zimmer.com or call +1-866-688-7656.
Independent Auditors PricewaterhouseCoopers LLP Chicago, IL, U.S.A.
Dividend Reinvestment and Stock Purchase Plan
American Stock Transfer & Trust Company, LLC administers the Investors Choice Dividend Reinvestment and Stock Purchase Plan, which allows registered stockholders to purchase additional shares of Zimmer common stock through the automatic investment of dividends. The plan also allows registered stockhold-ers to purchase shares with optional cash investments of at least $25, either by check or by automatic deductions from checking or savings accounts. The maximum optional cash investment is $10,000 per transaction. Please direct inquiries concerning the plan to: Zimmer Holdings, Inc., c/o American Stock Transfer & Trust Company, LLC, P.O. Box 922, Wall Street Station, New York, NY 10269-0560, +1-888-552-8493 (domestic), +1-718-921-8124 (international)

Zimmer Holdings, Inc., 345 East Main Street, P.O. Box 708, Warsaw, IN 46580, U.S.A.
Z IMMER HOLDINGS, INC. annual repor t 2012