zebrafish larvae show negative phototaxis to near …...research article zebrafish larvae show...
TRANSCRIPT
RESEARCH ARTICLE
Zebrafish larvae show negative phototaxis to
near-infrared light
Sarah HartmannID1*, Roland Vogt2, Jan Kunze3, Anna Rauschert1, Klaus-Dieter Kuhnert3,
Josef WanzenbockID2, Dunja K. Lamatsch2, Klaudia Witte1
1 Research Group of Ecology and Behavioural Biology, Institute of Biology, Department of Chemistry-
Biology, University of Siegen, Siegen, Germany, 2 Research Department for Limnology, Mondsee, University
of Innsbruck, Mondsee, Austria, 3 Institute of Real-time Learning Systems, Department of Electrical
Engineering and Computer Science, University of Siegen, Siegen, Germany
Abstract
Zebrafish larvae (Danio rerio) are among the most used model species to test biological
effects of different substances in biomedical research, neuroscience and ecotoxicology.
Most tests are based on changes in swimming activity of zebrafish larvae by using commer-
cially available high-throughput screening systems. These systems record and analyse
behaviour patterns using visible (VIS) and near-infrared (NIR) light sources, to simulate day
(VIS) and night (NIR) phases, which allow continuous recording of the behaviour using a
NIR sensitive camera. So far, however, the sensitivity of zebrafish larvae to NIR has never
been tested experimentally, although being a critical piece of information for interpreting
their behaviour under experimental conditions. Here, we investigated the swimming activity
of 96 hpf (hours post fertilization) and 120 hpf zebrafish larvae under light sources of NIR at
860 nm and at 960 nm wavelength and under VIS light. A thermal source was simulta-
neously presented opposite to one of the light sources as control. We found that zebrafish
larvae of both larval stages showed a clear negative phototactic response towards 860 nm
NIR light and to VIS light, but not to 960 nm NIR light. Our results demonstrated that zebra-
fish larvae are able to perceive NIR at 860 nm, which is almost identical to the most com-
monly used light source in commercial screening systems (NIR at 850 nm) to create a dark
environment. These tests, however, are not performed in the dark from the zebrafish´s point
of view. We recommend testing sensitivity of the used test organism before assuming no
interaction with the applied light source of commonly used biosensor test systems. Previous
studies on biological effects of substances to zebrafish larvae should be interpreted with
caution.
Introduction
Fish in general are sensitive model species and have been frequently used in automated biolog-
ical monitoring systems as biosensors [1]. The analysis of behavioural parameters such as
swimming activity, respiration, shoaling behaviour or rheotactic behaviour are of particular
PLOS ONE | https://doi.org/10.1371/journal.pone.0207264 November 28, 2018 1 / 16
a1111111111
a1111111111
a1111111111
a1111111111
a1111111111
OPEN ACCESS
Citation: Hartmann S, Vogt R, Kunze J, Rauschert
A, Kuhnert K-D, Wanzenbock J, et al. (2018)
Zebrafish larvae show negative phototaxis to near-
infrared light. PLoS ONE 13(11): e0207264. https://
doi.org/10.1371/journal.pone.0207264
Editor: Filippo Del Bene, Institut Curie, FRANCE
Received: February 27, 2018
Accepted: October 29, 2018
Published: November 28, 2018
Copyright: © 2018 Hartmann et al. This is an open
access article distributed under the terms of the
Creative Commons Attribution License, which
permits unrestricted use, distribution, and
reproduction in any medium, provided the original
author and source are credited.
Data Availability Statement: All relevant data are
within the paper and its Supporting Information
files.
Funding: The authors gratefully acknowledged
financial support from the FP7 ERA-NET on
Nanosafety: Safe Implementation of Innovative
Nanoscience and Nanotechnology (SIINN), the
Federal Ministry of Education and Research
(BMBF; 03XP0005A), the University of Siegen and
from the Austrian Research Promotion Agency
(FFG). The funders had no role in study design,
data collection and analysis, decision to publish, or
preparation of the manuscript.

interest [1–3]. Measuring sublethal effects as behavioural endpoints leads to a higher signifi-
cance and, compared to mortality, a 10–100 times higher sensitivity can be achieved [4, 5].
During the last few decades the zebrafish (Danio rerio), a small tropical freshwater fish,
became one of the most used model species in the field of biomedical research, neuroscience
and ecotoxicology [6–11]. Breeding and cultivating this fish species in the lab is cost-effective
and embryo development is very fast [12]. Additionally, the complete genome of the zebrafish
is known [13] and has broad homologies to other vertebrate species [14–16], and genes
involved in behaviour are highly conserved between humans and zebrafish [9]. Thus, monitor-
ing of zebrafish swimming activity serves as a sensitive and powerful tool for identifying toxic
compounds in several fields of research [1, 3]. These behavioural measurements are highly
economical and appropriate for e.g. ecotoxicological research [17]. They are mostly based on
swimming activity of adult zebrafish and zebrafish larvae, which are monitored using video
tracking systems and corresponding software to detect and quantify changes in locomotion
pattern. So far, commercially available high-throughput tracking systems, such as the Danio-
Vision from Noldus (Wageningen, Netherlands) or the Zebrabox from Viewpoint (Lyon,
France) allow tracking of locomotion parameters of zebrafish larvae in multi-well plates. Many
studies use light/dark transition tests to investigate possible effects of several substances (e.g.
ethanol, cadmium, microplastic, neurotoxic drugs) on swimming activity of zebrafish larvae.
The dark sections are lit with NIR light, so that the behaviour can still be recorded with an IR
sensitive camera [3, 6, 16, 18–23]. The Zebrabox system e.g. uses an infrared light illumination
at a wavelength of 850 nm to record the swimming activity under “dark” conditions [24]. So
far, it has been assumed that zebrafish larvae cannot perceive NIR light and do not respond to
it [3, 25, 26]. This assumption was based, first, on the anatomy of the vision system in adult
zebrafish. Adult zebrafish have four different types of photoreceptors with specific visual sensi-
tivity in the red spectrum (~570 nm), in the green spectrum (~480 nm), in the blue spectrum
(~415 nm) and in the ultraviolet spectrum (~362 nm) [26–28]. Secondly, in an optokinetic
experiment, zebrafish larvae showed no eye movement in response to rotating stripes that
were illuminated with 750 nm NIR light [29]. It is known, however, that the visual system can
change during ontogeny in fish [30, 31]. Nevertheless, it is precarious to extrapolate from the
visual sensitivity in adult fish to the visual sensitivity in fish larvae within a species.
Recently, only a few researchers focused on near-infrared (NIR) sensitivity in fish, although
the absorption spectra of light in natural aquatic ecosystems covers wavelengths higher than
700 nm [32, 33]. The sensitivity towards NIR illumination was reported in the common carp
Cyprinus carpio and the Nile tilapia Oreochromis niloticus [34]. Both species showed a visual
sensitivity towards the near infrared light at 865 nm, and a perception of even longer wave-
lengths (936 nm) was indicated in the common carp [34]. Due to the experimental set-up, the
authors concluded that the NIR light was detected by the eyes and not by the pineal organ in
both species, the common carp and the Nile tilapia [34]. In the cichlid Pelvicachromis taeniatusit could be shown that a direct illumination of the prey organism Gammarus pulex with NIR
wavelengths between 780 and 920 nm led to stronger foraging responses compared to non-
illuminated G. pulex [35] which indicates prey-detection through NIR sensitivity. Shcherbakov
et al. (2013) [36] analysed the NIR detection under different light conditions as a parameter
for spectral sensitivity in different fish species: the Mozambique tilapia (Oreochromis mossam-bicus) and the Nile tilapia (O. nilticus) showed a high sensitivity to wavelengths above 930 nm,
and they found an upper threshold for the green swordtail (Xiphophorus helleri) at 825–845
nm. Furthermore, the authors investigated the response of adult zebrafish to NIR light and
determined a threshold at 845–910 nm, as clear evidence for the perception of NIR by adult
zebrafish [36]. The authors explained the sensitivity to NIR as an evolutionary adaptation to
Negative phototaxis in zebrafish larvae
PLOS ONE | https://doi.org/10.1371/journal.pone.0207264 November 28, 2018 2 / 16
Competing interests: The authors have declared
that no competing interests exist.

environmental conditions and suggested long wavelength sensitive cones as a potential candi-
date for NIR perception in fish [36].
Here, we investigated the behavioural reaction of zebrafish larvae at two larval stages, (96
hours post fertilization (hpf) and 120 hpf), to different wavelengths of NIR light (860 nm and
960 nm), to test for a phototactic response according to Jekley (2009) [37]. As Shcherbakov
et al. 2013 [36] found that adult zebrafish are able to sense NIR light up to 910 nm, we hypothe-
sized that zebrafish larvae might perceive a similar NIR light spectrum. We, therefore, con-
ducted three experiments under specific light characteristics: NIR light with a spectral peak at
860 nm and 960 nm, and blue-white light as a visible light source (VIS, 440–700 nm). Our
results showed for the first time that zebrafish larvae at both larval stages showed a clear nega-
tive phototactic response towards NIR light at 860 nm as well as towards VIS light, but not to
NIR light at 960 nm wavelength. Our results are, therefore, highly relevant to all experiments
using zebrafish larvae in standard testing procedures under NIR light conditions because most
experimental devices use 850 nm light sources to simulate a dark environment. These tests,
however, are not carried out in the dark from the zebrafish´s point of view.
Material and methods
Ethics statement
All experiments were non-invasive behavioural tests. The performed experiments were in line
with the German Animal Welfare Act (Deutsches Tierschutzgesetz) and approved by the inter-
nal animal protection commissioner Dr. Urs Gießelmann, University of Siegen, Germany, and
the national Veterinary Authority (Kreisveterinaeramt Siegen-Wittgenstein, Germany).
Study species
We used Danio rerio of a wild-type zebrafish strain from West Aquarium GmbH (Bad Lauter-
berg, Germany). The D. rerio culture was kept in 112 L glass tanks (80 x 40 x 35 cm3) at a con-
stant water temperature of 26 ± 1˚C with a pH-value of 7–7.5 and a conductivity of 450 μS/cm
under a light-dark cycle of 14:10 hours. Water was aerated and filtered continuously and partly
exchanged (40%) once a week. Adult zebrafish were fed daily ad libitum with dry flake food
(JBL GmbH & Co. KG, Germany), and with juvenile Daphnia magna three times a week to
provide a source of environmental enrichment [38]. We placed a spawning tray (16.8 x 25.7 x
6.2 cm3) covered with artificial plants to stimulate egg laying into the home tank in the evening
until the next morning, 2 h after onset of light. Collected eggs were rinsed with distilled water
and placed into a petri dish (18.5 cm in diameter) for egg selection. Fertilized and healthy eggs
were kept in 60 mL crystallisation dishes (60 x 35 mm2) for development until larvae were 96
hpf and 120 hpf and were cultured under the same conditions (water temperature: 26 ± 1˚C;
light-dark cycle 14:10) as adult zebrafish. Fish eggs were checked daily and dead and abnormal
embryos were removed. Only normally developed and hatched larvae were used for testing.
Phototactic experiments and video tracking. Phototactic experiments followed Shcher-
bakov et al. (2012) [39] with some modifications. All experiments were performed in a room
with a constant temperature of 26 ± 1˚C. We used a custom-built, light-isolated chamber
coated with black PVC plates (49 x 90 x 45 cm3), to record movements of the zebrafish larvae
in a petri dish (diameter: 35 mm), which served as the test vessel (Fig 1A), under specific light
conditions for 5 minutes. Movement was recorded with an IR sensitive camera (Manta G-
235C, Allied Vision, Stadtroda, Germany) with a frame rate of 35/s, fixed 35 cm above the test
vessel. The camera was connected to a PC to control, start and manage the experimental set-
tings. We performed three experiments with different light sources to test the sensitivity of the
zebrafish larvae at an age of 96 hpf or of 120 hpf towards two different wavelengths of NIR
Negative phototaxis in zebrafish larvae
PLOS ONE | https://doi.org/10.1371/journal.pone.0207264 November 28, 2018 3 / 16

light and VIS light. In each experiment a light source was provided simultaneously with a ther-
mal source positioned opposite to the light source in 10.5 cm distance from that vessel (Fig 1A
and 1B) to control for a thermal gradient within the test vessel. The thermal source was an 860
nm light source equipped with a 950-IR high-pass filter (IR-filter 950 nm, Delamax, Germany)
that cut off all shorter wavelengths and additionally equipped with a UV-IR-cut filter
(HD2130, Ningbo Haida Photo supplies Co., Ltd., Ningbo China) to cut off wavelengths
between UV and NIR, so that light was entirely blocked (S1 Fig). To test for temperature dif-
ferences, we measured the temperature of each light source 30 times after each 5 min test
period with an IR thermometer at the position of the test vessel in 10.5 cm distance (IRT-350
IR thermometer, Base Tech, Hirschau, Germany). To test for a thermal gradient within the test
vessel we measured the water temperature within the test vessel at five different positions (left
and right side, centre, top and bottom) with a digital thermocouple (digital probe thermometer
POCKET-DIGITEMP, TFA Dostmann GmbH & Co. KG, Wertheim-Reicholzheim, Ger-
many) 5 min after onset of light, thus under same conditions as in trials. Furthermore, we mea-
sured the light intensity as irradiance [μWatt/cm2] and the radiated spectrum of all applied
light sources and of the thermal source covered by used filters, respectively, with an AvaSpec-
2048 spectrometer covering a range of 220–1100 nm (Avantes BV, Apdeldoorn, Netherlands,
Europe) in 2 cm distance to the source.
Fig 1. Scheme of the experimental set-up of the NIR light experiments. (A) The custom-built computer vision system shows the position of the test vessel in the
middle of the set-up, the camera above the test vessel and the position of the light sources. The computer vision system was totally covered so that no light from the
surrounding area could enter the system. (B) A detailed view of the set-up: For each experiment, one larva was placed into the test vessel. The IR sensitive camera was set
35 cm above the vessel, and both light sources were 10.5 cm away from the test vessel. A thermal source opposite to the NIR/VIS light served as a control. We switched
the position of light and thermal sources after each trial to exclude side biases. The vessel was divided into 2 halves with an imaginary line, one half illuminated by the
light source (VIS/NIR), one half radiated by the thermal source (control side) (drawing of zebrafish larva by Kimmel et al. 1996 [12]).
https://doi.org/10.1371/journal.pone.0207264.g001
Negative phototaxis in zebrafish larvae
PLOS ONE | https://doi.org/10.1371/journal.pone.0207264 November 28, 2018 4 / 16
We transferred one larva per trail to a 35 mm petri dish filled with 3 mL formulated water
(294 mg/l CaCl2�2 H2O, 123.3 mg/l MgSO4�7 H2O, 63 mg/l NaHCO3, 5.5 mg/l KCl [40]). The
vessel was placed under the IR sensitive camera (Fig 1B). Since the transfer of larvae was per-
formed in light, we chose an acclimation time for each larva of 5 min within the device in dark-
ness. Thereafter, light sources (VIS/NIR) and the thermal source were switched on and the
swimming activity was recorded for 5 min. It was previously reported that the most stable
activity period in zebrafish larvae ranges between 1:00 and 4:30 pm [19, 41]. Therefore, all
experiments were carried out within this time period.
Phototactic experiments under VIS. In the first experiment, we tested the phototactic
behaviour of zebrafish larvae under blue-white light (blue: LED type: 151053BS04500, Wurth
Eletronic, Waldenburg, Germany, spectral peak at 460 nm; white: LED type: LW340-A, Soeul
Semiconducter Co., Ltd, Ansan, South Korea, spectral peak at 460 nm and 560 nm) which
served as a visible light (VIS) source. A blue-white light source was used because zebrafish are
able to see blue light [26, 27]. In order to ensure that the VIS light source did not reflect shorter
or longer wavelengths, a UV-IR-cut filter (HD2130, Ningbo Haida Photo supplies Co., Ltd.,
Ningbo China) was attached to the device that absorbed ultraviolet and infrared wavelength
(Table 1 and S1 Fig). The measured spectral range of the VIS light source was 420–680 nm,
with a maximum absorption at 460 nm and a light intensity of 2.49 μWatt/cm2 (Table 1 and S1
Fig). Opposite to the VIS light source, we used the same thermal source as described above to
provide thermal radiation only (S1 Fig). In total, we tested 30 larvae of each larval stage and
exposed 15 larvae of each larval stage with VIS light from the right and 15 larvae with VIS light
from the left side to exclude side biases.
Phototactic experiments under NIR 860 nm light condition. In the second experiment,
zebrafish larvae of 96 hpf or 120 hpf were illuminated with a light source with the peak illumi-
nation at 860 nm (LED type (850 nm): HE1-240AC, Harvatek Corp., Hsinchu City, Taiwan).
The light source was covered with an IR filter (IR-filter 850 nm, Delamax, Germany) to elimi-
nate visible light components (below 850 nm) and long wavelengths (above 910 nm), and to
shift the maximum to the requested illumination (Table 1 and S1 Fig). Due to the applied filter,
the measured spectral profile ranged from 830 to 910 nm with a maximum absorption at 860
nm and has a light intensity of 16.09 μWatt/cm2 (Table 1 and S1 Fig). Therefore, we refer this
light source as 860 nm source throughout the text. A thermal source was placed opposite to the
NIR light source (see above) to provide thermal radiation only (S1 Fig). We tested 30 larvae of
each larval stage as described above.
Phototactic experiments under NIR 960 nm light condition. In the third experiment we
used an NIR source with peak emission at 960 nm (LED type (940 nm): HE3-245AC, Harvatek
Corp., Hsinchu City, Taiwan) which was equipped with an high-pass IR-filter at 950 nm (IR
filter 950 nm, Delamax, Germany) to remove those visible light components with shorter
wavelengths and to shift the maximum to the peak illumination of 960 nm (Table 1 and S1
Fig). Due to the applied filter measured spectral profile ranged from 890 to 1050 nm with a
maximum absorption at 960 nm, with a light intensity of 31.98 μWatt/cm2 (Table 1 and S1
Fig). Therefore, we refer this light source as a 960 nm source throughout the text. We tested 30
larvae of each larval stage as described above.
Behaviour analysis
Recordings of the zebrafish movements were analysed by a tracking software developed by the
Institute of Real-Time Learning Systems, University of Siegen. The position of the larva (eye
position) in the vessel was analysed every 2 s for 5 min and was performed manually through a
marking between the eyes [39]. According to Shcherbakov et al. [36] the following default
Negative phototaxis in zebrafish larvae
PLOS ONE | https://doi.org/10.1371/journal.pone.0207264 November 28, 2018 5 / 16

parameters were calculated: (I) swimming activity [%], with the maximum number of possible
changes (= 150 within 300 s) in position (x- and y-value) in all analysed pictures set to 100%
within a 5 min test period; (II) absolute allocation time [s] on each side of the test vessel; (III)
relative allocation time [%] to illustrate the preferred area in the test vessel; (IV) preferred head
orientation in relation to the corresponding light source measured as mean angle [˚] (S2 Fig);
and (V) head orientation as the length of the mean directional vector R as a scale of the con-
centration of data points around a circle [42]. The mean head orientation, as a directional
parameter, is a good factor to measure the location of circular data and it is correlated to the
direction of the length of the mean directional vector R of the data [42]. A value of R = 1 indi-
cates, that all data points are located around the mean direction, a value near to 0 means evenly
distributed data around the circle [42].
Data analysis
Statistical analyses were carried out using R 3.2.4 for windows [43]. Before analysing allocation
time, we defined an activity threshold excluding those larvae showing a swimming activity
lower than 20% in the vessel during the recording. The threshold was set due to the known
freezing behaviour of zebrafish larvae. We wanted to avoid a bias in our results due to freezing
larvae on one side of the vessel. To test for differences in swimming activity [%] within a larval
stage and between larvae of the two different larval stages under different light sources, respec-
tively, we used a non-parametric Kruskal-Wallis rank sum test followed by the Wilcoxon rank
sum test for unpaired samples. To test for differences in allocation time (control side vs. NIR/
VIS light side) within one larval stage we used a Wilcoxon signed rank test. All P-values are
two tailed and were adjusted with Bonferroni correction. A Rayleigh test was performed to test
directional uniformity, to analyse the mean directional vector (R), and to assess directional
preferences of larvae to a light source. Significance level was set to α = 0.05.
Results
Swimming activity under NIR and VIS light
The swimming activity of 96 hpf zebrafish larvae differed between the experiments with differ-
ent light sources (Kruskal-Wallis test, χ2 = 29.339, P� 0.001, Fig 2). They showed a signifi-
cantly higher swimming activity under exposure of 860 nm or 960 nm NIR light (52.83 and
54.38%, respectively) than under exposure of VIS light (8.59%) (Wilcoxon rank sum test for
unpaired samples, 860 nm: W = 169.5, P� 0.001; 960 nm: W = 102, P� 0.001, Fig 2, left
panel). The 120 hpf larvae showed at NIR 860 nm and 960 nm sources a swimming activity of
76.26% and 74.65%, respectively, therefore, the 96 hpf and 120 hpf old larvae did not differ sig-
nificantly in swimming activity, neither at 860 nm (Wilcoxon rank sum test for unpaired sam-
ples, W = 602.5; P = 0.072, Fig 2) nor at 960 nm NIR light (Wilcoxon rank sum test for
unpaired samples, W = 318; P = 0.155, Fig 2). Thus, the swimming activity of 120 hpf zebrafish
larvae did not differ under the different light sources (Kruskal-Wallis test, χ2 = 4.8308,
P> 0.089, Fig 2).
Table 1. Spectral characteristics of the used light sources (VIS, NIR 860 nm and NIR 960 nm) for phototactic experiment.
Light spectrum λ(max) [nm] measured spectral range [nm] 80% of the spectral range [nm] Irradiance [μWatt/cm2]
VIS 460 420–680 455–645 2.49
NIR 860 nm 860 830–910 845–885 16.09
NIR 960 nm 960 890–1050 912–998 31.98
https://doi.org/10.1371/journal.pone.0207264.t001
Negative phototaxis in zebrafish larvae
PLOS ONE | https://doi.org/10.1371/journal.pone.0207264 November 28, 2018 6 / 16

Under VIS light, however, the mean swimming activity of 120 hpf zebrafish larvae was
54.27% and thus 6.3 times higher than mean swimming activity of the 96 hpf larvae under the
same light condition (Wilcoxon rank sum test for unpaired samples, W = 815; P� 0.001, Fig
2).
Allocation time under NIR and VIS light
When a 860 nm NIR light source and the thermal source (control) were simultaneously pre-
sented opposite to each other, both larval stages spent significantly more time [s] on the con-
trol side with the thermal source than on the NIR half (Wilcoxon signed rank test, 96 hpf:
V = 120; P� 0.001; 120 hpf: V = 385; P� 0.001, Fig 3A and 3B). In contrast to this, we found
no preference for either side in larvae of both larval stages, when exposed to 960 nm NIR light
and the thermal source (Wilcoxon signed rank test, 96 hpf: V = 169.5, P = 0.691, 120 hpf:
V = 216.5; P = 0.449, Fig 3A and 3B). Under VIS light, the 120 hpf larvae spent significantly
more time [s] on the side with the thermal source than on the side exposed with VIS light (Wil-
coxon signed rank test, V = 211; P = 0.01, Fig 3B). Due to a swimming activity below the pre-
******
***
0
10
20
30
40
50
60
70
80
90
100
VIS 860 nm 960 nm VIS 860 nm 960 nmLight source
Swim
min
g ac
tivity
(%)
Fig 2. Swimming activity [%] of 96 hpf (blue circles) and 120 hpf (red triangles) zebrafish larvae under different light sources. The x-axis indicates the three tested
light sources and the y-axis shows the swimming activity (%) of the zebrafish larvae. Shown are mean ± standard error. Sample size in each experiment: N = 30.���P< 0.001. (VIS = visible light (blue-white-light, 440–700 nm, 860 nm = NIR light with peak illumination at 860 nm; 960 nm = NIR light with peak illumination at
960 nm).
https://doi.org/10.1371/journal.pone.0207264.g002
Negative phototaxis in zebrafish larvae
PLOS ONE | https://doi.org/10.1371/journal.pone.0207264 November 28, 2018 7 / 16
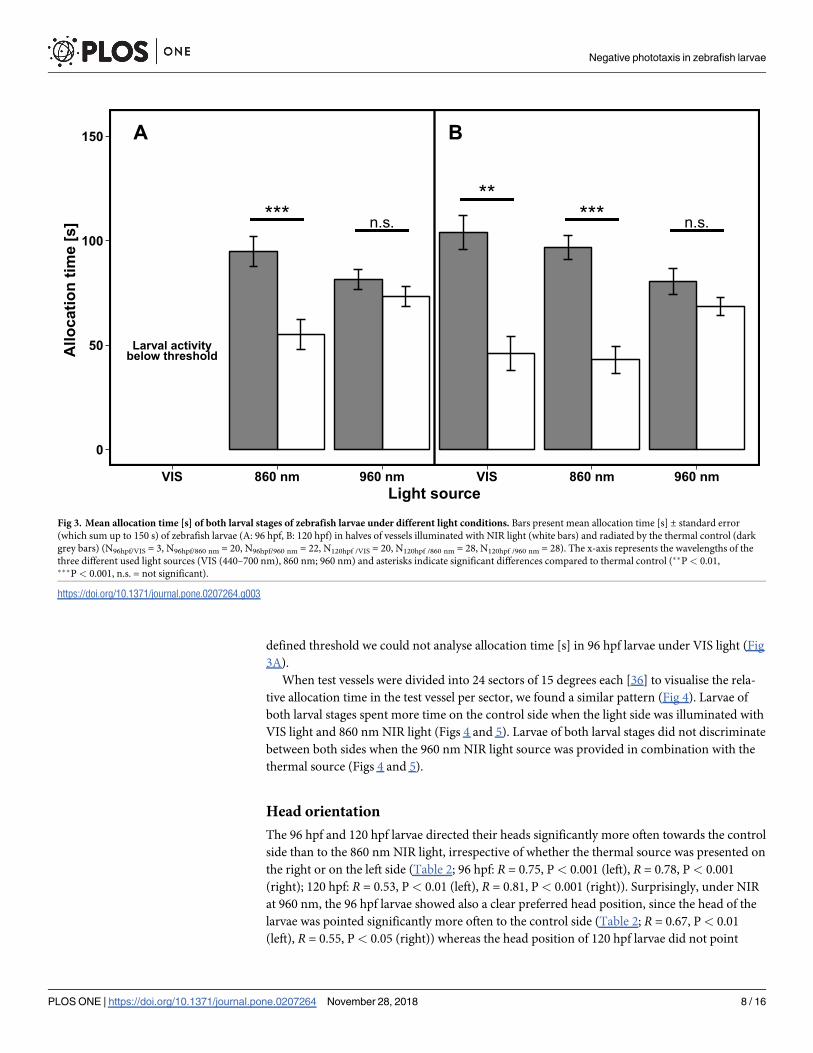
defined threshold we could not analyse allocation time [s] in 96 hpf larvae under VIS light (Fig
3A).
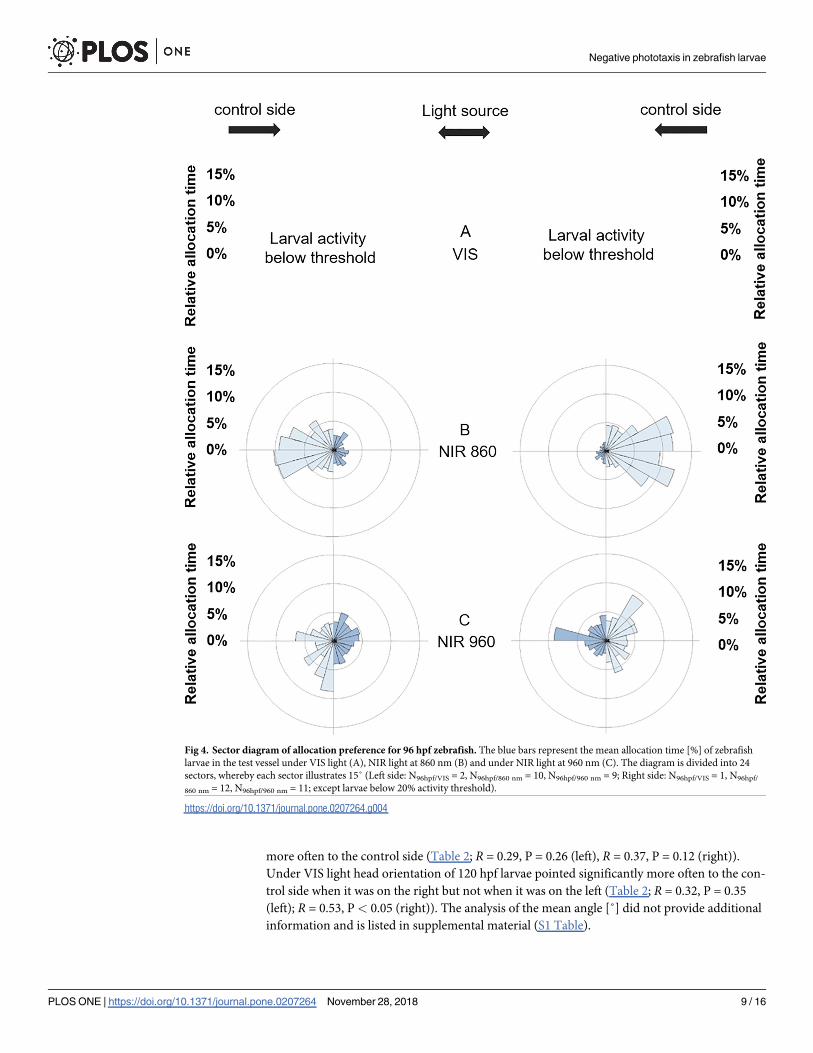
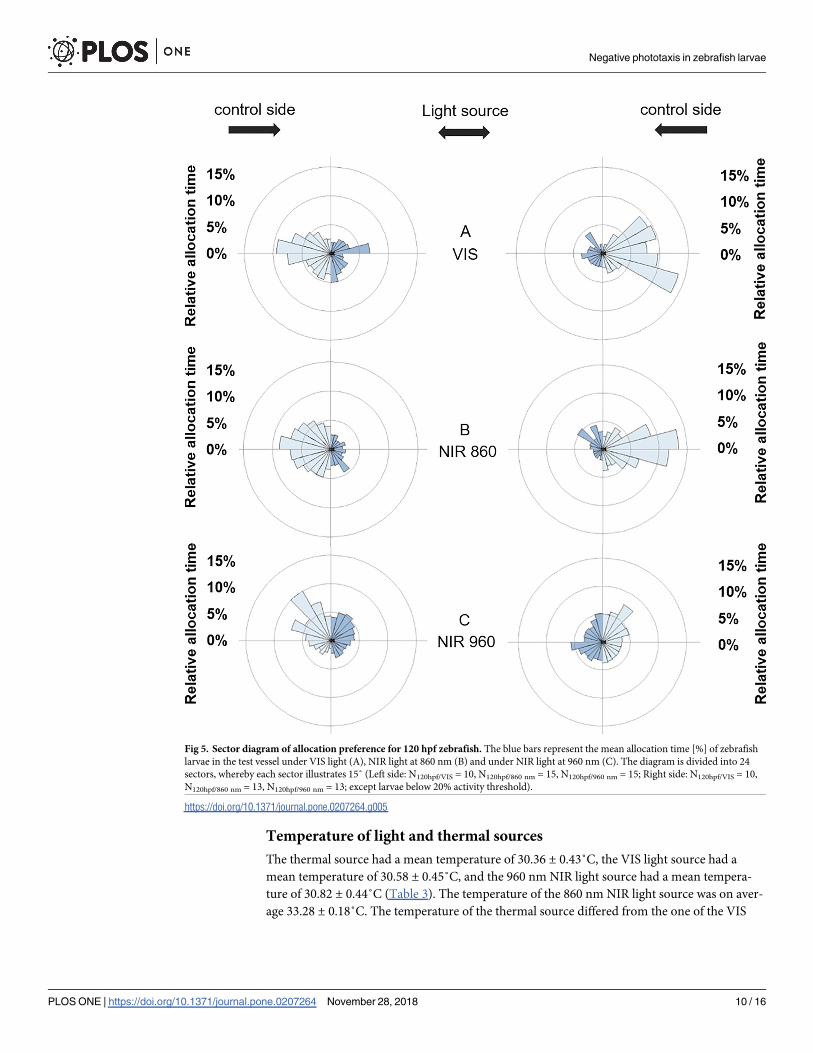
When test vessels were divided into 24 sectors of 15 degrees each [36] to visualise the rela-
tive allocation time in the test vessel per sector, we found a similar pattern (Fig 4). Larvae of
both larval stages spent more time on the control side when the light side was illuminated with
VIS light and 860 nm NIR light (Figs 4 and 5). Larvae of both larval stages did not discriminate
between both sides when the 960 nm NIR light source was provided in combination with the
thermal source (Figs 4 and 5).
Head orientation
The 96 hpf and 120 hpf larvae directed their heads significantly more often towards the control
side than to the 860 nm NIR light, irrespective of whether the thermal source was presented on
the right or on the left side (Table 2; 96 hpf: R = 0.75, P < 0.001 (left), R = 0.78, P< 0.001
(right); 120 hpf: R = 0.53, P< 0.01 (left), R = 0.81, P < 0.001 (right)). Surprisingly, under NIR
at 960 nm, the 96 hpf larvae showed also a clear preferred head position, since the head of the
larvae was pointed significantly more often to the control side (Table 2; R = 0.67, P< 0.01
(left), R = 0.55, P< 0.05 (right)) whereas the head position of 120 hpf larvae did not point
*****
*** .s.n.s.n
Larval activitybelow threshold
BA
0
50
100
150
VIS 860 nm 960 nm VIS 860 nm 960 nmLight source
Allo
catio
n tim
e [s
]
Fig 3. Mean allocation time [s] of both larval stages of zebrafish larvae under different light conditions. Bars present mean allocation time [s] ± standard error
(which sum up to 150 s) of zebrafish larvae (A: 96 hpf, B: 120 hpf) in halves of vessels illuminated with NIR light (white bars) and radiated by the thermal control (dark
grey bars) (N96hpf/VIS = 3, N96hpf/860 nm = 20, N96hpf/960 nm = 22, N120hpf /VIS = 20, N120hpf /860 nm = 28, N120hpf /960 nm = 28). The x-axis represents the wavelengths of the
three different used light sources (VIS (440–700 nm), 860 nm; 960 nm) and asterisks indicate significant differences compared to thermal control (��P< 0.01,���P< 0.001, n.s. = not significant).
https://doi.org/10.1371/journal.pone.0207264.g003
Negative phototaxis in zebrafish larvae
PLOS ONE | https://doi.org/10.1371/journal.pone.0207264 November 28, 2018 8 / 16
more often to the control side (Table 2; R = 0.29, P = 0.26 (left), R = 0.37, P = 0.12 (right)).
Under VIS light head orientation of 120 hpf larvae pointed significantly more often to the con-
trol side when it was on the right but not when it was on the left (Table 2; R = 0.32, P = 0.35
(left); R = 0.53, P< 0.05 (right)). The analysis of the mean angle [˚] did not provide additional
information and is listed in supplemental material (S1 Table).
Fig 4. Sector diagram of allocation preference for 96 hpf zebrafish. The blue bars represent the mean allocation time [%] of zebrafish
larvae in the test vessel under VIS light (A), NIR light at 860 nm (B) and under NIR light at 960 nm (C). The diagram is divided into 24
sectors, whereby each sector illustrates 15˚ (Left side: N96hpf/VIS = 2, N96hpf/860 nm = 10, N96hpf/960 nm = 9; Right side: N96hpf/VIS = 1, N96hpf/
860 nm = 12, N96hpf/960 nm = 11; except larvae below 20% activity threshold).
https://doi.org/10.1371/journal.pone.0207264.g004
Negative phototaxis in zebrafish larvae
PLOS ONE | https://doi.org/10.1371/journal.pone.0207264 November 28, 2018 9 / 16
Temperature of light and thermal sources
The thermal source had a mean temperature of 30.36 ± 0.43˚C, the VIS light source had a
mean temperature of 30.58 ± 0.45˚C, and the 960 nm NIR light source had a mean tempera-
ture of 30.82 ± 0.44˚C (Table 3). The temperature of the 860 nm NIR light source was on aver-
age 33.28 ± 0.18˚C. The temperature of the thermal source differed from the one of the VIS
Fig 5. Sector diagram of allocation preference for 120 hpf zebrafish. The blue bars represent the mean allocation time [%] of zebrafish
larvae in the test vessel under VIS light (A), NIR light at 860 nm (B) and under NIR light at 960 nm (C). The diagram is divided into 24
sectors, whereby each sector illustrates 15˚ (Left side: N120hpf/VIS = 10, N120hpf/860 nm = 15, N120hpf/960 nm = 15; Right side: N120hpf/VIS = 10,
N120hpf/860 nm = 13, N120hpf/960 nm = 13; except larvae below 20% activity threshold).
https://doi.org/10.1371/journal.pone.0207264.g005
Negative phototaxis in zebrafish larvae
PLOS ONE | https://doi.org/10.1371/journal.pone.0207264 November 28, 2018 10 / 16

light source by 0.22˚C, and from the NIR 960 nm light source by 0.46˚C. The difference
between the 860 nm NIR and the thermal source was on average 2.92˚C.
The temperature measured at 5 positions inside the vessel did not differ neither under VIS
(440–700 nm), NIR 860 nm, NIR 960 nm light source nor under the thermal source (S2
Table).
Discussion
We investigated whether zebrafish larvae of two different larval stages (96 hpf and 120 hpf)
were sensitive to NIR light at a peak illumination of 860 nm or 960 nm, and to VIS light (440–
700 nm), respectively. Regarding swimming activity (I), allocation time (II), relative allocation
time (III), head orientation (IV), and length of the mean directional vector R (V), our results
demonstrate that zebrafish larvae of both larval stages showed a clear negative phototactic
response towards NIR light with a peak illumination at 860 nm and VIS light, but not to NIR
light at 960 nm wavelength. Therefore, we conclude that zebrafish larvae are able to sense NIR
light at 860 nm wavelength. This is the first time that a solid study was performed to discrimi-
nate the perception towards different NIR wavelengths in zebrafish larvae of two different lar-
val stages. Thus, our findings are crucial to all experiments using zebrafish larvae in standard
testing procedures under NIR light conditions because most experimental devices use 850 nm
light sources to provide a presumed dark environment [24].
In general, the response pattern to light conditions depends on the age of zebrafish larvae
[7, 30, 31]. Younger larvae (96 hpf) are less active than older larvae (>120 hpf) and the mean
resting time decreased with increasing age [30, 31]. We found similar results in our experi-
ments. The 120 hpf larvae showed a higher swimming activity under VIS light than the 96 hpf
Table 2. Length of the mean directional vector R. Missing data result from activity level below threshold (for sam-
ple size see Figs 4 and 5).
light spectrum Exposure from the left side Exposure from the right side
96 hpf 120 hpf 96 hpf 120 hpf
VIS - 0.32 n.s - 0.53 �
NIR 860 nm 0.75 ��� 0.53 �� 0.78 ��� 0.81 ���
NIR 960 nm 0.67 �� 0.29 n.s. 0.55 � 0.37 n.s
�P < 0.05
��P < 0.01
���P < 0.001
n.s. = not significant.
https://doi.org/10.1371/journal.pone.0207264.t002
Table 3. Mean temperature [˚C] ± standard deviation of the used light sources (N = 30) and the temperature dif-
ferences between the thermal source and the light source.
light
spectrum
Mean temperature
[˚C]
after the onset of 5
min
(N = 30)
Difference between the thermal source and the corresponding light
source [˚C]
VIS 30.58 ± 0.45 0.22
NIR 860 nm 33.28 ± 0.18 2.92
NIR 960 nm 30.82 ± 0.44 0.46
Thermal
source
30.36 ± 0.43 -
https://doi.org/10.1371/journal.pone.0207264.t003
Negative phototaxis in zebrafish larvae
PLOS ONE | https://doi.org/10.1371/journal.pone.0207264 November 28, 2018 11 / 16

larvae (54.27% versus 8.59%). Due to the fact that the observed swimming activity in our study
is similar to those found in previous studies [7, 30, 31], the results based on our custom-built
computer vision system were comparable to commercially available systems used in other
studies.
Since all light sources emitted radiation, we simultaneously provided a non-illuminated
thermal source to control for a possible effect of temperature on the swimming activity. The
heat distribution within the test vessel due to emitted radiation of the thermal source did not
differ from heat distribution due to radiation emitted by the VIS (440–700 nm), NIR 860 nm
and NIR 960 nm light source (S2 Table). No thermal gradient was detectable within the petri
dishes based on the small size of the test vessel (35 mm diameter) and the distance to the light
sources (10.5 cm) (S2 Table). Thus, thermal radiation or a thermal gradient could not explain
the observed behavioural differences in zebrafish larvae in our tests [36, 39]. Similar to previ-
ous studies that exclude thermotaxis as an explaining factor, there are indications that our allo-
cation preferences were not due to thermal radiation but were based on the perception of NIR
light possibly due to photoreceptors [36, 39].
The hypothesis that zebrafish larvae are not sensitive to NIR light is based on the study with
zebrafish larvae of 120–168 hpf by Brockerhoff et al (1995) [29]. They detected no eye move-
ment (optomotor response; OMR) of larvae fixed with a needle to the petri dish in response to
illuminated rotating stripes (750 nm NIR light). Optomotor experiments using fixed fish,
therefore, do not allow for properly analysing visual perception in fish. In our study, we used a
state-of-the-art experimental set-up, which was designed to detect the NIR sensitivity of fish
species under controlled conditions [39]. Obviously, the set-up of the experiment plays an
important role regarding visible sensitivity of light conditions as shown by the following stud-
ies: Kobayashi et al. (2002) [44] found no reaction to NIR over 800 nm by studying the OMR
of two strains of Nile tilapia (Oreochromis niloticus). When the cardiac-conditioning technique
was used, in which the fish learned to associate a NIR or green light stimulus (conditioning
stimulus) with a mild electric shock (unconditioning stimulus), however, the same species
showed a visual sensitivity to NIR over 850 nm [34]. Moreover, Shcherbakov et al. (2012) [39]
demonstrated the sensation of NIR light at a spectral range of 850 nm—950 nm in Nile tilapia
by using an appropriate behavioural experiment.
Adult zebrafish (6 months old) exhibit a positive phototaxis towards light sources with a
maximum wavelength in the range of 845–910 nm NIR light [36]. They spent 3.4 times more
time in the half illuminated with NIR of 825–890 nm than in the non-illuminated control side.
The same was true when adult zebrafish could choose between exposure to VIS light or no
light. It is known that adult zebrafish show a different reaction to light than zebrafish larvae
[45]. These results are supported by our findings, because in contrast to adult zebrafish, zebra-
fish larvae exhibited a negative phototactic behaviour towards the side illuminated with NIR
light at 860 nm wavelength. Shcherbakov et al. (2013) [36] defined a threshold for NIR sensi-
tivity in adult zebrafish of wavelengths up to 910 nm, as the exposure to longer wavelengths
resulted in no behavioural response. Thus, adult zebrafish are able to react to NIR light of a
range of 825 nm—910 nm. We found similar findings in zebrafish larvae at 96 hpf and 120
hpf. They did not show a behavioural reaction to NIR 960 nm. The lack of response might be
due to an underrepresentation of photoreceptors with a sensitivity to wavelengths longer than
910 nm [36]. To investigate if the reaction is retina related or whether non-visual photorecep-
tors are involved, further experiments have to be conducted e.g. with blind or eyeless fish. Fer-
nandes et al. 2012 [46] showed that eyeless zebrafish larvae swam towards a light stimulus as
light perception was mediated by deep brain photoreceptors. The authors identified neurons
of the preoptic region of the hypothalamus as photoreceptors for dark photokinesis [46]. Such
findings are very important for the current study, since the mechanism for the sensitivity of
Negative phototaxis in zebrafish larvae
PLOS ONE | https://doi.org/10.1371/journal.pone.0207264 November 28, 2018 12 / 16

NIR perception could not be clarified with our experimental set-up. The NIR perception in
zebrafish larvae might be an adaptation to the characteristics of the natural preferred habitat
[35, 36]. Fish species living in highly transparent aquatic habitats often show a low sensitivity
to NIR [36]. In clear water, NIR light over 930 nm only passes through the water surface by a
few cm, however, NIR light (between 806–847 nm) passes through water up to 2 m [36]. D.
rerio lives in shallow waterbodies around the Ganges and Brahmaputra river basins in north-
eastern India, Nepal and Bangladesh [47, 48]. In their natural habitats, they are found in rela-
tively clear waters with a depth up to 103 cm and a transparency higher than 15 cm [47, 49,
50]. The preferences for this kind of water quality is correlated to a low NIR spectral sensitivity
[36]. As zebrafish inhabit slow moving and shallow waters, NIR wavelengths are presented in
the natural habitat of this species and may have shaped the sensitivity of their visual system
[36, 47]. The optical properties in the natural water habitat of zebrafish seem to correlate with
the visual pigments and photo pigment spectral sensitivity in this fish species [51, 52]. Based
on the ecological adaptation zebrafish have evolved in their natural habitats, it is not surprising
that our study confirms that 96 hpf and 120 hpf zebrafish larvae with are sensitive to NIR light
at 860 nm.
Conclusion
Opposite to previous knowledge, our results provide evidence that 96 hpf and 120 hpf zebra-
fish larvae are sensitive to light of 860 nm wavelength within the NIR spectrum. They exhibited
a clear negative phototaxis to an 860 nm light source and to VIS light. Our study is highly rele-
vant to all studies using zebrafish larvae as test organism, because most of these studies are by
default performed under NIR at 850 nm to mimic a dark environment. Thus, previous results
should be re-interpreted due to the negative phototactic response in zebrafish larvae under
NIR at 860 nm.
Supporting information
S1 Fig. Profiles of the spectrum of the used VIS, NIR 860 nm and NIR 960 nm light sources
and thermal source.
(EPS)
S2 Fig. Graphic illustration of the determination of the position of the larva in the test ves-
sel.
(TIF)
S1 Table. Mean angle [˚] of the fish head position regarding the side of the exposure.
(DOCX)
S2 Table. Water temperature profiles at different positions within the test vessel (35 mm
in diameter) 5 minutes after the onset of the respective light source.
(DOCX)
Acknowledgments
We thank Anna Beasley for proofreading the manuscript and two anonymous reviewers for
their valuable comments.
Author Contributions
Conceptualization: Sarah Hartmann, Klaudia Witte.
Negative phototaxis in zebrafish larvae
PLOS ONE | https://doi.org/10.1371/journal.pone.0207264 November 28, 2018 13 / 16

Data curation: Sarah Hartmann.
Formal analysis: Roland Vogt, Jan Kunze.
Investigation: Sarah Hartmann, Anna Rauschert.
Methodology: Sarah Hartmann, Roland Vogt, Jan Kunze, Klaus-Dieter Kuhnert, Josef Wan-
zenbock, Dunja K. Lamatsch, Klaudia Witte.
Project administration: Klaudia Witte.
Software: Jan Kunze, Klaus-Dieter Kuhnert.
Visualization: Sarah Hartmann, Roland Vogt.
Writing – original draft: Sarah Hartmann, Roland Vogt, Josef Wanzenbock, Dunja K.
Lamatsch, Klaudia Witte.
References1. Gruber D, Frago C, Rasnake W. Automated biomonitors—first line of defense. Journal of Aquatic Eco-
system Health. 1994; 3(2):87–92. https://doi.org/10.1007/BF00042938
2. Miller N, Gerlai R. Quantification of shoaling behaviour in zebrafish (Danio rerio). Behavioural Brain
Research. 2007; 184(2):157–166. https://doi.org/10.1016/j.bbr.2007.07.007 PMID: 17707522
3. Legradi J, El Abdellaoui N, van Pomeren M, Legler J. Comparability of behavioural assays using zebra-
fish larvae to assess neurotoxicity. Environmental Science and Pollution Research. 2015; 22
(21):16277–89. https://doi.org/10.1007/s11356-014-3805-8 PMID: 25399529
4. Gerhardt A. Aquatic behavioral ecotoxicology—prospects and limitations. Human and Ecological Risk
Assessment. 2007; 13(3):481–91. https://doi.org/10.1080/10807030701340839
5. Robinson PD. Behavioural toxicity of organic chemical contaminants in fish: application to ecological
risk assessments (ERAs). Canadian Journal of Fisheries and Aquatic Sciences. 2009; 66(7):1179–88.
https://doi.org/10.1139/F09-069
6. Burgess HA, Granato M. Modulation of locomotor activity in larval zebrafish during light adaptation.
Journal of Experimental Biology. 2007; 210(14):2526–39. https://doi.org/10.1242/jeb.003939 PMID:
17601957
7. Padilla S, Hunter D, Padnos B, Frady S, MacPhail R. Assessing locomotor activity in larval zebrafish:
Influence of extrinsic and intrinsic variables. Neurotoxicology and Teratology. 2011; 33(6):624–30.
https://doi.org/10.1016/j.ntt.2011.08.005 PMID: 21871562
8. Powers CM, Slotkin TA, Seidler FJ, Badireddy AR, Padilla S. Silver nanoparticles alter zebrafish devel-
opment and larval behavior: Distinct roles for particle size, coating and composition. Neurotoxicology
and Teratology. 2011; 33(6):708–14. https://doi.org/10.1016/j.ntt.2011.02.002 PMID: 21315816
9. Ahmad F, Noldus LP, Tegelenbosch RA, Richardson MK. Zebrafish embryos and larvae in behavioural
assays. Behaviour. 2012; 149(10–12):1241–81. https://doi.org/10.1163/1568539X-00003020
10. de Esch C, Slieker R, Wolterbeek A, Woutersen R, de Groot D. Zebrafish as potential model for devel-
opmental neurotoxicity testing: a mini review. Neurotoxicology and Teratology. 2012; 34(6):545–53.
https://doi.org/10.1016/j.ntt.2012.08.006 PMID: 22971930
11. Ingebretson JJ, Masino MA. Quantification of locomotor activity in larval zebrafish: considerations for
the design of high-throughput behavioral studies. Front Neural Circuits. 2013; 7:109. https://doi.org/10.
3389/fncir.2013.00109 PMID: 23772207
12. Kimmel CB, Ballard WW, Kimmel SR, Ullmann B, Schilling TF. Stages of embryonic development of the
zebrafish. Developmental Dynamics. 1995; 203(3):253–310. https://doi.org/10.1002/aja.1002030302
PMID: 8589427
13. Howe K, Clark MD, Torroja CF, Torrance J, Berthelot C, Muffato M, et al. The zebrafish reference
genome sequence and its relationship to the human genome. Nature. 2013; 496(7446):498–503.
https://doi.org/10.1038/nature12111 PMC3703927. PMID: 23594743
14. Guo S. Linking genes to brain, behavior and neurological diseases: what can we learn from zebrafish?
Genes, Brain and Behavior. 2004; 3(2):63–74. https://doi.org/10.1046/j.1601-183X.2003.00053.x
15. Guo S. Using zebrafish to assess the impact of drugs on neural development and function. Expert Opin-
ion on Drug Discovery. 2009; 4(7):715–26. https://doi.org/10.1517/17460440902988464 PMC2747263.
PMID: 19774094
Negative phototaxis in zebrafish larvae
PLOS ONE | https://doi.org/10.1371/journal.pone.0207264 November 28, 2018 14 / 16

16. Ali S, Champagne DL, Richardson MK. Behavioral profiling of zebrafish embryos exposed to a panel of
60 water-soluble compounds. Behavioural Brain Research. 2012; 228(2):272–83. https://doi.org/10.
1016/j.bbr.2011.11.020 PMID: 22138507
17. Bae M-J, Park Y-S. Biological early warning system based on the responses of aquatic organisms to
disturbances: a review. Science of the Total Environment. 2014; 466:635–49. https://doi.org/10.1016/j.
scitotenv.2013.07.075 PMID: 23962435
18. Emran F, Rihel J, Dowling JE. A behavioral assay to measure responsiveness of zebrafish to changes
in light intensities. J Vis Exp. 2008; 20. https://doi.org/10.3791/923 PMID: 19078942
19. MacPhail R, Brooks J, Hunter D, Padnos B, Irons T, Padilla S. Locomotion in larval zebrafish: influence
of time of day, lighting and ethanol. Neurotoxicology. 2009; 30(1):52–8. https://doi.org/10.1016/j.neuro.
2008.09.011 PMID: 18952124
20. Irons T, MacPhail R, Hunter D, Padilla S. Acute neuroactive drug exposures alter locomotor activity in
larval zebrafish. Neurotoxicology and Teratology. 2010; 32(1):84–90. https://doi.org/10.1016/j.ntt.2009.
04.066 PMID: 19465114
21. Ellis LD, Seibert J, Soanes KH. Distinct models of induced hyperactivity in zebrafish larvae. Brain
Research. 2012; 1449:46–59. https://doi.org/10.1016/j.brainres.2012.02.022 PMID: 22386495
22. Nußer LK, Skulovich O, Hartmann S, Seiler T-B, Cofalla C, Schuettrumpf H, et al. A sensitive biomarker
for the detection of aquatic contamination based on behavioral assays using zebrafish larvae. Ecotoxi-
cology and Environmental Safety. 2016; 133:271–80. https://doi.org/10.1016/j.ecoenv.2016.07.033
PMID: 27479771
23. Chen Q, Gundlach M, Yang S, Jiang J, Velki M, Yin D, et al. Quantitative investigation of the mecha-
nisms of microplastics and nanoplastics toward zebrafish larvae locomotor activity. Science of The
Total Environment. 2017;584–585:1022–31. https://doi.org/10.1016/j.scitotenv.2017.01.156 PMID:
28185727
24. Liu Y, Carmer R, Zhang G, Venkatraman P, Brown SA, Pang C-P, et al. Statistical Analysis of Zebrafish
Locomotor Response. PLOS ONE. 2015; 10(10):e0139521. https://doi.org/10.1371/journal.pone.
0139521 PMID: 26437184
25. Dowling JE. Fishing for novel genes. Proceedings of the American Philosophical Society. 2002; 146
(4):337–47.
26. Brockerhoff SE, Hurley JB, Niemi GA, Dowling JE. A new form of inherited red-blindness identified in
zebrafish. Journal of Neuroscience. 1997; 17(11):4236–42. PMID: 9151740
27. Robinson J, Schmitt EA, Harosi FI, Reece RJ, Dowling JE. Zebrafish ultraviolet visual pigment: absorp-
tion spectrum, sequence, and localization. Proceedings of the National Academy of Sciences. 1993; 90
(13):6009–12.
28. Fleisch VC, Neuhauss SC. Visual behavior in zebrafish. Zebrafish. 2006; 3(2):191–201. https://doi.org/
10.1089/zeb.2006.3.191 PMID: 18248260
29. Brockerhoff SE, Hurley JB, Janssen-Bienhold U, Neuhauss S, Driever W, Dowling JE. A behavioral
screen for isolating zebrafish mutants with visual system defects. Proceedings of the National Academy
of Sciences. 1995; 92(23):10545–9.
30. Colwill RM, Creton R. Locomotor behaviors in zebrafish (Danio rerio) larvae. Behavioural Processes.
2011; 86(2):222–9. https://doi.org/10.1016/j.beproc.2010.12.003 PMID: 21147203
31. de Esch C, van der Linde H, Slieker R, Willemsen R, Wolterbeek A, Woutersen R, et al. Locomotor
activity assay in zebrafish larvae: influence of age, strain and ethanol. Neurotoxicology and Teratology.
2012; 34(4):425–33. https://doi.org/10.1016/j.ntt.2012.03.002 PMID: 22484456
32. Schwoerbel J, Brendelberger H. Einfuhrung in die Limnologie: Spektrum Akademischer Verlag; 2010.
33. Kirk JT. Light and photosynthesis in aquatic ecosystems: Cambridge University Press; 1994.
34. Matsumoto T, Kawamura G. The eyes of the common carp and Nile tilapia are sensitive to near-infra-
red. Fisheries Science. 2005; 71(2):350–5. https://doi.org/10.1111/j.1444-2906.2005.00971.x
35. Meuthen D, Rick IP, Thunken T, Baldauf SA. Visual prey detection by near-infrared cues in a fish. Natur-
wissenschaften. 2012; 99(12):1063–6. https://doi.org/10.1007/s00114-012-0980-7 PMID: 23086394
36. Shcherbakov D, Knorzer A, Espenhahn S, Hilbig R, Haas U, Blum M. Sensitivity differences in fish offer
near-infrared vision as an adaptable evolutionary trait. PLOS ONE. 2013; 8(5):e64429. https://doi.org/
10.1371/journal.pone.0064429 PMID: 23691215
37. Jekely G. Evolution of phototaxis. Philosophical Transactions of the Royal Society B: Biological Sci-
ences. 2009; 364(1531):2795–808. https://doi.org/10.1098/rstb.2009.0072 PMC2781859. PMID:
19720645
38. OECD- Organisation for Economic Co-operation and Development. Test No. 236: Fish Embryo Acute
Toxicity (FET) Test. OECD Guidelines for the testing of chemicals. 2013:22 pages.
Negative phototaxis in zebrafish larvae
PLOS ONE | https://doi.org/10.1371/journal.pone.0207264 November 28, 2018 15 / 16

39. Shcherbakov D, Knorzer A, Hilbig R, Haas U, Blum M. Near-infrared orientation of Mozambique tilapia
Oreochromis mossambicus. Zoology. 2012; 115(4):233–8. https://doi.org/10.1016/j.zool.2012.01.005
PMID: 22770589
40. ISO. ISO 7346-1-Water quality–Determination of the acute lethal toxicity of substances to a freshwater
fish [Brachydanio rerio Hamilton-Buchanan (Teleostei, Cyprinidae)]–Part 1: Static method. 1996.
41. Vignet C, Begout M-L, Pean S, Lyphout L, Leguay D, Cousin X. Systematic screening of behavioral
responses in two zebrafish strains. Zebrafish. 2013; 10(3):365–75. https://doi.org/10.1089/zeb.2013.
0871 PMID: 23738739
42. Pewsey A, Neuhauser M, Ruxton GD. Circular statistics in R: Oxford University Press; 2013.
43. R Core Team. R: A language and environment for statistical computing. Vienna, Austria: R Foundation
for Statistical Computing; 2016.
44. Kobayashi R, Endo M, Yoshizaki G, Takeuchi T. Sensitivity of tilapia to infrared light measured using a
rotating striped drum differs between two strains. Nippon Suisan Gakkaishi. 2002; 68(5):646–51.
https://doi.org/10.2331/suisan.68.646
45. Colwill RM, Creton R. Imaging escape and avoidance behavior in zebrafish larvae. Reviews in the Neu-
rosciences. 2011; 22(1):63–73. https://doi.org/10.1515/RNS.2011.008 PMID: 21572576
46. Fernandes A.M., et al., Deep brain photoreceptors control light-seeking behavior in zebrafish larvae.
Current Biology. 2012; 22(21):2042–2047. https://doi.org/10.1016/j.cub.2012.08.016 PMID: 23000151
47. Spence R, Fatema M, Reichard M, Huq K, Wahab M, Ahmed Z, et al. The distribution and habitat prefer-
ences of the zebrafish in Bangladesh. Journal of Fish Biology. 2006; 69(5):1435–48. https://doi.org/10.
1111/j.1095-8649.2006.01206.x
48. Spence R, Gerlach G, Lawrence C, Smith C. The behaviour and ecology of the zebrafish, Danio rerio.
Biological Reviews. 2008; 83(1):13–34. https://doi.org/10.1111/j.1469-185X.2007.00030.x PMID:
18093234
49. McClure M, McIntyre P, McCune A. Notes on the natural diet and habitat of eight danionin fishes, includ-
ing the zebrafish Danio rerio. Journal of Fish Biology. 2006; 69(2):553–70. https://doi.org/10.1111/j.
1095-8649.2006.01125.x
50. Lawrence C. The husbandry of zebrafish (Danio rerio): a review. Aquaculture. 2007; 269(1):1–20.
https://doi.org/10.1016/j.aquaculture.2007.04.077
51. Lythgoe J. Visual pigments and environmental light. Vision Research. 1984; 24(11):1539–50. PMID:
6398560
52. Wootton RJ. Ecology of teleost fishes: Springer Science & Business Media; 2012.
Negative phototaxis in zebrafish larvae
PLOS ONE | https://doi.org/10.1371/journal.pone.0207264 November 28, 2018 16 / 16