zakaria a. khamis ge 2110 geographical statistics ge 2110
TRANSCRIPT
Zakaria A. Khamis
GEOGRAPHICAL STATISTICS
GE 2110GE 2110
Inferential statistic tests• Inferential statistic tests are performed to test for
the HYPOTHESIS formulated to answer the RESEARCH QUESTIONS
• What is HYPOTHESIS?
• At the end of the study, HYPOTHESIS need to be tested so as to conclude the answers to the questions
• Hypothesis testing constitute a fundamental way in which inferences about a population are made from a sample
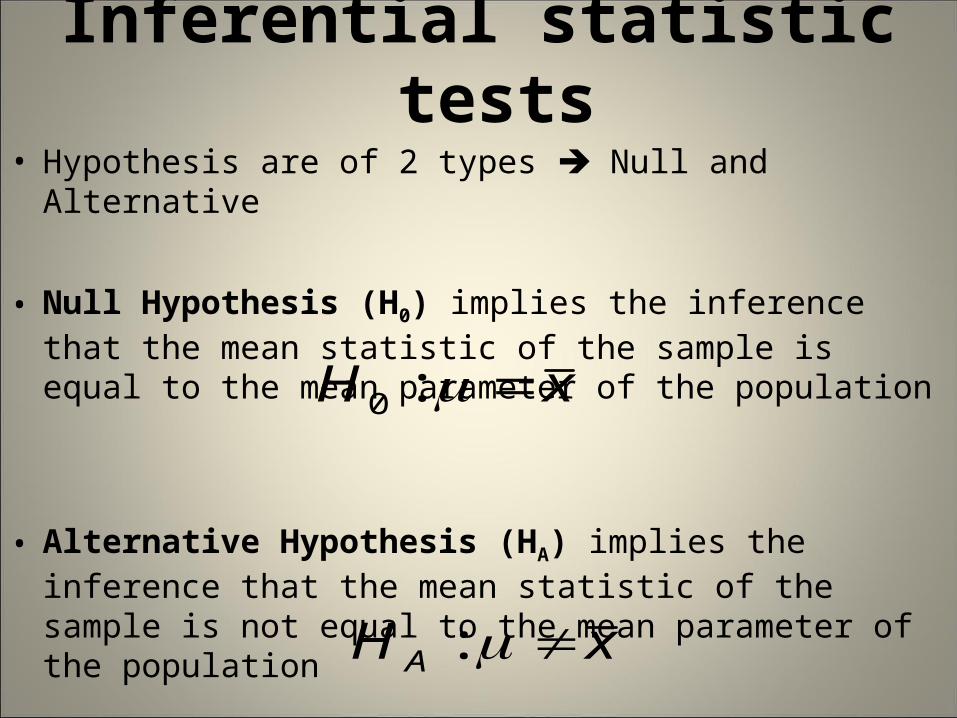
• Hypothesis are of 2 types Null and Alternative
• Null Hypothesis (H0) implies the inference that the mean statistic of the sample is equal to the mean parameter of the population
• Alternative Hypothesis (HA) implies the inference that the mean statistic of the sample is not equal to the mean parameter of the population
Inferential statistic tests
xH :0
xH A :
• The above alternative hypothesis is two-sides hypothesis. And if we assume that the mean statistic of the sample is greater (same as less) than mean parameter of the population, the hypothesis is one-side
• The inferential statistic tests are used to test for the hypothesis hypothesis testing
• Through the hypothesis testing, the researcher may either accept or reject the Null Hypothesis
• Accepting the null hypothesis means the mean parameter of the population is not different from the hypothesized mean
Inferential statistic tests
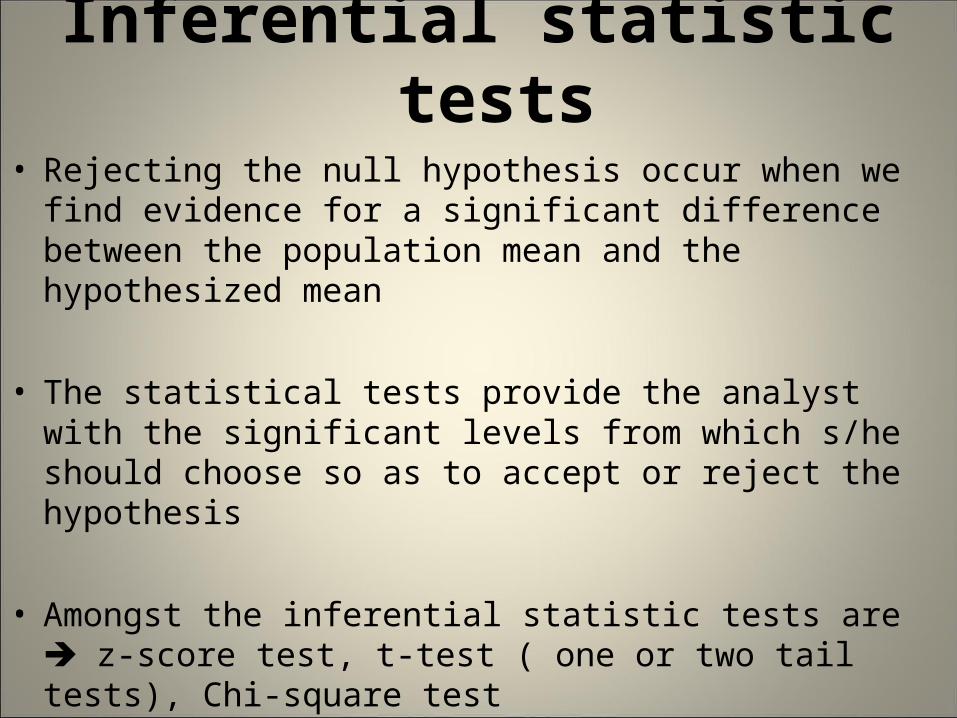
• Rejecting the null hypothesis occur when we find evidence for a significant difference between the population mean and the hypothesized mean
• The statistical tests provide the analyst with the significant levels from which s/he should choose so as to accept or reject the hypothesis
• Amongst the inferential statistic tests are z-score test, t-test ( one or two tail tests), Chi-square test
Inferential statistic tests
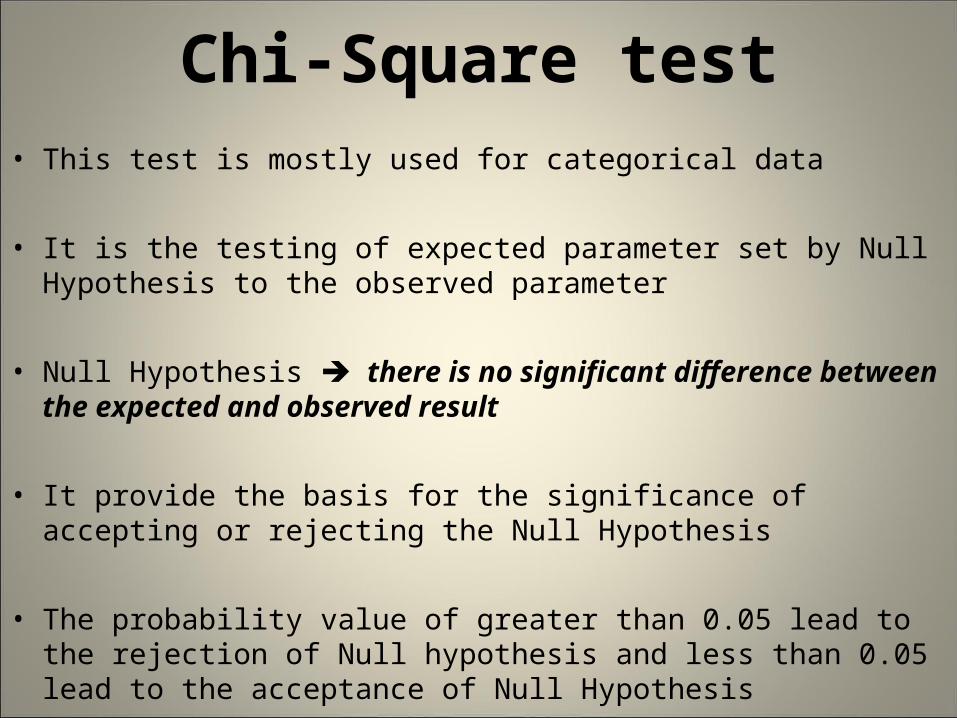
• This test is mostly used for categorical data
• It is the testing of expected parameter set by Null Hypothesis to the observed parameter
• Null Hypothesis there is no significant difference between the expected and observed result
• It provide the basis for the significance of accepting or rejecting the Null Hypothesis
• The probability value of greater than 0.05 lead to the rejection of Null hypothesis and less than 0.05 lead to the acceptance of Null Hypothesis
Chi-Square test
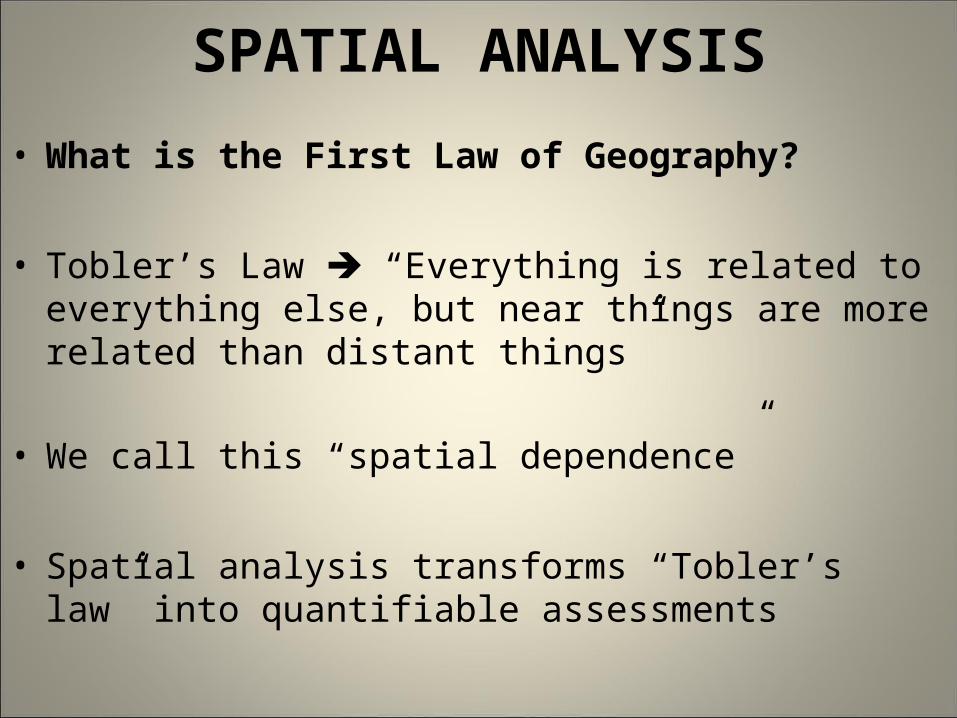
• What is the First Law of Geography?
• Tobler’s Law “Everything is related to everything else, but near things are more related than distant things”
• We call this “spatial dependence”
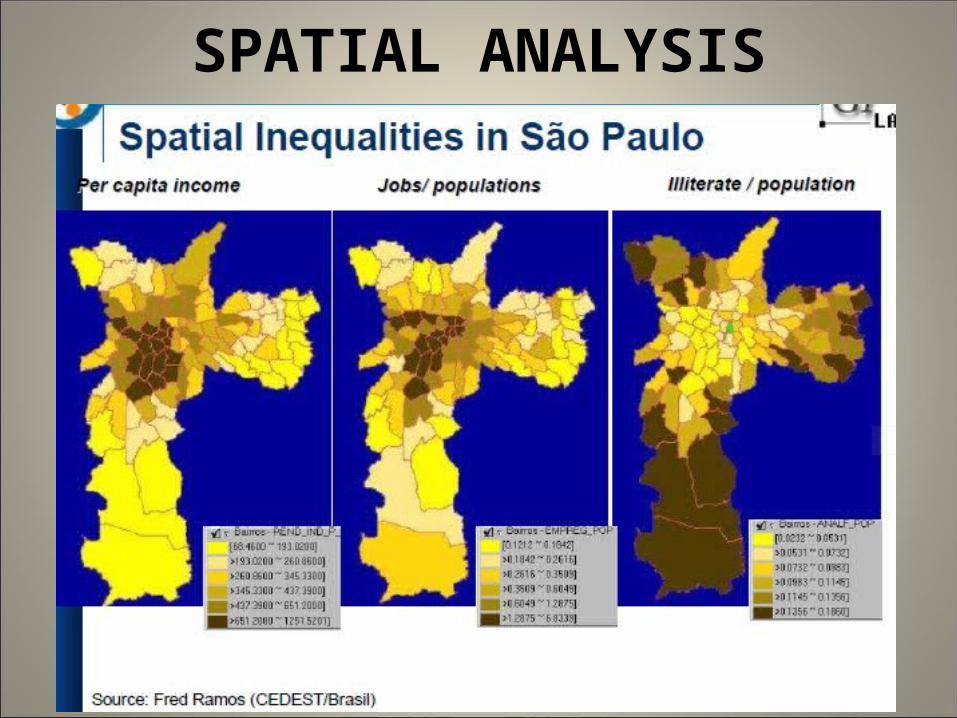
• Spatial analysis transforms “Tobler’s law” into quantifiable assessments
SPATIAL ANALYSIS
SPATIAL ANALYSIS
SPATIAL ANALYSIS
SPATIAL ANALYSIS• Formal quantitative study of phenomena that
manifest themselves in space (Anselin)
• Spatial analysis includes the transformations, manipulations, and methods that can be applied to geographic data to add value to them, to support decisions, and to reveal patterns and anomalies that are not immediately obvious
• The human eye and brain are also very sophisticated processors of geographic data and excellent detectors of patterns and anomalies in maps and images
• So the approach taken here is to regard spatial analysis as spread out along a continuum of sophistication, ranging from the simplest types that occur very quickly and intuitively when the eye and brain look at a map
• To the types that require complex software and sophisticated mathematical understanding.
• Spatial analysis is a set of methods whose results change when the locations of the objects being analyzed, or the frame used to analyze them, changes
SPATIAL ANALYSIS
• The study of methods for the description and or the quantitative study of phenomena located in space explanation of a process operating in space based on a sample of observations of the process
• Modifications, extensions, and additions to statistical techniques that explicitly consider the importance of locations or spatial arrangement
• Data are spatially located and explicit consideration is given to the possible importance of their spatial arrangement in the analysis
SPATIAL ANALYSIS
• Spatial analysis can be:
• Inductive, to examine empirical evidence in the search for patterns that might support new theories or general principles, in this case with regard to disease causation.
• Deductive, focusing on the testing of known theories or principles against data
• Normative, using spatial analysis to develop or prescribe new or better designs
SPATIAL ANALYSIS
• Spatial Analysis provides Analytical capacity to:
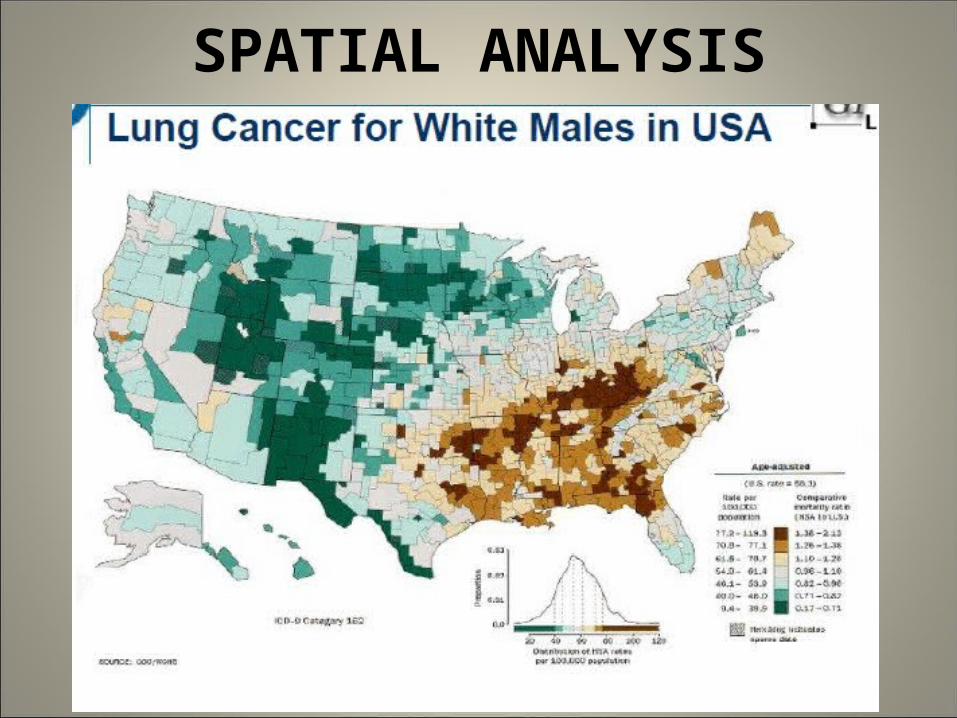
• Understand the spatial distribution of values (identify trends and clusters)
• Develop possible explanations (models) for the observed patterns
• Use the models to indicate what can happen in other occasions
SPATIAL ANALYSIS
• Spatial pattern is the way in which features are organized spatially
• There are several ways to analyze quantitatively the spatial patterns– To divide the landscape into a number of data collection
unit, then make counts of the number of features within each unit this can be normalized by area to get Density
– Another approach is spatial arrangement of features across the landscape random, regular or cluster
• The arrangements may be easy for one to observe them; however, there are also mathematical measures which can be used to describe them
SPATIAL PATTERN ANALYSIS

• Amongst the measures employed for spatial analysis include
– Spatial Autocorrelation the association/correlation of features in themselves
– Connectivity measure the degree to which line features are interconnected
– Fragmentation and Diversity measure the degree at which the area features belong to each category are aggregated (clumped) with respect to each other
SPATIAL PATTERN ANALYSIS
• Counting the number of features within small data collection units on the earth is the beginning point for spatial analysis data collection units such as Shehia, Districts, Regions etc
Point Counts
• Point counts give you information about the abundance of point features in each data collection unit
• The spatial analysis of the pattern for the point features may involve the analysis of relative abundance this is calculated by comparing the abundance of each unit from the average abundance
Feature Counts
Line Counts
• Linear features are counted within data collection units in the same way as point features
• Counting the linear feature posses a bit problem when the feature crosses more than one data collection unit in that case, one may decide to count the feature in each unit or only in one unit in which most of the feature lies
Area Counts
• This is done by first determining the total surface area of the features in the data collection units
Feature Counts