yum! at-a-glance · brands—kfc, pizza hut, ... followed by popcorn ... profit is not a measure...
TRANSCRIPT
25.
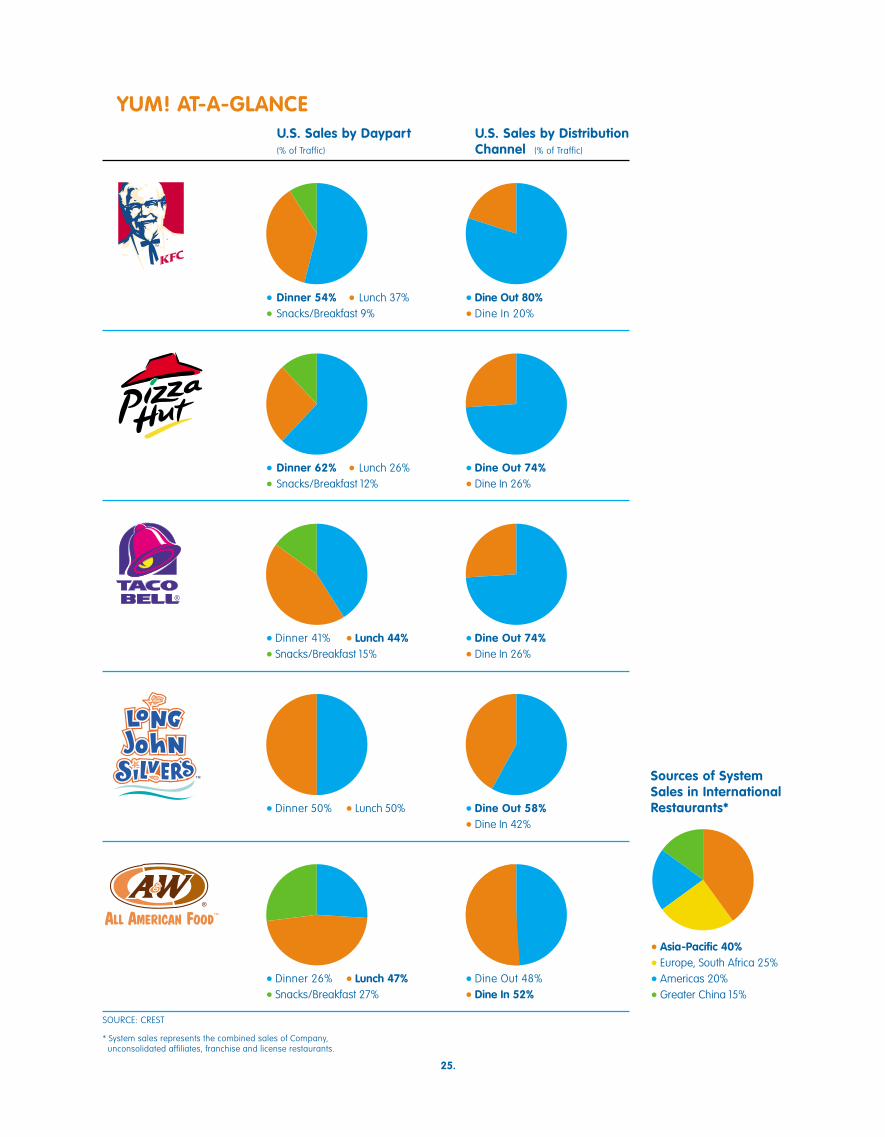
U.S. Sales by Daypart(% of Traffic)
U.S. Sales by Distribution Channel (% of Traffic)
• Dinner 54% • Lunch 37% • Snacks/Breakfast 9%
• Dinner 62% • Lunch 26%• Snacks/Breakfast 12%
• Dinner 41% • Lunch 44% • Snacks/Breakfast 15%
• Dinner 50% • Lunch 50%
• Dinner 26% • Lunch 47%• Snacks/Breakfast 27%
• Dine Out 80%• Dine In 20%
• Dine Out 74%• Dine In 26%
• Dine Out 74%• Dine In 26%
• Dine Out 58%• Dine In 42%
• Dine Out 48%• Dine In 52%
Sources of System Sales in InternationalRestaurants*
• Asia-Pacific 40%• Europe, South Africa 25%• Americas 20%• Greater China 15%
YUM! AT-A-GLANCE
SOURCE: CREST
* System sales represents the combined sales of Company,unconsolidated affiliates, franchise and license restaurants.
TM
®
®
In 2002, we expanded our portfolio of category-leading brands by acquiring Long John Silver’sand A&W All-American Food Restaurants to drive our Multibranding leadership. Now four of ourbrands—KFC, Pizza Hut, Taco Bell and Long John Silver’s—are the global leaders of the chicken,pizza, Mexican-style food and quick-service seafood categories, respectively. And A&W All-American Food has been serving a signature frosty mug Root Beer Float and all-American pure-beef hamburgers and hot dogs since 1919, making it the longest running quick-service franchisechain in America. To better reflect this expanded portfolio and our New York Stock Exchangeticker symbol (NYSE:YUM), we received shareholder approval to change our corporate name toYum! Brands from Tricon Global Restaurants.
HERE’S HOW WE SET OUR TABLE IN 2002:TACO BELL Taco Bell had outstanding results in 2002, with a 7% increase in company same store sales,marking 17 consecutive periods of growth. Customer compliments also increased as we improved our speedof service and reduced turnover of our Restaurant General Managers and Team Members. Our “ThinkOutside the Bun” advertising campaign helped introduce America to some hit products, including delicious
Border Bowls, Fajita Grilled Stuft Burritos and 7-Layer Nachos. Our customers took notice, and Taco Bell moved up tothird place from fifth in QSR magazine’s annual drive-thru survey of the top 25 quick-service restaurant brands (in2000, Taco Bell placed 14th, so that’s huge progress!). — Emil Brolick, President and Chief Concept Officer
KFC KFC also improved operations by launching “Hot & Fresh,” serving great-tasting, home-style meals hotterand fresher than ever before. Honey BBQ and Spicy BBQ wings led sales in early 2002, followed by PopcornChicken in the summertime. And, we began serving our meals in deep three-section plates —differentiating
KFC from fast food and underscoring our “There’s fast food. Then there’s KFC” advertising campaign with celebrityJason Alexander. Finally, our CHAMPS scores have improved to their highest levels yet as we train our employees tohave a Customer Mania mindset. We are not satisfied however, with our flat sales in 2002, and are focused on the rightgrowth initiatives to return to positive sales in 2003 and beyond. — Cheryl Bachelder, President and Chief Concept Officer
PIZZA HUT In 2002, sales at Pizza Hut were flat, however we know we’re capable of improving our per-formance. This past year, we continued to innovate and lead the pizza category by introducing two greatnew products. The por table P’Zone — a pizza that eats like a sandwich — and the ultimate Chicago DishPizza — so deep, you need a fork to eat it! At the same time, Pizza Hut’s customer satisfaction scores
improved, with better delivery times and record-high CHAMPS scores. We also reduced Restaurant General Managerturnover by 15%, and Team Member turnover dropped to an all-time low of 112% —now that’s how we’ll get to CHAMPSwith a Yes! 100% of the time. — Peter Hearl, President and Chief Concept Officer
LONG JOHN SILVER’S With 33% market share and over 1,200 restaurants in the U.S., Long John Silver’s isthe leader in the quick-service seafood segment. In 2002, we featured our hand-dipped, signature fish andshrimp, with our value-packed Boatload of Seafood Variety Platter and Seafood Basket Combos. Our newnational adver tising campaign reminds everyone if there is a Long John Silver’s nearby, it’s “Seafood
Country.” It’s no wonder we’re America’s favorite place for seafood! Stop by and ring the bell! — Steve Davis, President
A&W ALL-AMERICAN FOOD At A&W, we improved the quality of our offerings and introduced America totwo hot products that drove sales: the Velveeta burger, a cheeseburger with lots and lots and lots of deli-cious Velveeta cheese, and the Texas Toast BLT, a sandwich piled high with bacon, lettuce, tomato and served
on thick Texas Toast. With real jukebox music and a frosty mug A&W Root Beer Float in hand, our customers love the nos-talgia as much as our delicious 100% U.S. beef burgers, coney dogs, french fries and onion rings.— Kevin Bazner, President
With great food, and the opportunity to provide more choice and convenience by placing two of these brands underone roof, you can see why the world is saying Yum!
Alone we’re delicious. Together we’re Yum!
®
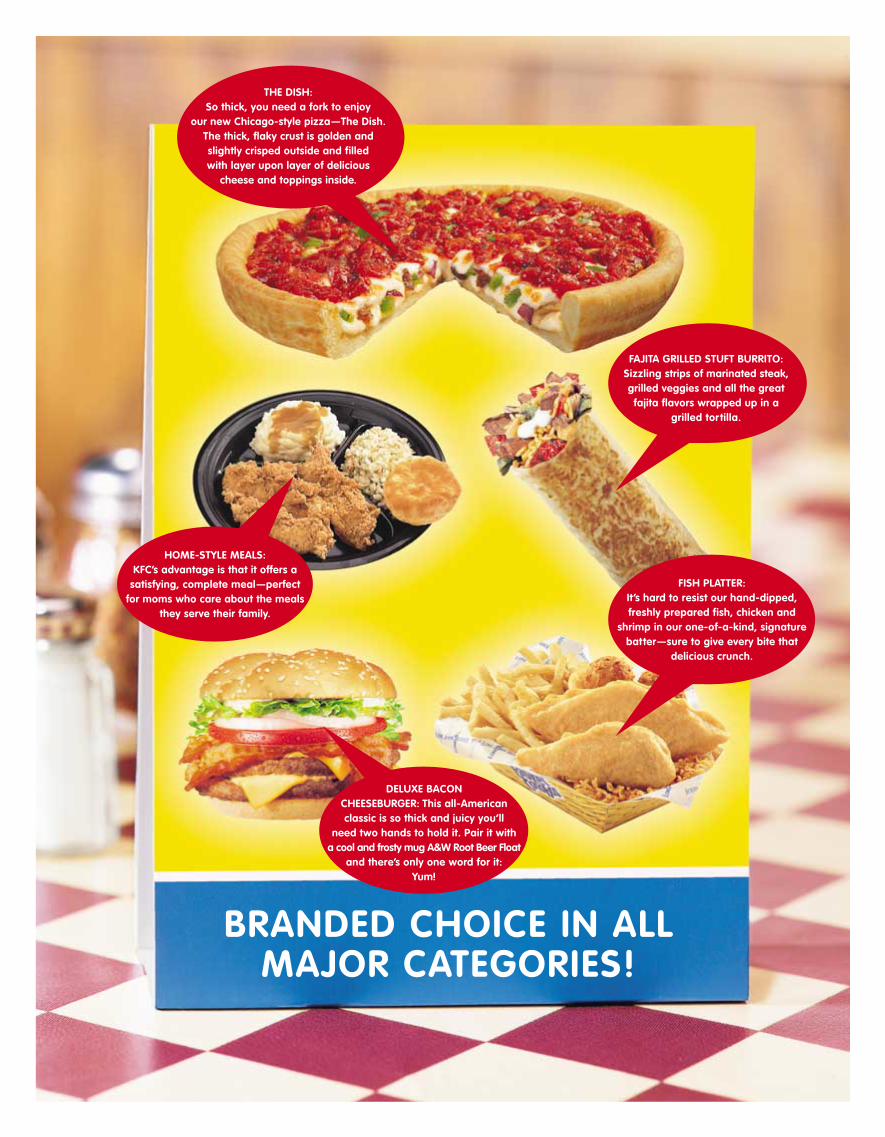
FAJITA GRILLED STUFT BURRITO:Sizzling strips of marinated steak,grilled veggies and all the greatfajita flavors wrapped up in a
grilled tor tilla.
THE DISH:So thick, you need a fork to enjoy
our new Chicago-style pizza —The Dish.The thick, flaky crust is golden and slightly crisped outside and filled with layer upon layer of delicious
cheese and toppings inside.
HOME-STYLE MEALS:KFC’s advantage is that it offers a
satisfying, complete meal —perfect for moms who care about the meals
they serve their family.
FISH PLATTER:It’s hard to resist our hand-dipped,freshly prepared fish, chicken and
shrimp in our one-of-a-kind, signaturebatter —sure to give every bite that
delicious crunch.
DELUXE BACON CHEESEBURGER: This all-American classic is so thick and juicy you’ll
need two hands to hold it. Pair it witha cool and frosty mug A&W Root Beer Float
and there’s only one word for it: Yum!
BRANDED CHOICE IN ALL MAJOR CATEGORIES!
28.
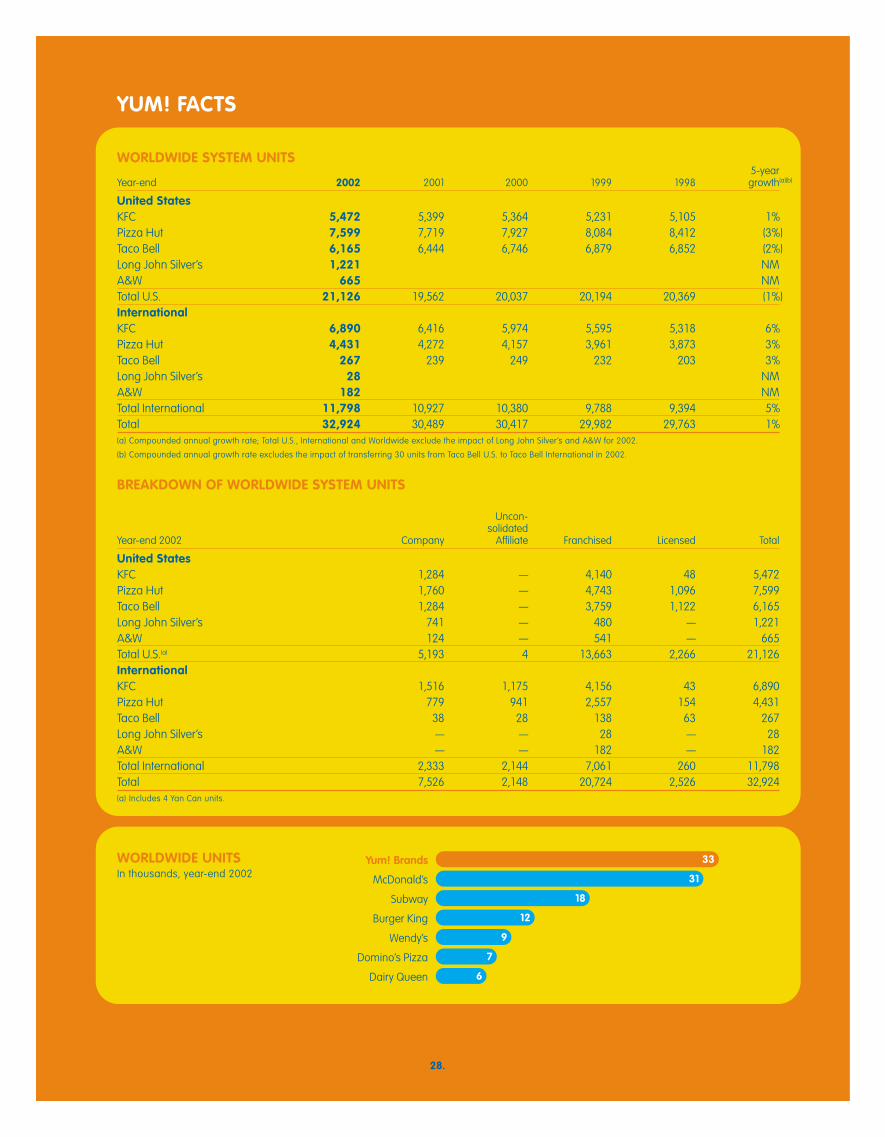
WORLDWIDE SYSTEM UNITS5-year
Year-end 2002 2001 2000 1999 1998 growth(a)(b)
United StatesKFC 5,472 5,399 5,364 5,231 5,105 1%Pizza Hut 7,599 7,719 7,927 8,084 8,412 (3%)Taco Bell 6,165 6,444 6,746 6,879 6,852 (2%)Long John Silver’s 1,221 NM A&W 665 NM Total U.S. 21,126 19,562 20,037 20,194 20,369 (1%)InternationalKFC 6,890 6,416 5,974 5,595 5,318 6%Pizza Hut 4,431 4,272 4,157 3,961 3,873 3%Taco Bell 267 239 249 232 203 3%Long John Silver’s 28 NM A&W 182 NM Total International 11,798 10,927 10,380 9,788 9,394 5%Total 32,924 30,489 30,417 29,982 29,763 1%(a) Compounded annual growth rate; Total U.S., International and Worldwide exclude the impact of Long John Silver’s and A&W for 2002.
(b) Compounded annual growth rate excludes the impact of transferring 30 units from Taco Bell U.S. to Taco Bell International in 2002.
BREAKDOWN OF WORLDWIDE SYSTEM UNITS
Uncon-solidated
Year-end 2002 Company Affiliate Franchised Licensed Total
United StatesKFC 1,284 — 4,140 48 5,472Pizza Hut 1,760 — 4,743 1,096 7,599Taco Bell 1,284 — 3,759 1,122 6,165Long John Silver’s 741 — 480 — 1,221A&W 124 — 541 — 665Total U.S.(a) 5,193 4 13,663 2,266 21,126InternationalKFC 1,516 1,175 4,156 43 6,890Pizza Hut 779 941 2,557 154 4,431Taco Bell 38 28 138 63 267Long John Silver’s — — 28 — 28A&W — — 182 — 182Total International 2,333 2,144 7,061 260 11,798Total 7,526 2,148 20,724 2,526 32,924(a) Includes 4 Yan Can units.
YUM! FACTS
WORLDWIDE UNITSIn thousands, year-end 2002
Dairy Queen
Domino’s Pizza
Wendy’s
Burger King
Subway
McDonald’s
Yum! Brands 33
31
18
12
9
7
6
MANAGEMENT’S DISCUSSION AND ANALYSIS OF FINANCIAL CONDITION AND RESULTS OF OPERATIONS
29.
Yum! Brands Inc.
INTRODUCTIONOn May 16, 2002, TRICON Global Restaurants, Inc. changed itsname to YUM! Brands, Inc. in order to better reflect our expandingportfolio of brands. In addition, on the same day, Tricon RestaurantsInternational changed its name to YUM! Restaurants International.
YUM! Brands, Inc. and Subsidiaries (collectively referred to as“YUM” or the “Company”) comprises the worldwide operations ofKFC, Pizza Hut, Taco Bell, Long John Silver’s (“LJS”) and A&W All-American Food Restaurants (“A&W”) (collectively “the Concepts”)and is the world’s largest quick service restaurant (“QSR”) companybased on the number of system units. LJS and A&W were addedwhen YUM acquired Yorkshire Global Restaurants, Inc. (“YGR”) onMay 7, 2002. Separately, KFC, Pizza Hut and Taco Bell rank in thetop ten among QSR chains in U.S. system sales and units. With11,798 international units, YUM is the second largest QSR companyoutside the U.S. YUM became an independent, publicly ownedcompany on October 6, 1997 (the “Spin-off Date”) via a tax-free dis-tribution of our Common Stock (the “Distribution” or “Spin-off”) tothe shareholders of our former parent, PepsiCo, Inc. (“PepsiCo”).
Throughout Management’s Discussion and Analysis(“MD&A”), we make reference to ongoing operating profit whichrepresents our operating profit excluding the impact of facilityactions net loss (gain) and unusual items income (expense). SeeNote 7 to the Consolidated Financial Statements for a detailed dis-cussion of these exclusions. We use ongoing operating profit asa key performance measure of our results of operations for pur-poses of evaluating performance internally. Ongoing operatingprofit is not a measure defined in accounting principles generallyaccepted in the United States of America and should not be con-sidered in isolation or as a substitute for measures of performancein accordance with accounting principles generally accepted inthe United States of America.
All references to per share and share amounts in the follow-ing MD&A have been adjusted to reflect the two-for-one stock splitdistributed on June 17, 2002.
In 2002, our international business, YUM! RestaurantsInternational (“YRI” or “International”) accounted for 35% of systemsales, 31% of revenues and 32% of ongoing operating profitexcluding unallocated and corporate expenses. We anticipatethat, despite the inherent risks and typically higher general andadministrative expenses required by international operations, wewill continue to invest in certain international markets with sub-stantial growth potential.
This MD&A should be read in conjunction with ourConsolidated Financial Statements on pages 44 through 47 andthe Cautionary Statements on page 43. All Note references hereinrefer to the Notes to the Consolidated Financial Statements onpages 48 through 72. Tabular amounts are displayed in millionsexcept per share and unit count amounts, or as otherwise specif-ically identified.
CRITICAL ACCOUNTING POLICIESOur reported results are impacted by the application of certainaccounting policies that require us to make subjective or complexjudgments. These judgments involve estimations of the effect ofmatters that are inherently uncertain and may significantly impactour quarterly or annual results of operations or financial condi-tion. Changes in the estimates and judgments could significantlyaffect our results of operations, financial condition and cash flowsin future years. A description of what we consider to be our mostsignificant critical accounting policies follows.
Impairment or Disposal of Long-Lived AssetsWe evaluate our long-lived assets for impairment at the individualrestaurant level. Restaurants held and used are evaluated forimpairment on a semi-annual basis or whenever events or cir-cumstances indicate that the carrying amount of a restaurant maynot be recoverable (including a decision to close a restaurant). Oursemi-annual test includes those restaurants that have experiencedtwo consecutive years of operating losses. These impairmentevaluations require an estimation of cash flows over the remain-ing useful life of the primary asset of the restaurant, which can befor a period of over 20 years, and any terminal value. We limitassumptions about important factors such as sales growth andmargin improvement to those that are supportable based uponour plans for the unit and actual results at comparable restaurants.
If the long-lived assets of a restaurant on a held and usedbasis are not recoverable based upon forecasted, undiscountedcash flows, we write the assets down to their fair value. This fairvalue is determined by discounting the forecasted cash flows,including terminal value, of the restaurant at an appropriate rate.The discount rate used is our cost of capital, adjusted upwardwhen a higher risk is believed to exist.
When it is probable that we will sell a restaurant we writedown the restaurant to its fair value. We often refranchise restau-rants in groups and therefore perform impairment evaluations atthe group level. Fair value is based on the expected sales proceedsless applicable transaction costs. Estimated sales proceeds arebased on the most relevant of historical sales multiples or bidsfrom buyers, and have historically been reasonably accurate esti-mations of the proceeds ultimately received.
See Note 2 for a further discussion of our policy regarding theimpairment or disposal of long-lived assets.
Impairment of Investments in UnconsolidatedAffiliatesWe record impairment charges related to an investment in anunconsolidated affiliate whenever events or circumstances indi-cate that a decrease in the value of an investment has occurredwhich is other than temporary. In addition, we evaluate our invest-ments in unconsolidated affiliates for impairment when they haveexperienced two consecutive years of operating losses. Our
impairment measurement test for an investment in an unconsol-idated affiliate is similar to that for our restaurants except that weuse discounted cash flows after interest and taxes instead of dis-counted cash flows before interest and taxes as used for ourrestaurants.
See Note 2 for a further discussion of our policy regarding theimpairment of investments in unconsolidated affiliates.
Impairment of GoodwillWe evaluate goodwill for impairment on an annual basis throughthe comparison of fair value of our reporting units to their carryingvalues. Our reporting units are our operating segments in the U.S.and our business management units internationally (typically indi-vidual countries). Fair value is the price a willing buyer would payfor the reporting unit, and is generally estimated by discountingexpected future cash flows from the reporting units over twentyyears plus an expected terminal value. We limit assumptionsabout important factors such as sales growth and marginimprovement to those that are supportable based upon our plansfor the reporting unit.
We impaired $5 million of goodwill during 2002 related to ourPizza Hut France reporting unit. For the remainder of our report-ing units with goodwill, the fair value is generally significantly inexcess of the recorded carrying value. Thus, we do not believe thatwe have material goodwill that is at risk to be impaired given cur-rent business performance.
See Note 2 for a further discussion of our policies regardinggoodwill.
Allowances for Franchise and LicenseReceivables and Contingent LiabilitiesWe reserve a franchisee’s or licensee’s entire receivable balancebased upon pre-defined aging criteria and upon the occurrence ofother events that indicate that we may not collect the balance due.As a result of reserving using this methodology, we have animmaterial amount of receivables that are past due that have notbeen reserved for at December 28, 2002. See Note 2 for a furtherdiscussion of our policies regarding franchise and license opera-tions.
Primarily as a result of our refranchising efforts, we remainliable for certain lease assignments and guarantees. We recorda liability for our exposure under these lease assignments andguarantees when such exposure is probable and estimable. AtDecember 28, 2002, we have recorded an immaterial liability forour exposure which we consider to be probable and estimable.The potential total exposure under such leases is significant, with$278 million representing the present value of the minimum pay-ments of the assigned leases at December 28, 2002, discounted
at our pre-tax cost of debt. Current franchisees are the primarylessees under the vast majority of these leases. We generally havecross-default provisions with these franchisees that would putthem in default of their franchise agreement in the event of non-payment under the lease. We believe these cross-defaultprovisions significantly reduce the risk that we will be required tomake payments under these leases and, historically, we have notbeen required to make such payments in significant amounts. SeeNote 24 for a further discussion of our lease guarantees.
Self-Insured Property and Casualty LossesWe record our best estimate of the remaining cost to settle incurredself-insured property and casualty claims. The estimate is basedon the results of an independent actuarial study and considershistorical claim frequency and severity as well as changes in fac-tors such as our business environment, benefit levels, medicalcosts and the regulatory environment that could impact overallself-insurance costs. Additionally, a risk margin to cover unfore-seen events that may occur over the several years it takes forclaims to settle is included in our reserve, increasing our confi-dence level that the recorded reserve is adequate.
See Note 24 for a further discussion of our insurance programs.
Income Tax Valuation Allowances and Tax ReservesAt December 28, 2002, we have recorded a valuation allowanceof $137 million primarily to reduce our net operating loss and taxcredit carryforwards of $176 million to an amount that will morelikely than not be realized. These net operating loss and tax creditcarryforwards exist in many state and foreign jurisdictions andhave varying carryforward periods and restrictions on usage. Theestimation of future taxable income in these state and foreign juris-dictions and our resulting ability to utilize net operating loss andtax credit carryforwards can significantly change based on futureevents, including our determinations as to the feasibility of cer-tain tax planning strategies. Thus, recorded valuation allowancesmay be subject to material future changes.
As a matter of course, we are regularly audited by federal,state and foreign tax authorities. We provide reserves for poten-tial exposures when we consider it probable that a taxing authoritymay take a sustainable position on a matter contrary to our posi-tion. We evaluate these reserves, including interest thereon, on aquarterly basis to insure that they have been appropriatelyadjusted for events that may impact our ultimate payment forsuch exposures.
See Note 22 for a further discussion of our income taxes.
30.
FACTORS AFFECTING COMPARABILITY OF 2002 RESULTS TO 2001 RESULTS AND 2001 RESULTS TO 2000 RESULTS
YGR Acquisition On May 7, 2002, the Company completed its acquisition of YGR,the parent company of LJS and A&W. See Note 4 for a discussionof the acquisition.
As of the date of the acquisition, YGR consisted of 742 and496 company and franchise LJS units, respectively, and 127 and742 company and franchise A&W units, respectively. In addition,133 multibranded LJS/A&W restaurants were included in the LJSunit totals. Except as discussed in certain sections of the MD&A,the impact of the acquisition on our results of operations in 2002was not significant.
Impact of Recently Adopted AccountingPronouncementEffective December 30, 2001, the Company adopted Statement ofFinancial Accounting Standards (“SFAS”) No. 142, “Goodwill andOther Intangible Assets” (“SFAS 142”), in its entirety. In accordancewith the requirements of SFAS 142, we ceased amortization ofgoodwill and indefinite-lived intangibles as of December 30, 2001.The following table summarizes the favorable effect of SFAS 142on restaurant profit, restaurant margin and ongoing operatingprofit had SFAS 142 been effective in 2001.
Year Ended December 29, 2001
Inter-U.S. national Worldwide
Restaurant profit $ 21 $ 11 $ 32
Restaurant margin (%) 0.5 0.6 0.5
Ongoing operating profit $ 22 $ 16 $ 38
Additionally, if SFAS 142 had been effective in 2001, reported netincome would have increased approximately $26 million and dilutedearnings per common share (“EPS”) would have increased $0.09.
Unusual Items (Income) ExpenseWe recorded unusual items income of $27 million in 2002 and$3 million in 2001 and unusual items expense of $204 million in2000. See Note 7 for a detailed discussion of our unusual items(income) expense.
Impact of New Unconsolidated AffiliatesConsistent with our strategy to focus our capital on key interna-tional markets, we formed ventures in Canada and Poland withour largest franchisee in each market. The venture in Canada wasformed in the third quarter of 2000 and the venture in Poland was
effective in the first quarter of 2001. At the date of formation, theCanadian venture operated over 700 stores and the Poland ven-ture operated approximately 100 stores. We did not record anygain or loss on the transfer of assets to these new ventures.
Previously, the results from the restaurants we contributed tothese ventures were consolidated. The impact of these trans-actions on operating results is similar to the impact of ourrefranchising activities, which is described in the Store PortfolioStrategy section below. Consequently, these transactions resultedin a decline in our Company sales, restaurant margin dollars andgeneral and administrative (“G&A”) expenses as well as higherfranchise fees. We also record equity income (loss) from invest-ments in unconsolidated affiliates (“equity income”) and, inCanada, higher franchise fees since the royalty rate was increasedfor those stores contributed by our partner to the venture. The for-mation of these ventures did not have a significant net impact onongoing operating profit in 2001.
Store Portfolio StrategySince 1995, we have been strategically reducing our share oftotal system units by selling Company restaurants to existing andnew franchisees where their expertise can generally be lever-aged to improve the restaurants’ overall operating performance,while retaining Company ownership of key U.S. and Internationalmarkets. This portfolio-balancing activity reduces our reportedrevenues and restaurant profits, which increases the importanceof system sales as a key performance measure. We substantiallycompleted our U.S. refranchising program in 2001.
The following table summarizes our refranchising activities:
2002 2001 2000
Number of units refranchised 174 233 757Refranchising proceeds, pre-tax $ 81 $ 111 $ 381Refranchising net gains, pre-tax(a) $ 19 $ 39 $ 200
(a) 2001 includes $12 million of previously deferred refranchising gains and a charge of$11 million to mark to market the net assets of our Singapore business, which wassold during 2002 at a price approximately equal to its carrying value.
In addition to our refranchising program, we have closed certainrestaurants over the past several years. Restaurants closed includepoor performing restaurants, restaurants relocated to a new sitewithin the same trade area or U.S. Pizza Hut delivery units con-solidated with a new or existing dine-in traditional store within thesame trade area.
31.
Yum! Brands Inc.
32.
The following table summarizes Company store closureactivities:
2002 2001 2000
Number of units closed 224 270 208Store closure costs $ 15 $ 17 $ 10Impairment charges for stores
to be closed $ 9 $ 5 $ 6
The impact on ongoing operating profit arising from our refran-chising and store closure initiatives as well as the contribution ofCompany stores to new unconsolidated affiliates is the net of (a)the estimated reduction in Company sales, restaurant profit andG&A expenses; (b) the estimated increase in franchise fees fromthe stores refranchised; and (c) the estimated change in equityincome (loss). The amounts presented below reflect the estimatedimpact from stores that were operated by us for all or some por-tion of the respective previous year and were no longer operatedby us as of the last day of the respective year.
The following table summarizes the estimated impact on rev-enue of refranchising, Company store closures and, in 2001, thecontribution of Company stores to unconsolidated affiliates:
2002Inter-
U.S. national Worldwide
Decreased sales $ (214) $ (90) $ (304)Increased franchise fees 4 4 8
Decrease in total revenues $ (210) $ (86) $ (296)
2001
Inter-U.S. national Worldwide
Decreased sales $ (483) $ (243) $ (726)Increased franchise fees 21 13 34
Decrease in total revenues $ (462) $ (230) $ (692)
The following table summarizes the estimated impact on ongoingoperating profit of refranchising, Company store closures and, in 2001, the contribution of Company stores to unconsolidated affiliates:
2002Inter-
U.S. national Worldwide
Decreased restaurant margin $ (23) $ (5) $ (28)Increased franchise fees 4 4 8Decreased G&A 1 2 3
(Decrease) increase in ongoing operating profit $ (18) $ 1 $ (17)
2001
Inter-U.S. national Worldwide
Decreased restaurant margin $ (67) $ (25) $ (92)Increased franchise fees 21 13 34Decreased G&A 5 13 18Decreased equity income — (5) (5)
Decrease in ongoing operating profit $ (41) $ (4) $ (45)
Franchisee Financial ConditionLike others in the QSR industry, from time to time, some of our fran-chise operators experience financial difficulties with respect to theirfranchise operations.
Depending upon the facts and circumstances of each situa-tion, and in the absence of an improvement in the franchisee’sbusiness trends, there are a number of potential resolutions ofthese financial issues. These include a sale of some or all of theoperator’s restaurants to us or a third party, a restructuring of theoperator’s business and/or finances, or, in the more unusualcases, bankruptcy of the operator. It is our practice to proactivelywork with financially troubled franchise operators in an attempt topositively resolve their issues.
Since 2000, certain of our franchise operators, principally inthe Taco Bell system, have experienced varying degrees of finan-cial problems. Through December 28, 2002, restructurings havebeen completed for approximately 1,778 Taco Bell franchise restau-rants. In connection with these restructurings, Taco Bell hasacquired 147 restaurants for approximately $76 million. In additionto these acquisitions, Taco Bell has purchased land, buildingsand/or equipment related to 52 restaurants from franchisees forapproximately $28 million and simultaneously leased it back tothese franchisees under long-term leases. As part of the restruc-turings, Taco Bell committed to fund approximately $45 million offuture franchise capital expenditures, principally through leasingarrangements, approximately $26 million of which has beenfunded through December 28, 2002. We substantially completedthe Taco Bell franchisee restructurings in 2002 and expect to final-ize any remaining restructurings in the first quarter of 2003.
In the fourth quarter of 2000, Taco Bell also established a$15 million loan program to assist certain franchisees. All fundingshad been advanced by the end of the first quarter of 2001. Aremaining net balance of $7 million at December 28, 2002 forthese notes receivable is included primarily in other assets.
We believe that the general improvement in business trendsat Taco Bell has helped alleviate financial problems in the Taco Bellfranchise system which were due to past downturns in sales. Asdescribed in the U.S. revenues section, Company same-store salesgrowth at Taco Bell increased 7% in 2002. This follows an 8%increase in Company same-store sales growth at Taco Bell in thefourth quarter of 2001. Generally, franchisees have experiencedsimilar or better growth over these time frames. Accordingly, thecost of restructurings of Taco Bell franchise restaurants was less in2002 than in 2001 and, though we continue to monitor this situa-tion, we expect these costs to be less again in 2003.
In 2002 and 2001, the Company charged expenses of $8 mil-lion and $18 million, respectively, to ongoing operating profitrelated to allowances for doubtful Taco Bell franchise and licensefee receivables. These costs are reported as part of franchise andlicense expenses. On an ongoing basis, we assess our exposurefrom franchise-related risks, which include estimated uncol-lectibility of franchise and license receivables, contingent leaseliabilities, guarantees to support third party financial arrangementsof franchisees and potential claims by franchisees. The contingentlease liabilities and guarantees are more fully discussed in theLease Guarantees section of Note 24. Although the ultimate impactof these franchise financial issues cannot be predicted with cer-tainty at this time, we have provided for our current estimate of theprobable exposure as of December 28, 2002. It is reasonably pos-sible that there will be additional costs; however, these costs arenot expected to be material to quarterly or annual results of oper-ations, financial condition or cash flows.
Impact of AmeriServe Bankruptcy Reorganization ProcessSee Note 25 for a discussion of the impact of the AmeriServe FoodDistribution, Inc. (“AmeriServe”) bankruptcy reorganization processon the Company.
33.
Yum! Brands Inc.
WORLDWIDE RESULTS OF OPERATIONS% B(W) % B(W)
2002 vs. 2001 2001 vs. 2000
RevenuesCompany sales $ 6,891 12 $ 6,138 (3)Franchise and license fees 866 6 815 3
Total revenues $ 7,757 12 $ 6,953 (2)
Company restaurant margin $ 1,101 22 $ 906 (5)
% of Company sales 16.0% 1.2ppts. 14.8% (0.3)ppts.
Ongoing operating profit $ 1,035 16 $ 889 —Facility actions net (loss) gain (32) NM (1) NMUnusual items income 27 NM 3 NM
Operating profit 1,030 16 891 4Interest expense, net 172 (8) 158 10Income tax provision 275 (15) 241 11
Net income $ 583 18 $ 492 19
Diluted earnings per share(a) $ 1.88 16 $ 1.62 17
(a) See Note 6 for the number of shares used in this calculation. See Note 12 for a discussion of the pro-forma impact of SFAS 142 on EPS in 2001.
Impact of the Consolidation of anUnconsolidated AffiliateAt the beginning of 2001, we consolidated a previously unconsol-idated affiliate in our Consolidated Financial Statements as a resultof a change in our intent to temporarily retain control of this affili-ate. As a result of this change, Company sales, restaurant marginand G&A increased approximately $100 million, $6 million and$9 million, respectively, in 2001. Also as a result of the change, fran-chise fees and equity income decreased approximately $4 millionand $2 million, respectively, in 2001. At the date of consolidation,this previously unconsolidated affiliate operated over 100 stores.
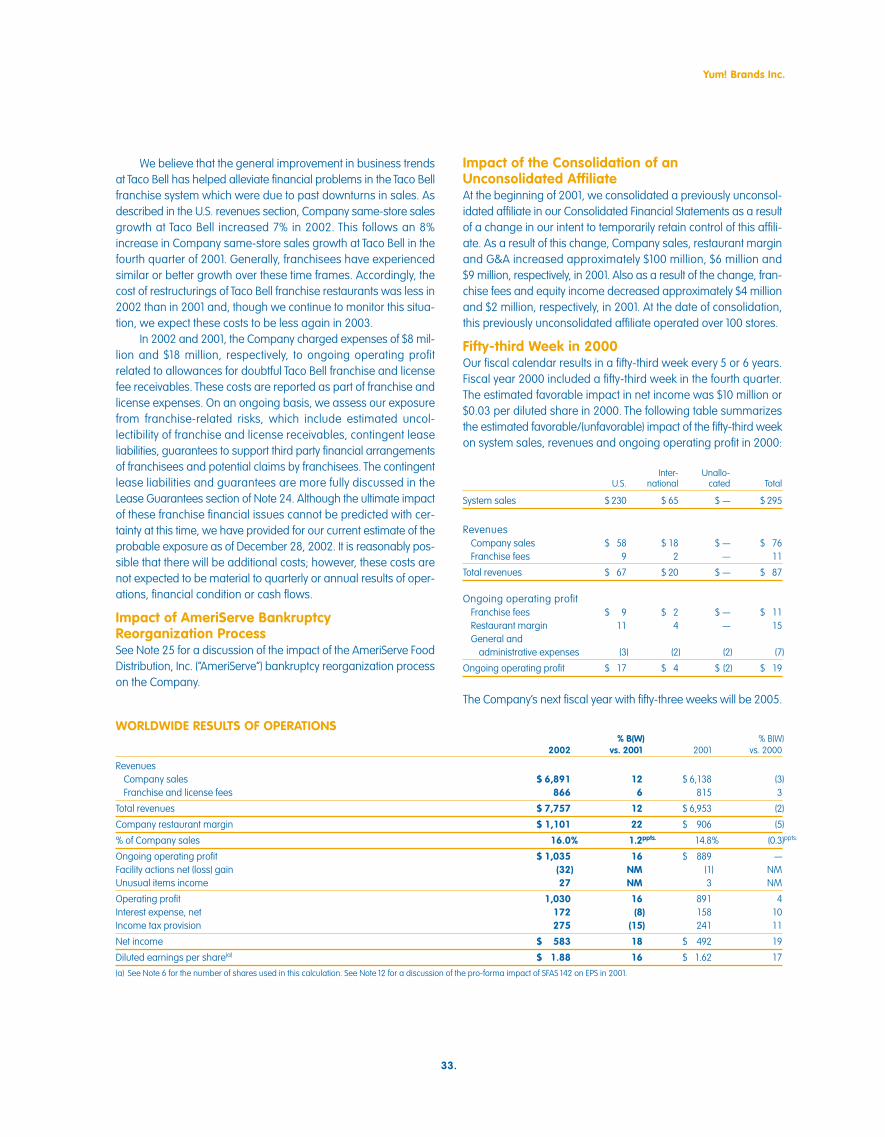
Fifty-third Week in 2000Our fiscal calendar results in a fifty-third week every 5 or 6 years.Fiscal year 2000 included a fifty-third week in the fourth quarter.The estimated favorable impact in net income was $10 million or$0.03 per diluted share in 2000. The following table summarizesthe estimated favorable/(unfavorable) impact of the fifty-third weekon system sales, revenues and ongoing operating profit in 2000:
Inter- Unallo-U.S. national cated Total
System sales $ 230 $ 65 $ — $ 295
RevenuesCompany sales $ 58 $ 18 $ — $ 76Franchise fees 9 2 — 11
Total revenues $ 67 $ 20 $ — $ 87
Ongoing operating profitFranchise fees $ 9 $ 2 $ — $ 11Restaurant margin 11 4 — 15General and
administrative expenses (3) (2) (2) (7)
Ongoing operating profit $ 17 $ 4 $ (2) $ 19
The Company’s next fiscal year with fifty-three weeks will be 2005.
WORLDWIDE SYSTEM SALES System sales represents the combined sales of Company, uncon-solidated affiliates, franchise and license restaurants. Sales ofunconsolidated affiliates and franchise and license restaurantsresult in franchise and license fees for us but are not included inthe Company sales figure we present on the ConsolidatedStatements of Income. However, we believe that system sales isuseful to investors as a significant indicator of our Concepts’ mar-ket share and the overall strength of our business as itincorporates all of our revenue drivers, company and franchisesame store sales as well as net unit development.
% B(W) % B(W)2002 vs. 2001 2001 vs. 2000
System sales $ 24,219 8 $ 22,328 1
System sales increased approximately $1,891 million or 8% in2002. The impact from foreign currency translation was not sig-nificant. Excluding the favorable impact of the YGR acquisition,system sales increased 5%. The increase resulted from new unitdevelopment and same store sales growth, partially offset bystore closures.
System sales increased $169 million or 1% in 2001, after a 2%unfavorable impact from foreign currency translation. Excludingthe unfavorable impact of foreign currency translation and lap-ping the fifty-third week in 2000, system sales increased 5%. Thisincrease was driven by new unit development and same storesales growth, partially offset by store closures.
WORLDWIDE REVENUESCompany sales increased $753 million or 12% in 2002. The impactfrom foreign currency translation was not significant. Excluding thefavorable impact of the YGR acquisition, Company sales increased6%. The increase was driven by new unit development and samestore sales growth. The increase was partially offset by refran-chising and store closures.
Company sales decreased $167 million or 3% in 2001, after a2% unfavorable impact from foreign currency translation. Excludingthe unfavorable impact of foreign currency translation and lappingthe fifty-third week in 2000, Company sales were flat. An increasedue to new unit development was offset by refranchising.
Franchise and license fees increased $51 million or 6% in2002. The impact from foreign currency translation was not sig-nificant. Excluding the favorable impact of the YGR acquisition,franchise and license fees increased 4%. The increase was drivenby new unit development and same store sales growth, partiallyoffset by store closures.
Franchise and license fees increased $27 million or 3% in2001, after a 2% unfavorable impact from foreign currency trans-lation. Excluding the unfavorable impact of foreign currencytranslation and lapping the fifty-third week in 2000, franchise andlicense fees increased 7%. The increase was driven by new unitdevelopment, units acquired from us and same store salesgrowth. This increase was partially offset by store closures.
34.
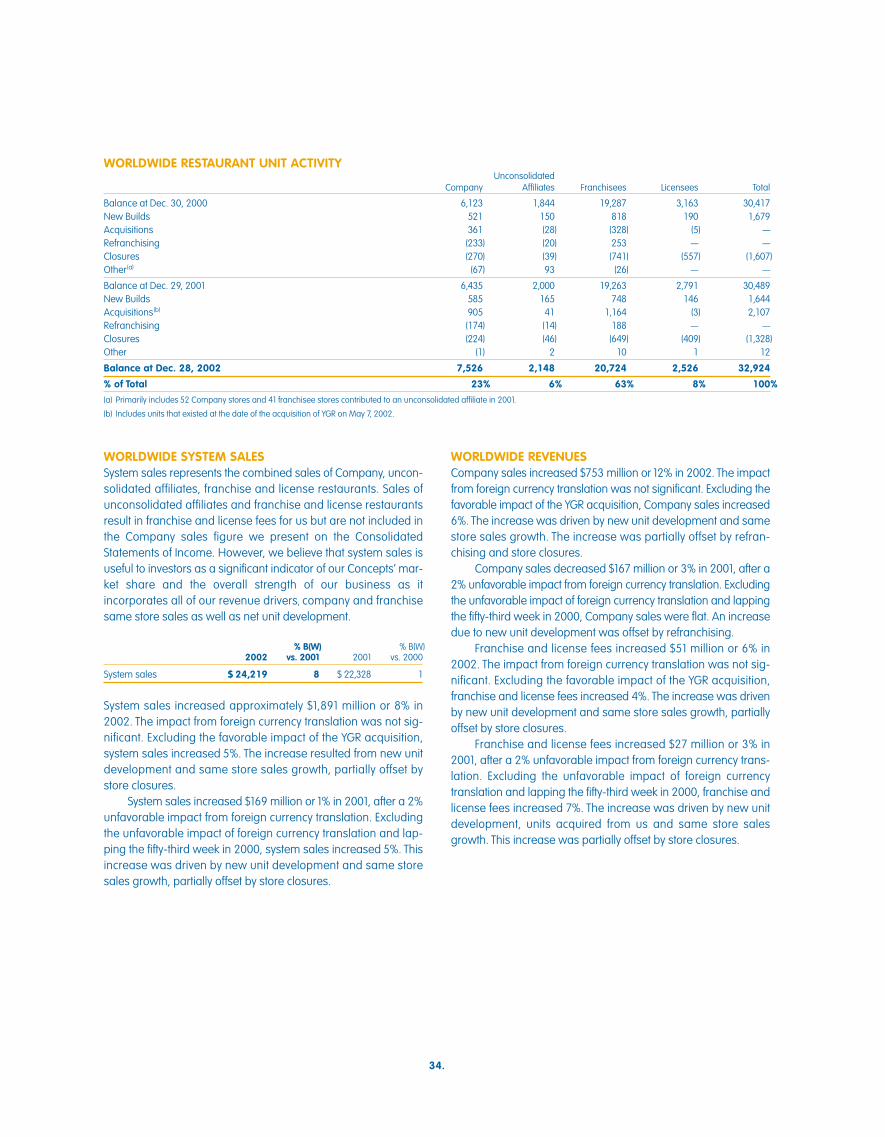
WORLDWIDE RESTAURANT UNIT ACTIVITYUnconsolidated
Company Affiliates Franchisees Licensees Total
Balance at Dec. 30, 2000 6,123 1,844 19,287 3,163 30,417New Builds 521 150 818 190 1,679Acquisitions 361 (28) (328) (5) —Refranchising (233) (20) 253 — —Closures (270) (39) (741) (557) (1,607)Other(a) (67) 93 (26) — —
Balance at Dec. 29, 2001 6,435 2,000 19,263 2,791 30,489New Builds 585 165 748 146 1,644Acquisitions(b) 905 41 1,164 (3) 2,107Refranchising (174) (14) 188 — —Closures (224) (46) (649) (409) (1,328)Other (1) 2 10 1 12
Balance at Dec. 28, 2002 7,526 2,148 20,724 2,526 32,924
% of Total 23% 6% 63% 8% 100%
(a) Primarily includes 52 Company stores and 41 franchisee stores contributed to an unconsolidated affiliate in 2001.
(b) Includes units that existed at the date of the acquisition of YGR on May 7, 2002.
WORLDWIDE COMPANY RESTAURANT MARGIN
2002 2001 2000
Company sales 100.0% 100.0% 100.0%Food and paper 30.6 31.1 30.8Payroll and employee benefits 27.2 27.1 27.7Occupancy and other operating expenses 26.2 27.0 26.4
Company restaurant margin 16.0% 14.8% 15.1%
Restaurant margin as a percentage of sales increased approxi-mately 120 basis points in 2002. The increase included thefavorable impact of approximately 50 basis points from the adop-tion of SFAS 142, partially offset by the unfavorable impact ofapproximately 15 basis points from the YGR acquisition. U.S.restaurant margin increased approximately 80 basis points andInternational restaurant margin increased approximately 210basis points.
Restaurant margin as a percentage of sales decreasedapproximately 30 basis points in 2001. U.S. restaurant margin wasflat and International restaurant margin declined approximately120 basis points.
WORLDWIDE GENERAL AND ADMINISTRATIVEEXPENSES G&A expenses increased $117 million or 15% in 2002. Excluding theunfavorable impact of the YGR acquisition, G&A expenses increased10%. The increase was primarily driven by higher compensation-related costs and higher corporate and project spending.
G&A expenses decreased $34 million or 4% in 2001. Exclud-ing the favorable impact of lapping the fifty-third week in 2000,G&A expenses decreased 3%. The decrease was driven by lowercorporate and project spending, the formation of unconsolidatedaffiliates and refranchising. The decrease was partially offset byhigher compensation-related costs.
WORLDWIDE FRANCHISE AND LICENSE EXPENSESFranchise and license expenses decreased $10 million or 18% in2002. The decrease was primarily attributable to lower allowancesfor doubtful franchise and license fee receivables and the favor-able impact of lapping support costs related to the financialrestructuring of certain Taco Bell franchisees in 2001. The decreasewas partially offset by higher marketing support costs in certaininternational markets.
Franchise and license expenses increased $10 million or 20%in 2001. The increase was primarily due to support costs relatedto the financial restructuring of certain Taco Bell franchisees. Theincrease was partially offset by lower allowances for doubtful fran-chise and license fee receivables.
35.
Yum! Brands Inc.
WORLDWIDE OTHER (INCOME) EXPENSEOther (income) expense is comprised of equity (income) loss frominvestments in unconsolidated affiliates and foreign exchange net(gain) loss.
Other (income) expense increased $7 million or 28% in 2002.Equity income increased $3 million or 12%. The impact from for-eign currency translation was not significant on equity income. Theincrease included a $4 million favorable impact from the adoptionof SFAS 142.
Other (income) expense decreased $2 million or 8% in 2001.Equity income increased $1 million or 3%, after a 6% unfavorableimpact from foreign currency translation.
WORLDWIDE FACILITY ACTIONS NET LOSS (GAIN)We recorded facility actions net loss of $32 million in 2002 and$1 million in 2001 and facility actions net gain of $176 million in2000. See the Store Portfolio Strategy section for more detail of ourrefranchising and closure activities and Note 7 for a summary ofthe components of facility actions net loss (gain) by reportableoperating segment.
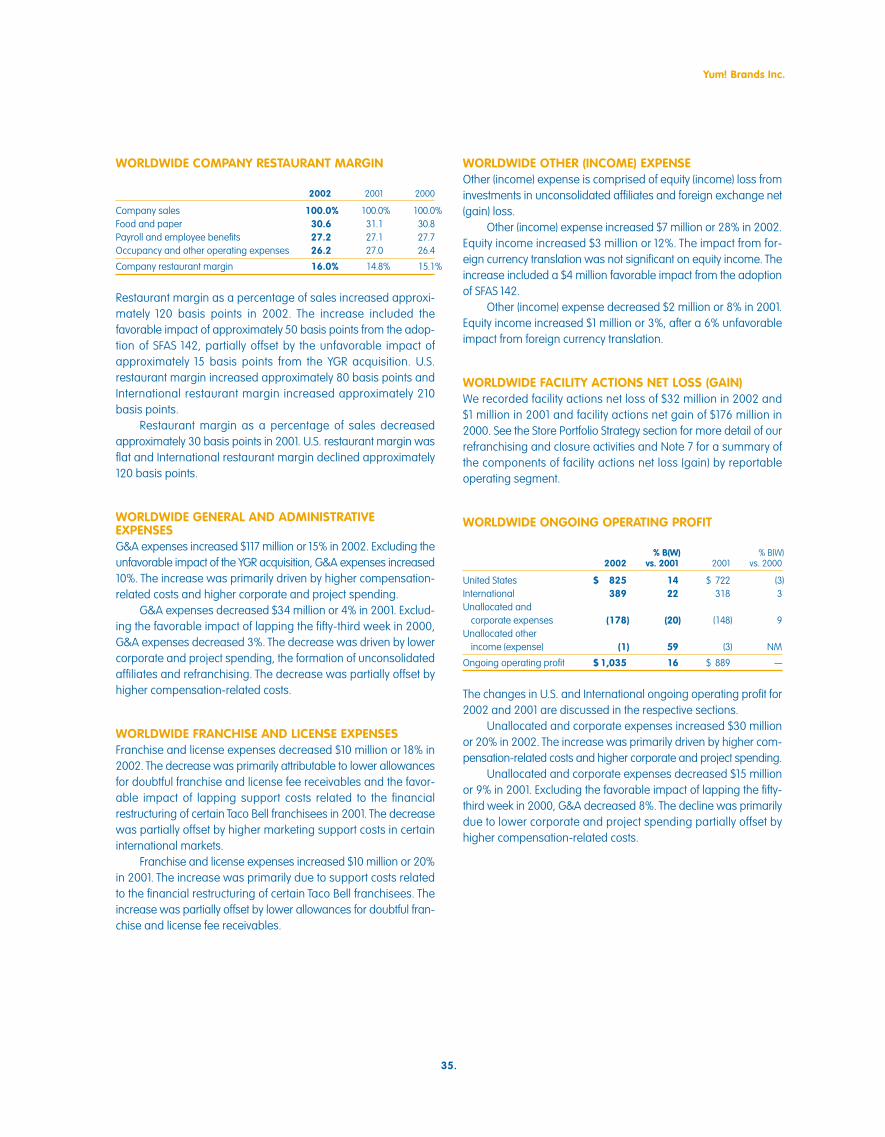
WORLDWIDE ONGOING OPERATING PROFIT
% B(W) % B(W)2002 vs. 2001 2001 vs. 2000
United States $ 825 14 $ 722 (3)International 389 22 318 3Unallocated and
corporate expenses (178) (20) (148) 9Unallocated other
income (expense) (1) 59 (3) NM
Ongoing operating profit $ 1,035 16 $ 889 —
The changes in U.S. and International ongoing operating profit for2002 and 2001 are discussed in the respective sections.
Unallocated and corporate expenses increased $30 millionor 20% in 2002. The increase was primarily driven by higher com-pensation-related costs and higher corporate and project spending.
Unallocated and corporate expenses decreased $15 millionor 9% in 2001. Excluding the favorable impact of lapping the fifty-third week in 2000, G&A decreased 8%. The decline was primarilydue to lower corporate and project spending partially offset byhigher compensation-related costs.
36.
WORLDWIDE INTEREST EXPENSE, NET
2002 2001 2000
Interest expense $ 180 $172 $190Interest income (8) (14) (14)
Interest expense, net $ 172 $158 $176
Net interest expense increased $14 million or 8% in 2002. Interestexpense increased $8 million or 5% in 2002. Excluding the impactof the YGR acquisition, interest expense decreased 12%. Thedecrease was driven by a reduction in our average debt balancepartially offset by an increase in our average interest rate. Ouraverage interest rate increased due to a reduction in our variable-rate borrowings using proceeds from the issuance of longer term,fixed-rate notes.
Net interest expense decreased $18 million or 10% in 2001.The decrease was primarily due to a decrease in our averageinterest rate.
WORLDWIDE INCOME TAXES
2002 2001 2000
ReportedIncome taxes $ 275 $ 241 $ 271Effective tax rate 32.1% 32.8% 39.6%
Ongoing(a)
Income taxes $ 270 $ 243 $ 268Effective tax rate 31.3% 33.1% 37.7%
(a) Excludes the effects of facility actions net loss (gain) and unusual items (income)expense. See Note 7 for a discussion of these items.
The following table reconciles the U.S. federal statutory tax rate toour ongoing effective tax rate:
2002 2001 2000
U.S. federal statutory tax rate 35.0% 35.0% 35.0%State income tax, net of federal tax benefit 2.0 1.9 1.8Foreign and U.S. tax effects attributable
to foreign operations (1.9) 0.2 (0.4)Adjustments relating to prior years (3.5) (2.2) 5.3Valuation allowance reversals — (1.7) (4.0)Other, net (0.3) (0.1) —
Ongoing effective tax rate 31.3% 33.1% 37.7%
The 2002 ongoing effective tax rate decreased 1.8 percentagepoints to 31.3%. The decrease in the ongoing effective tax rate wasprimarily due to adjustments related to prior years and an increasein the benefit from claiming credit against our current and futureU.S. income tax liability for foreign taxes paid, partially offset byreduced valuation allowance reversals. See Note 22 for a discus-sion of valuation allowances.
In 2002, the effective tax rate attributable to foreign opera-tions was lower than the U.S. federal statutory rate primarily dueto the benefit of claiming credit against our current and future U.S.income tax liability for foreign taxes paid.
The 2001 ongoing effective tax rate decreased 4.6 percent-age points to 33.1%. The decrease in the ongoing effective tax ratewas primarily due to adjustments related to prior years, partiallyoffset by reduced valuation allowance reversals.
In 2001, the effective tax rate attributable to foreign operationswas slightly higher than the U.S. federal statutory rate becauselosses of foreign operations for which no benefit could be currentlyrecognized and other adjustments more than offset the effect of claiming credit against our U.S. income tax liability for foreigntaxes paid.
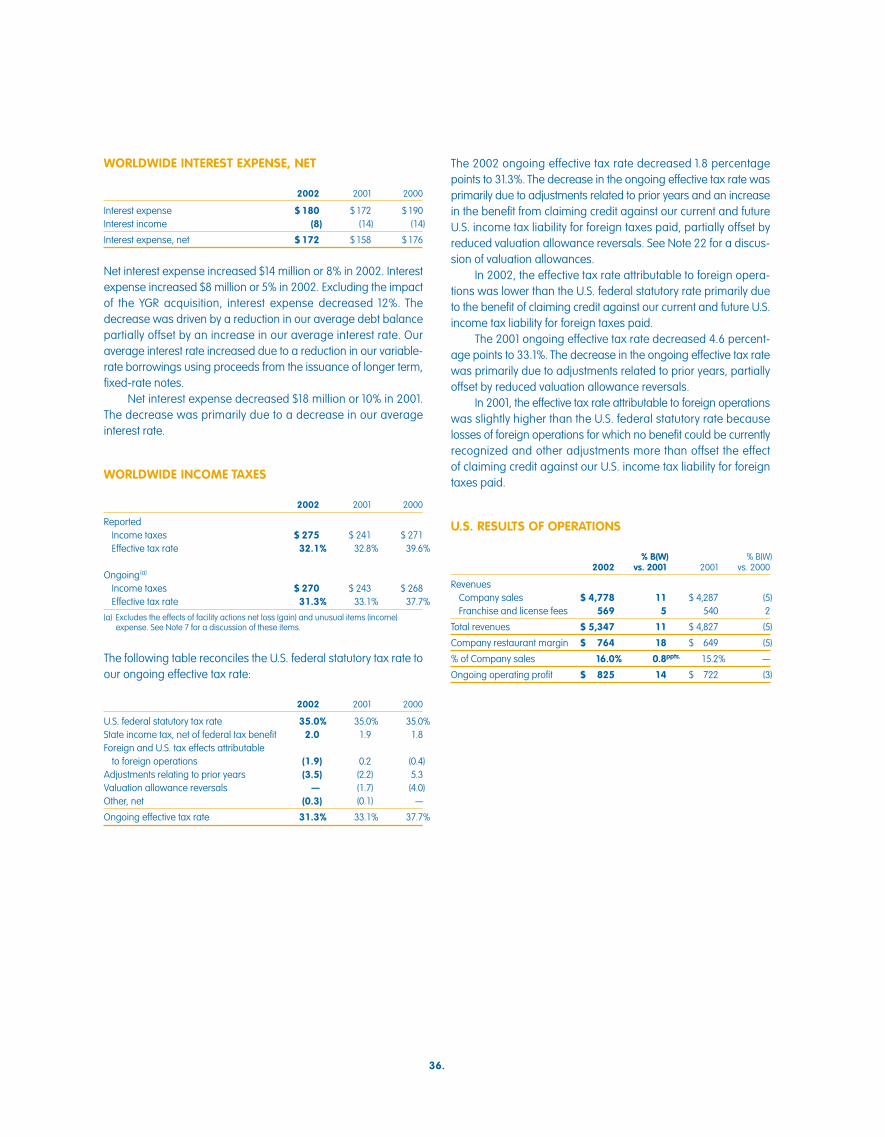
U.S. RESULTS OF OPERATIONS
% B(W) % B(W)2002 vs. 2001 2001 vs. 2000
RevenuesCompany sales $ 4,778 11 $ 4,287 (5)Franchise and license fees 569 5 540 2
Total revenues $ 5,347 11 $ 4,827 (5)
Company restaurant margin $ 764 18 $ 649 (5)
% of Company sales 16.0% 0.8ppts. 15.2% —
Ongoing operating profit $ 825 14 $ 722 (3)
37.
Yum! Brands Inc.
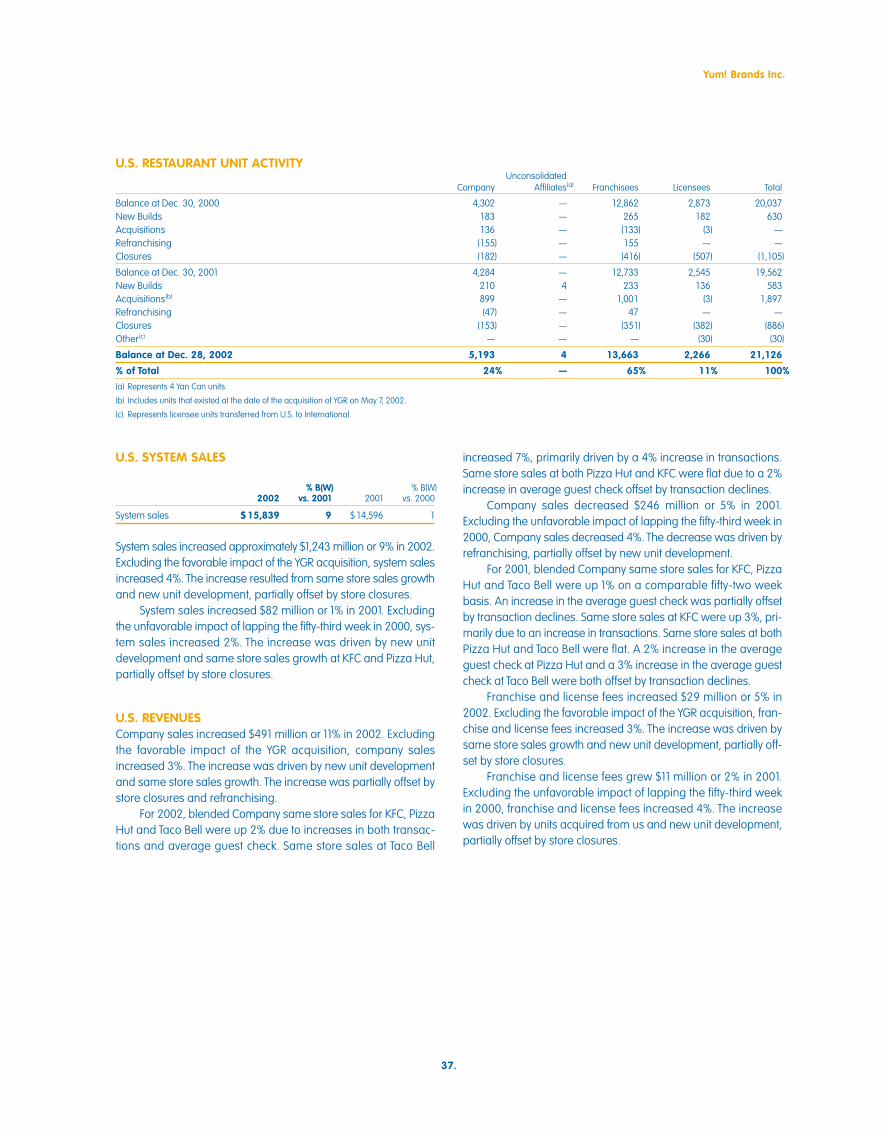
U.S. RESTAURANT UNIT ACTIVITYUnconsolidated
Company Affiliates(a) Franchisees Licensees Total
Balance at Dec. 30, 2000 4,302 — 12,862 2,873 20,037New Builds 183 — 265 182 630Acquisitions 136 — (133) (3) —Refranchising (155) — 155 — —Closures (182) — (416) (507) (1,105)
Balance at Dec. 30, 2001 4,284 — 12,733 2,545 19,562New Builds 210 4 233 136 583Acquisitions(b) 899 — 1,001 (3) 1,897Refranchising (47) — 47 — —Closures (153) — (351) (382) (886)Other(c) — — — (30) (30)
Balance at Dec. 28, 2002 5,193 4 13,663 2,266 21,126
% of Total 24% — 65% 11% 100%
(a) Represents 4 Yan Can units.
(b) Includes units that existed at the date of the acquisition of YGR on May 7, 2002.
(c) Represents licensee units transferred from U.S. to International.
U.S. SYSTEM SALES
% B(W) % B(W)2002 vs. 2001 2001 vs. 2000
System sales $15,839 9 $14,596 1
System sales increased approximately $1,243 million or 9% in 2002.Excluding the favorable impact of the YGR acquisition, system salesincreased 4%. The increase resulted from same store sales growthand new unit development, partially offset by store closures.
System sales increased $82 million or 1% in 2001. Excludingthe unfavorable impact of lapping the fifty-third week in 2000, sys-tem sales increased 2%. The increase was driven by new unitdevelopment and same store sales growth at KFC and Pizza Hut,partially offset by store closures.
U.S. REVENUESCompany sales increased $491 million or 11% in 2002. Excludingthe favorable impact of the YGR acquisition, company salesincreased 3%. The increase was driven by new unit developmentand same store sales growth. The increase was partially offset bystore closures and refranchising.
For 2002, blended Company same store sales for KFC, PizzaHut and Taco Bell were up 2% due to increases in both transac-tions and average guest check. Same store sales at Taco Bell
increased 7%, primarily driven by a 4% increase in transactions.Same store sales at both Pizza Hut and KFC were flat due to a 2%increase in average guest check offset by transaction declines.
Company sales decreased $246 million or 5% in 2001.Excluding the unfavorable impact of lapping the fifty-third week in2000, Company sales decreased 4%. The decrease was driven byrefranchising, partially offset by new unit development.
For 2001, blended Company same store sales for KFC, PizzaHut and Taco Bell were up 1% on a comparable fifty-two weekbasis. An increase in the average guest check was partially offsetby transaction declines. Same store sales at KFC were up 3%, pri-marily due to an increase in transactions. Same store sales at bothPizza Hut and Taco Bell were flat. A 2% increase in the averageguest check at Pizza Hut and a 3% increase in the average guestcheck at Taco Bell were both offset by transaction declines.
Franchise and license fees increased $29 million or 5% in2002. Excluding the favorable impact of the YGR acquisition, fran-chise and license fees increased 3%. The increase was driven bysame store sales growth and new unit development, partially off-set by store closures.
Franchise and license fees grew $11 million or 2% in 2001.Excluding the unfavorable impact of lapping the fifty-third weekin 2000, franchise and license fees increased 4%. The increasewas driven by units acquired from us and new unit development,partially offset by store closures.
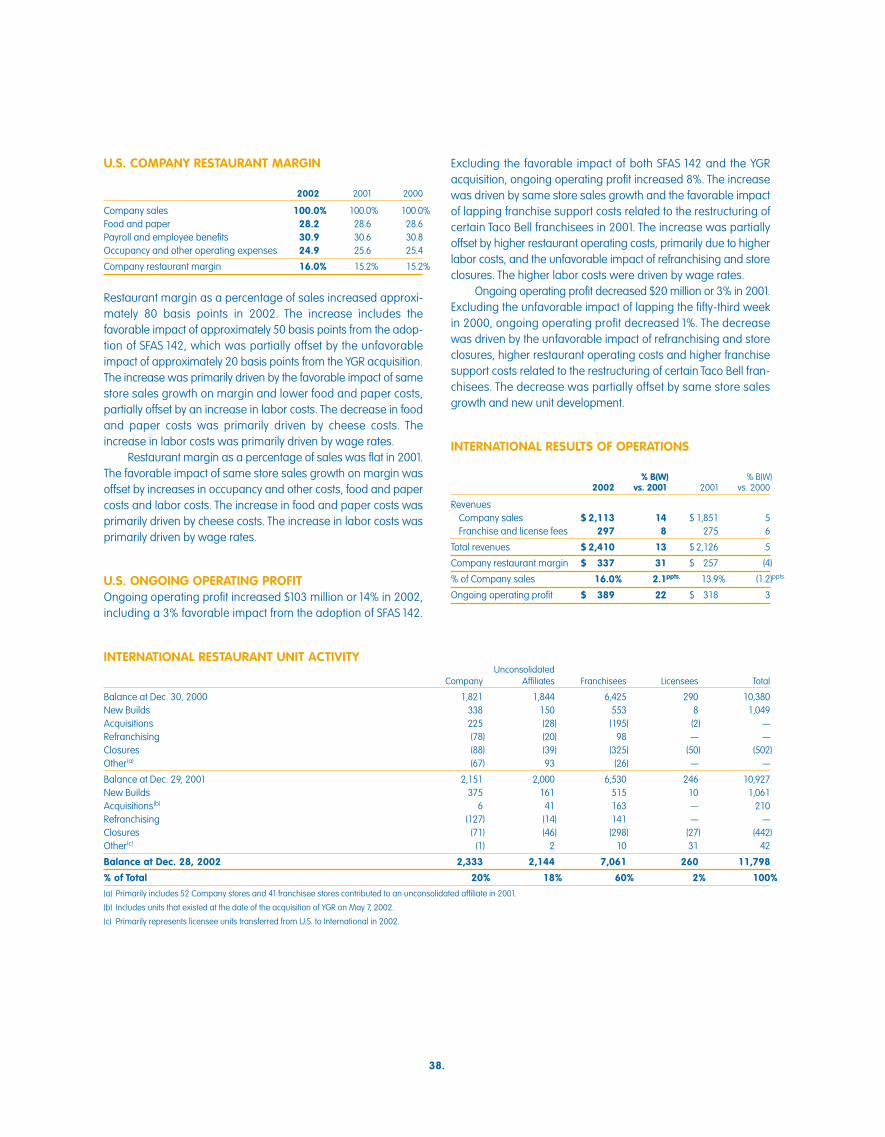
U.S. COMPANY RESTAURANT MARGIN
2002 2001 2000
Company sales 100.0% 100.0% 100.0%Food and paper 28.2 28.6 28.6Payroll and employee benefits 30.9 30.6 30.8Occupancy and other operating expenses 24.9 25.6 25.4
Company restaurant margin 16.0% 15.2% 15.2%
Restaurant margin as a percentage of sales increased approxi-mately 80 basis points in 2002. The increase includes thefavorable impact of approximately 50 basis points from the adop-tion of SFAS 142, which was partially offset by the unfavorableimpact of approximately 20 basis points from the YGR acquisition.The increase was primarily driven by the favorable impact of samestore sales growth on margin and lower food and paper costs,partially offset by an increase in labor costs. The decrease in foodand paper costs was primarily driven by cheese costs. Theincrease in labor costs was primarily driven by wage rates.
Restaurant margin as a percentage of sales was flat in 2001.The favorable impact of same store sales growth on margin wasoffset by increases in occupancy and other costs, food and papercosts and labor costs. The increase in food and paper costs wasprimarily driven by cheese costs. The increase in labor costs wasprimarily driven by wage rates.
U.S. ONGOING OPERATING PROFIT Ongoing operating profit increased $103 million or 14% in 2002,including a 3% favorable impact from the adoption of SFAS 142.
Excluding the favorable impact of both SFAS 142 and the YGRacquisition, ongoing operating profit increased 8%. The increasewas driven by same store sales growth and the favorable impactof lapping franchise support costs related to the restructuring ofcertain Taco Bell franchisees in 2001. The increase was partiallyoffset by higher restaurant operating costs, primarily due to higherlabor costs, and the unfavorable impact of refranchising and storeclosures. The higher labor costs were driven by wage rates.
Ongoing operating profit decreased $20 million or 3% in 2001.Excluding the unfavorable impact of lapping the fifty-third weekin 2000, ongoing operating profit decreased 1%. The decreasewas driven by the unfavorable impact of refranchising and storeclosures, higher restaurant operating costs and higher franchisesupport costs related to the restructuring of certain Taco Bell fran-chisees. The decrease was partially offset by same store salesgrowth and new unit development.
INTERNATIONAL RESULTS OF OPERATIONS
% B(W) % B(W)2002 vs. 2001 2001 vs. 2000
RevenuesCompany sales $ 2,113 14 $ 1,851 5Franchise and license fees 297 8 275 6
Total revenues $ 2,410 13 $ 2,126 5
Company restaurant margin $ 337 31 $ 257 (4)
% of Company sales 16.0% 2.1ppts. 13.9% (1.2)ppts.
Ongoing operating profit $ 389 22 $ 318 3
38.
INTERNATIONAL RESTAURANT UNIT ACTIVITYUnconsolidated
Company Affiliates Franchisees Licensees Total
Balance at Dec. 30, 2000 1,821 1,844 6,425 290 10,380New Builds 338 150 553 8 1,049Acquisitions 225 (28) (195) (2) —Refranchising (78) (20) 98 — —Closures (88) (39) (325) (50) (502)Other(a) (67) 93 (26) — —
Balance at Dec. 29, 2001 2,151 2,000 6,530 246 10,927New Builds 375 161 515 10 1,061Acquisitions(b) 6 41 163 — 210Refranchising (127) (14) 141 — —Closures (71) (46) (298) (27) (442)Other(c) (1) 2 10 31 42
Balance at Dec. 28, 2002 2,333 2,144 7,061 260 11,798
% of Total 20% 18% 60% 2% 100%
(a) Primarily includes 52 Company stores and 41 franchisee stores contributed to an unconsolidated affiliate in 2001.
(b) Includes units that existed at the date of the acquisition of YGR on May 7, 2002.
(c) Primarily represents licensee units transferred from U.S. to International in 2002.
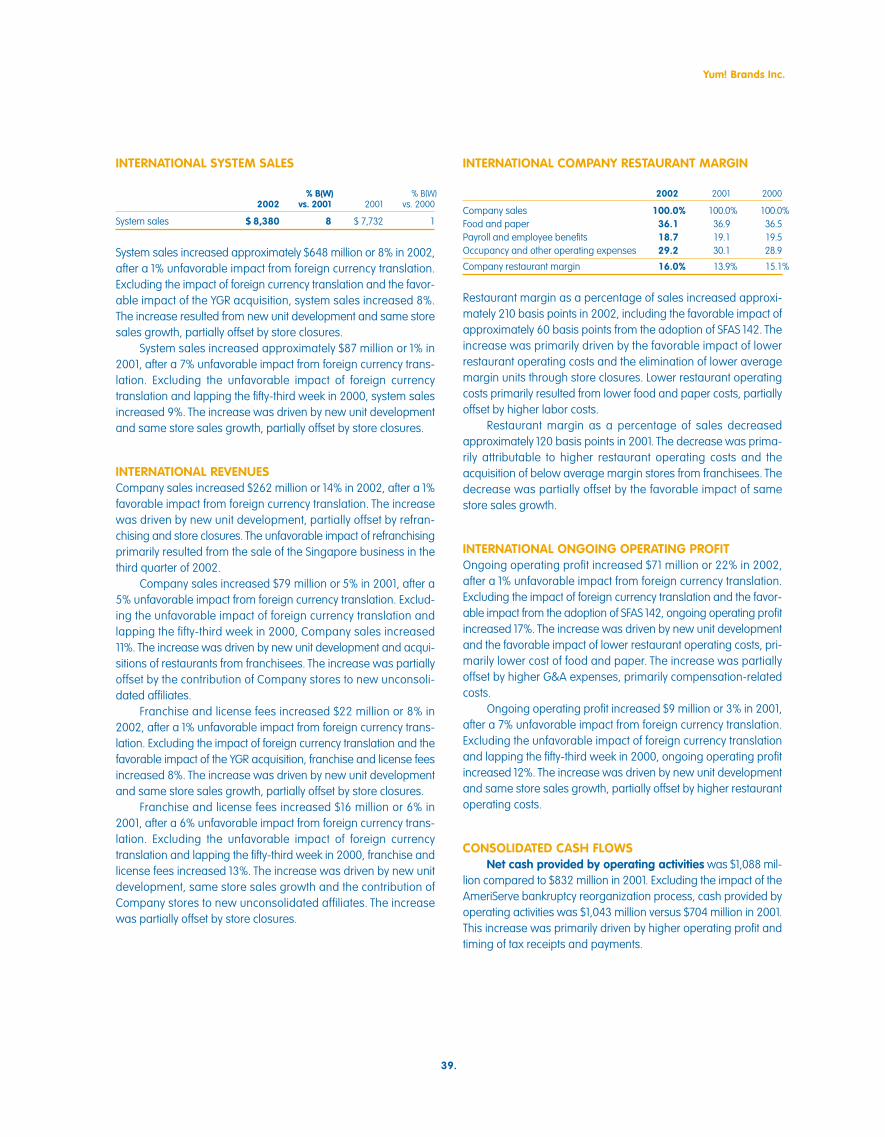
INTERNATIONAL SYSTEM SALES
% B(W) % B(W)2002 vs. 2001 2001 vs. 2000
System sales $ 8,380 8 $ 7,732 1
System sales increased approximately $648 million or 8% in 2002,after a 1% unfavorable impact from foreign currency translation.Excluding the impact of foreign currency translation and the favor-able impact of the YGR acquisition, system sales increased 8%.The increase resulted from new unit development and same storesales growth, partially offset by store closures.
System sales increased approximately $87 million or 1% in2001, after a 7% unfavorable impact from foreign currency trans-lation. Excluding the unfavorable impact of foreign currencytranslation and lapping the fifty-third week in 2000, system salesincreased 9%. The increase was driven by new unit developmentand same store sales growth, partially offset by store closures.
INTERNATIONAL REVENUESCompany sales increased $262 million or 14% in 2002, after a 1%favorable impact from foreign currency translation. The increasewas driven by new unit development, partially offset by refran-chising and store closures. The unfavorable impact of refranchisingprimarily resulted from the sale of the Singapore business in thethird quarter of 2002.
Company sales increased $79 million or 5% in 2001, after a5% unfavorable impact from foreign currency translation. Exclud-ing the unfavorable impact of foreign currency translation andlapping the fifty-third week in 2000, Company sales increased11%. The increase was driven by new unit development and acqui-sitions of restaurants from franchisees. The increase was partiallyoffset by the contribution of Company stores to new unconsoli-dated affiliates.
Franchise and license fees increased $22 million or 8% in2002, after a 1% unfavorable impact from foreign currency trans-lation. Excluding the impact of foreign currency translation and thefavorable impact of the YGR acquisition, franchise and license feesincreased 8%. The increase was driven by new unit developmentand same store sales growth, partially offset by store closures.
Franchise and license fees increased $16 million or 6% in2001, after a 6% unfavorable impact from foreign currency trans-lation. Excluding the unfavorable impact of foreign currencytranslation and lapping the fifty-third week in 2000, franchise andlicense fees increased 13%. The increase was driven by new unitdevelopment, same store sales growth and the contribution ofCompany stores to new unconsolidated affiliates. The increasewas partially offset by store closures.
INTERNATIONAL COMPANY RESTAURANT MARGIN
2002 2001 2000
Company sales 100.0% 100.0% 100.0%Food and paper 36.1 36.9 36.5Payroll and employee benefits 18.7 19.1 19.5Occupancy and other operating expenses 29.2 30.1 28.9
Company restaurant margin 16.0% 13.9% 15.1%
Restaurant margin as a percentage of sales increased approxi-mately 210 basis points in 2002, including the favorable impact ofapproximately 60 basis points from the adoption of SFAS 142. Theincrease was primarily driven by the favorable impact of lowerrestaurant operating costs and the elimination of lower averagemargin units through store closures. Lower restaurant operatingcosts primarily resulted from lower food and paper costs, partiallyoffset by higher labor costs.
Restaurant margin as a percentage of sales decreasedapproximately 120 basis points in 2001. The decrease was prima-rily attributable to higher restaurant operating costs and theacquisition of below average margin stores from franchisees. Thedecrease was partially offset by the favorable impact of samestore sales growth.
INTERNATIONAL ONGOING OPERATING PROFIT Ongoing operating profit increased $71 million or 22% in 2002,after a 1% unfavorable impact from foreign currency translation.Excluding the impact of foreign currency translation and the favor-able impact from the adoption of SFAS 142, ongoing operating profitincreased 17%. The increase was driven by new unit developmentand the favorable impact of lower restaurant operating costs, pri-marily lower cost of food and paper. The increase was partiallyoffset by higher G&A expenses, primarily compensation-relatedcosts.
Ongoing operating profit increased $9 million or 3% in 2001,after a 7% unfavorable impact from foreign currency translation.Excluding the unfavorable impact of foreign currency translationand lapping the fifty-third week in 2000, ongoing operating profitincreased 12%. The increase was driven by new unit developmentand same store sales growth, partially offset by higher restaurantoperating costs.
CONSOLIDATED CASH FLOWS Net cash provided by operating activities was $1,088 mil-
lion compared to $832 million in 2001. Excluding the impact of theAmeriServe bankruptcy reorganization process, cash provided byoperating activities was $1,043 million versus $704 million in 2001.This increase was primarily driven by higher operating profit andtiming of tax receipts and payments.
39.
Yum! Brands Inc.
In 2001, net cash provided by operating activities was $832million compared to $491 million in 2000. Excluding the impact of the AmeriServe bankruptcy reorganization process, cash pro-vided by operating activities was $704 million versus $734 millionin 2000.
Net cash used in investing activities was $885 million ver-sus $503 million in 2001. The increase in cash used was primarilydue to the acquisition of YGR and higher capital spending in 2002,partially offset by the acquisition of fewer restaurants from fran-chisees in 2002.
In 2001, net cash used in investing activities was $503 millionversus $237 million in 2000. The increase in cash used was pri-marily due to lower gross refranchising proceeds as a result ofselling fewer restaurants in 2001 and increased acquisitions ofrestaurants from franchisees and capital spending. The increasewas partially offset by lapping the funding of a debtor-in-posses-sion revolving credit facility to AmeriServe in 2000.
Although we report gross proceeds in our ConsolidatedStatements of Cash Flows, we also consider refranchising proceedson an “after-tax” basis. We define after-tax proceeds as grossrefranchising proceeds less the settlement of working capital lia-bilities (primarily accounts payable and property taxes) related tothe units refranchised and payment of taxes on the gains. Theafter-tax proceeds can be used to pay down debt or repurchaseshares. After-tax proceeds were approximately $71 million in 2002which reflects a 21% decrease from 2001. This decrease was dueto the refranchising of fewer restaurants in 2002 versus 2001.
Net cash used in financing activities was $187 million ver-sus $352 million in 2001. The decrease is primarily due to lowerdebt repayments and higher proceeds from stock option exercisesversus 2001, partially offset by higher shares repurchased in 2002.
In 2001, net cash used in financing activities was $352 millioncompared to $207 million in 2000. The increase in cash used isprimarily due to higher repayment of debt, partially offset by fewershares repurchased in 2001 compared to 2000.
In November 2002, our Board of Directors authorized a newshare repurchase program. This program authorizes us to repur-chase, through November 20, 2004, up to $300 million of ouroutstanding Common Stock (excluding applicable transactionfees). During 2002, we repurchased approximately 1.2 millionshares for approximately $28 million under this program.
In February 2001, our Board of Directors authorized a sharerepurchase program. This program authorized us to repurchaseup to $300 million of our outstanding Common Stock (excludingapplicable transaction fees). This share repurchase program wascompleted in 2002. During 2002, we repurchased approximately7.0 million shares for approximately $200 million under this pro-gram. During 2001, we repurchased approximately 4.8 millionshares for approximately $100 million.
40.
In September 1999, our Board of Directors authorized a sharerepurchase program. This program authorized us to repurchaseup to $350 million of our outstanding Common Stock (excludingapplicable transaction fees). This share repurchase program wascompleted in 2000. During 2000, we repurchased approximately12.8 million shares for approximately $216 million.
See Note 21 for a discussion of the share repurchase programs.
FINANCING ACTIVITIES On June 25, 2002, we closed on a new $1.4 billion senior unse-cured Revolving Credit Facility (the “New Credit Facility”). The NewCredit Facility replaced the existing bank credit agreement whichwas comprised of a senior unsecured Term Loan Facility and a$1.75 billion senior unsecured Revolving Credit Facility (collectivelyreferred to as the “Old Credit Facilities”) that were scheduled tomature on October 2, 2002. On December 27, 2002, we volun-tarily reduced our maximum borrowings under the New CreditFacility from $1.4 billion to $1.2 billion. The New Credit Facilitymatures on June 25, 2005. We used the initial borrowings underthe New Credit Facility to repay the indebtedness under the OldCredit Facilities.
The New Credit Facility is unconditionally guaranteed by ourprincipal domestic subsidiaries and contains other terms andprovisions (including representations, warranties, covenants, con-ditions and events of default) similar to those set forth in the OldCredit Facilities. Specifically, the New Credit Facility contains finan-cial covenants relating to maintenance of leverage and fixedcharge coverage ratios. The New Credit Facility also contains affir-mative and negative covenants including, among other things,limitations on certain additional indebtedness, guarantees ofindebtedness, cash dividends, aggregate non-U.S. investment andcertain other transactions as defined in the agreement.
Under the terms of the New Credit Facility, we may borrow upto the maximum borrowing limit less outstanding letters of credit.At December 28, 2002, our unused New Credit Facility totaled$0.9 billion, net of outstanding letters of credit of $0.2 billion. Theinterest rate for borrowings under the New Credit Facility rangesfrom 1.00% to 2.00% over the London Interbank Offered Rate(“LIBOR”) or 0.00% to 0.65% over an Alternate Base Rate, which isthe greater of the Prime Rate or the Federal Funds Effective Rateplus 1%. The exact spread over LIBOR or the Alternate Base Rate,as applicable, will depend upon our performance under specifiedfinancial criteria. Interest is payable at least quarterly. In the thirdquarter of 2002, we capitalized debt issuance costs of approxi-mately $9 million related to the New Credit Facility. These debtissuance costs will be amortized into interest expense over the lifeof the New Credit Facility.
In June 2002, we issued $400 million of 7.70% Senior Unse-cured Notes due July 1, 2012 (the “2012 Notes”). The net proceeds
from the issuance of the 2012 Notes were used to repay indebt-edness under the New Credit Facility. Interest on the 2012 Notes ispayable January 1 and July 1 of each year and commenced onJanuary 1, 2003. We capitalized debt issuance costs of approxi-mately $5 million related to the 2012 Notes in third quarter of 2002.Subsequent to this issuance, we have $150 million available forissuance under a $2 billion shelf registration filed in 1997.
As discussed in Note 4, upon the acquisition of YGR, weassumed approximately $168 million in present value of future rentobligations related to certain sale-leaseback agreements enteredinto by YGR involving approximately 350 LJS units. As a result ofliens held by the buyer/lessor on certain personal property withinthe units, the sale-leaseback agreements have been accountedfor as financings and are reflected as debt in our ConsolidatedFinancial Statements as of December 28, 2002. Rental paymentsmade under these agreements will be made on a monthly basisthrough 2019 with an effective interest rate of approximately 11%.
CONSOLIDATED FINANCIAL CONDITION Assets increased $975 million or 22% to $5.4 billion. This
increase was primarily due to the acquisition of YGR and theimpact of capital spending. The decrease in the allowance fordoubtful accounts from $77 million to $42 million was primarily theresult of recoveries related to the AmeriServe bankruptcy reor-ganization process (see Note 25) and the write-off of receivables
previously fully reserved. The increase in assets classified as heldfor sale is due primarily to classification of our Puerto Rico marketas held for sale during the fourth quarter of 2002.
Liabilities increased $485 million or 11% to $4.8 billion. Theincrease was primarily due to additional financing associated withthe acquisition of YGR. As discussed in Note 14, the decrease inshort-term borrowings of $550 million and the increase in long-term debt of $747 million are primarily the result of thereplacement of our Old Credit Facilities that were to expire inOctober 2002 with the New Credit Facility that will expire in 2005.The increase in current income taxes payable was primarily theresult of a reclassification from other liabilities and deferred cred-its for taxes that are now expected to be paid within the nexttwelve months.
LIQUIDITYOperating in the QSR industry allows us to generate substantialcash flows from the operations of our company stores and fromour franchise operations, which require a limited YUM investmentin operating assets. Typically, our cash flows include a significantamount of discretionary capital spending. Though a decline in rev-enues could adversely impact our cash flows from operations, webelieve our operating cash flows and ability to adjust discretionarycapital spending and borrow funds will allow us to meet our cashrequirements in 2003 and beyond.
41.
Yum! Brands Inc.
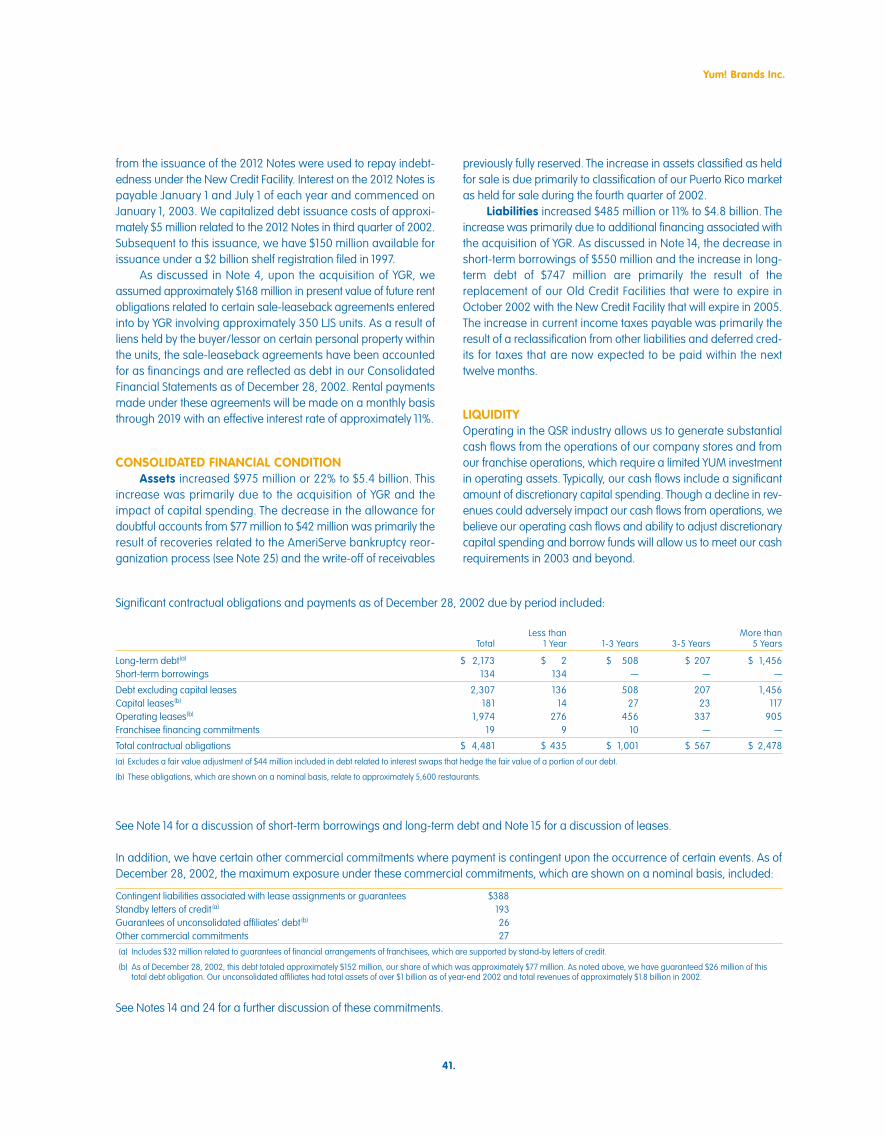
Significant contractual obligations and payments as of December 28, 2002 due by period included:
Less than More than Total 1 Year 1-3 Years 3-5 Years 5 Years
Long-term debt(a) $ 2,173 $ 2 $ 508 $ 207 $ 1,456Short-term borrowings 134 134 — — —
Debt excluding capital leases 2,307 136 508 207 1,456Capital leases(b) 181 14 27 23 117Operating leases(b) 1,974 276 456 337 905Franchisee financing commitments 19 9 10 — —
Total contractual obligations $ 4,481 $ 435 $ 1,001 $ 567 $ 2,478
(a) Excludes a fair value adjustment of $44 million included in debt related to interest swaps that hedge the fair value of a portion of our debt.
(b) These obligations, which are shown on a nominal basis, relate to approximately 5,600 restaurants.
See Note 14 for a discussion of short-term borrowings and long-term debt and Note 15 for a discussion of leases.
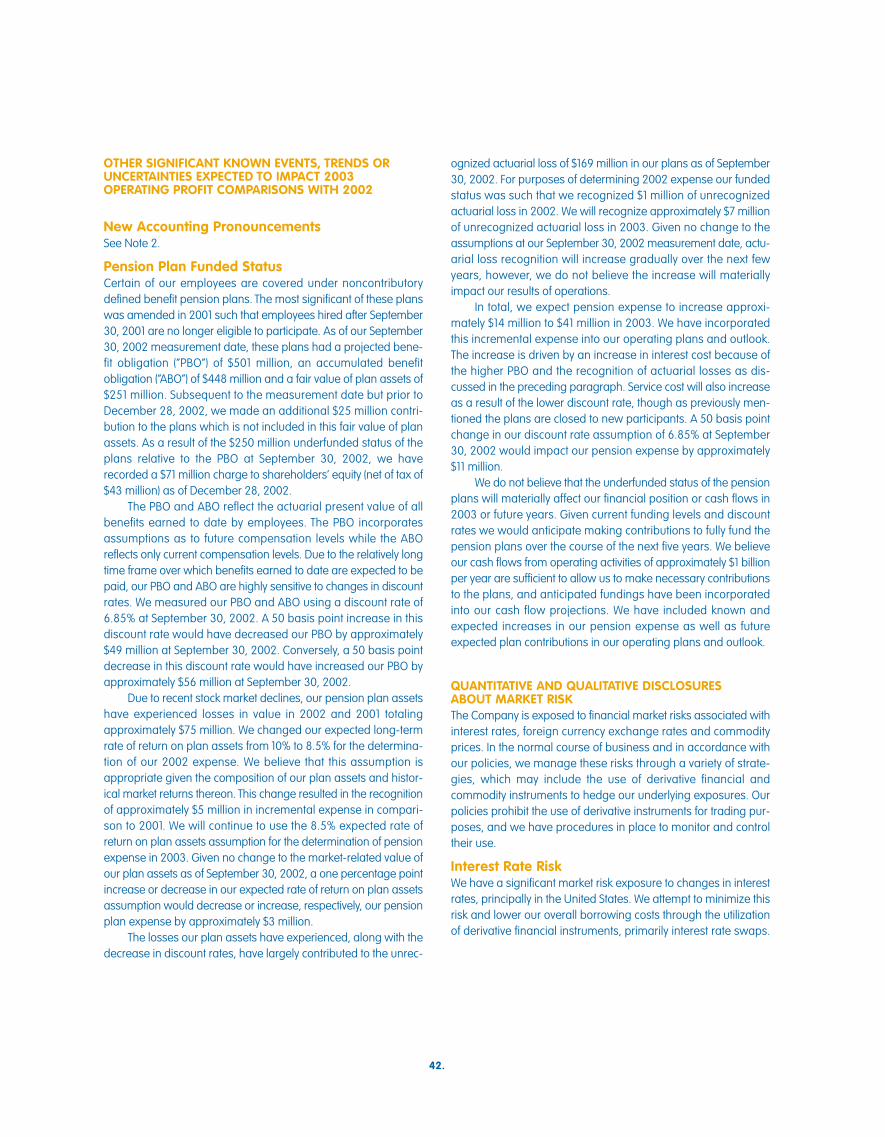
In addition, we have certain other commercial commitments where payment is contingent upon the occurrence of certain events. As ofDecember 28, 2002, the maximum exposure under these commercial commitments, which are shown on a nominal basis, included:
Contingent liabilities associated with lease assignments or guarantees $388Standby letters of credit (a) 193Guarantees of unconsolidated affiliates’ debt (b) 26Other commercial commitments 27
(a) Includes $32 million related to guarantees of financial arrangements of franchisees, which are supported by stand-by letters of credit.
(b) As of December 28, 2002, this debt totaled approximately $152 million, our share of which was approximately $77 million. As noted above, we have guaranteed $26 million of thistotal debt obligation. Our unconsolidated affiliates had total assets of over $1 billion as of year-end 2002 and total revenues of approximately $1.8 billion in 2002.
See Notes 14 and 24 for a further discussion of these commitments.
OTHER SIGNIFICANT KNOWN EVENTS, TRENDS ORUNCERTAINTIES EXPECTED TO IMPACT 2003OPERATING PROFIT COMPARISONS WITH 2002
New Accounting PronouncementsSee Note 2.
Pension Plan Funded StatusCertain of our employees are covered under noncontributorydefined benefit pension plans. The most significant of these planswas amended in 2001 such that employees hired after September30, 2001 are no longer eligible to participate. As of our September30, 2002 measurement date, these plans had a projected bene-fit obligation (“PBO”) of $501 million, an accumulated benefitobligation (“ABO”) of $448 million and a fair value of plan assets of$251 million. Subsequent to the measurement date but prior toDecember 28, 2002, we made an additional $25 million contri-bution to the plans which is not included in this fair value of planassets. As a result of the $250 million underfunded status of theplans relative to the PBO at September 30, 2002, we haverecorded a $71 million charge to shareholders’ equity (net of tax of$43 million) as of December 28, 2002.
The PBO and ABO reflect the actuarial present value of allbenefits earned to date by employees. The PBO incorporatesassumptions as to future compensation levels while the ABOreflects only current compensation levels. Due to the relatively longtime frame over which benefits earned to date are expected to bepaid, our PBO and ABO are highly sensitive to changes in discountrates. We measured our PBO and ABO using a discount rate of6.85% at September 30, 2002. A 50 basis point increase in thisdiscount rate would have decreased our PBO by approximately$49 million at September 30, 2002. Conversely, a 50 basis pointdecrease in this discount rate would have increased our PBO byapproximately $56 million at September 30, 2002.
Due to recent stock market declines, our pension plan assetshave experienced losses in value in 2002 and 2001 totalingapproximately $75 million. We changed our expected long-termrate of return on plan assets from 10% to 8.5% for the determina-tion of our 2002 expense. We believe that this assumption isappropriate given the composition of our plan assets and histor-ical market returns thereon. This change resulted in the recognitionof approximately $5 million in incremental expense in compari-son to 2001. We will continue to use the 8.5% expected rate ofreturn on plan assets assumption for the determination of pensionexpense in 2003. Given no change to the market-related value ofour plan assets as of September 30, 2002, a one percentage pointincrease or decrease in our expected rate of return on plan assetsassumption would decrease or increase, respectively, our pensionplan expense by approximately $3 million.
The losses our plan assets have experienced, along with thedecrease in discount rates, have largely contributed to the unrec-
ognized actuarial loss of $169 million in our plans as of September30, 2002. For purposes of determining 2002 expense our fundedstatus was such that we recognized $1 million of unrecognizedactuarial loss in 2002. We will recognize approximately $7 millionof unrecognized actuarial loss in 2003. Given no change to theassumptions at our September 30, 2002 measurement date, actu-arial loss recognition will increase gradually over the next fewyears, however, we do not believe the increase will materiallyimpact our results of operations.
In total, we expect pension expense to increase approxi-mately $14 million to $41 million in 2003. We have incorporatedthis incremental expense into our operating plans and outlook.The increase is driven by an increase in interest cost because ofthe higher PBO and the recognition of actuarial losses as dis-cussed in the preceding paragraph. Service cost will also increaseas a result of the lower discount rate, though as previously men-tioned the plans are closed to new participants. A 50 basis pointchange in our discount rate assumption of 6.85% at September30, 2002 would impact our pension expense by approximately$11 million.
We do not believe that the underfunded status of the pensionplans will materially affect our financial position or cash flows in2003 or future years. Given current funding levels and discountrates we would anticipate making contributions to fully fund thepension plans over the course of the next five years. We believeour cash flows from operating activities of approximately $1 billionper year are sufficient to allow us to make necessary contributionsto the plans, and anticipated fundings have been incorporatedinto our cash flow projections. We have included known andexpected increases in our pension expense as well as futureexpected plan contributions in our operating plans and outlook.
QUANTITATIVE AND QUALITATIVE DISCLOSURES ABOUT MARKET RISKThe Company is exposed to financial market risks associated withinterest rates, foreign currency exchange rates and commodityprices. In the normal course of business and in accordance withour policies, we manage these risks through a variety of strate-gies, which may include the use of derivative financial andcommodity instruments to hedge our underlying exposures. Ourpolicies prohibit the use of derivative instruments for trading pur-poses, and we have procedures in place to monitor and controltheir use.
Interest Rate RiskWe have a significant market risk exposure to changes in interestrates, principally in the United States. We attempt to minimize thisrisk and lower our overall borrowing costs through the utilizationof derivative financial instruments, primarily interest rate swaps.
42.