young massive proto-globular clusters in the local...
TRANSCRIPT

Searching for young, massive, proto-globular clusters in the local Universe
Ben Davies (Astrophysics Research Institute, Liverpool JMU)Ivan Cabrera-Ziri, Nate Bastian, Carmela Lardo, Steve Longmore, Maurizio Salaris, Katie Hollyhead

Omega Cen - ESOfew million Msun~12 Gyr
Antennae - HST few million Msun~7 Myr
globular clusters are still forming in the local universe

B-I
I
Surprise #2:multiple populations
in GCs. Can only be explained by
variations in He abundance
NGC2808 (Piotto et al. 2007)

(Carretta et al. 2006)
Surprise #3:Funny abundances…
anti-correlation between Na-O…

M5 (Cohen et al. 2002)
Surprise #3:Funny abundances…
anti-correlation between Na-O, C-N

CNO$bi-cycle!
Surprise #3:Funny abundances…
anti-correlation between Na-O, C-N Implies pollution by CNO-burning starsp,γ
19F
The Neon-Sodium Cycle
The third way of turning 1H into 4He is through the Ne-Na cycle.This cycle only occurs in extremely massive main-sequence stars (attemperatures of T6 ∼ 90 K) and cannot compete energetically withthe CNO cycle. However, it is important for changing the ratiosof these isotopes, especially 22Ne which can be an important sourceof neutrons for heavy element nucleosynthesis. The reactions of theNe-Na cycle are
20Ne + 1H −→ 21Na + γ (14.3.1)
21Na −→ 21Ne + e+ + νe (14.3.2)
21Ne + 1H −→ 22Na + γ (14.3.3)
22Na −→ 22Ne + e+ + νe (14.3.4)
22Ne + 1H −→ 23Na + γ (14.3.5)
23Na + 1H −→ 20Ne + 4He (14.3.6)
or
23Na + 1H −→ 24Mg + γ (14.3.7)
Compared to the strong-force interactions, the beta-decay reactionsoccur almost instanteously, so (14.3.2) and (14.3.4) can immediatelybe merged into (14.3.1) and (14.3.3). Also, note that the Ne-Na cycleis not really a complete cycle, since some 23Na nuclei will be fused to24Mg. The split between these two branches is about 50-50. Thus,after a few cycles, Ne and Na will become depleted, in favor of themore-inert isotope 24Mg.
Na-Ne Cycle

Conclusion:
Globular clusters contain discrete, multiple populations of stars: * “Primordial” (i.e. ~Solar mix of abundances) * “Secondary” (formed from CNO-polluted gas)
Possible CNO-burning polluters:* massive main-sequence stars * Intermediate mass AGB stars

Models for the formation of the “secondary population”

Models for the formation of the “secondary population”

Models for the formation of the “secondary population”
* The “spinstar” (or FRMS) scenario Decressin+ 2007
Padova, 23-26 September 2013 The World of Clusters - William Chantereau
4
FRMS scenario (Decressin et al. 2007b)
Credit: William Chantereau

Models for the formation of the “secondary population”
* The “spinstar” (or FRMS) scenario
Step
1
(taken from Krause+ 2006)

Models for the formation of the “secondary population”
* The “spinstar” (or FRMS) scenario
Step
1St
ep 2
(taken from Krause+ 2006)

Models for the formation of the “secondary population”
* The “spinstar” (or FRMS) scenario
Step
1St
ep 2
(taken from Krause+ 2006)

Models for the formation of the “secondary population”
* The “spinstar” (or FRMS) scenario
Step
2St
ep 3
(taken from Krause+ 2006)

Models for the formation of the “secondary population”
Prediction:
Star formation should be happening in star clusters with ages 5-30Myr.
* The “spinstar” (or FRMS) scenario

Models for the formation of the “secondary population”
* The “AGB-scenario”(e.g. D’Antona & Caloi 2004, Conroy & Spergel 2011)

Models for the formation of the “secondary population”
* The “AGB-scenario”(e.g. D’Antona & Caloi 2004, Conroy & Spergel 2011)

Models for the formation of the “secondary population”
* The “AGB-scenario”(e.g. D’Antona & Caloi 2004, Conroy & Spergel 2011)

Models for the formation of the “secondary population”
* The “AGB-scenario”
[~100 Myr]
(e.g. D’Antona & Caloi 2004, Conroy & Spergel 2011)

Models for the formation of the “secondary population”
* The “AGB-scenario”
Some predictions:
Massive clusters should show age spreads (or multiple bursts).
Clusters should retain ejecta and accreted gas for long periods.
To have enough material to form the 2nd gen stars, GCs must have been 10-100 times more massive than presently seen. [~100 Myr]
(e.g. D’Antona & Caloi 2004, Conroy & Spergel 2011)

Models for the formation of the “secondary population”
Testing the multi-pop GC models
All model predict that the “secondary” population is younger.
Impossible to see this in GCs (since Δt << t)
However, if YMCs are proto-globular clusters, we should be able to detect evidence of younger populations (or on-going SF).
Mission:
Study young/intermediate age star clusters, and search for evidence of on-going SF and/or multiple-age populations

Testing the multi-pop GC models
Evidence of on-going star formation?
Bastian et al. 2009

Testing the multi-pop GC models
Evidence of on-going star formation?
Bastian et al. 2009

Testing the multi-pop GC models
Evidence of on-going star formation?
Bastian et al. 2009

Testing the multi-pop GC models
Evidence of on-going star formation?
All non-detections - spanning a range of ages & masses
Can rule out presence of ionised gas > 100Msun
Can rule out that emission-line clusters are hiding an older population at mass ratios < 2:1
Bastian, Cabrera-Ziri, Davies, Larsen 2013a

Testing the multi-pop GC models
Evidence of on-going star formation?
Use AGB scenario to predict the amount of extinction due to cold dust:
Intermediate age (30-100Myr) clusters should have easily observable reddening/luminosity profiles.
They don’t.
4 S. N. Longmore
Figure 2. Predicted extinction in the V-band in magnitudes based on the gas profile in the D’Ercole et al. (2008) model (see text for details). The left and rightpanel show the extinction for the inner 30 pc and inner 8 pc, respectively. The colour scale, denoted by the colour bar, accentuates the intermediate extinctionregions at each spatial scale. In the left panel, the outer, intermediate and inner black contours show the radius at which the extinction equals 0.1, 1 and 10mag. In the right panel, the contours show extinctions of 0.5, 1, 5, 10, 50 and 100mag.
profile. For example, although highly improbable, if all the denseclumps happened to lie on the far (near) side of the cluster along ourline of sight, then they would sit behind (in front of) the majorityof stars. In which case they would block less (more) of the clusterlight than if they sat on the opposite side of the cluster along our lineof sight. This would result in a less (more) pronounced dip in theoptical/IR luminosity profile and less (more) pronounced optical/IRextinction features.
Therefore, combining these effects, if the optical/IR obser-vations can spatially resolve the size of the clumps, and theydo not all lie behind the stars, the clumps will be detectable asvery pronounced (much higher extinction than calculated in Fig-ure 1), patchy extinction features. If the observations cannot resolvethe typical size scale of the clumps, the expected extinction andgas/dust emission becomes more complicated to determine. Theoptical/IR luminosity profile will then depend on both the size dis-tribution and location of the clumps. Although certainly interesting,these more detailed calculations are beyond the scope of the currentpaper.
Unlike the case for optical/IR extinction, the emission fromthe gas and dust at mm wavelengths will be the same whether theclumps lie at the near or far side of the cluster. If the clumps areresolved, the higher gas volume density will lead to a much highergas and dust surface brightness (i.e. brightness temperatures), mak-ing the gas and dust much easier to detect than shown in Figure 3.If the clumps are not resolved, the observed brightness temperatureof the dust and gas emission will be reduced by approximately the“beam6 filling factor” – the total area subtended by all the clumpswithin the beam, divided by the beam area.
In summary, if observations can resolve the typical size scaleof any gas substructures, the assumption of uniform volume fill-ing factor represents a conservative estimate of the expected peak
6 The ‘beam’ is effectively the resolution of the observations.
Figure 3. Expected flux density at a wavelength of 1mm for gas of a givenmass, (dust) temperature and metallicity as a function of distance. The bluedotted line shows the predicted flux based on the D’Ercole et al. (2008)model (see text for details). The horizontal dashed line shows the approxi-mate ALMA 10σ sensitivity limit at this wavelength for a one hour observa-tion. The vertical dotted lines show the distances to some nearby galaxies.Large gas reservoirs should be readily detectable towards young massiveclusters in many nearby systems.
extinction and minimum expected gas and dust brightness temper-ature.
4 DISCUSSION
Given current instrumental limitations, it would be extremely dif-ficult to detect the presence of gas reservoirs from the luminos-ity profile or mm continuum emission in young globular clustersat high redshift. However, these features should be readily de-tectable in clusters of similar stellar mass and density with ages
Av (m
ag)
Longmore 2015

Testing the multi-pop GC models
Evidence of on-going star formation?
ALMA observations of the AntennaeCabrera-Ziri et al. 2015
No gas detected in CO (3-2) (upper limit of <10% cluster mass)
50-200 Myr

Testing the multi-pop GC models
Evidence of a second, younger population?
NGC 34 Cluster 1

Testing the multi-pop GC models
Evidence of a second, younger population?
NGC 34 Cluster 1
Cabrera-Ziri, Bastian, Davies et al. 2014
data (Schweizer & Seitzer 2007)single population fit (100Myr)two populationsthree populations
residuals…

Testing the multi-pop GC models
Evidence of a second, younger population?
NGC 34 Cluster 1

Testing the multi-pop GC models
Evidence of a second, younger population?
NGC 34 Cluster 1
An SSP Young Massive Cluster in NGC 34 5
Figure 3. Results of fitting the normalised spectrum of Cluster1 with each element of the 100 Myr extended grid. This grid showthat the solutions are consistent with the DynBaS1D results (i.e.an SSP of ∼ 100 Myr).
(Bastian et al. 2013a). Hence, we can reject all solutionswith these ages. As Fig. 2 shows, the “good fits” are onlyfor massive and older Pop. 2 ages (Pop. 2 ≃ Pop 1.) or veryyoung Pop. 2 and with small mass ratios (M2 ≪ M1) whenwe increase the age of the main population Pop. 1.
We also carried out an additional experiment with agrid containing a Pop. 1 of 100 Myr (massive), but for thisgrid we allowed the Pop. 2 (less massive) ages to reach ∼ 300Myr (i.e. to exceed the age of Pop. 1), with the results shownin Fig. 3. In this figure we can see a tendency where thebest solution (fits) is the 100 Myr SSP (row with Pop. 2log (yr) = 8.0) with the quality of the fits (hence the like-lihood of the solutions) gradually degrading in the direc-tion of old massive Pop. 2, or young and less massive ones.With a main population of 100 Myr, the spectrum does notchange significantly when adding a small amount of mass ina secondary population with older/younger ages, or a largeamount of mass with an age close to 100 Myr. From Figs. 2 &3 we can see that there are regions of parameter space wherea second generation could be hidden. By looking at otheryoung massive clusters with ages between 12 and 500 Myr,we should be able to sample all of these regions, and removeany degeneracies. This will be carried out in a future work(Cabrera-Ziri et al. in prep.).
We emphasize that while experimenting with differentways to define the continuum in our data and models, defin-ing different wavelength ranges for the fits, and assuming dif-ferent S/N for the data we always found that one-population
solutions performed better than multiple-population solu-
tions. Almost all of these solutions lay within 10% of thereported age (100 Myr). We found the same behaviour (SSPsolutions) when we performed the same trials with differentmetallicities.
5 DISCUSSION
The tests performed (shown in Figs. 2 & 3) show that it ispossible to construct a spectrum similar to that of Cluster 1by combing SSP models of specific ages and mass fractions.However, we note that the DynBaS1D solution to the ob-served spectra is preferred to the multiple generation modelspectra. We use Fig. 3 to estimate an error for DynBaS1Dsolution of 30 Myr i.e. an age for Cluster 1 of 100± 30 Myrand a mass of 1.9±0.4×10⁷ M⊙. As an exploratory theoret-ical experiment, we also performed DynBaS fitting for thegrids, and we found that multiple-population solutions (i.e.DynBaS2D and DynBaS3D) did better than DynBaS1D so-lutions. From this we conclude that if multiple populationslike the ones of our grids were actually present in this clus-ter, we would have been able to recover them with DynBaS.In a future work, we will present these tests and a detailedanalysis of them. Additionally, we will assess the uncertain-ties introduced with the choice of selected stellar populationmodels.
6 CONCLUSIONS
By fitting the normalised spectrum of Cluster 1 in NGC 34with model SSP spectra, we have determined an age of 100±30 Myr for the cluster and estimated a mass of 1.9 ± 0.4 ×10⁷ M⊙, based on published photometry and SSP models forthis age. We do not find evidence for multiple star formationepisodes, and we can confidently rule out the presence ofa 2nd generation of stars for ages outside the range from70 to 130 Myr with mass ratios between the second andfirst generation greater than 0.1. These results are consistentwith GC formation scenarios where multiple generations ofstars are separated by < 30 Myr in age (e.g. Decressin et al.2009; de Mink et al. 2009) or scenarios that do not invokemultiple star forming events (Bastian et al. 2013b).
Our results do not support any GC formation scenariosthat involve multiple generations of stars separated by > 30Myr in age. However, it is still possible that a secondaryburst might happen in the future (i.e. with an age differ-ence between the first and second generation of stars thatis greater than 100 Myr). To improve our understanding ofhow GCs form, further spectroscopic studies of young mas-sive clusters covering a wide range of ages are needed. In aseparate paper, Cabrera-Ziri et al. (in prep.) determine theSFH of 6 young (12–500 Myr) massive (> 106 M⊙) clustersfrom an ongoing spectroscopic survey.
These result are consistent with the findings ofBastian & Silva-Villa (2013), who do not find any large agespreads in young massive LMC clusters, and they also dis-agree with GC formation scenarios that predict extendedSFHs (e.g. Conroy & Spergel 2011).
Finally, we conclude that DynBaS capabilities (i.e. SEDfitting of just a few ages) are ideal for the study of the in-tegrated spectra of young clusters, given that they reducesignificantly the amounts of non-genuine components (i.e.ages) compared to traditional SED fitting algorithms, con-sequently simplifying the analysis of the results.
c⃝ 2014 RAS, MNRAS 000, 1–??
measured age of cluster

Testing the multi-pop GC models
Evidence of a second, younger population?
NGC 34 Cluster 1
An SSP Young Massive Cluster in NGC 34 5
Figure 3. Results of fitting the normalised spectrum of Cluster1 with each element of the 100 Myr extended grid. This grid showthat the solutions are consistent with the DynBaS1D results (i.e.an SSP of ∼ 100 Myr).
(Bastian et al. 2013a). Hence, we can reject all solutionswith these ages. As Fig. 2 shows, the “good fits” are onlyfor massive and older Pop. 2 ages (Pop. 2 ≃ Pop 1.) or veryyoung Pop. 2 and with small mass ratios (M2 ≪ M1) whenwe increase the age of the main population Pop. 1.
We also carried out an additional experiment with agrid containing a Pop. 1 of 100 Myr (massive), but for thisgrid we allowed the Pop. 2 (less massive) ages to reach ∼ 300Myr (i.e. to exceed the age of Pop. 1), with the results shownin Fig. 3. In this figure we can see a tendency where thebest solution (fits) is the 100 Myr SSP (row with Pop. 2log (yr) = 8.0) with the quality of the fits (hence the like-lihood of the solutions) gradually degrading in the direc-tion of old massive Pop. 2, or young and less massive ones.With a main population of 100 Myr, the spectrum does notchange significantly when adding a small amount of mass ina secondary population with older/younger ages, or a largeamount of mass with an age close to 100 Myr. From Figs. 2 &3 we can see that there are regions of parameter space wherea second generation could be hidden. By looking at otheryoung massive clusters with ages between 12 and 500 Myr,we should be able to sample all of these regions, and removeany degeneracies. This will be carried out in a future work(Cabrera-Ziri et al. in prep.).
We emphasize that while experimenting with differentways to define the continuum in our data and models, defin-ing different wavelength ranges for the fits, and assuming dif-ferent S/N for the data we always found that one-population
solutions performed better than multiple-population solu-
tions. Almost all of these solutions lay within 10% of thereported age (100 Myr). We found the same behaviour (SSPsolutions) when we performed the same trials with differentmetallicities.
5 DISCUSSION
The tests performed (shown in Figs. 2 & 3) show that it ispossible to construct a spectrum similar to that of Cluster 1by combing SSP models of specific ages and mass fractions.However, we note that the DynBaS1D solution to the ob-served spectra is preferred to the multiple generation modelspectra. We use Fig. 3 to estimate an error for DynBaS1Dsolution of 30 Myr i.e. an age for Cluster 1 of 100± 30 Myrand a mass of 1.9±0.4×10⁷ M⊙. As an exploratory theoret-ical experiment, we also performed DynBaS fitting for thegrids, and we found that multiple-population solutions (i.e.DynBaS2D and DynBaS3D) did better than DynBaS1D so-lutions. From this we conclude that if multiple populationslike the ones of our grids were actually present in this clus-ter, we would have been able to recover them with DynBaS.In a future work, we will present these tests and a detailedanalysis of them. Additionally, we will assess the uncertain-ties introduced with the choice of selected stellar populationmodels.
6 CONCLUSIONS
By fitting the normalised spectrum of Cluster 1 in NGC 34with model SSP spectra, we have determined an age of 100±30 Myr for the cluster and estimated a mass of 1.9 ± 0.4 ×10⁷ M⊙, based on published photometry and SSP models forthis age. We do not find evidence for multiple star formationepisodes, and we can confidently rule out the presence ofa 2nd generation of stars for ages outside the range from70 to 130 Myr with mass ratios between the second andfirst generation greater than 0.1. These results are consistentwith GC formation scenarios where multiple generations ofstars are separated by < 30 Myr in age (e.g. Decressin et al.2009; de Mink et al. 2009) or scenarios that do not invokemultiple star forming events (Bastian et al. 2013b).
Our results do not support any GC formation scenariosthat involve multiple generations of stars separated by > 30Myr in age. However, it is still possible that a secondaryburst might happen in the future (i.e. with an age differ-ence between the first and second generation of stars thatis greater than 100 Myr). To improve our understanding ofhow GCs form, further spectroscopic studies of young mas-sive clusters covering a wide range of ages are needed. In aseparate paper, Cabrera-Ziri et al. (in prep.) determine theSFH of 6 young (12–500 Myr) massive (> 106 M⊙) clustersfrom an ongoing spectroscopic survey.
These result are consistent with the findings ofBastian & Silva-Villa (2013), who do not find any large agespreads in young massive LMC clusters, and they also dis-agree with GC formation scenarios that predict extendedSFHs (e.g. Conroy & Spergel 2011).
Finally, we conclude that DynBaS capabilities (i.e. SEDfitting of just a few ages) are ideal for the study of the in-tegrated spectra of young clusters, given that they reducesignificantly the amounts of non-genuine components (i.e.ages) compared to traditional SED fitting algorithms, con-sequently simplifying the analysis of the results.
c⃝ 2014 RAS, MNRAS 000, 1–??
measured age of cluster “permitted”

Testing the multi-pop GC models
Evidence of a second, younger population?
NGC 34 Cluster 1
An SSP Young Massive Cluster in NGC 34 5
Figure 3. Results of fitting the normalised spectrum of Cluster1 with each element of the 100 Myr extended grid. This grid showthat the solutions are consistent with the DynBaS1D results (i.e.an SSP of ∼ 100 Myr).
(Bastian et al. 2013a). Hence, we can reject all solutionswith these ages. As Fig. 2 shows, the “good fits” are onlyfor massive and older Pop. 2 ages (Pop. 2 ≃ Pop 1.) or veryyoung Pop. 2 and with small mass ratios (M2 ≪ M1) whenwe increase the age of the main population Pop. 1.
We also carried out an additional experiment with agrid containing a Pop. 1 of 100 Myr (massive), but for thisgrid we allowed the Pop. 2 (less massive) ages to reach ∼ 300Myr (i.e. to exceed the age of Pop. 1), with the results shownin Fig. 3. In this figure we can see a tendency where thebest solution (fits) is the 100 Myr SSP (row with Pop. 2log (yr) = 8.0) with the quality of the fits (hence the like-lihood of the solutions) gradually degrading in the direc-tion of old massive Pop. 2, or young and less massive ones.With a main population of 100 Myr, the spectrum does notchange significantly when adding a small amount of mass ina secondary population with older/younger ages, or a largeamount of mass with an age close to 100 Myr. From Figs. 2 &3 we can see that there are regions of parameter space wherea second generation could be hidden. By looking at otheryoung massive clusters with ages between 12 and 500 Myr,we should be able to sample all of these regions, and removeany degeneracies. This will be carried out in a future work(Cabrera-Ziri et al. in prep.).
We emphasize that while experimenting with differentways to define the continuum in our data and models, defin-ing different wavelength ranges for the fits, and assuming dif-ferent S/N for the data we always found that one-population
solutions performed better than multiple-population solu-
tions. Almost all of these solutions lay within 10% of thereported age (100 Myr). We found the same behaviour (SSPsolutions) when we performed the same trials with differentmetallicities.
5 DISCUSSION
The tests performed (shown in Figs. 2 & 3) show that it ispossible to construct a spectrum similar to that of Cluster 1by combing SSP models of specific ages and mass fractions.However, we note that the DynBaS1D solution to the ob-served spectra is preferred to the multiple generation modelspectra. We use Fig. 3 to estimate an error for DynBaS1Dsolution of 30 Myr i.e. an age for Cluster 1 of 100± 30 Myrand a mass of 1.9±0.4×10⁷ M⊙. As an exploratory theoret-ical experiment, we also performed DynBaS fitting for thegrids, and we found that multiple-population solutions (i.e.DynBaS2D and DynBaS3D) did better than DynBaS1D so-lutions. From this we conclude that if multiple populationslike the ones of our grids were actually present in this clus-ter, we would have been able to recover them with DynBaS.In a future work, we will present these tests and a detailedanalysis of them. Additionally, we will assess the uncertain-ties introduced with the choice of selected stellar populationmodels.
6 CONCLUSIONS
By fitting the normalised spectrum of Cluster 1 in NGC 34with model SSP spectra, we have determined an age of 100±30 Myr for the cluster and estimated a mass of 1.9 ± 0.4 ×10⁷ M⊙, based on published photometry and SSP models forthis age. We do not find evidence for multiple star formationepisodes, and we can confidently rule out the presence ofa 2nd generation of stars for ages outside the range from70 to 130 Myr with mass ratios between the second andfirst generation greater than 0.1. These results are consistentwith GC formation scenarios where multiple generations ofstars are separated by < 30 Myr in age (e.g. Decressin et al.2009; de Mink et al. 2009) or scenarios that do not invokemultiple star forming events (Bastian et al. 2013b).
Our results do not support any GC formation scenariosthat involve multiple generations of stars separated by > 30Myr in age. However, it is still possible that a secondaryburst might happen in the future (i.e. with an age differ-ence between the first and second generation of stars thatis greater than 100 Myr). To improve our understanding ofhow GCs form, further spectroscopic studies of young mas-sive clusters covering a wide range of ages are needed. In aseparate paper, Cabrera-Ziri et al. (in prep.) determine theSFH of 6 young (12–500 Myr) massive (> 106 M⊙) clustersfrom an ongoing spectroscopic survey.
These result are consistent with the findings ofBastian & Silva-Villa (2013), who do not find any large agespreads in young massive LMC clusters, and they also dis-agree with GC formation scenarios that predict extendedSFHs (e.g. Conroy & Spergel 2011).
Finally, we conclude that DynBaS capabilities (i.e. SEDfitting of just a few ages) are ideal for the study of the in-tegrated spectra of young clusters, given that they reducesignificantly the amounts of non-genuine components (i.e.ages) compared to traditional SED fitting algorithms, con-sequently simplifying the analysis of the results.
c⃝ 2014 RAS, MNRAS 000, 1–??
measured age of cluster
For a mass-ratio ~ 1:1, we can rule out any star-formation
~20Myr after the first burst
“permitted”

Niederhofer+ 2015
Testing the multi-pop GC models
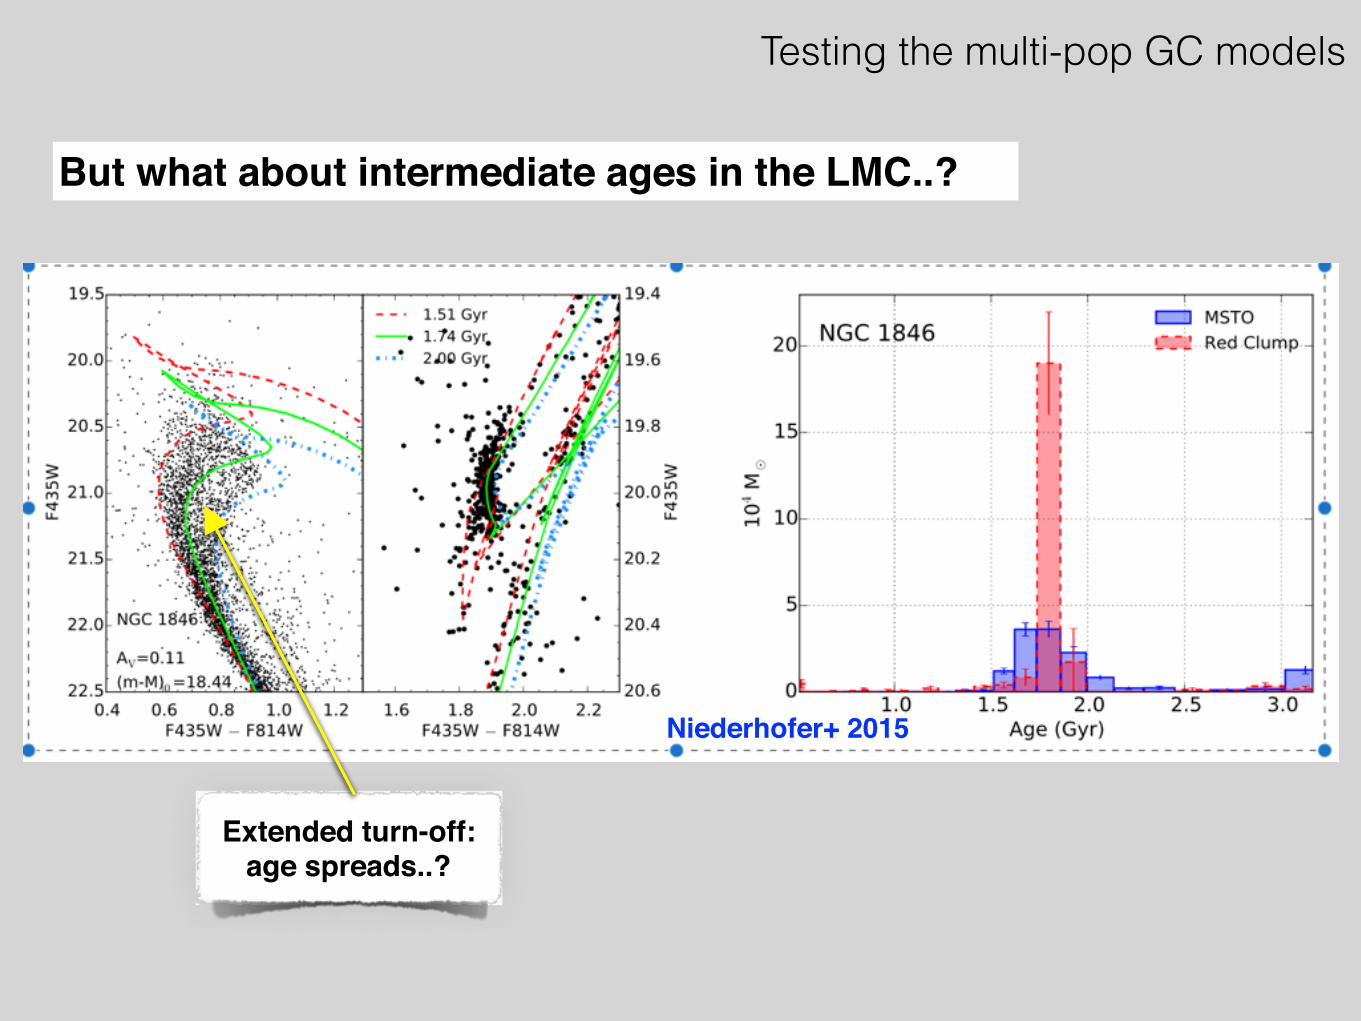
But what about intermediate ages in the LMC..?
Niederhofer+ 2015
Testing the multi-pop GC models
But what about intermediate ages in the LMC..?
Extended turn-off: age spreads..?

Niederhofer+ 2015
Testing the multi-pop GC models
But what about intermediate ages in the LMC..?
Extended turn-off: age spreads..?
Red clump not extended, so
probably not…

Testing the multi-pop GC models
Summary so far…
Young / intermediate age clusters in local Universe match GCs for mass, size.
AGB-scenarios for GC formation predict 2nd-generation of star-formation ~30-100Myr after the first.
Never been seen….

Testing the multi-pop GC models
More general problems for all GC-formation scenarios…
Mass budget / mass-loss
Most formation models struggle to make a 2nd pop with M2>0.05M1
Need to lose large fraction of pop-1 without losing any pop-2…

Testing the multi-pop GC models
More general problems for all GC-formation scenarios…
Mass budget / mass-loss
35 GCs (without Fe spreads)Bastian & Lardo 2015

Testing the multi-pop GC models
More general problems for all GC-formation scenarios…
Mass budget / mass-loss
35 GCs (without Fe spreads)
fenriched(initial) = 0.05
95% FG lost
90% FG lost
98% FG lost
Bastian & Lardo 2015

Testing the multi-pop GC models
More general problems for all GC-formation scenarios…
Mass budget / mass-loss
35 GCs (without Fe spreads)
fenriched(initial) = 0.05
95% FG lost
90% FG lost
98% FG lost
fenriched(initial) = 0.05
Mass loss in a tidal field
Mass loss due to gas
expulsion
Bastian & Lardo 2015

Testing the multi-pop GC models
More general problems for all GC-formation scenarios…
Relative abundance trendsab
unda
nce
time
abundance yields

Testing the multi-pop GC models
More general problems for all GC-formation scenarios…
Relative abundance trendsab
unda
nce
time
abundance yields He

Testing the multi-pop GC models
More general problems for all GC-formation scenarios…
Relative abundance trendsab
unda
nce
time
abundance yields He
Na
O

Testing the multi-pop GC models
More general problems for all GC-formation scenarios…
Relative abundance trends
Bastian, Cabrera-Ziri, Salaris 2015

Testing the multi-pop GC models
More general problems for all GC-formation scenarios…
Relative abundance trends
Bastian, Cabrera-Ziri, Salaris 2015

Testing the multi-pop GC models
More general problems for all GC-formation scenarios…
Relative abundance trends
‘allowed’
Bastian, Cabrera-Ziri, Salaris 2015

Testing the multi-pop GC models
More general problems for all GC-formation scenarios…
Relative abundance trends
‘allowed’
Bastian, Cabrera-Ziri, Salaris 2015
Too much Na-O processing for amount of He?

Testing the multi-pop GC models
More general problems for all GC-formation scenarios…
Relative abundance trends
Bastian, Cabrera-Ziri, Salaris 2015
Too much Na-O processing for amount of He?
AGBs AGBs
FRMS Binaries

Summary overall…
Main-sequence striations and Na-O / C-N anticorrelations indicate GCs experience a second star-formation event, fuelled by CNO-processed gas.
Young / intermediate age massive clusters should do the same, and we should be able to see evidence of it.
We haven’t (yet). Strongly argues against any model put forward to date*.
New ideas needed!
Searching for young,
massive, proto-globular clusters
in the local Universe
*Unless you start e.g. fiddling with the IMF