york potash mineheadplanning.northyorkmoors.org.uk/mvm.dms/planning... · 2014-10-20 · york...
TRANSCRIPT
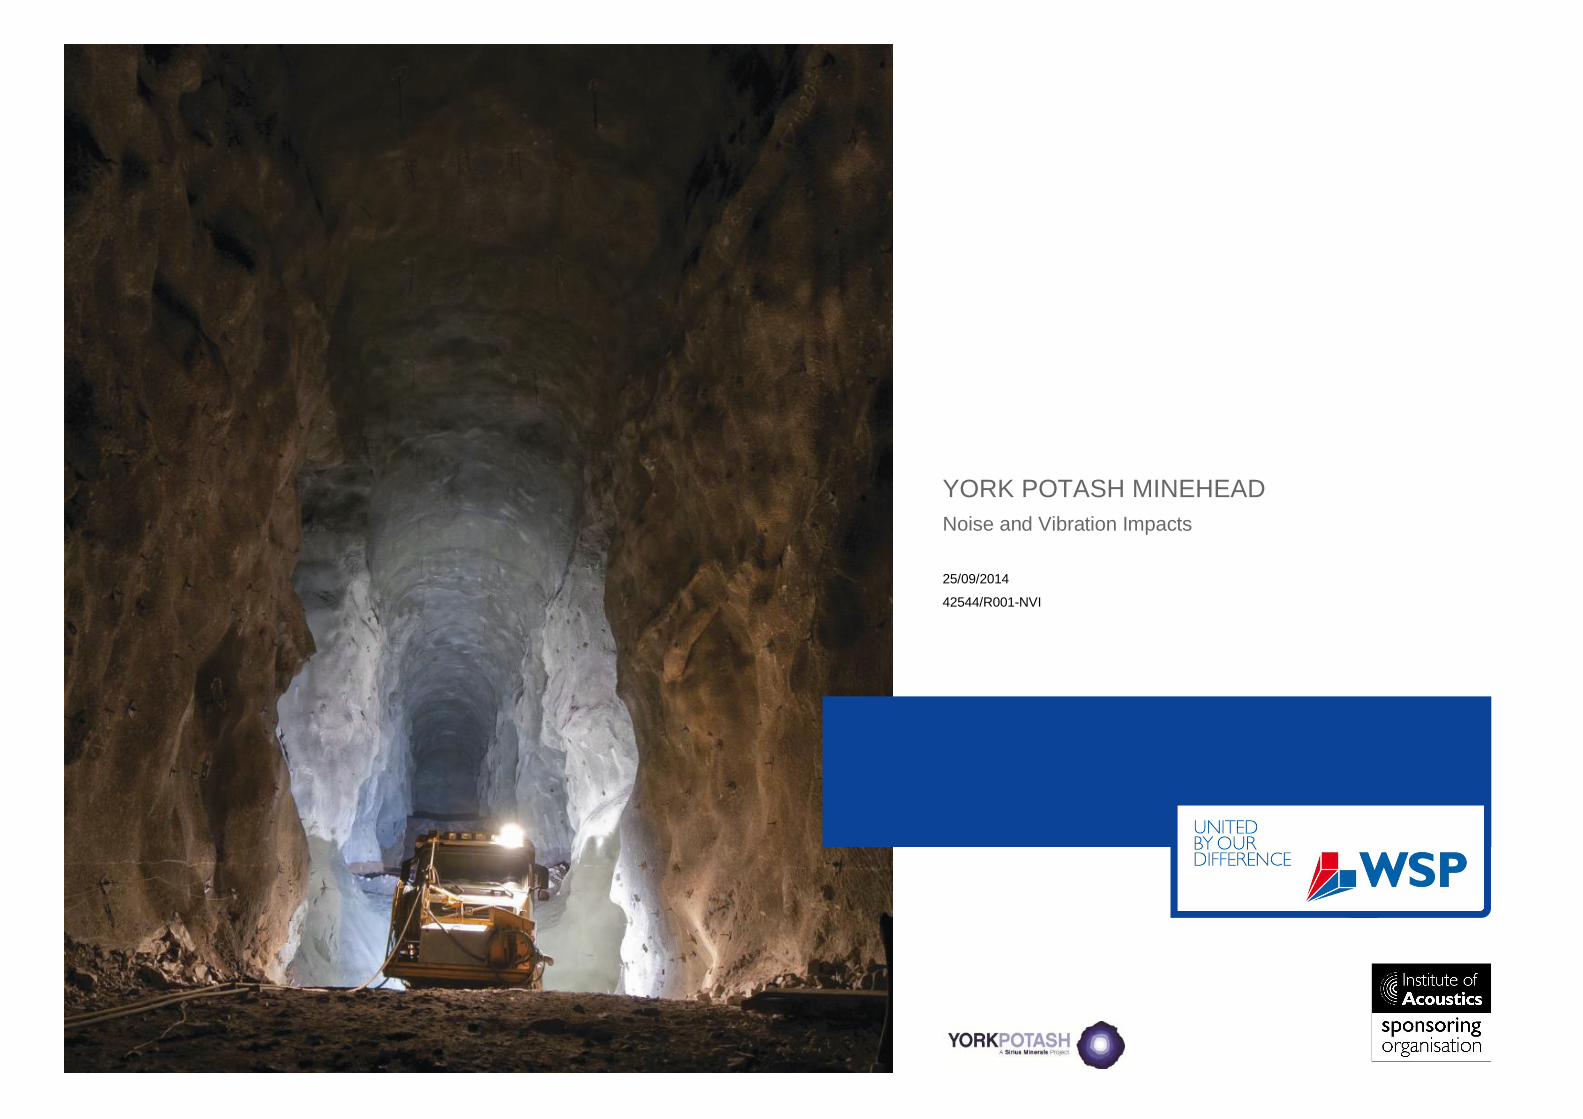
YORK POTASH MINEHEAD Noise and Vibration Impacts 25/09/2014
42544/R001-NVI
Project number: 42544 Dated: 25/09/2014 2 Revised:
Quality Management
Issue/revision First Issue Revision 1 Revision 2 Revision 3
Remarks First Issue
Date 4/9/14
Prepared by N Bodsworth
Signature
Checked by S Fisher
Signature
Authorised by J Powlson
Signature
Project number 42544
Report number 42544/R001-NVI
File reference M/42544C/05/02
York Potash Minehead Noise and Vibration Impacts
25/09/2014
Client York Potash Limited
Consultant Neil Bodsworth One Queens Drive Birmingham B5 4PJ UK Tel: +44 121 352 4768 Fax: +44 121 352 4701 www.wspgroup.co.uk
Registered Address WSP Environmental Ltd 1152332 WSP House, 70 Chancery Lane, London, WC2A 1AF
WSP Contacts Contributors: Reviewers: Neil Bodsworth BSc(Hons) MIOA Principal Consultant [email protected] James Powlson BSc(Hons) MIOA Associate Director [email protected]
Andrew Colthurst MIOA CMCIEH Associate Director [email protected] Steve Fisher BA (Hons) MIOA Technical Director [email protected]
Project number: 42544 Dated: 25/09/2014 3 Revised:
Table of Contents 1 Introduction ............................................................................................. 4
2 Legislation, Policy and Guidance ............................................................. 6 2.1 Legislative Framework ............................................................................ 6 2.2 Guidance Documents .............................................................................. 6 2.3 Impact Magnitudes .................................................................................. 6 2.4 Sensitive Receptors ................................................................................ 7
3 Baseline Conditions................................................................................. 7 3.1 Existing Noise Climate Local to Minehead Site ........................................ 7 3.2 Existing Noise Climate across North York Moors ..................................... 7 3.3 Environmental Noise Surveys .................................................................. 7 3.4 Baseline Noise Levels Derived for Assessments ..................................... 8
4 Construction Phase Noise Impacts .......................................................... 9 4.1 Assessment Criteria ................................................................................ 9 4.2 Methodology ........................................................................................... 9 4.3 Mitigation by Design .............................................................................. 11 4.4 Impacts ................................................................................................. 13 4.5 Discussion of Results ............................................................................ 17
5 Construction Vibration Impacts .............................................................. 20 5.1 Assessment Criteria .............................................................................. 20 5.2 Methodology ......................................................................................... 20 5.3 Mitigation by Design .............................................................................. 20 5.4 Impacts ................................................................................................. 20 5.5 Additional Mitigation .............................................................................. 20
6 Blasting Noise and Vibration Impacts .................................................... 21 6.1 Assessment Criteria .............................................................................. 21 6.2 Methodology ......................................................................................... 21 6.3 Mitigation by Design .............................................................................. 22 6.4 Potential Impacts................................................................................... 22 6.5 Additional Mitigation .............................................................................. 23
7 Construction Traffic Noise Impacts ........................................................ 23 7.1 Assessment Criteria .............................................................................. 23 7.2 Methodology ......................................................................................... 23 7.3 Mitigation by Design .............................................................................. 25 7.4 Impacts ................................................................................................. 25 7.5 Discussion of Results ............................................................................ 26 7.6 Additional Mitigation .............................................................................. 27
8 Operational Phase Noise and Vibration Impacts .................................... 29 8.1 Assessment Criteria .............................................................................. 29 8.2 Methodology ......................................................................................... 29 8.3 Impacts ................................................................................................. 31 8.4 Discussion ............................................................................................ 32
9 Operational Traffic Noise Impacts .......................................................... 36 9.1 Assessment Criteria .............................................................................. 36 9.2 Methodology ......................................................................................... 36 9.3 Mitigation by Design .............................................................................. 38 9.4 Impacts ................................................................................................. 38 9.5 Discussion of Results ............................................................................ 39
10 Tranquillity – Noise Impacts................................................................... 40 10.1 Methodology ......................................................................................... 40 10.2 Impacts ................................................................................................. 41 10.3 Discussion ............................................................................................ 41
Appendices ......................................................................................................... 54
Figures: Figure 1.1: Site Plan and Receptor Locations ................................................................ 5 Figure 4.1: Construction Site Plan and Main Working Areas ....................................... 18 Figure 4.2: Screening Bunds Construction Sequence .................................................. 19 Figure 7.1: Traffic Noise Assessment Highway Links ................................................... 28 Figure 8.1: Operational Noise Sources ........................................................................ 33 Figure 8.2: CandaA Noise Model Results, Operational Phase 1 - 6.5Mtpa
Production Capacity .................................................................................. 34 Figure 8.3: CandaA Noise Model Results, Operational Phase 2 - 13Mtpa
Production Capacity .................................................................................. 35 Figure 10.1: Indicative Baseline Noise Map for Tranquillity Assessment -
Daytime hours ........................................................................................... 42 Figure 10.2: Indicative Baseline Noise Map for Tranquillity Assessment –
Night-time hours ........................................................................................ 43 Figure 10.3: Potential Detrimental Effect on Tranquillity due to Construction
Noise - Months 2-13, Daytime .................................................................... 44 Figure 10.4: Potential Detrimental Effect on Tranquillity due to Construction
Noise - Months 2-13, Evening & Night-time ................................................ 45 Figure 10.5: Potential Detrimental Effect on Tranquillity due to Construction
Noise - Months 14-24, Daytime .................................................................. 46 Figure 10.6: Potential Detrimental Effect on Tranquillity due to Construction
Noise - Months 14-24, Evening & Night-time .............................................. 47 Figure 10.7: Potential Detrimental Effect on Tranquillity due to Construction
Noise - Months 25-42, Daytime .................................................................. 48 Figure 10.8: Potential Detrimental Effect on Tranquillity due to Construction
Noise - Months 25-42, Evening & Night-time .............................................. 49 Figure 10.9: Potential Detrimental Effect on Tranquillity due to Construction
Noise - Months 43-60, Daytime .................................................................. 50 Figure 10.10: Potential Detrimental Effect on Tranquillity due to Construction
Noise - Months 43-60, Evening & Night-time .............................................. 51 Figure 10.11: Potential Detrimental Effect on Tranquillity due to Operational
Noise - Daytime hours ............................................................................... 52 Figure 10.12: Potential Detrimental Effect on Tranquillity due to Operational
Noise - Evening and Night-time hours ........................................................ 53 Appendices:
Appendix A - Glossary of Acoustic Terminology
Appendix B – Legislation, Policy and Guidance
Appendix C - Construction Plant Modelling Assumptions
Appendix D - CandaA Noise Model Predictions for Construction Phases
Appendix E - Night-time ATD Movement Restrictions
Appendix F - Construction Vibration Calculations
Appendix G - Indicative Vibration Levels due to Blasting
Appendix H - Traffic Data
Appendix I - Sample Road Traffic Noise Level Calculations
Appendix J - Construction Traffic Noise Levels and Noise Level Changes
Appendix K - Operational Traffic Noise Levels and Noise Level Changes
Project number: 42544 Dated: 25/09/2014 4 Revised:
1 Introduction 1.1.1 WSP has been commissioned to provide a Technical Report assessing the impact of the proposed
Minehead being developed by York Potash Ltd, with regards to noise and vibration. In particular it considers the potential impacts on existing sensitive receptors from both the construction and future operation of the Proposed Development.
1.1.2 A glossary of terminology used in this Chapter, including a brief introduction to noise and vibration, is provided in Appendix A.
1.1.3 The Proposed Development for the extraction of Potash from beneath the North York Moors will rely on a combination of inherently noisy processes both during the construction of the facility and the on-going operation and processing activity of the mine.
1.1.4 The Minehead Site (the “Site”) is in a rural location, approximately 2.5km south of the small village of Sneaton and will occupy existing farmland. This Site will include the operations and equipment necessary to extract and disperse the product from the ground. Associated Welfare facilities for staff will also be located within the Site. The majority of the operational equipment will be located below ground level and encapsulated by buildings that will be agriculture in appearance. In doing so, noise emissions from the operations of the mine will be mitigated close to source, hence minimising the potential impact on local amenity.
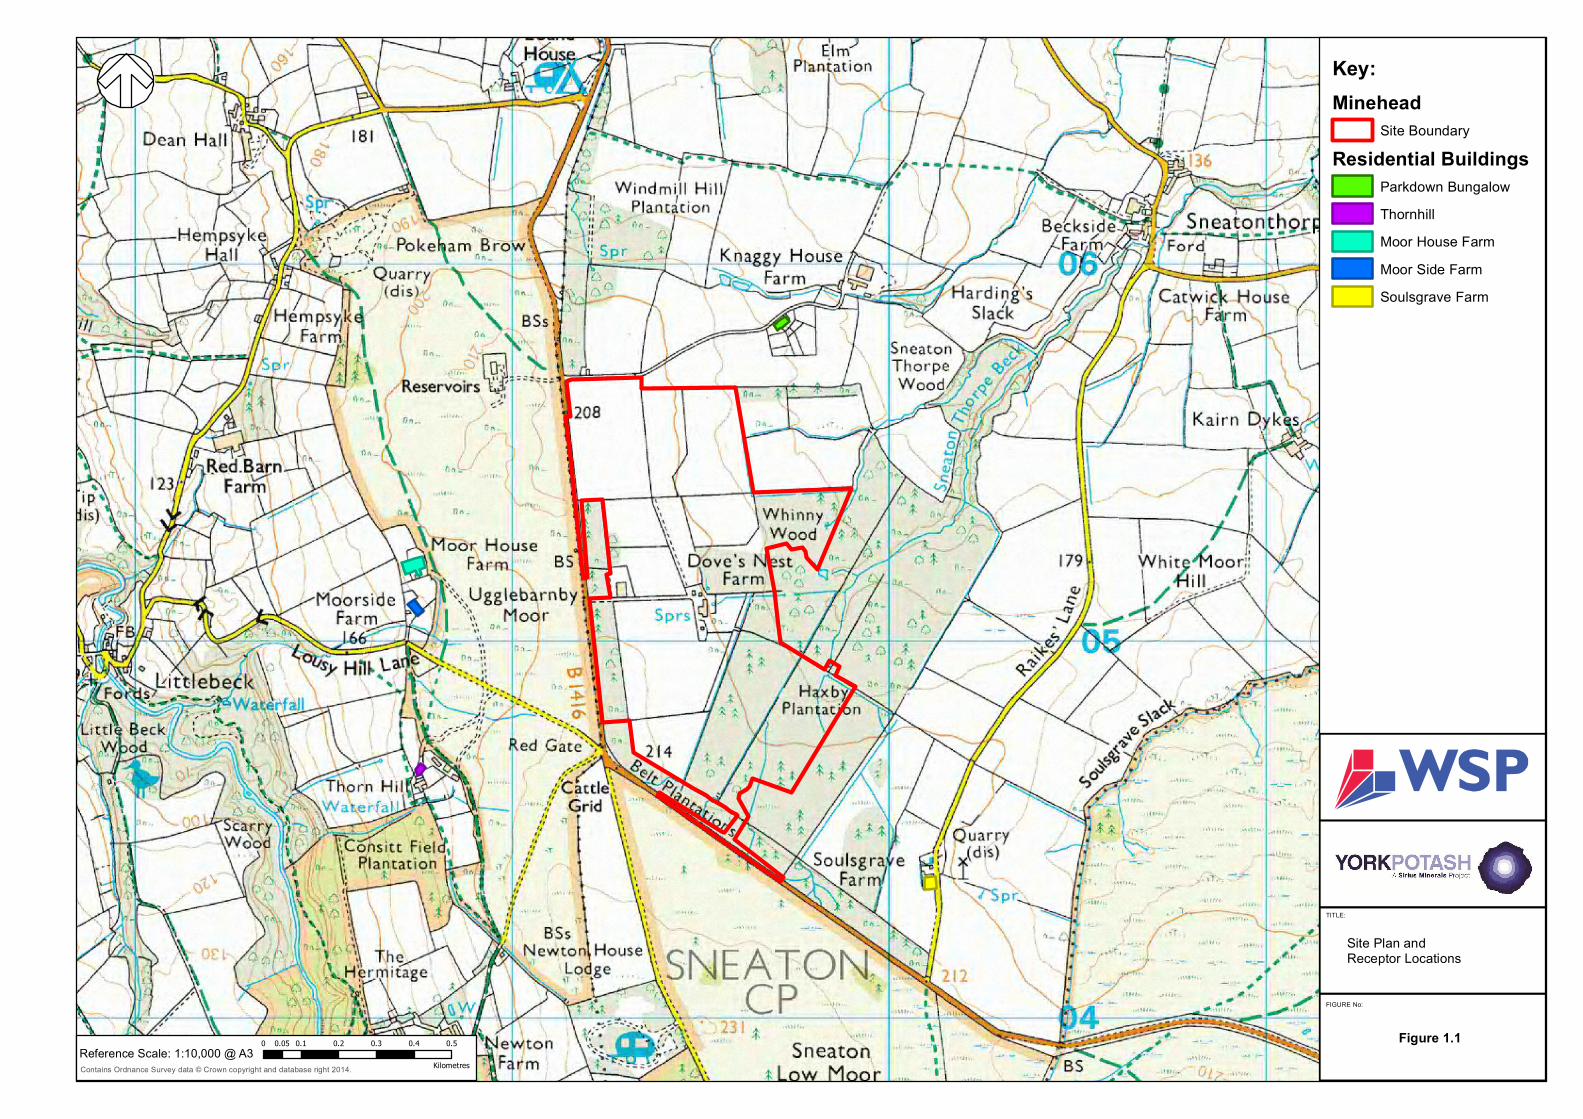
1.1.5 This report provides a technical reference on the noise and vibration impacts for an Environmental Statement and planning application being submitted to the North York Moors National Park Authority (NYMNPA) for the Minehead application only; that is, activities within the confines of the application red-line boundary indicated in Figure 1.1 of this report and road traffic associated with movements to and from the Minehead Site.
1.1.6 The wider aspect of the project relies on a means of exporting and processing the won minerals during the operation of the mine, which is proposed to be via an underground conveyor system to a processing plant in the Wilton Industrial Estate approximately 40km north of the Minehead.
1.1.7 The construction and use of the tunnel, conveyor system and processing plant are not included within this report unless activities associated with the tunnel/processing plant are common with the Minehead construction and operation.
1.1.8 Consideration has therefore been given to the following potential impacts:
the potential construction noise impacts at existing local receptors during the construction phase, including site clearance works (including excavation and spoil movements associated with the mine shafts and the initial section of the conveyor tunnel), foundation works, superstructure works;
the potential noise impact as a result of construction traffic movements associated with works at the Minehead Site, including those associated with the export of Non-Hazardous, Non-Inert spoil during the construction phase, as well as those associated with the delivery of construction plant, equipment and materials etc.;
the potential construction vibration impacts at existing local receptors during the construction phase, including boring of the vehicular access tunnels;
the potential blast-induced vibration impacts at existing local receptors during the formation of the shafts (including the shaft proposed for lowering the TBM for the tunnel) and possible blasting associated with excavation of the cut out / working areas beneath the proposed Minehead buildings (where required);
the potential blast-induced noise and air overpressure impacts at existing local receptors, during the formation of the shafts (including the shaft proposed for lowering the TBM for the tunnel) and possible blasting associated with excavation of the cut out / working areas beneath the proposed Minehead buildings (where required);
the potential noise impacts at existing local receptors, as a result of Mining operations;
the potential noise impacts at existing local receptors, as a result of fixed mechanical services plant (such as that associated with the Welfare facilities); and
the potential noise impacts at existing receptors as a result of development generated road traffic noise (also including the effect of natural traffic growth).
1.1.9 In determining the original scope of assessments and acquisition of baseline data, WSP consulted with Mr Graham Middleton, the Environmental Health Officer at Scarborough Borough Council, to whom, it is understood, the NYMNPA out-sources its noise related queries. Following the previous planning submission, additional consultation in the form of detailed critiques, meeting, memos and teleconferences have taken place between WSP, AMEC and Royal Haskoning DHV during the preparation of this technical report. Meeting minutes, data requests and associated correspondences can be made available on request.
Contains Ordnance Survey data © Crown copyright and database right 2014.
0 0.1 0.2 0.3 0.4 0.50.05
KilometresReference Scale: 1:10,000 @ A3
Key:Minehead
Site BoundaryResidential Buildings
Parkdown BungalowThornhillMoor House FarmMoor Side FarmSoulsgrave Farm
FIGURE No:
TITLE:
Site Plan and Receptor Locations
Figure 1.1
Project number: 42544 Dated: 25/09/2014 6 Revised:
2 Legislation, Policy and Guidance
2.1 Legislative Framework 2.1.1 For a development of this nature, there is no specific all-encompassing legislation relating to the
standards associated with noise emission/noise impact. Noise legislation, where it does exist, tends to be either EC-derived and focused on specific items of noise-emitting plant or on more general nuisance, such as that addressed by the provisions of the Environmental Protection Act 19901.
2.1.2 In lieu of any specific legislation, assessing the effect of such a development during the construction and operational phases must draw on information from a variety of sources. This assessment therefore makes reference to a number of local and national planning policy documents, British Standards and noise and vibration guidance documents, as detailed below.
2.1.3 In conducting the noise and vibration assessments, reference has been made to the following policies:
National Planning Policy Framework 2
Noise Policy Statement for England 3
North York Moors Local Development Framework 4
2.1.4 Full details of the noise and vibration related policies that have influenced the relevant assessments are included in Appendix B.
2.2 Guidance Documents 2.2.1 The completed assessments have drawn upon the following documents:
Planning Practice Guidance (March 2014) 5
BS 5228-1:2009+A1: 2014 Noise and Vibration Control on Construction and Open Sites Part 1: Noise 6
BS 5228-2:2009+A1: 2014 Noise and Vibration Control on Construction and Open Sites Part 2: Vibration 7
BS 6472-1: 2008: Guide to Evaluation of Exposure to Vibration in Buildings. Vibration Sources Other than Blasting 8
BS 6472-2: 2008: Guide to Evaluation of Human Exposure to Vibration in Buildings Part 2: Blast-induced Vibration 9
1 HM Government. (1990). Environmental Protection Act 1990 (as amended). London: HMSO 2 Department for Communities & Local Government (DCLG) (2012). National Planning Policy Framework 3 Department for Environment, Food and Rural Affairs (DEFRA) (2010). Noise Policy Statement for England 4 North York Moors National Park Authority. Local Development Framework 5 Department for Communities & Local Government (DCLG) (2014). Planning Practice Guidance – Noise 6 Subcommittee B/564/1 (2014), BS 5228+A1:2014 Code of practice for noise and vibration control on construction and open sites Part 1: Noise, London, BSi 7 Subcommittee B/564/1 (2014), BS 5228+A1: 2014 Code of practice for noise and vibration control on construction and open sites Part 2: Vibration, London, BSi 8 Subcommittee GME/21/6 (2008), BS 6472-1 Guide to evaluation of human exposure to vibration in buildings. Vibration Sources Other than Blasting. BSi 9 Subcommittee GME/21/6 (2008), BS 6472-2 Guide to evaluation of human exposure to vibration in buildings. Blast Induced Vibration. BSi
BS 4142:1997 Method for Rating Industrial Noise Affecting Mixed Residential and Industrial Areas 10
BS 8233: 2014: Guidance on Sound Insulation and Noise Reduction for Buildings 11
The World Health Organisation:1999: Guidelines for Community Noise12
The Calculation of Road Traffic Noise (CRTN) memorandum (1988), published by the then Department of Transport and the Welsh Office 13
A Guide to Measurement and Prediction of the Equivalent Continuous Sound Level Leq, Report by a Working Party for the Technical Sub-committee of the Council 14
The Design Manual for Roads and Bridges 15
2.2.2 The content of these documents is summarized in Appendix B.
2.3 Impact Magnitudes 2.3.1 The magnitude of impact from a specific noise or vibration level is dependent on the source from
which it arose and the time of day/night when it occurs. For example, noise from temporary daytime construction activities may be less disturbing than permanent fixed plant that operates 24-hours per day.
2.3.2 The adopted impact magnitudes, derived from the guidance detailed in Appendix B, are summarised in the individual assessment sections that follow.
2.3.3 In additional to the quantative assessments and impact magnitudes defined above, this report also addresses potential noise impacts that may influence the ‘special features’ across the North York Moors National Park (NYMNP). Tranquillity has been identified as one of these special features and is described as “the protection of dark skies at night and clear unpolluted air”. This includes factors relating to Landscape and Visual impact (Lighting), Noise and Vibration, Air Quality and Traffic and Transport.
2.3.4 The noise impacts relating to tranquillity are largely subjective and can be difficult to determine on a quantative scale. Furthermore, in order to establish a robust assessment, extensive noise monitoring would be required across a large area of the National Park as the baseline conditions could vary significantly between locations a relatively short distance from each other due to proximity to roads/towns or where the intervening landscape may provide natural screening etc.
10 Technical Committee EH/1 (1997), BS4142: Method for Rating Industrial Noise Affecting Mixed Residential and Industrial Areas. London, BSi 11 Technical Committee EH/1 (2014), BS 8233 – Guidance on sound insulation and noise reduction for buildings, London, BSi, 12 The World Health Organisation (1999), Guidelines for Community Noise 13 Department of Transport/Welsh Office (1988), Calculation of Road Traffic Noise. London: HMSO 14 Working Party for the Technical Sub-committee of the Noise Advisory Council (1978), A Guide to Measurement and Prediction of the Equivalent Continuous Sound Level Leq. London: HMSO. 15 Department of Transport (1993 and subsequent amendment), Design Manual for Roads and Bridges, Volume 11, Environmental Assessment. London, HMSO.
Project number: 42544 Dated: 25/09/2014 7 Revised:
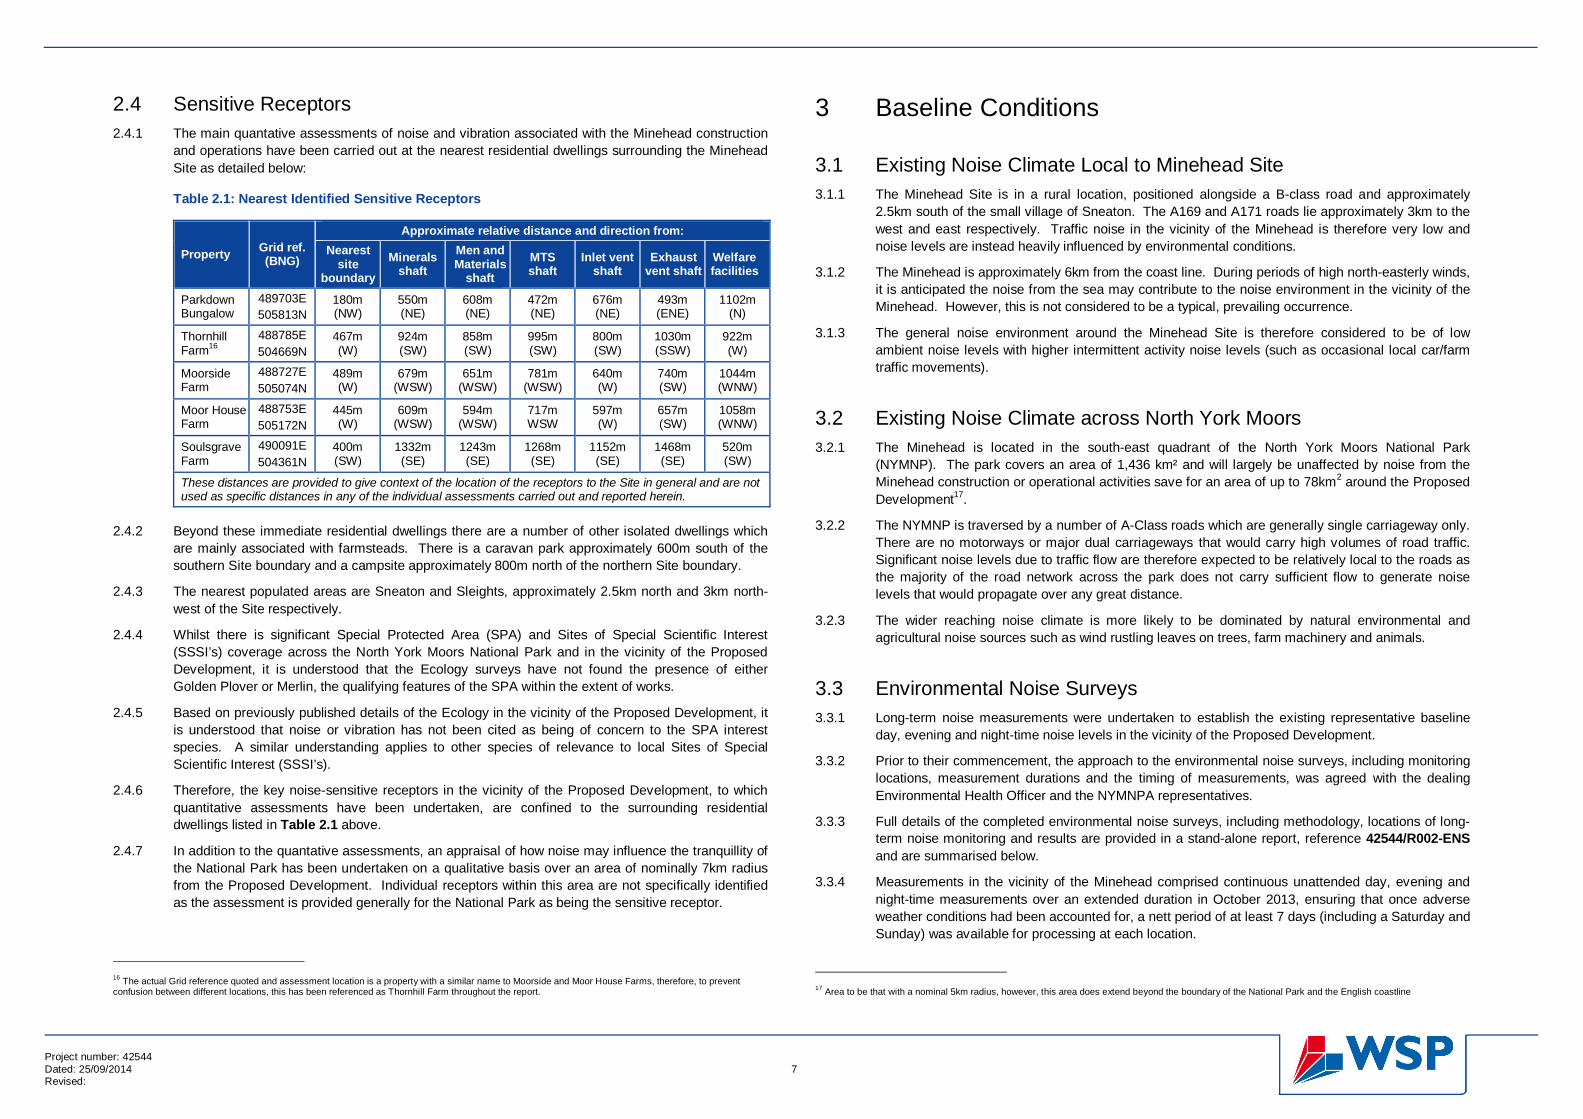
2.4 Sensitive Receptors 2.4.1 The main quantative assessments of noise and vibration associated with the Minehead construction
and operations have been carried out at the nearest residential dwellings surrounding the Minehead Site as detailed below:
Table 2.1: Nearest Identified Sensitive Receptors
Property Grid ref. (BNG)
Approximate relative distance and direction from: Nearest
site boundary
Minerals shaft
Men and Materials
shaft MTS shaft
Inlet vent shaft
Exhaust vent shaft
Welfare facilities
Parkdown Bungalow
489703E 505813N
180m (NW)
550m (NE)
608m (NE)
472m (NE)
676m (NE)
493m (ENE)
1102m (N)
Thornhill Farm16
488785E 504669N
467m (W)
924m (SW)
858m (SW)
995m (SW)
800m (SW)
1030m (SSW)
922m (W)
Moorside Farm
488727E 505074N
489m (W)
679m (WSW)
651m (WSW)
781m (WSW)
640m (W)
740m (SW)
1044m (WNW)
Moor House Farm
488753E 505172N
445m (W)
609m (WSW)
594m (WSW)
717m WSW
597m (W)
657m (SW)
1058m (WNW)
Soulsgrave Farm
490091E 504361N
400m (SW)
1332m (SE)
1243m (SE)
1268m (SE)
1152m (SE)
1468m (SE)
520m (SW)
These distances are provided to give context of the location of the receptors to the Site in general and are not used as specific distances in any of the individual assessments carried out and reported herein.
2.4.2 Beyond these immediate residential dwellings there are a number of other isolated dwellings which
are mainly associated with farmsteads. There is a caravan park approximately 600m south of the southern Site boundary and a campsite approximately 800m north of the northern Site boundary.
2.4.3 The nearest populated areas are Sneaton and Sleights, approximately 2.5km north and 3km north-west of the Site respectively.
2.4.4 Whilst there is significant Special Protected Area (SPA) and Sites of Special Scientific Interest (SSSI’s) coverage across the North York Moors National Park and in the vicinity of the Proposed Development, it is understood that the Ecology surveys have not found the presence of either Golden Plover or Merlin, the qualifying features of the SPA within the extent of works.
2.4.5 Based on previously published details of the Ecology in the vicinity of the Proposed Development, it is understood that noise or vibration has not been cited as being of concern to the SPA interest species. A similar understanding applies to other species of relevance to local Sites of Special Scientific Interest (SSSI’s).
2.4.6 Therefore, the key noise-sensitive receptors in the vicinity of the Proposed Development, to which quantitative assessments have been undertaken, are confined to the surrounding residential dwellings listed in Table 2.1 above.
2.4.7 In addition to the quantative assessments, an appraisal of how noise may influence the tranquillity of the National Park has been undertaken on a qualitative basis over an area of nominally 7km radius from the Proposed Development. Individual receptors within this area are not specifically identified as the assessment is provided generally for the National Park as being the sensitive receptor.
16 The actual Grid reference quoted and assessment location is a property with a similar name to Moorside and Moor House Farms, therefore, to prevent confusion between different locations, this has been referenced as Thornhill Farm throughout the report.
3 Baseline Conditions
3.1 Existing Noise Climate Local to Minehead Site 3.1.1 The Minehead Site is in a rural location, positioned alongside a B-class road and approximately
2.5km south of the small village of Sneaton. The A169 and A171 roads lie approximately 3km to the west and east respectively. Traffic noise in the vicinity of the Minehead is therefore very low and noise levels are instead heavily influenced by environmental conditions.
3.1.2 The Minehead is approximately 6km from the coast line. During periods of high north-easterly winds, it is anticipated the noise from the sea may contribute to the noise environment in the vicinity of the Minehead. However, this is not considered to be a typical, prevailing occurrence.
3.1.3 The general noise environment around the Minehead Site is therefore considered to be of low ambient noise levels with higher intermittent activity noise levels (such as occasional local car/farm traffic movements).
3.2 Existing Noise Climate across North York Moors 3.2.1 The Minehead is located in the south-east quadrant of the North York Moors National Park
(NYMNP). The park covers an area of 1,436 km² and will largely be unaffected by noise from the Minehead construction or operational activities save for an area of up to 78km2 around the Proposed Development17.
3.2.2 The NYMNP is traversed by a number of A-Class roads which are generally single carriageway only. There are no motorways or major dual carriageways that would carry high volumes of road traffic. Significant noise levels due to traffic flow are therefore expected to be relatively local to the roads as the majority of the road network across the park does not carry sufficient flow to generate noise levels that would propagate over any great distance.
3.2.3 The wider reaching noise climate is more likely to be dominated by natural environmental and agricultural noise sources such as wind rustling leaves on trees, farm machinery and animals.
3.3 Environmental Noise Surveys 3.3.1 Long-term noise measurements were undertaken to establish the existing representative baseline
day, evening and night-time noise levels in the vicinity of the Proposed Development.
3.3.2 Prior to their commencement, the approach to the environmental noise surveys, including monitoring locations, measurement durations and the timing of measurements, was agreed with the dealing Environmental Health Officer and the NYMNPA representatives.
3.3.3 Full details of the completed environmental noise surveys, including methodology, locations of long-term noise monitoring and results are provided in a stand-alone report, reference 42544/R002-ENS and are summarised below.
3.3.4 Measurements in the vicinity of the Minehead comprised continuous unattended day, evening and night-time measurements over an extended duration in October 2013, ensuring that once adverse weather conditions had been accounted for, a nett period of at least 7 days (including a Saturday and Sunday) was available for processing at each location.
17 Area to be that with a nominal 5km radius, however, this area does extend beyond the boundary of the National Park and the English coastline
Project number: 42544 Dated: 25/09/2014 8 Revised:
3.3.5 Meteorological measurements were undertaken at Parkdown which has a clear line of sight to the sea, and was therefore agreed as being appropriate for determining the worst case weather conditions prevalent in the general vicinity.
3.3.6 A summary of the monitoring locations is provided below:
Position NM1:
This measurement location, chosen to be representative of the noise levels at Parkdown Bungalow, is approximately 22m west of the closest façade, with BNG co-ordinates of 489699 (East), 505813 (North).
Position NM2:
This measurement location, chosen to be representative of the noise levels at Thornhill Farm, is approximately 40m north east of the closest façade, with BNG co-ordinates of 488792 (East), 504698 (North).
Position NM3:
This measurement location, chosen to be representative of the noise levels at Moorside Farm and Moor House Farm, is approximately 22m north of the closest façade of Moorside Farm, with BNG co-ordinates of 488717 (East), 505102 (North).
Position NM4:
This measurement location, chosen to be representative of the noise levels at Soulsgrave Farm, is approximately 30m north west of the closest façade, with BNG co-ordinates of 490087 (East), 504375 (North).
Position WM1:
The anemometer location, chosen to be representative of the worst case weather conditions, is adjacent to the noise monitoring location NM1 at Parkdown Bungalow.
Position WM2:
This rain gauge meter location, chosen to be representative of the weather conditions at all noise monitoring locations, is approximately 10m south of noise monitoring location NM1, with BNG co-ordinates of 489705 (East), 505813 (North).
3.4 Baseline Noise Levels Derived for Assessments 3.4.1 The guidance used to assess noise from the shaft sinking and earthwork activities refers to three
time periods being day (07:00-19:00), evening (19:00-22:00) and night (22:00-07:00). Similarly, these periods would also apply to the assessment of noise arising from the operation of the mine with regards to mineral extraction activities.
3.4.2 General construction activities associated with the erection of the buildings on the Minehead Site are scheduled to take place during the daytime period of 07:00 – 19:00 only.
3.4.3 The guidance used to assess noise from the operational activities other than the mining operations themselves (i.e. plant noise emissions) refers to two time periods that differ slightly from the mining periods, being day (07:00-23:00) and night (23:00-07:00).
3.4.4 A summary of results for these daytime, evening and night-time periods are presented in Table 3.1 and Table 3.2 below for each measurement position. In both cases, the results present the average of the “good” data within the respective period, where “good” data are what remain after the complete data set has been filtered to exclude results affected by wind and rain for more than 10 % of the measurement period.
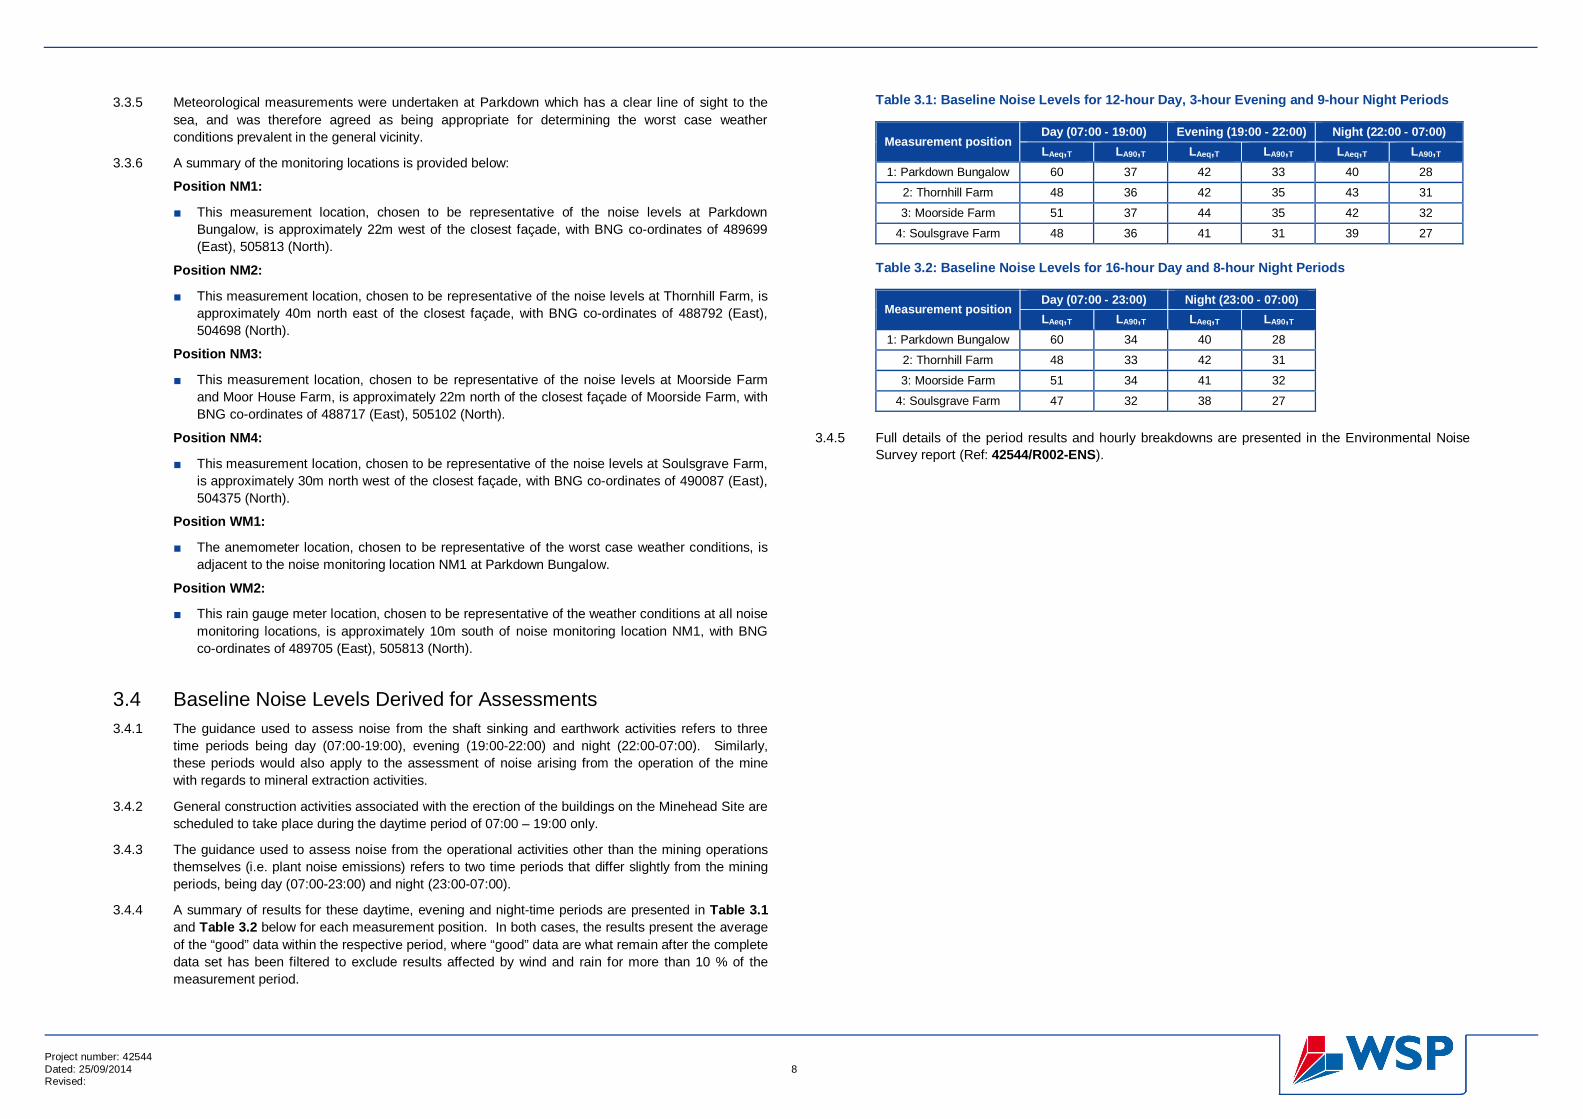
Table 3.1: Baseline Noise Levels for 12-hour Day, 3-hour Evening and 9-hour Night Periods
Measurement position Day (07:00 - 19:00) Evening (19:00 - 22:00) Night (22:00 - 07:00) LAeq,T LA90,T LAeq,T LA90,T LAeq,T LA90,T
1: Parkdown Bungalow 60 37 42 33 40 28
2: Thornhill Farm 48 36 42 35 43 31
3: Moorside Farm 51 37 44 35 42 32
4: Soulsgrave Farm 48 36 41 31 39 27
Table 3.2: Baseline Noise Levels for 16-hour Day and 8-hour Night Periods
Measurement position Day (07:00 - 23:00) Night (23:00 - 07:00) LAeq,T LA90,T LAeq,T LA90,T
1: Parkdown Bungalow 60 34 40 28
2: Thornhill Farm 48 33 42 31
3: Moorside Farm 51 34 41 32
4: Soulsgrave Farm 47 32 38 27
3.4.5 Full details of the period results and hourly breakdowns are presented in the Environmental Noise Survey report (Ref: 42544/R002-ENS).
Project number: 42544 Dated: 25/09/2014 9 Revised:
4 Construction Phase Noise Impacts
4.1 Assessment Criteria 4.1.1 For general and short term construction noise that could be deemed typical of any construction site,
i.e. demolition of existing structures and the erection of new buildings etc, noise levels have been assessed in accordance with the ‘ABC’ method defined in BS 5228-1, as presented in Table B1 of Appendix B.
4.1.2 At each of the noise sensitive receptors, the ambient daytime noise levels presented in Table 3.1 (rounded to the nearest 5 dB) are less than 65 dB LAeq,T and therefore fall into Category A of the ‘ABC’ assessment methodology. All construction works for which this guidance will be relevant shall take place during daytime periods only, hence they will be subject to a limit of 65 dB LAeq,T.
4.1.3 For the majority of the construction works, which will last for approximately 5 years, activities will be more akin to surface mineral extraction. Therefore, the assessment criteria have been based on more appropriate guidance such as that detailed in Annex E5 of BS 5228 and the web-based PPG on Minerals, as presented in Appendix B.
4.1.4 Noise limits derived for construction works associated with the long-term earthworks and shaft sinking activities have been set at 10 dB above the background noise levels listed in Table 3.1, for each receptor during the applicable day and evening periods.
4.1.5 At night (22:00-07:00), efforts will be made within the mitigation measures to minimise any adverse noise impacts. However, for the purpose of defining an appropriate threshold level for the assessments, the historic18 night-time limit, and that applied for day and evening operations, of 10 dB above the background noise level has been adopted.
4.1.6 Where these noise limits place an undue burden on the construction operations, the noise limits can be relaxed to an upper limit of 55 dB LAeq,1hr during the day and evening periods and 42 dB LAeq,1hr during the night.
4.1.7 Furthermore, temporary works lasting up to 8 weeks during a 12 month period that provide long term environmental benefits (i.e. bunds providing visual/acoustic screening) can be allowed to generate noise levels of up to 70 dB LAeq,1hr during normal day-time hours.
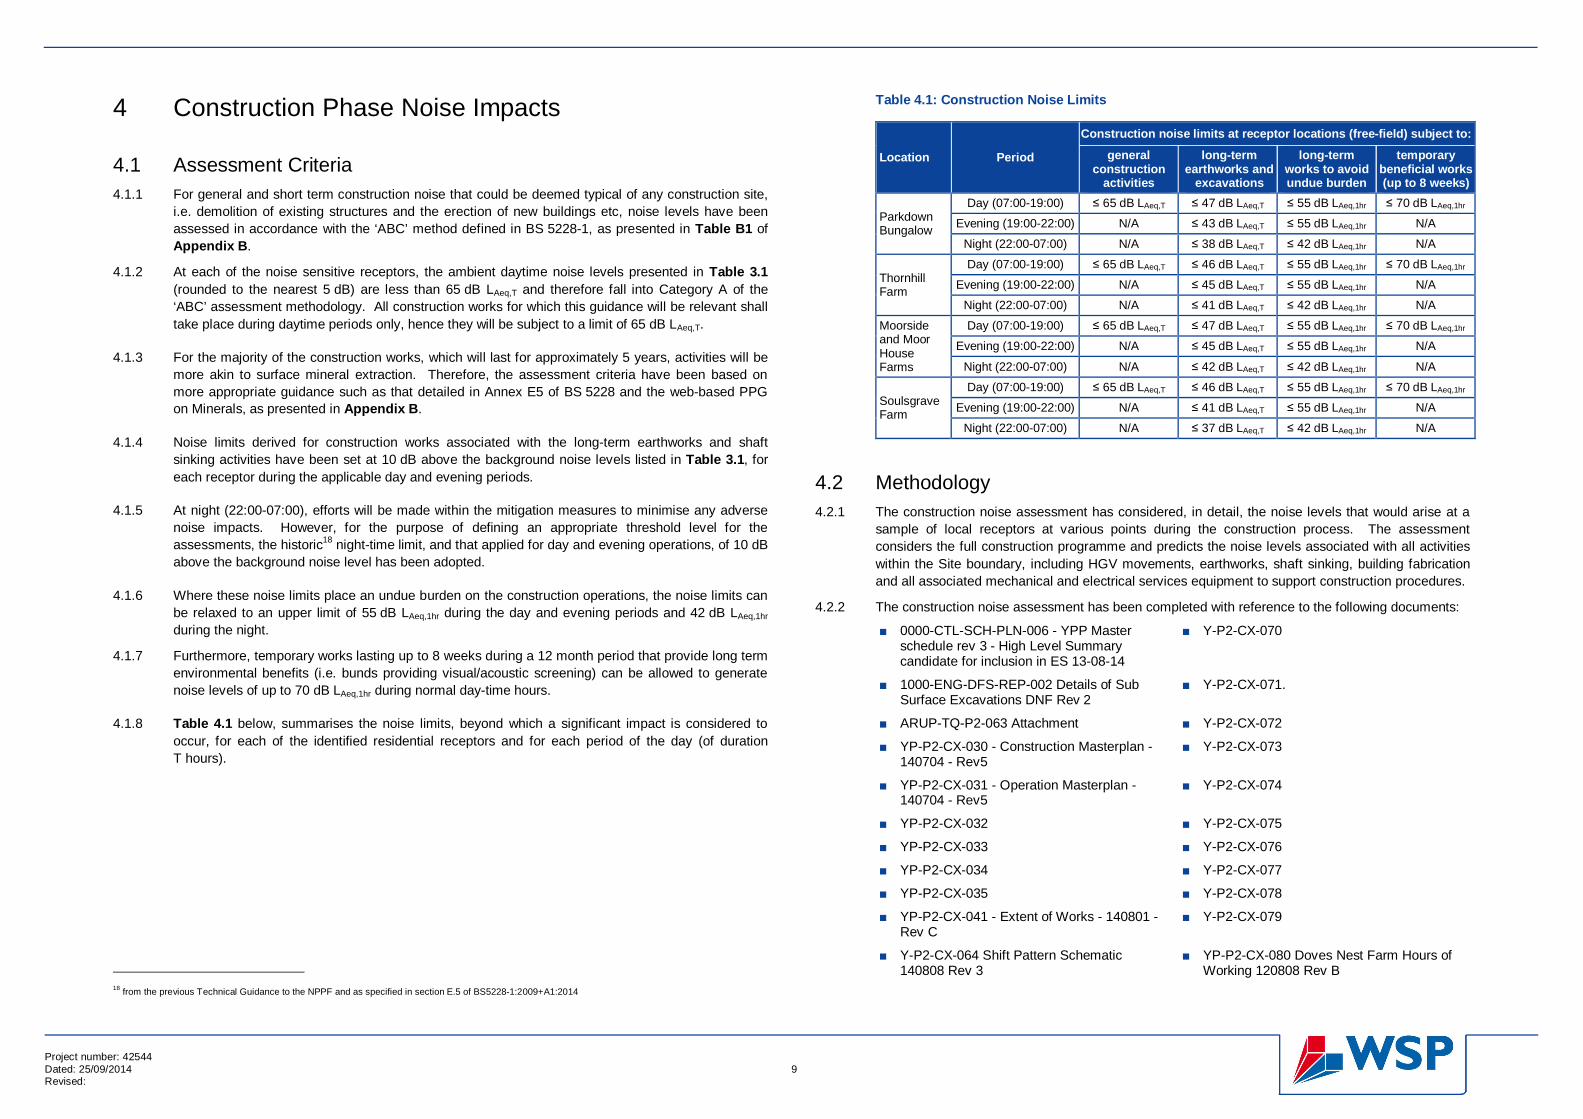
4.1.8 Table 4.1 below, summarises the noise limits, beyond which a significant impact is considered to occur, for each of the identified residential receptors and for each period of the day (of duration T hours).
18 from the previous Technical Guidance to the NPPF and as specified in section E.5 of BS5228-1:2009+A1:2014
Table 4.1: Construction Noise Limits
Location Period
Construction noise limits at receptor locations (free-field) subject to:
general construction
activities
long-term earthworks and
excavations
long-term works to avoid undue burden
temporary beneficial works (up to 8 weeks)
Parkdown Bungalow
Day (07:00-19:00) 65 dB LAeq,T 47 dB LAeq,T 55 dB LAeq,1hr 70 dB LAeq,1hr
Evening (19:00-22:00) N/A 43 dB LAeq,T 55 dB LAeq,1hr N/A
Night (22:00-07:00) N/A 38 dB LAeq,T 42 dB LAeq,1hr N/A
Thornhill Farm
Day (07:00-19:00) 65 dB LAeq,T 46 dB LAeq,T 55 dB LAeq,1hr 70 dB LAeq,1hr
Evening (19:00-22:00) N/A 45 dB LAeq,T 55 dB LAeq,1hr N/A
Night (22:00-07:00) N/A 41 dB LAeq,T 42 dB LAeq,1hr N/A
Moorside and Moor House Farms
Day (07:00-19:00) 65 dB LAeq,T 47 dB LAeq,T 55 dB LAeq,1hr 70 dB LAeq,1hr
Evening (19:00-22:00) N/A 45 dB LAeq,T 55 dB LAeq,1hr N/A
Night (22:00-07:00) N/A 42 dB LAeq,T 42 dB LAeq,1hr N/A
Soulsgrave Farm
Day (07:00-19:00) 65 dB LAeq,T 46 dB LAeq,T 55 dB LAeq,1hr 70 dB LAeq,1hr
Evening (19:00-22:00) N/A 41 dB LAeq,T 55 dB LAeq,1hr N/A
Night (22:00-07:00) N/A 37 dB LAeq,T 42 dB LAeq,1hr N/A
4.2 Methodology 4.2.1 The construction noise assessment has considered, in detail, the noise levels that would arise at a
sample of local receptors at various points during the construction process. The assessment considers the full construction programme and predicts the noise levels associated with all activities within the Site boundary, including HGV movements, earthworks, shaft sinking, building fabrication and all associated mechanical and electrical services equipment to support construction procedures.
4.2.2 The construction noise assessment has been completed with reference to the following documents:
0000-CTL-SCH-PLN-006 - YPP Master schedule rev 3 - High Level Summary candidate for inclusion in ES 13-08-14
Y-P2-CX-070
1000-ENG-DFS-REP-002 Details of Sub Surface Excavations DNF Rev 2
Y-P2-CX-071.
ARUP-TQ-P2-063 Attachment Y-P2-CX-072
YP-P2-CX-030 - Construction Masterplan - 140704 - Rev5
Y-P2-CX-073
YP-P2-CX-031 - Operation Masterplan - 140704 - Rev5
Y-P2-CX-074
YP-P2-CX-032 Y-P2-CX-075
YP-P2-CX-033 Y-P2-CX-076
YP-P2-CX-034 Y-P2-CX-077
YP-P2-CX-035 Y-P2-CX-078
YP-P2-CX-041 - Extent of Works - 140801 - Rev C
Y-P2-CX-079
Y-P2-CX-064 Shift Pattern Schematic 140808 Rev 3
YP-P2-CX-080 Doves Nest Farm Hours of Working 120808 Rev B
Project number: 42544 Dated: 25/09/2014 10 Revised:
4.2.3 Drawing upon the details contained within the above documents, a series of noise level predictions have been carried out using CadnaA19 3-D computerised noise modelling software in accordance with the environmental propagation methodology detailed in BS 5228. The main working areas and bunds referred to in this section are indicated on the Construction Site Plan replicated in Figure 4.1. Further details relating to the noise models are provided in Appendix C, including limitations and modelling assumptions.
4.2.4 The results of the noise level predictions are assessed against the relevant noise level limits as presented in Table 4.1 for the type of works that are generating the dominant noise levels at the identified noise sensitive receptors.
4.2.5 The construction phase of the Proposed Development has been categorised into six primary phases. Some of these phases are further divided into individual months or groups of months subject to the scale of works being undertaken during the relevant phase. The key stages considered are summarised as follows:
Phase 1 – Months 2-6 This phase will include the majority of the early earthworks and forming of the outer bunds that will provide screening to the ongoing construction works. Due to the nature of the earthworks, this phase has been broken down into monthly activities. Grouting for the sub-surface excavations shall commence during Phase 1. Phase 1 comprises four sub-phases defined in 1 or 2 month periods.
Phase 2 – Months 7-17 This phase will see the sub-surface excavations commence and for the shorter ventilation shafts, the sinking process will also be completed. Part way through the excavations, temporary hoist cranes will be replaced by head-frames over the main mine shafts and the MTS shaft. Phase 2 has been divided into two sub-phases for noise assessments accordingly. The drift tunnel to the base of the Men and Materials chamber will be completed and earthworks will continue throughout Phase 2.
Phase 3 – Months 18-24 By Phase 3, the main Minehead chambers are expected to be complete and the sinking of the mineshafts will be fully underway. All connecting tunnels between the ventilation shafts and the Minehead chambers would be complete and the MTS shaft will have reached its full depth.
Phase 4 – Months 25-32 The main mine shafts will continue to be sunk and the MTS tunnel boring machine will be assembled and proceed to drive the MTS tunnel (the tunnel boring process itself does not form part of the scope of these assessments). During this phase, construction of the Welfare facilities will commence.
Phase 5 – Months 33-40 The main mine shafts will continue to be sunk and spoil from the MTS tunnel will continue to be deposited onto the earth bunds up to the completion of the tunnelling process towards the end of this phase. All surface bunds to the north and west of the main shaft platforms will be completed and surface works will be concentrated around the temporary stockpiles to the south of the platform. The construction of the Welfare facilities will be completed during this Phase, following which, the construction of the fan house on top of the inlet air ventilation shaft will commence.
19 DataKustik GmbH, Cadna A, Version 4.3.143 (build 4300)
Phase 6 – Months 41+ The shaft sinking phase, construction of the fan house and the majority of the above ground landscaping will be completed within the first two months of Phase 6. The following 18 months will see the equipping of the primary service shafts (including the changeover to permanent winding gear and construction of the main shaft-head buildings), alongside the export of all remaining non-hazardous, non-inert spoil from the temporary stockpile on the Site before final restoration can be completed. The shaft equipping works are scheduled to occur consecutively, therefore Phase 6 has been split into three sub phases to represent the initial two months and the subsequent works to the Minerals shaft and Men and Materials shaft.
4.2.6 The construction activity has been modelled for each phase and sub-phase where applicable, using noise source data obtained from either manufacturers’ data sheets, the EU Directive 2006/42/EC on machinery, the tables contained within Appendices C and D of BS 5228-1 or WSP’s own database of construction activities.
4.2.7 Where noise sources are generally static, i.e. generators, cranes etc, they have been modelled as point sources. Items of earthworks plant that will be mobile over the Site and earth bunds are modelled as moving point line sources covering the areas of bund applicable to the phase. Mobile plant that will primarily follow internal haul routes are modelled as moving point line sources based on the number of movements estimated for the duration of the phase/shift.
4.2.8 For each phase, the noise models incorporate the plant movement in the identified areas for that phase and are modelled over the ground contours established at the end of the preceding phase (existing land contours for the beginning of Phase 1). Subsequently, any acoustic screening provided by bund formations constructed during a phase, is not accounted for until the following phase of works. This allows a conservative prediction of the noise levels generated during the construction period.
4.2.9 Calculations have been completed for the average scenario for works during the relevant phase and assessment periods (day, evening and night). These incorporate the percentage on-times assumed for typical operations over the course of the phase/shift. It has been assumed that no manually operated item of plant will operate for 100% of an assessment period due to breaks/staff rotation etc. Therefore utilisation has been capped to 85% for the average scenario. Furthermore, where some works are not expected to occur over the entire duration of a phase/shift, the average percentage on-times have been adjusted accordingly.
4.2.10 A second iteration of calculations has been carried out for peak hourly activities which generally has assumed 100% time for all plant on Site. Where earthworks plant is predicted to operate in multiple areas over the course of a phase/shift, only one of these areas has been modelled at 100% utilisation. Other exceptions to 100% utilisation apply to the generators, where the peak load has been modelled, and the compressors, which are only ever scheduled to operate for a maximum of 30 minutes. It should be noted that during some phases, not all works that will take place will actually occur at the same time. This set of calculations therefore represents an absolute worst-case scenario.
4.2.11 Full details of the modelled plant for each phase and sub-phase, including source levels, references, operating locations and detailed utilisations are included in Appendix C.
Project number: 42544 Dated: 25/09/2014 11 Revised:
4.3 Mitigation by Design 4.3.1 WSP has been heavily involved with the design team commissioned to undertake the design of the
spoil distribution at the Minehead Site. In considering noise propagation from the construction activities, the design and phasing of the earth bunds being formed have been planned to maximise acoustic screening as soon as possible around the western perimeter of the main working platform.
4.3.2 The larger bund areas around the external areas of the Site and to the north-east of the main platform will be constructed by first pushing the top soils to the outer perimeter of the bund to form a temporary bund that will provide screening between the residential receptor and the continuing formation of the main bunds. As the internal structure of the bund is built up in sections, the outer topsoil bund will be ‘pulled’ back over the bund for final restoration. This procedure will be repeated with sub-soils forming the temporary bunds, until the full bund is completed with top-soils claimed from other areas of the Site loose laid over the bund area.
4.3.3 This process is demonstrated graphically in Figure 4.2 and ensures that the majority of the nosier plant associated with constructing the bunds, i.e. the bulldozers and compactors, benefit from some degree of visual and acoustic screening and only the initial deposits and final restoration works which do not require compaction, take place on the top and outer faces of the bunds.
4.3.4 The constant changes in the formation of the bunds, including ground heights and plant movements, make this means of mitigation very difficult to model without breaking down the phases into day-by-day scenarios. Therefore, to avoid generating an excessive number of results and undue complications, the representation of this mitigation measure within the noise model has been simplified to a single small earth bund positioned around the edge of the section of bund being worked during the relevant phase and basing all other works on the land contours as they are predicted to be at the end of the preceding phase.
4.3.5 The formation of these bunds are considered as temporary works that will provide long term environmental benefits and can therefore be assessed against the higher noise limits applicable to such works. However, based on the source noise level of an excavator being 103 dB and a minimum distance of 180m from the Site boundary and Parkdown Bungalow, the absolute worst-case noise level generated during the formation of the outer bunds would be 50 dB LAeq,1hr, assuming 100% on-time of an excavator at a fixed position at the far north-east corner of the bund area.
4.3.6 Where dumper trucks move from the main haul routes, across earth bunds and up to the position in which they deposit spoil loads, they will do so without driving directly over a bund at more than a 1:10 slope angle. Where bund sides are steeper than this, movements shall either navigate around bund edges or the bunds shall be formed to include a ‘cutting’ through which dumper trucks can pass at an appropriate incline.
4.3.7 The layout of the main site compound has considered acoustic mitigation by locating fixed items of plant such as the generators that will operate 24 hours per day, along the western boundary of the working platform where there is a steep cutting and natural acoustic screening to the nearest sensitive receptors to the west of the Site.
4.3.8 Fixed, close boarded 3m high timber screens will be installed throughout the construction phase along the western flank of the Site boundary, between Bunds A and B and around the perimeter of the Welfare facilities and associated access route, each as indicated on the Construction Site Plan in Figure 4.1.
4.3.9 Following the initial iteration of the noise models, the following plant items and activities have been identified as potentially giving rise to significant noise impacts at the surrounding receptors. Therefore, the mitigation measures detailed below have been proposed and incorporated into the final set of noise models and results presented in the succeeding section.
Rock Crusher: 4.3.10 The rock crusher is assumed to be a Sandvik QJ331 as per the Arup earthworks narrative, which has
a manufacturer’s published sound pressure level of up to 96 dB(A) at 7m, equivalent to 93 dB(A) at a reference distance of 10m. It is understood that this plant will generally be located within the main laydown area to the south of the main shaft platforms.
4.3.11 Subject to the extent of the crusher utilisation, it has the potential to give rise to significant noise impacts at many of the residential receptors surrounding the Site. In order to mitigate these impacts, the crusher will be located within an enclosed compound comprising close boarded or proprietary acoustic panels. The entry and egress points should be located on the east side of the compound.
4.3.12 The enclosure will be designed to ensure that noise levels propagating from the crusher do not exceed 82 dB(A) at a reference distance of 10m. In accordance with the methodology of BS 5228, this mitigated noise source is modelled with a sound power level of 110 dB(A).
4.3.13 The crusher will be utilised only during the daytime shift (07:00-19:00 hrs).
Grout/Concrete Batch Plants 4.3.14 It has been advised that the batching plants will be fully enclosed.
4.3.15 WSP has measured noise levels in the range of 74-79 dB(A), at a reference distance of 10m, from a number of open batching plants. Such noise levels have the potential to give rise to significant noise impacts during night-time hours at sensitive receptor locations.
4.3.16 The enclosing of the batching plants will therefore be designed to ensure that propagated noise levels are limited to 67 dB(A) at a reference distance of 10m. In accordance with the methodology of BS 5228, this mitigated noise source is modelled with a sound power level of 95 dB(A).
Generators 4.3.17 In order to provide sufficient power throughout the construction phase 18 to 20 1250kVA Diesel
Generator Sets will be required and will be located towards the south-west corner of the main laydown area to the south of the shaft platform. The proposed units have a manufacturer’s published noise level of 78 dB(A) at 7m, equivalent to 75 dB(A) at a reference distance of 10m.
4.3.18 During the latter stages of the shaft sinking process, when the power demand will be highest from the generators, the noise levels from these plant items alone will have the potential to be more than 10 dB over the night-time background noise levels at the residential receptors to the north and west of the Site.
4.3.19 In order to mitigate generator noise so that they are no greater than 10 dB above the background noise levels at any time at the residential receptors, individually they will need to be limited to 67 dB(A) at a reference distance of 10m (based on 20 No units20). Accordingly, a sound power level of 95 dB(A) per generator has been incorporated into the noise model.
4.3.20 Typically, in order to comply with these noise limits, the first action would be to source a suitable generator set, alternatively, additional screening could be introduced or the capacity of the generator increased to allow fewer numbers or lower operating loads, reducing the cumulative noise levels (provided the larger units are not significantly noisier).
4.3.21 It is understood however, that due to the Site’s high power demands, it may be difficult to obtain a sufficient number of quieter generator sets or higher capacity sets in order to reduce the total number of them on Site. It is also recognised that for safety reasons, the amount of space required between and around the generator sets may limit the potential for adequate acoustic screening.
20 If the quantity of generators changes, the noise limit will need to be re-calculated. i.e. 10 No units would have a limit of 70 dB(A) at 10m each
Project number: 42544 Dated: 25/09/2014 12 Revised:
4.3.22 It is considered that compliance with the limits specified above may impose a significant burden on construction operations as it would not allow sufficient power to be generated. In these circumstances, a 5 dB relaxation to the specified limits could be applied and would still ensure that cumulative noise levels are below the upper limit of 42 dB LAeq,1hr at the residential receptors under peak loadings during the night-time hours.
Initial Shaft Sinking 4.3.23 The drill rigs, excavators and Scott Derrick cranes that will be utilised during the initial stages of shaft
sinking will not individually give rise to significant noise impacts although, during peak capacity, they might result in noise levels that would marginally exceed the basic noise limits. Furthermore, simultaneous operation of all plant associated with the initial excavations from all shafts will have the potential to generate cumulative noise levels in excess of the upper design limits during the night periods at Parkdown Bungalow.
4.3.24 The likelihood of drilling occurring in every shaft at the same time during the night-time periods is very low, nevertheless, measures must be taken to ensure this will not happen – drilling activities must only take place in a maximum of two shafts during a night-time period.
4.3.25 Furthermore, drilling activities would not happen alongside mucking-out or hoisting activities in the same shaft at the same time and the maximum utilisation in the noise model is setup to reflect this.
4.3.26 Adopting these mitigation measures can ensure than noise levels at Parkdown Bungalow do not exceed the upper limit of 42 dB LAeq,1hr during the night-time period, however, the exact noise levels will be subject to the combination of activities taking place and may still have the potential to give rise to significant impacts. In order to ensure that noise levels remain within the specific limits, active noise monitoring should be established with suitable alerts that can warn in advance of potential exceedances at the residential receptor.
Temporary Shaft Ventilation Fans 4.3.27 WSP has been advised that the temporary ventilation fans at the head of each shaft will be in the
order of 450kW. Whilst specific selections have not been made, such fans would be of considerably size and have source sound power levels in excess of 100 dB(A).
4.3.28 Once operational, these ventilation fans will run continuously over a 24 hour period (or at least be configured as a run and stand-by pair to provide continuous ventilation) and will have the potential to give rise to significant noise impacts at the surrounding residential receptors during the evening and night-time periods.
4.3.29 Accordingly, all ventilation fans must be lagged/enclosed and fitted with appropriate atmosphere side silencers that mitigate the operational fan noise level to a maximum of 65 dB(A) at a reference distance of 10m each. In accordance with the methodology of BS 5228, this mitigated noise source is modelled with a sound power level of 93 dB(A).
Shaft Head Frames 4.3.30 The significant noise sources associated with the temporary head-frames used for the sinking of the
Minerals, Men and Materials and MTS shafts are the winding motors and the head gear as the hoisting kibble deposits the rock and spoil into the chute.
4.3.31 Noise levels for the winding motors have been supplied by Worley Parsons and are in the order of 60-70 dB(A) at a reference distance of 10m whilst the kibble deposits have been assumed to be similar to a loader dropping pebbles into a dump truck, as referenced in Table C.10 (item 12) of BS 5228, with a level of 82 dB(A) at a reference distance of 10m.
4.3.32 However, it is understood that the head-frames will be fully enclosed structures comprising lightweight cladding materials. Typical cladding materials offer sound insulation performances of at least Rw = 17 dB and shall be used for the construction of the head-frames.
4.3.33 The design of the head frame cladding shall therefore ensure that propagated noise levels do not exceed 65 dB(A) at a reference distance of 10m from the headgear. In accordance with the methodology of BS 5228, the mitigated headgear is modelled with a sound power level of 93 dB(A) and the winding gear sound power levels shall be no greater than 81 dB(A).
4.3.34 Cladding and enclosing the head-frames will ensure that noise levels from individual head-frames are below the upper limit of 42 dB LAeq,1hr during the night-time periods at Parkdown Bungalow; however, cumulative worst case operating conditions of all three head-frames could still exceed the preferred limit of 10 dB above the background noise level.
4.3.35 In order to further reduce the noise levels from the head-frames, cladding material with a greater mass would be required which may also dictate significantly heavier-weight framing structures, with consequent implications for cost and construction time. Alternatively, if only one of the three head-frames were to operate at any one time during a night-time period, this would sufficiently reduce the cumulative noise levels without the need for further measures.
4.3.36 Both cases could impose an undue burden on operations and have therefore not been offered as committed mitigation measures.
Drift Tunnel 4.3.37 WSP has modelled the drift tunnel construction using either a Road Header operating 24 hours per
day or by Drill & Blast techniques.
4.3.38 The Road Header source data have been taken from the EU Directive as a sound power level of 110 dB(A), equivalent to 82 dB(A) at a reference distance of 10m. The drill and blast method utilised noise data for a drill rig, referenced in Table C.9 (item 1) of BS 5228, with a level of 90 dB(A) at a reference distance of 10m.
4.3.39 Overall, a road header is likely to have appreciably less noise impact than utilising drill and blast techniques, however, either option will have significant impacts at the Soulsgrave Farm property to the south-east of the Site.
4.3.40 During the initial stages of tunnelling, a temporary screen should be erected to the south of the tunnel opening. The screen should span the width and height of the box cut excavations and should be positioned as close to the tunnel opening as access requirements will allow (a mobile screen option should be considered to aid this) so as to provide at least a 6 dB reduction to the noise levels propagating away from the tunnel portal.
4.3.41 The Road Header would therefore be subject to a mitigated noise level of 76 dB(A) at a reference distance of 10m and the drill rig, with a mitigated level of 84 dB(A) at a reference distance of 10m. In accordance with the methodology of BS 5228, these mitigated noise sources are modelled with sound power levels of 104 dB(A) and 112 dB(A) respectively.
Project number: 42544 Dated: 25/09/2014 13 Revised:
4.4 Impacts 4.4.1 The following sub-sections present the results of the noise model predictions including the committed
mitigation measures referenced in the preceding section of this chapter. Results are listed for each of the identified receptor locations and for each of the assessment periods.
4.4.2 The maximum 1-hour predicted noise level is listed alongside the typical results in order to provide context for the predictions and identify where potentially significant noise levels may be expected continuously or just for short periods of time.
4.4.3 Where predicted noise levels exceed the noise limits for long term works (to avoid undue burden) as referred to in the third column of criteria in Table 4.1, the result is highlighted in yellow, whilst noise levels that are predicted to exceed the upper fixed limits for long term works (where undue burden would otherwise be incurred) are highlighted in red. Where any such levels are predicted, they are discussed in further detail, including identification of the dominant noise sources.
Phase 1 Month 2 4.4.4 Table 4.2 below, presents the predicted typical and worst-case construction noise levels during
Month 2 of Phase 1. The results are also presented graphically in Figures D1 and D2 of Appendix D.
Table 4.2: Construction Noise Predictions for Phase 1, Month 2
Receptor location Daytime (07:00-19:00) Evening (19:00-22:00) Night-time (22:00-07:00) Typical LAeq,T
Maximum LAeq,1hr
Typical LAeq,T
Maximum LAeq,1hr
Typical LAeq,T
Maximum LAeq,1hr
Parkdown Bungalow 47 dB 50 dB 28 dB 28 dB 28 dB 28 dB
Thornhill 39 dB 40 dB 28 dB 28 dB 28 dB 28 dB
Moor House Farm 41 dB 42 dB 32 dB 32 dB 32 dB 32 dB
Moorside Farm 39 dB 40 dB 29 dB 29 dB 29 dB 29 dB
Soulsgrave Farm 43 dB 44 dB 33 dB 33 dB 33 dB 33 dB
4.4.5 The results demonstrate that construction noise levels typically will be within the lower design limit during Month 2 of Phase 1.
4.4.6 There is however a potential that noise could exceed the lower design criteria under worst case 1-hour operating conditions and additional analysis of this result has identified the tree clearance works at the central area of the Site as being the dominant noise source. These works are not expected to last for the duration of this sub-phase and will therefore be very short term relative to the long term earthworks involved in the overall construction process.
4.4.7 Furthermore, where tree clearance works do have the potential to generate significant noise impacts, the associated noise levels are within the upper, fixed limits for long-term earthworks, temporary beneficial works and general construction activities.
Phase 1 Month 3 4.4.8 Table 4.3 below, presents the predicted typical and worst-case construction noise levels during
Month 3 of Phase 1. The results are also presented graphically in Figures D3 and D4 of Appendix D.
Table 4.3: Construction Noise Predictions for Phase 1, Month 3
Receptor location Daytime (07:00-19:00) Evening (19:00-22:00) Night-time (22:00-07:00) Typical LAeq,T
Maximum LAeq,1hr
Typical LAeq,T
Maximum LAeq,1hr
Typical LAeq,T
Maximum LAeq,1hr
Parkdown Bungalow 43 dB 44 dB 33 dB 35 dB 33 dB 35 dB
Thornhill 37 dB 38 dB 31 dB 33 dB 31 dB 33 dB
Moor House Farm 41 dB 42 dB 34 dB 36 dB 34 dB 36 dB
Moorside Farm 38 dB 40 dB 32 dB 34 dB 32 dB 34 dB
Soulsgrave Farm 40 dB 41 dB 35 dB 35 dB 35 dB 35 dB
4.4.9 All predicted construction noise levels during Month 3 of Phase 1 fall within the lower design limits at each of the surrounding residential receptors during typical and worst case working conditions.
4.4.10 This month sees the commencement of the outer edge of Bund F at the north-eastern corner of the Site, nearest to Parkdown Bungalow. These specific works are not predicted to give rise to noise levels of more than 35 dB(A) at Parkdown Bungalow under the modelled conditions. This allows significant tolerance for any uncertainty before encroaching on the lower design limit.
4.4.11 Furthermore, and as previously discussed in Section 4.3, the absolute maximum noise level likely to be produced by the bund forming plant would still fall within the fixed upper limits for daytime earthwork movements as well as the allowable temporary limit for short-term beneficial works.
Phase 1 Month 4 4.4.12 Table 4.4 below, presents the predicted typical and worst-case construction noise levels during
Month 4 of Phase 1. The results are also presented graphically in Figures D5 and D6 of Appendix D.
Table 4.4: Construction Noise Predictions for Phase 1, Month 4
Receptor location Daytime (07:00-19:00) Evening (19:00-22:00) Night-time (22:00-07:00) Typical LAeq,T
Maximum LAeq,1hr
Typical LAeq,T
Maximum LAeq,1hr
Typical LAeq,T
Maximum LAeq,1hr
Parkdown Bungalow 44 dB 45 dB 33 dB 35 dB 33 dB 35 dB
Thornhill 36 dB 38 dB 29 dB 32 dB 29 dB 32 dB
Moor House Farm 40 dB 42 dB 32 dB 35 dB 32 dB 35 dB
Moorside Farm 37 dB 39 dB 30 dB 33 dB 30 dB 33 dB
Soulsgrave Farm 40 dB 41 dB 31 dB 33 dB 31 dB 33 dB
4.4.13 All predicted construction noise levels during Month 4 of Phase 1 fall within the lower design limits at each of the surrounding residential receptors during typical and worst case working conditions.
4.4.14 This month sees the continuation of the outer edge of Bund F at the north-eastern corner of the Site, nearest to Parkdown Bungalow. It has been assumed that during this period, the initial temporary outer topsoil bund has been incorporated and the main bund forming works take place inside this area. As previously discussed in Section 4.3, any temporary works associated with the outer bunds will be within the fixed upper limits for daytime earthwork movements.
4.4.15 The dominant noise source during this period is the rock crusher (when functioning). At all other times, including the evening and night-time periods, the grouting rigs working around each of the shaft/chamber areas will produce the highest noise levels at the residential receptors. These levels will be in the order of 25-30 dB(A) at the most affected receptor locations during worst case conditions and hence, unlikely to be significantly higher than the underlying background noise levels.
Project number: 42544 Dated: 25/09/2014 14 Revised:
Phase 1 Months 5-6 4.4.16 Table 4.5 below, presents the predicted typical and worst-case construction noise levels during
Months 5 and 6 of Phase 1. The results are also presented graphically in Figures D7 and D8 of Appendix D.
Table 4.5: Construction Noise Predictions for Phase 1, Months 5-6
Receptor location Daytime (07:00-19:00) Evening (19:00-22:00) Night-time (22:00-07:00) Typical LAeq,T
Maximum LAeq,1hr
Typical LAeq,T
Maximum LAeq,1hr
Typical LAeq,T
Maximum LAeq,1hr
Parkdown Bungalow 42 dB 43 dB 41 dB 42 dB 41 dB 42 dB
Thornhill 36 dB 38 dB 35 dB 37 dB 35 dB 37 dB
Moor House Farm 38 dB 39 dB 37 dB 38 dB 37 dB 38 dB
Moorside Farm 36 dB 37 dB 35 dB 36 dB 35 dB 36 dB
Soulsgrave Farm 38 dB 39 dB 36 dB 37 dB 36 dB 37 dB
4.4.17 Noise levels during the night-time at Parkdown Bungalow have the potential to be more than 10 dB above the background noise levels. The dominant sources contributing to these noise levels are associated with the Scott Derrick cranes used for the initial shaft/chamber sinking works.
4.4.18 The predicted noise levels for this phase are based on the assumption that all cranes are operating simultaneously at 85% utilisation for typical scenario and 100% utilisation for the maximum LAeq,1hr level. In order to ensure that the noise levels do not exceed 10 dB over the background noise level, a 5 dB reduction would be required, equivalent to reducing the combined crane utilisation to approximately 30% in any 1-hour period.
4.4.19 Therefore, it is considered that mitigating initial shaft sinking noise levels during the night-time period to ensure compliance with the lower design limits would impose an undue burden on the construction process.
Phase 2 Months 7-13
4.4.20 Table 4.6 below, presents the predicted typical and worst-case construction noise levels during the first 7 months of Phase 2, excluding any contributions from the construction of the Drift Tunnel. Construction noise associated with the Drift Tunnel is only predicted to have any significant effect at Soulsgrave Farm. Therefore, the results of the Drift Tunnel predictions are listed separately in Table 4.7
4.4.21 All results are also presented graphically in Figures D9 - D12 of Appendix D.
Table 4.6: Construction Noise Predictions for Phase 2, Month 7-13, Excluding Drift Tunnel
Receptor location Daytime (07:00-19:00) Evening (19:00-22:00) Night-time (22:00-07:00) Typical LAeq,T
Maximum LAeq,1hr
Typical LAeq,T
Maximum LAeq,1hr
Typical LAeq,T
Maximum LAeq,1hr
Parkdown Bungalow 43 dB 45 dB 42 dB 44 dB 42 dB 44 dB
Thornhill 40 dB 42 dB 36 dB 38 dB 36 dB 37 dB
Moor House Farm 41 dB 42 dB 38 dB 39 dB 38 dB 39 dB
Moorside Farm 39 dB 41 dB 35 dB 37 dB 35 dB 37 dB
Soulsgrave Farm 40 dB 42 dB 37 dB 40 dB 37 dB 39 dB
4.4.22 Worst case noise levels during the evening and night-time periods at Parkdown Bungalow have the potential to be more than 10 dB above the background noise levels and potentially in excess of the upper night-time design limit. The dominant sources contributing to these noise levels are associated with the Scott Derrick cranes, drill rigs and excavators used for the initial shaft/chamber sinking works.
4.4.23 The noise model has assumed that the excavators and cranes would not operate at the same time as the drill rigs (as detailed in Appendix C), therefore the maximum noise level may vary slightly depending on exactly which items of plant are operating.
4.4.24 It has been recommended in Section 4.3 above, that detailed noise monitoring is carried out during this period to assist with co-ordinating the shaft sinking activities such that they do not, cumulatively, give rise to excessive noise levels at the residential receptors.
4.4.25 As the worst case noise levels only marginally exceed the upper limits during the night-time period, it is likely that only minimal effort will be required in order to mitigate the noise levels to below this threshold. However, in order to further mitigate levels to be no more than 10 dB above the night-time background noise at Parkdown Bungalow it is likely to require significant restrictions on operations which could result in delays to the construction programme.
4.4.26 Therefore it is considered that mitigating initial shaft sinking noise levels during the night-time period to ensure compliance with the lower design limits would impose an undue burden on the construction process.
Table 4.7: Cumulative Noise Predictions (including Drift Tunnel) at Soulsgrave Farm
Receptor location Daytime (07:00-19:00) Evening (19:00-22:00) Night-time (22:00-07:00) Typical LAeq,T
Maximum LAeq,1hr
Typical LAeq,T
Maximum LAeq,1hr
Typical LAeq,T
Maximum LAeq,1hr
Excluding Drift Tunnel 40 dB 42 dB 37 dB 40 dB 37 dB 39 dB
Road Header Method 40 dB 42 dB 37 dB 40 dB 37 dB 40 dB
Drill and Blast Method 40 dB 43 dB 38 dB 41 dB 38 dB 41 dB
4.4.27 The mitigated Drift Tunnel construction noise level are predicted to be greater than 10 dB above the background noise levels during the night-time period at Soulsgrave Farm, regardless of which construction method is adopted.
4.4.28 It is recommended that active noise monitoring with suitable alerts should be established at Soulsgrave Farm during this period in order to monitor the effectiveness and requirement for the acoustic screen referred to in the mitigation section above.
4.4.29 Furthermore, if drill and blast methods are adopted then all efforts should be made to restrict drilling (the noisiest of the associated activities) to daytime operations only in order to avoid night-time impacts.
Project number: 42544 Dated: 25/09/2014 15 Revised:
Phase 2 Months 14-17 4.4.30 Table 4.8 below, presents the predicted typical and worst-case construction noise levels during latter
months of Phase 2. The results are also presented graphically in Figures D13 and D14 of Appendix D.
Table 4.8: Construction Noise Predictions for Phase 2, Months 14-17
Receptor location Daytime (07:00-19:00) Evening (19:00-22:00) Night-time (22:00-07:00) Typical LAeq,T
Maximum LAeq,1hr
Typical LAeq,T
Maximum LAeq,1hr
Typical LAeq,T
Maximum LAeq,1hr
Parkdown Bungalow 40 dB 43 dB 38 dB 41 dB 38 dB 39 dB
Thornhill 39 dB 41 dB 32 dB 36 dB 32 dB 34 dB
Moor House Farm 39 dB 41 dB 33 dB 37 dB 33 dB 36 dB
Moorside Farm 38 dB 40 dB 31 dB 35 dB 31 dB 34 dB
Soulsgrave Farm 38 dB 41 dB 33 dB 37 dB 33 dB 37 dB
4.4.31 Maximum/worst case noise levels during the night-time at Parkdown Bungalow have the potential to be more than 10 dB above the background noise levels. The dominant sources contributing to these noise levels are associated with the All-Terrain Dumper (ATD) movements, primarily from the exhaust vent and MTS shafts.
4.4.32 Spoil movements will be necessary to ensure shaft sinking activities can continue and the platform areas surrounding the shaft are kept clear. During the night-time period, the spoil will be deposited at the relevant bund location to avoid double-handling of the material but will not be worked until the daytime working shift commences.
4.4.33 The noise model predictions, as stated above, assume nominal ATD movements on the haul routes as indicated in Appendix C. However, it is likely that actual ATD movements will deviate from such a definitive path for any number of reasons.
4.4.34 Such ATD movements have been identified as giving rise to potential significant impacts, Appendix E considers the impact of night-time spoil movements in detail and designates an exclusion zone to avoid noise levels at night exceeding the upper fixed limit of 42 dB LAeq,T at any of the surrounding residential receptors. The zone identified, within which ATD movements may give rise to noise levels being more than 10 dB above the background level at the residential receptors, includes the areas surrounding the MTS, Minerals and Men and Materials shafts. Therefore, restricting night-time ATD movements such that their noise levels do not exceed 10 dB above the background noise level would impose an undue burden on the proposed construction procedures.
4.4.35 Notwithstanding this, a programme to monitor the night-time noise levels at Parkdown Bungalow should be set-up to ensure that if cumulative noise levels associated with ATD movements approach the upper design limits, spoil deposits are diverted to alternative locations as appropriate.
Phase 3 Months 18-24 4.4.36 Table 4.9 below, presents the predicted typical and worst-case construction noise levels during
Phase 3. The results are also presented graphically in Figures D15 and D16 of Appendix D.
Table 4.9: Construction Noise Predictions for Phase 3
Receptor location Daytime (07:00-19:00) Evening (19:00-22:00) Night-time (22:00-07:00) Typical LAeq,T
Maximum LAeq,1hr
Typical LAeq,T
Maximum LAeq,1hr
Typical LAeq,T
Maximum LAeq,1hr
Parkdown Bungalow 37 dB 42 dB 34 dB 40 dB 35 dB 39 dB
Thornhill 31 dB 36 dB 30 dB 36 dB 30 dB 34 dB
Moor House Farm 33 dB 38 dB 32 dB 37 dB 32 dB 36 dB
Moorside Farm 31 dB 36 dB 30 dB 35 dB 30 dB 34 dB
Soulsgrave Farm 34 dB 38 dB 31 dB 37 dB 31 dB 36 dB
4.4.37 Maximum/worst case noise levels during the night-time at Parkdown Bungalow have the potential to be more than 10 dB above the background noise levels. The dominant sources contributing to these noise levels are the head-frames depositing spoil into the All-Terrain Dumpers and the associated movements, taking the spoil deposits away from the shaft platforms.
4.4.38 The predicted worst case noise level is only 1 dB above the ‘background plus 10 dB’ criterion at Parkdown Bungalow and is based on the minimum sound reduction for the head-frame cladding (as referred to in Section 4.3) and that all three head-frames simultaneously deposit spoil within the same 1-hour period.
4.4.39 In practice, the shaft sinking activities in each shaft are unlikely to sustain an exact, co-ordinated pattern and the individual activities involved in the sinking process would become staggered across the three shafts. Furthermore, the typical predicted noise levels, more representative of staggered activities, are within the ‘background plus 10 dB’ criterion at all times. Therefore, the predicted worst case noise levels are considered to be minority occurrences and do not warrant the implementation of any further mitigation measures.
Phase 4 Months 25-32 4.4.40 Table 4.10 below, presents the predicted typical and worst-case construction noise levels during
Phase 4. The results are also presented graphically in Figures D17 and D18 of Appendix D.
Table 4.10: Construction Noise Predictions for Phase 4
Receptor location Daytime (07:00-19:00) Evening (19:00-22:00) Night-time (22:00-07:00) Typical LAeq,T
Maximum LAeq,1hr
Typical LAeq,T
Maximum LAeq,1hr
Typical LAeq,T
Maximum LAeq,1hr
Parkdown Bungalow 41 dB 45 dB 36 dB 39 dB 36 dB 38 dB
Thornhill 35 dB 39 dB 31 dB 35 dB 31 dB 34 dB
Moor House Farm 36 dB 39 dB 33 dB 36 dB 33 dB 36 dB
Moorside Farm 35 dB 38 dB 31 dB 34 dB 31 dB 34 dB
Soulsgrave Farm 46 dB 50 dB 32 dB 35 dB 32 dB 35 dB
4.4.41 Maximum noise levels are predicted to reach 50 dB(A) at Soulsgrave Farm during the daytime, exceeding 10 dB above the background noise levels. These noise levels are dominated by the construction works associated with the Welfare facilities to the south-east of the Site.
4.4.42 These construction works are not considered to be akin to long-term earthworks or mineral extraction and would therefore be subject to the relevant ‘ABC’ construction noise criterion of 65 dB LAeq,T.
Project number: 42544 Dated: 25/09/2014 16 Revised:
4.4.43 In the absence of construction activities associated with the Welfare facilities, the worst case long-term earthworks and shaft sinking noise levels are predicted to be less than 40 dB LAeq,1hr at Soulsgrave Farm during this Phase.
Phase 5 Months 33-40 4.4.44 Table 4.11 below, presents the predicted typical and worst-case construction noise levels during
Phase 5. The results are also presented graphically in Figures D19 and D20 of Appendix D.
Table 4.11: Construction Noise Predictions for Phase 5
Receptor location Daytime (07:00-19:00) Evening (19:00-22:00) Night-time (22:00-07:00) Typical LAeq,T
Maximum LAeq,1hr
Typical LAeq,T
Maximum LAeq,1hr
Typical LAeq,T
Maximum LAeq,1hr
Parkdown Bungalow 40 dB 42 dB 34 dB 38 dB 34 dB 37 dB
Thornhill 36 dB 40 dB 31 dB 35 dB 31 dB 34 dB
Moor House Farm 38 dB 43 dB 33 dB 36 dB 33 dB 35 dB
Moorside Farm 36 dB 40 dB 31 dB 34 dB 31 dB 33 dB
Soulsgrave Farm 45 dB 41 dB 32 dB 35 dB 32 dB 34 dB
4.4.45 All predicted noise levels during Phase 5 fall within the lower design limits at each of the surrounding residential receptors during typical and worst case working conditions. These predictions include contributions from the general construction activities associated with the Welfare facilities and Ventilation Fan House.
4.4.46 The construction of the Fan House is due to follow the completion of the Welfare facilities. Therefore, it is not expected that there will be any cumulative impacts due to simultaneous construction activities. Notwithstanding this, the Welfare facilities and Fan House are sufficiently separated from each other and the nearest residential dwelling that any programme changes that result in overlapping construction works will have a negligible effect on the cumulative noise levels.
Phase 6 Months 41-42 4.4.47 Table 4.12 below, presents the predicted typical and worst-case construction noise levels during the
first two months of Phase 6. The results are also presented graphically in Figures D21 and D22 of Appendix D.
Table 4.12: Construction Noise Predictions for Phase 6 Months 41-42
Receptor location Daytime (07:00-19:00) Evening (19:00-22:00) Night-time (22:00-07:00) Typical LAeq,T
Maximum LAeq,1hr
Typical LAeq,T
Maximum LAeq,1hr
Typical LAeq,T
Maximum LAeq,1hr
Parkdown Bungalow 41 dB 42 dB 32 dB 37 dB 32 dB 35 dB
Thornhill 38 dB 39 dB 28 dB 33 dB 28 dB 31 dB
Moor House Farm 43 dB 43 dB 33 dB 36 dB 33 dB 35 dB
Moorside Farm 40 dB 41 dB 31 dB 33 dB 31 dB 33 dB
Soulsgrave Farm 41 dB 41 dB 29 dB 33 dB 29 dB 31 dB
4.4.48 All predicted noise levels during the first two months of Phase 6 fall within the lower design limits at each of the surrounding residential receptors during typical and worst case working conditions.
4.4.49 With the exception of the removal of the remaining non-hazardous, non-inert spoil from Site, all other earthworks and bund formations are due to be complete by the end of month 42. Should there be
any delays to the completion of the bunds, the above noise levels are likely to prevail until such works are fully complete.
Phase 6 Months 43-51 4.4.50 Table 4.13 below, presents the predicted typical and worst-case construction noise levels during
Phase 6 when the equipping and construction of the Men and Materials shaft/building take place. The results are also presented graphically in Figures D23 and D24 of Appendix D.
Table 4.13: Construction Noise Predictions for Phase 1, Month 3
Receptor location Daytime (07:00-19:00) Evening (19:00-22:00) Night-time (22:00-07:00) Typical LAeq,T
Maximum LAeq,1hr
Typical LAeq,T
Maximum LAeq,1hr
Typical LAeq,T
Maximum LAeq,1hr
Parkdown Bungalow 33 dB 36 dB 23 dB 24 dB 23 dB 24 dB
Thornhill 34 dB 38 dB 27 dB 29 dB 27 dB 29 dB
Moor House Farm 37 dB 40 dB 33 dB 35 dB 33 dB 35 dB
Moorside Farm 35 dB 38 dB 30 dB 32 dB 30 dB 32 dB
Soulsgrave Farm 36 dB 39 dB 27 dB 29 dB 27 dB 29 dB
Phase 6 Months 52-60 4.4.51 Table 4.14 below, presents the predicted typical and worst-case construction noise levels during
Phase 6 when the equipping and construction of the Minerals shaft/building take place. The results are also presented graphically in Figures D25 and D26 of Appendix D.
Table 4.14: Construction Noise Predictions for Phase 1, Month 3
Receptor location Daytime (07:00-19:00) Evening (19:00-22:00) Night-time (22:00-07:00) Typical LAeq,T
Maximum LAeq,1hr
Typical LAeq,T
Maximum LAeq,1hr
Typical LAeq,T
Maximum LAeq,1hr
Parkdown Bungalow 33 dB 36 dB 21 dB 22 dB 21 dB 22 dB
Thornhill 32 dB 35 dB 26 dB 27 dB 26 dB 27 dB
Moor House Farm 35 dB 38 dB 32 dB 33 dB 32 dB 33 dB
Moorside Farm 33 dB 36 dB 29 dB 30 dB 29 dB 30 dB
Soulsgrave Farm 34 dB 37 dB 25 dB 27 dB 25 dB 27 dB
4.4.52 All predicted noise levels during the latter months of Phase 6 fall within the lower design limits at each of the surrounding residential receptors during typical and worst case working conditions.
4.4.53 These predictions include noise associated with the construction of the main shaft head buildings and would therefore be subject to appropriate daytime noise limits of 65 dB LAeq,T in accordance with the ‘ABC’ method defined in BS 5228-1.
4.4.54 The predictions in this Phase include for the export of the remaining non-hazardous, non-inert spoil from site and assume that the temporary shaft ventilation fans have been decommissioned and the fans within the permanent fan house will instead be functioning at operational duty.
Project number: 42544 Dated: 25/09/2014 17 Revised:
4.5 Discussion of Results 4.5.1 The first six months of the construction process will see the greatest noise impacts associated with
the earthworks as the formation of the perimeter bunds takes place at the minimum separation distance to the residential receptors. Notwithstanding this, the worst case identified noise impacts are associated with the tree clearance works at the outset of the construction phases. Such activities are only expected to last for a couple of weeks and are within the satisfactory upper limits for temporary works.
4.5.2 The formation of the outer perimeter bunds will be prioritised to offer screening of the continuing works at and around the main shaft areas. Furthermore, where these bunds are exposed to nearby residential receptors and will take longer to form, they will incorporate mitigation measures into the design to minimise the potential noise (and visual) impacts to the receptors.
4.5.3 The vast majority of the activities associated with the earthworks and landscaping of the Site have been predicted to be no more than 10 dB above the existing background noise levels at any of the surrounding residential receptors and therefore satisfy the design guidance provided in BS 5228-1 and the PPG for the NNPF.
4.5.4 At the end of Phase 1 and the initial stages of Phase 2, the cumulative noise impacts associated with the excavation of all shafts and chambers in the Site will have the potential to generate noise levels that could exceed 10 dB above the background noise levels and, unless carefully co-ordinated, could also exceed the upper fixed limit during the night-time at Parkdown Bungalow.
4.5.5 In order to ensure that the noise levels remain within satisfactory limits without imposing undue burden on the construction programme (by introducing fixed times restrictions, for example), it is recommended that noise monitoring be conducted at the most noise sensitive receptor, Parkdown Bungalow. Constant monitoring of the noise levels and a suitable alert system will allow activities to be managed actively such that cumulative noise levels do not exceed the appropriate limits.
4.5.6 Noise levels typically will be highest at Parkdown Bungalow and provided that construction activities are managed to suit the limits there, they would also be within acceptable levels at the other identified residential receptors. One exception to this generalisation is the initial tunnelling works associated with the Drift Tunnel which have been predicted to result in potentially significant noise impacts at Soulsgrave Farm, to the south-east.
4.5.7 The initial tunnelling works, whether by road header or drill and blast techniques, will need to be acoustically screened to prevent excessive noise at Soulsgrave Farm. Furthermore, if drill and blast techniques are adopted, the drilling activities should be restricted to daytime hours only during the initial sections of tunnelling. Noise monitoring at (or in the direction of) Soulsgrave Farm will assist with determining the precise screening requirements and duration for which it should remain in-situ.
4.5.8 Once the initial surface works and shallow excavations have been completed and the Men and Material, Mineral and MTS shafts are progressed, the potential for significant noise impacts at the nearby residential receptors will reduce. However, it is recommended that noise monitoring at the most sensitive receptor location (Parkdown Bungalow) is continued in order to ensure that potentially noisy activities can be managed appropriately.
4.5.9 It should be noted that all predictions are based on the current design scheme, schedule and assumed plant equipment and utilisations, which of course may vary, subject to the appointed contractor’s approach and any unforeseen circumstances that might impact on the actual progression and procedures.
4.5.10 However, the predictions demonstrate that unless mitigation measures would otherwise dictate an unreasonable burden on the construction process or programme, it is feasible that the Minehead Site can be constructed without imposing significant noise impacts to the surrounding residential receptors.
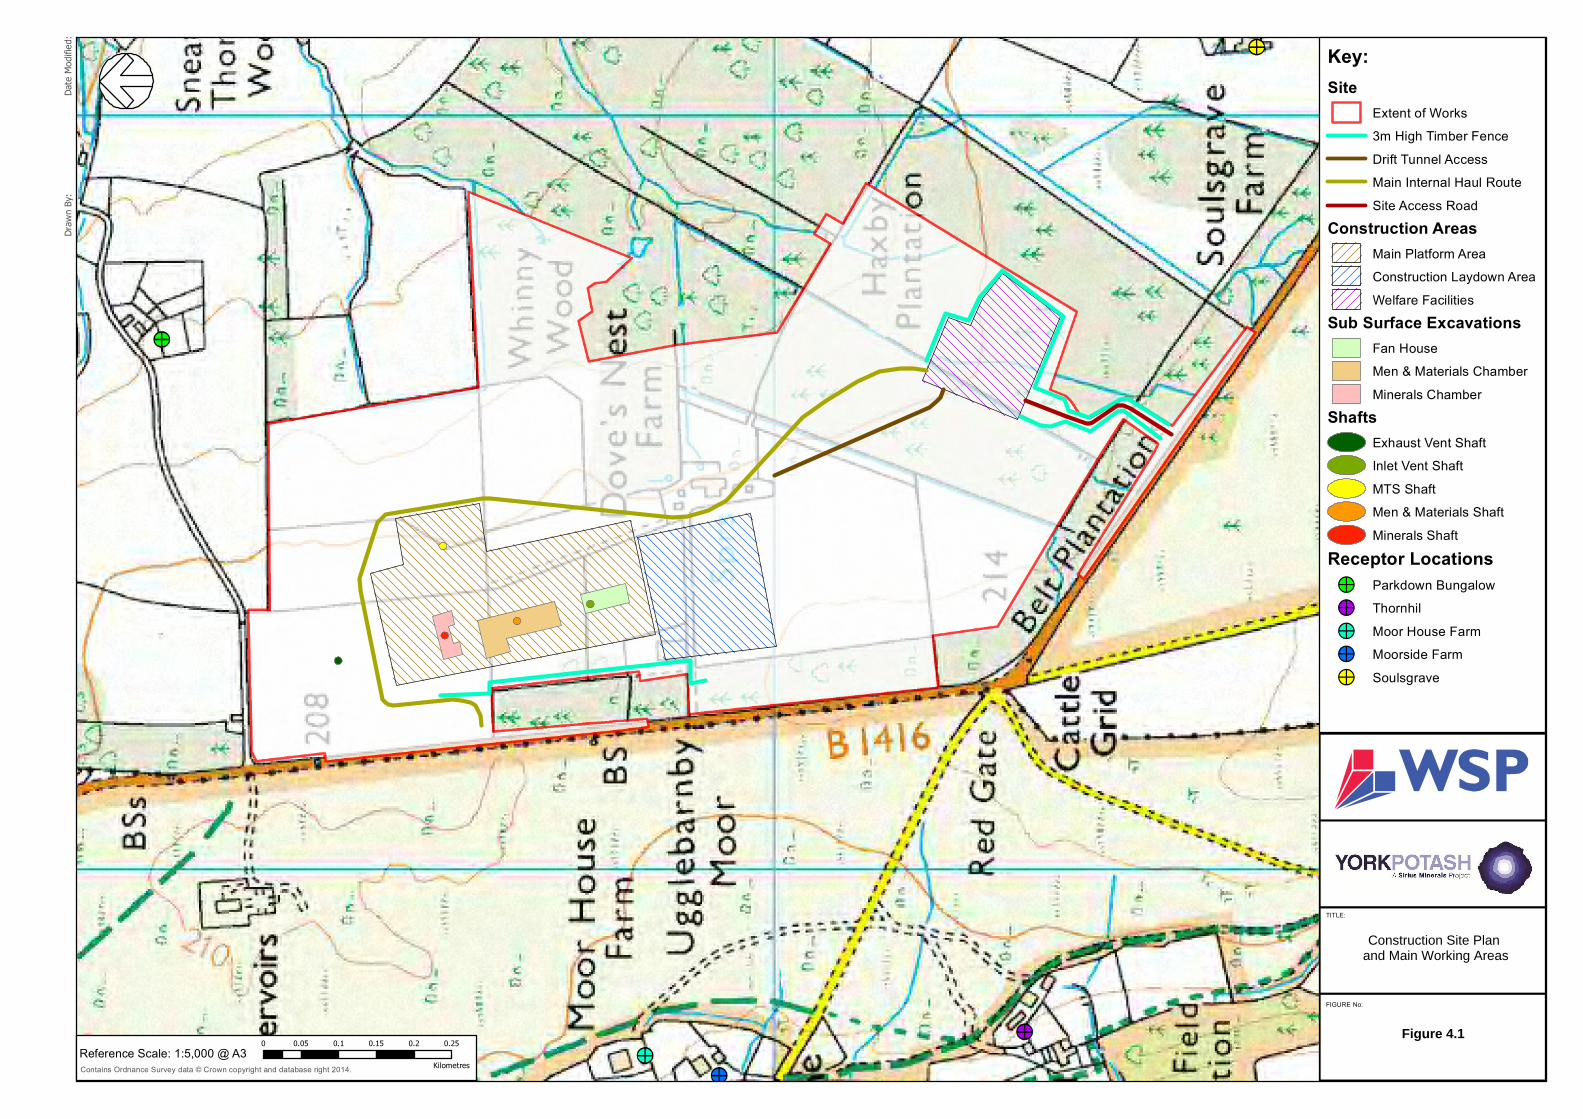
Draw
n By:
Date
Modif
ied:
Contains Ordnance Survey data © Crown copyright and database right 2014.
0 0.05 0.1 0.15 0.2 0.25
KilometresReference Scale: 1:5,000 @ A3
Key:Site
Extent of Works3m High Timber FenceDrift Tunnel AccessMain Internal Haul RouteSite Access Road
Construction AreasMain Platform AreaConstruction Laydown AreaWelfare Facilities
Sub Surface ExcavationsFan HouseMen & Materials ChamberMinerals Chamber
ShaftsExhaust Vent ShaftInlet Vent ShaftMTS ShaftMen & Materials ShaftMinerals Shaft
Receptor Locations!> Parkdown Bungalow!> Thornhil!> Moor House Farm!> Moorside Farm!> Soulsgrave
FIGURE No:
TITLE:
Construction Site Plan and Main Working Areas
Figure 4.1
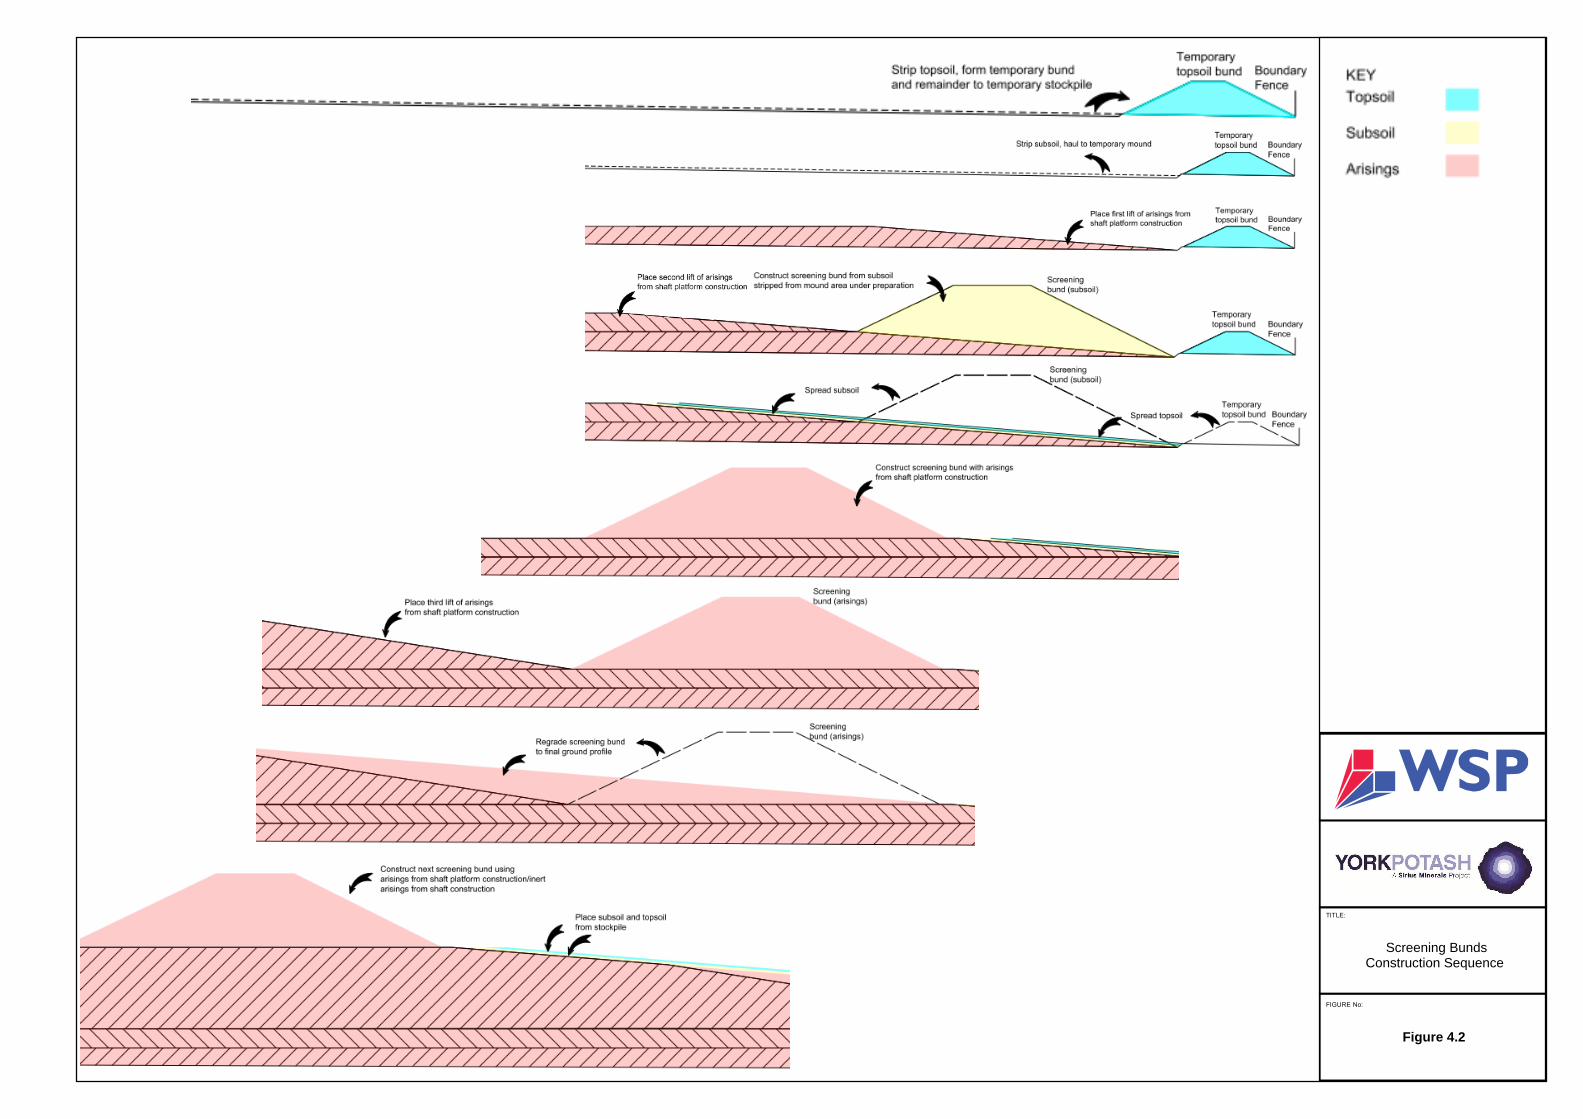
Contains Ordnance Survey data © Crown copyright and database right 2014.
FIGURE No:
TITLE:
Screening BundsConstruction Sequence
Figure 4.2
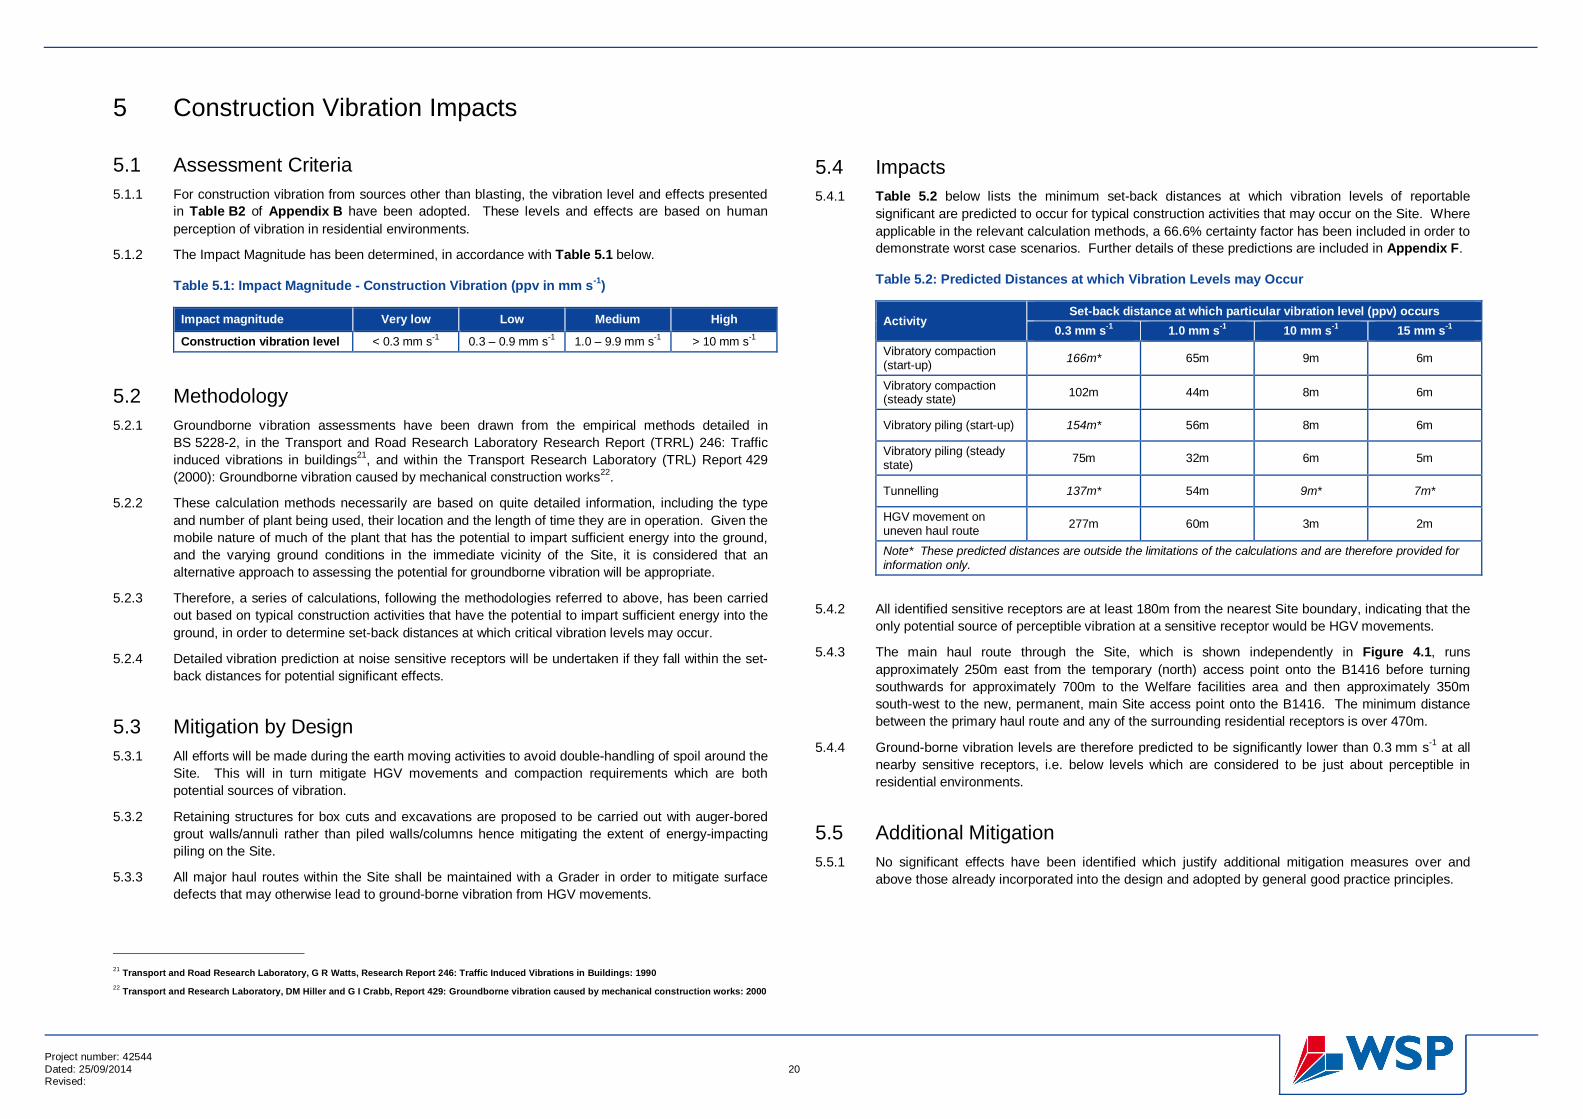
Project number: 42544 Dated: 25/09/2014 20 Revised:
5 Construction Vibration Impacts
5.1 Assessment Criteria 5.1.1 For construction vibration from sources other than blasting, the vibration level and effects presented
in Table B2 of Appendix B have been adopted. These levels and effects are based on human perception of vibration in residential environments.
5.1.2 The Impact Magnitude has been determined, in accordance with Table 5.1 below.
Table 5.1: Impact Magnitude - Construction Vibration (ppv in mm s-1)
Impact magnitude Very low Low Medium High
Construction vibration level < 0.3 mm s-1 0.3 – 0.9 mm s-1 1.0 – 9.9 mm s-1 > 10 mm s-1
5.2 Methodology 5.2.1 Groundborne vibration assessments have been drawn from the empirical methods detailed in
BS 5228-2, in the Transport and Road Research Laboratory Research Report (TRRL) 246: Traffic induced vibrations in buildings21, and within the Transport Research Laboratory (TRL) Report 429 (2000): Groundborne vibration caused by mechanical construction works22.
5.2.2 These calculation methods necessarily are based on quite detailed information, including the type and number of plant being used, their location and the length of time they are in operation. Given the mobile nature of much of the plant that has the potential to impart sufficient energy into the ground, and the varying ground conditions in the immediate vicinity of the Site, it is considered that an alternative approach to assessing the potential for groundborne vibration will be appropriate.
5.2.3 Therefore, a series of calculations, following the methodologies referred to above, has been carried out based on typical construction activities that have the potential to impart sufficient energy into the ground, in order to determine set-back distances at which critical vibration levels may occur.
5.2.4 Detailed vibration prediction at noise sensitive receptors will be undertaken if they fall within the set-back distances for potential significant effects.
5.3 Mitigation by Design 5.3.1 All efforts will be made during the earth moving activities to avoid double-handling of spoil around the
Site. This will in turn mitigate HGV movements and compaction requirements which are both potential sources of vibration.
5.3.2 Retaining structures for box cuts and excavations are proposed to be carried out with auger-bored grout walls/annuli rather than piled walls/columns hence mitigating the extent of energy-impacting piling on the Site.
5.3.3 All major haul routes within the Site shall be maintained with a Grader in order to mitigate surface defects that may otherwise lead to ground-borne vibration from HGV movements.
21 Transport and Road Research Laboratory, G R Watts, Research Report 246: Traffic Induced Vibrations in Buildings: 1990 22 Transport and Research Laboratory, DM Hiller and G I Crabb, Report 429: Groundborne vibration caused by mechanical construction works: 2000
5.4 Impacts 5.4.1 Table 5.2 below lists the minimum set-back distances at which vibration levels of reportable
significant are predicted to occur for typical construction activities that may occur on the Site. Where applicable in the relevant calculation methods, a 66.6% certainty factor has been included in order to demonstrate worst case scenarios. Further details of these predictions are included in Appendix F.
Table 5.2: Predicted Distances at which Vibration Levels may Occur
Activity Set-back distance at which particular vibration level (ppv) occurs
0.3 mm s-1 1.0 mm s-1 10 mm s-1 15 mm s-1 Vibratory compaction (start-up) 166m* 65m 9m 6m
Vibratory compaction (steady state) 102m 44m 8m 6m
Vibratory piling (start-up) 154m* 56m 8m 6m
Vibratory piling (steady state) 75m 32m 6m 5m
Tunnelling 137m* 54m 9m* 7m*
HGV movement on uneven haul route 277m 60m 3m 2m
Note* These predicted distances are outside the limitations of the calculations and are therefore provided for information only.
5.4.2 All identified sensitive receptors are at least 180m from the nearest Site boundary, indicating that the only potential source of perceptible vibration at a sensitive receptor would be HGV movements.
5.4.3 The main haul route through the Site, which is shown independently in Figure 4.1, runs approximately 250m east from the temporary (north) access point onto the B1416 before turning southwards for approximately 700m to the Welfare facilities area and then approximately 350m south-west to the new, permanent, main Site access point onto the B1416. The minimum distance between the primary haul route and any of the surrounding residential receptors is over 470m.
5.4.4 Ground-borne vibration levels are therefore predicted to be significantly lower than 0.3 mm s-1 at all nearby sensitive receptors, i.e. below levels which are considered to be just about perceptible in residential environments.
5.5 Additional Mitigation 5.5.1 No significant effects have been identified which justify additional mitigation measures over and
above those already incorporated into the design and adopted by general good practice principles.
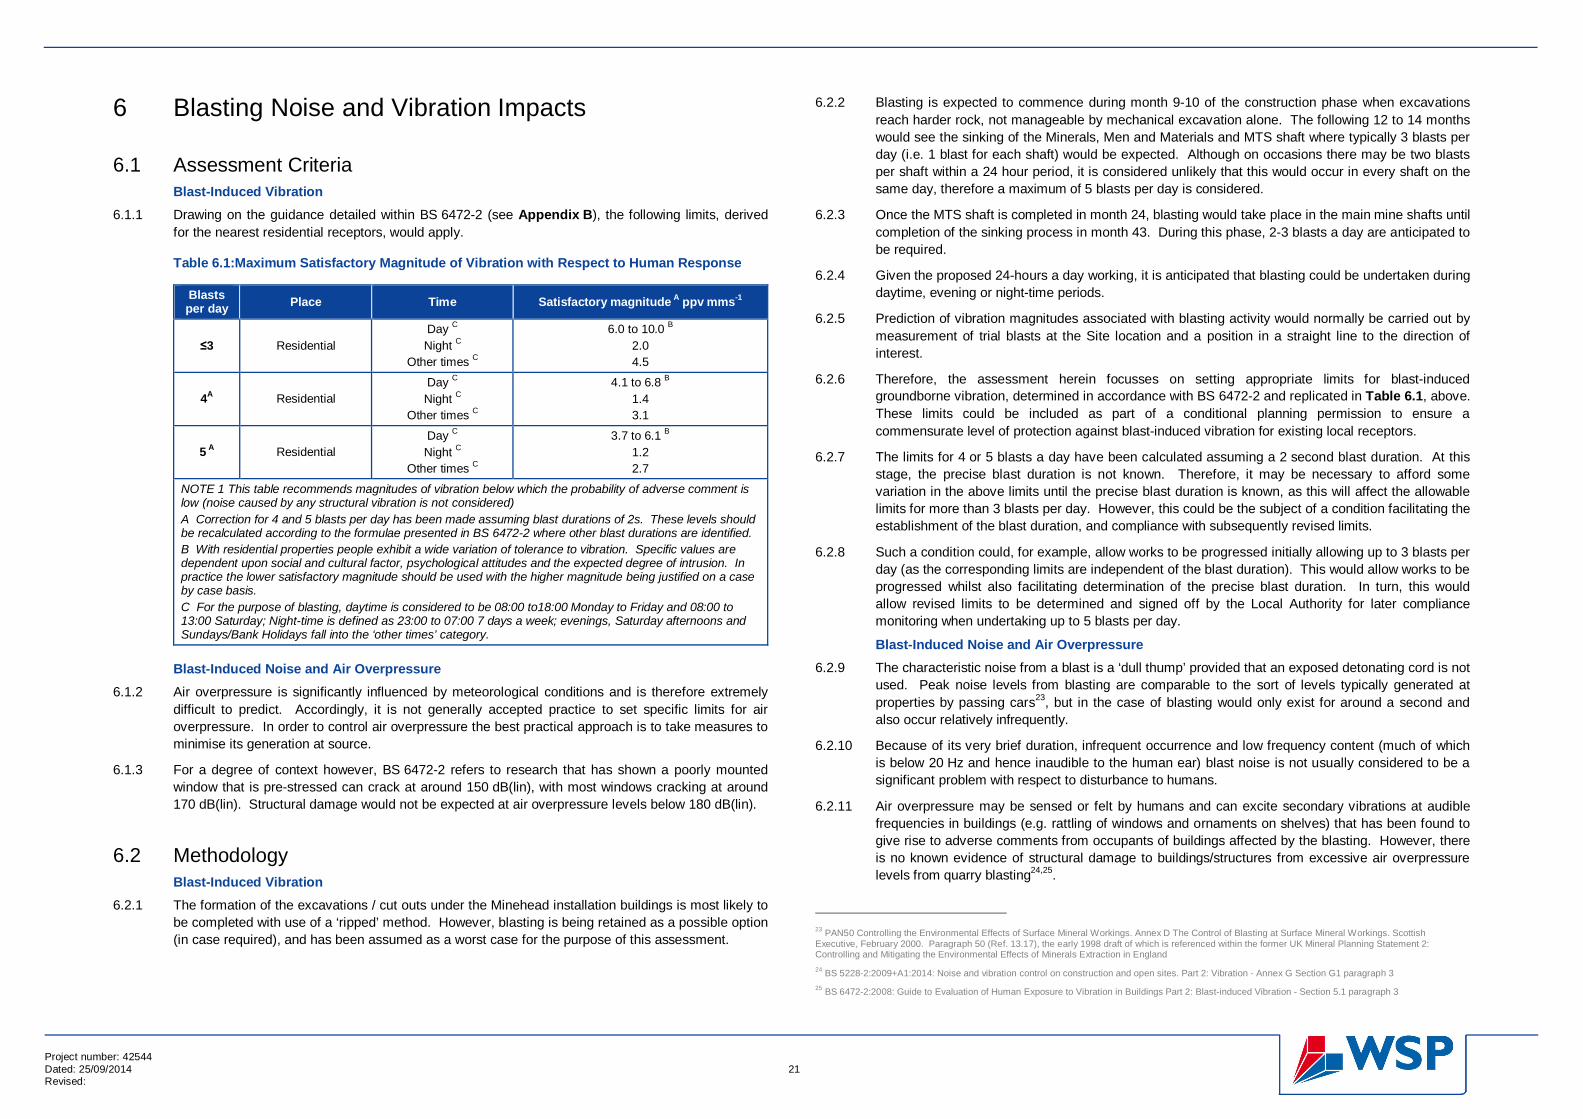
Project number: 42544 Dated: 25/09/2014 21 Revised:
6 Blasting Noise and Vibration Impacts
6.1 Assessment Criteria Blast-Induced Vibration
6.1.1 Drawing on the guidance detailed within BS 6472-2 (see Appendix B), the following limits, derived for the nearest residential receptors, would apply.
Table 6.1:Maximum Satisfactory Magnitude of Vibration with Respect to Human Response
Blasts per day Place Time Satisfactory magnitude A ppv mms-1
3 Residential Day C Night C
Other times C
6.0 to 10.0 B 2.0 4.5
4A Residential Day C Night C
Other times C
4.1 to 6.8 B 1.4 3.1
5 A Residential Day C Night C
Other times C
3.7 to 6.1 B 1.2 2.7
NOTE 1 This table recommends magnitudes of vibration below which the probability of adverse comment is low (noise caused by any structural vibration is not considered) A Correction for 4 and 5 blasts per day has been made assuming blast durations of 2s. These levels should be recalculated according to the formulae presented in BS 6472-2 where other blast durations are identified. B With residential properties people exhibit a wide variation of tolerance to vibration. Specific values are dependent upon social and cultural factor, psychological attitudes and the expected degree of intrusion. In practice the lower satisfactory magnitude should be used with the higher magnitude being justified on a case by case basis. C For the purpose of blasting, daytime is considered to be 08:00 to18:00 Monday to Friday and 08:00 to 13:00 Saturday; Night-time is defined as 23:00 to 07:00 7 days a week; evenings, Saturday afternoons and Sundays/Bank Holidays fall into the ‘other times’ category.
Blast-Induced Noise and Air Overpressure 6.1.2 Air overpressure is significantly influenced by meteorological conditions and is therefore extremely
difficult to predict. Accordingly, it is not generally accepted practice to set specific limits for air overpressure. In order to control air overpressure the best practical approach is to take measures to minimise its generation at source.
6.1.3 For a degree of context however, BS 6472-2 refers to research that has shown a poorly mounted window that is pre-stressed can crack at around 150 dB(lin), with most windows cracking at around 170 dB(lin). Structural damage would not be expected at air overpressure levels below 180 dB(lin).
6.2 Methodology Blast-Induced Vibration
6.2.1 The formation of the excavations / cut outs under the Minehead installation buildings is most likely to be completed with use of a ‘ripped’ method. However, blasting is being retained as a possible option (in case required), and has been assumed as a worst case for the purpose of this assessment.
6.2.2 Blasting is expected to commence during month 9-10 of the construction phase when excavations reach harder rock, not manageable by mechanical excavation alone. The following 12 to 14 months would see the sinking of the Minerals, Men and Materials and MTS shaft where typically 3 blasts per day (i.e. 1 blast for each shaft) would be expected. Although on occasions there may be two blasts per shaft within a 24 hour period, it is considered unlikely that this would occur in every shaft on the same day, therefore a maximum of 5 blasts per day is considered.
6.2.3 Once the MTS shaft is completed in month 24, blasting would take place in the main mine shafts until completion of the sinking process in month 43. During this phase, 2-3 blasts a day are anticipated to be required.
6.2.4 Given the proposed 24-hours a day working, it is anticipated that blasting could be undertaken during daytime, evening or night-time periods.
6.2.5 Prediction of vibration magnitudes associated with blasting activity would normally be carried out by measurement of trial blasts at the Site location and a position in a straight line to the direction of interest.
6.2.6 Therefore, the assessment herein focusses on setting appropriate limits for blast-induced groundborne vibration, determined in accordance with BS 6472-2 and replicated in Table 6.1, above. These limits could be included as part of a conditional planning permission to ensure a commensurate level of protection against blast-induced vibration for existing local receptors.
6.2.7 The limits for 4 or 5 blasts a day have been calculated assuming a 2 second blast duration. At this stage, the precise blast duration is not known. Therefore, it may be necessary to afford some variation in the above limits until the precise blast duration is known, as this will affect the allowable limits for more than 3 blasts per day. However, this could be the subject of a condition facilitating the establishment of the blast duration, and compliance with subsequently revised limits.
6.2.8 Such a condition could, for example, allow works to be progressed initially allowing up to 3 blasts per day (as the corresponding limits are independent of the blast duration). This would allow works to be progressed whilst also facilitating determination of the precise blast duration. In turn, this would allow revised limits to be determined and signed off by the Local Authority for later compliance monitoring when undertaking up to 5 blasts per day.
Blast-Induced Noise and Air Overpressure 6.2.9 The characteristic noise from a blast is a ‘dull thump’ provided that an exposed detonating cord is not
used. Peak noise levels from blasting are comparable to the sort of levels typically generated at properties by passing cars23, but in the case of blasting would only exist for around a second and also occur relatively infrequently.
6.2.10 Because of its very brief duration, infrequent occurrence and low frequency content (much of which is below 20 Hz and hence inaudible to the human ear) blast noise is not usually considered to be a significant problem with respect to disturbance to humans.
6.2.11 Air overpressure may be sensed or felt by humans and can excite secondary vibrations at audible frequencies in buildings (e.g. rattling of windows and ornaments on shelves) that has been found to give rise to adverse comments from occupants of buildings affected by the blasting. However, there is no known evidence of structural damage to buildings/structures from excessive air overpressure levels from quarry blasting24,25.
23 PAN50 Controlling the Environmental Effects of Surface Mineral Workings. Annex D The Control of Blasting at Surface Mineral Workings. Scottish Executive, February 2000. Paragraph 50 (Ref. 13.17), the early 1998 draft of which is referenced within the former UK Mineral Planning Statement 2: Controlling and Mitigating the Environmental Effects of Minerals Extraction in England 24 BS 5228-2:2009+A1:2014: Noise and vibration control on construction and open sites. Part 2: Vibration - Annex G Section G1 paragraph 3 25 BS 6472-2:2008: Guide to Evaluation of Human Exposure to Vibration in Buildings Part 2: Blast-induced Vibration - Section 5.1 paragraph 3
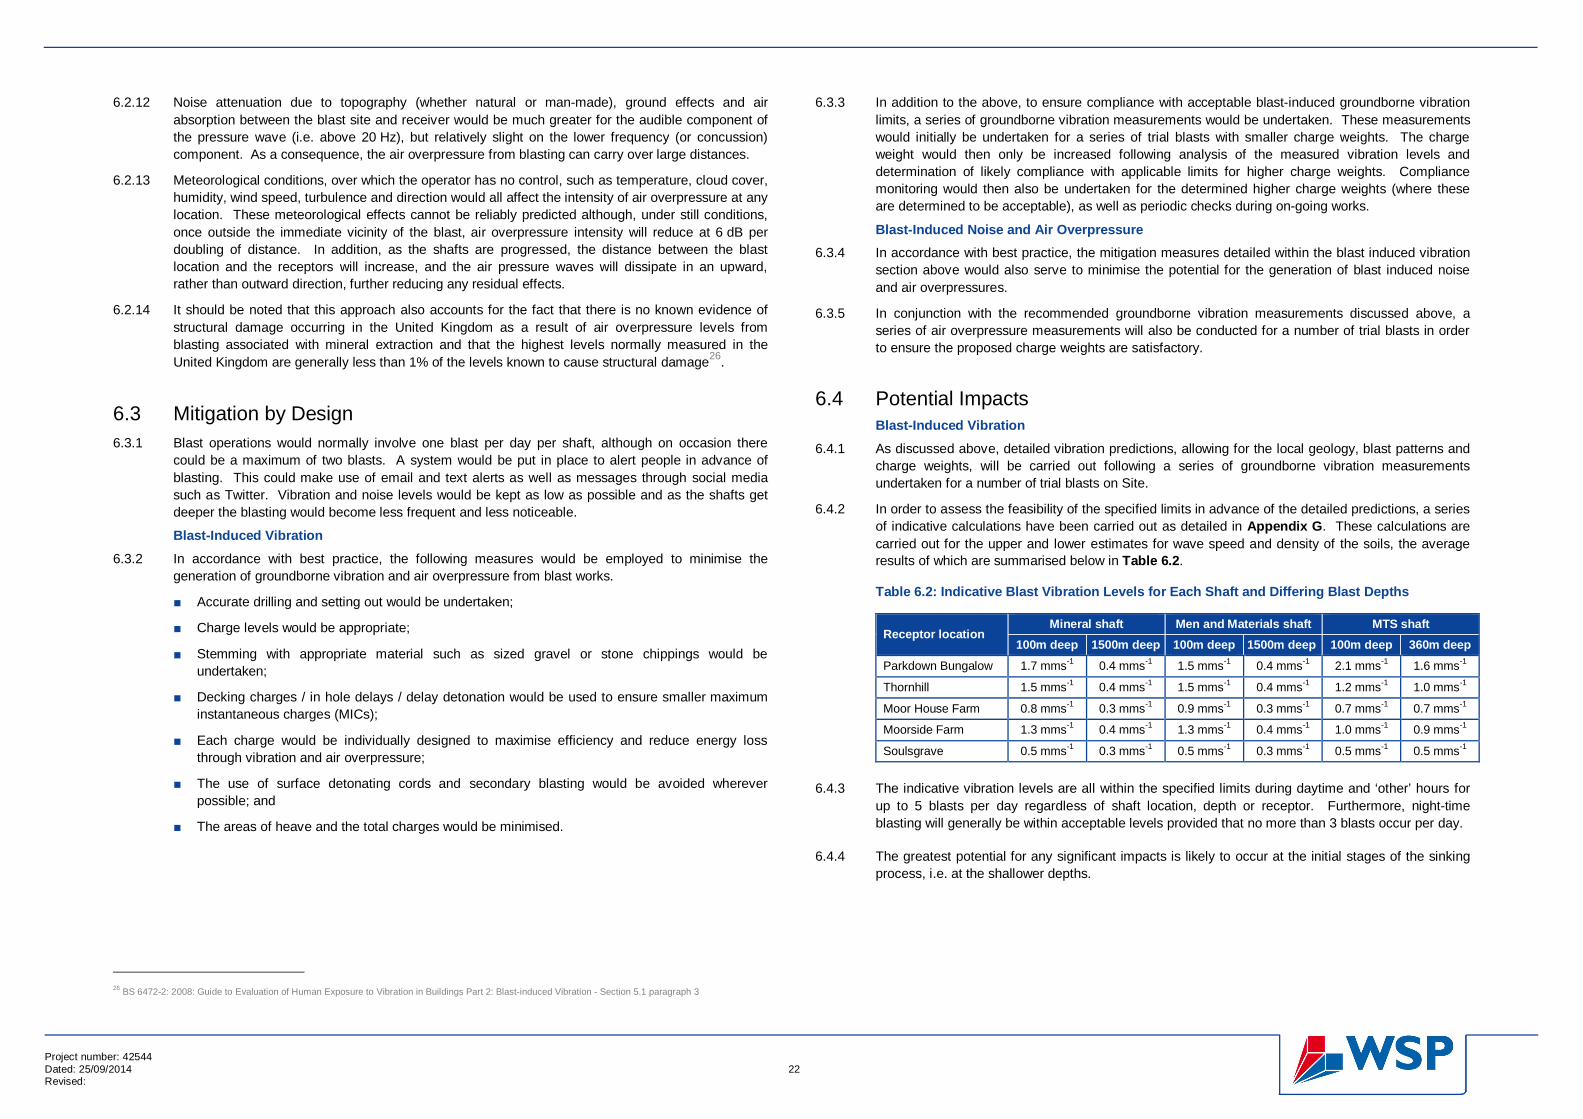
Project number: 42544 Dated: 25/09/2014 22 Revised:
6.2.12 Noise attenuation due to topography (whether natural or man-made), ground effects and air absorption between the blast site and receiver would be much greater for the audible component of the pressure wave (i.e. above 20 Hz), but relatively slight on the lower frequency (or concussion) component. As a consequence, the air overpressure from blasting can carry over large distances.
6.2.13 Meteorological conditions, over which the operator has no control, such as temperature, cloud cover, humidity, wind speed, turbulence and direction would all affect the intensity of air overpressure at any location. These meteorological effects cannot be reliably predicted although, under still conditions, once outside the immediate vicinity of the blast, air overpressure intensity will reduce at 6 dB per doubling of distance. In addition, as the shafts are progressed, the distance between the blast location and the receptors will increase, and the air pressure waves will dissipate in an upward, rather than outward direction, further reducing any residual effects.
6.2.14 It should be noted that this approach also accounts for the fact that there is no known evidence of structural damage occurring in the United Kingdom as a result of air overpressure levels from blasting associated with mineral extraction and that the highest levels normally measured in the United Kingdom are generally less than 1% of the levels known to cause structural damage26.
6.3 Mitigation by Design 6.3.1 Blast operations would normally involve one blast per day per shaft, although on occasion there
could be a maximum of two blasts. A system would be put in place to alert people in advance of blasting. This could make use of email and text alerts as well as messages through social media such as Twitter. Vibration and noise levels would be kept as low as possible and as the shafts get deeper the blasting would become less frequent and less noticeable.
Blast-Induced Vibration 6.3.2 In accordance with best practice, the following measures would be employed to minimise the
generation of groundborne vibration and air overpressure from blast works.
Accurate drilling and setting out would be undertaken;
Charge levels would be appropriate;
Stemming with appropriate material such as sized gravel or stone chippings would be undertaken;
Decking charges / in hole delays / delay detonation would be used to ensure smaller maximum instantaneous charges (MICs);
Each charge would be individually designed to maximise efficiency and reduce energy loss through vibration and air overpressure;
The use of surface detonating cords and secondary blasting would be avoided wherever possible; and
The areas of heave and the total charges would be minimised.
26 BS 6472-2: 2008: Guide to Evaluation of Human Exposure to Vibration in Buildings Part 2: Blast-induced Vibration - Section 5.1 paragraph 3
6.3.3 In addition to the above, to ensure compliance with acceptable blast-induced groundborne vibration limits, a series of groundborne vibration measurements would be undertaken. These measurements would initially be undertaken for a series of trial blasts with smaller charge weights. The charge weight would then only be increased following analysis of the measured vibration levels and determination of likely compliance with applicable limits for higher charge weights. Compliance monitoring would then also be undertaken for the determined higher charge weights (where these are determined to be acceptable), as well as periodic checks during on-going works.
Blast-Induced Noise and Air Overpressure 6.3.4 In accordance with best practice, the mitigation measures detailed within the blast induced vibration
section above would also serve to minimise the potential for the generation of blast induced noise and air overpressures.
6.3.5 In conjunction with the recommended groundborne vibration measurements discussed above, a series of air overpressure measurements will also be conducted for a number of trial blasts in order to ensure the proposed charge weights are satisfactory.
6.4 Potential Impacts Blast-Induced Vibration
6.4.1 As discussed above, detailed vibration predictions, allowing for the local geology, blast patterns and charge weights, will be carried out following a series of groundborne vibration measurements undertaken for a number of trial blasts on Site.
6.4.2 In order to assess the feasibility of the specified limits in advance of the detailed predictions, a series of indicative calculations have been carried out as detailed in Appendix G. These calculations are carried out for the upper and lower estimates for wave speed and density of the soils, the average results of which are summarised below in Table 6.2.
Table 6.2: Indicative Blast Vibration Levels for Each Shaft and Differing Blast Depths
Receptor location Mineral shaft Men and Materials shaft MTS shaft
100m deep 1500m deep 100m deep 1500m deep 100m deep 360m deep Parkdown Bungalow 1.7 mms-1 0.4 mms-1 1.5 mms-1 0.4 mms-1 2.1 mms-1 1.6 mms-1
Thornhill 1.5 mms-1 0.4 mms-1 1.5 mms-1 0.4 mms-1 1.2 mms-1 1.0 mms-1
Moor House Farm 0.8 mms-1 0.3 mms-1 0.9 mms-1 0.3 mms-1 0.7 mms-1 0.7 mms-1
Moorside Farm 1.3 mms-1 0.4 mms-1 1.3 mms-1 0.4 mms-1 1.0 mms-1 0.9 mms-1
Soulsgrave 0.5 mms-1 0.3 mms-1 0.5 mms-1 0.3 mms-1 0.5 mms-1 0.5 mms-1
6.4.3 The indicative vibration levels are all within the specified limits during daytime and ‘other’ hours for up to 5 blasts per day regardless of shaft location, depth or receptor. Furthermore, night-time blasting will generally be within acceptable levels provided that no more than 3 blasts occur per day.
6.4.4 The greatest potential for any significant impacts is likely to occur at the initial stages of the sinking process, i.e. at the shallower depths.
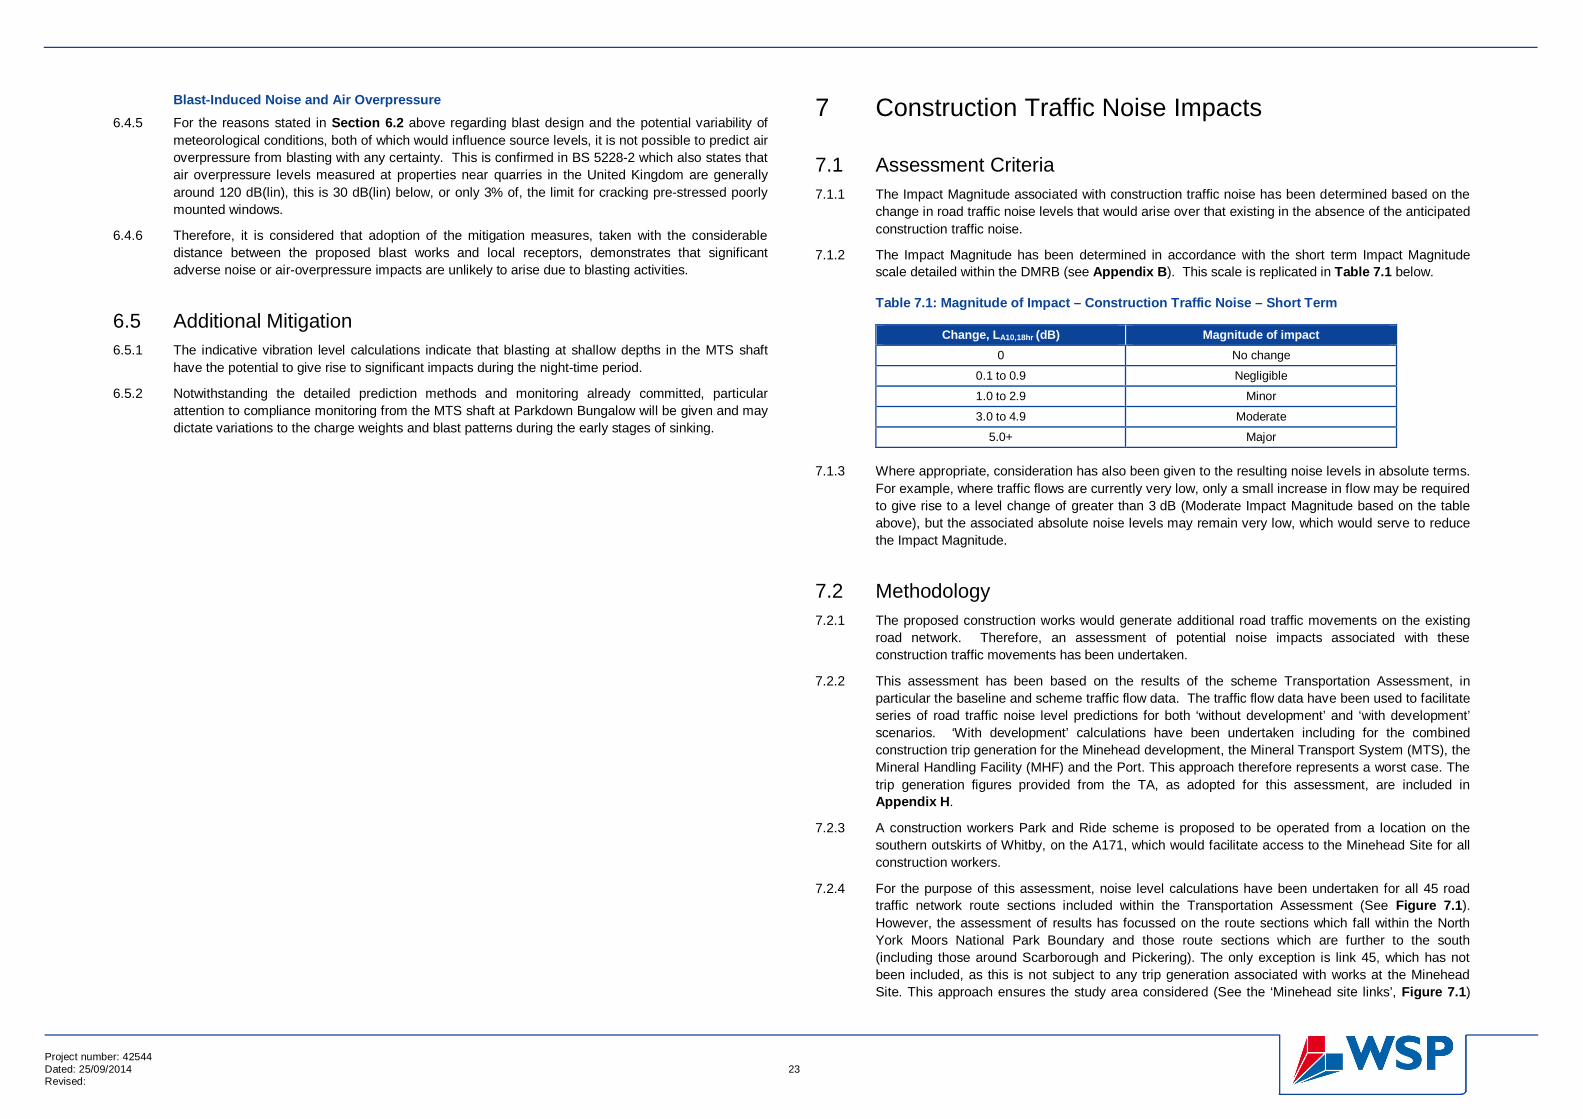
Project number: 42544 Dated: 25/09/2014 23 Revised:
Blast-Induced Noise and Air Overpressure 6.4.5 For the reasons stated in Section 6.2 above regarding blast design and the potential variability of
meteorological conditions, both of which would influence source levels, it is not possible to predict air overpressure from blasting with any certainty. This is confirmed in BS 5228-2 which also states that air overpressure levels measured at properties near quarries in the United Kingdom are generally around 120 dB(lin), this is 30 dB(lin) below, or only 3% of, the limit for cracking pre-stressed poorly mounted windows.
6.4.6 Therefore, it is considered that adoption of the mitigation measures, taken with the considerable distance between the proposed blast works and local receptors, demonstrates that significant adverse noise or air-overpressure impacts are unlikely to arise due to blasting activities.
6.5 Additional Mitigation 6.5.1 The indicative vibration level calculations indicate that blasting at shallow depths in the MTS shaft
have the potential to give rise to significant impacts during the night-time period.
6.5.2 Notwithstanding the detailed prediction methods and monitoring already committed, particular attention to compliance monitoring from the MTS shaft at Parkdown Bungalow will be given and may dictate variations to the charge weights and blast patterns during the early stages of sinking.
7 Construction Traffic Noise Impacts
7.1 Assessment Criteria 7.1.1 The Impact Magnitude associated with construction traffic noise has been determined based on the
change in road traffic noise levels that would arise over that existing in the absence of the anticipated construction traffic noise.
7.1.2 The Impact Magnitude has been determined in accordance with the short term Impact Magnitude scale detailed within the DMRB (see Appendix B). This scale is replicated in Table 7.1 below.
Table 7.1: Magnitude of Impact – Construction Traffic Noise – Short Term
Change, LA10,18hr (dB) Magnitude of impact 0 No change
0.1 to 0.9 Negligible
1.0 to 2.9 Minor
3.0 to 4.9 Moderate
5.0+ Major
7.1.3 Where appropriate, consideration has also been given to the resulting noise levels in absolute terms. For example, where traffic flows are currently very low, only a small increase in flow may be required to give rise to a level change of greater than 3 dB (Moderate Impact Magnitude based on the table above), but the associated absolute noise levels may remain very low, which would serve to reduce the Impact Magnitude.
7.2 Methodology 7.2.1 The proposed construction works would generate additional road traffic movements on the existing
road network. Therefore, an assessment of potential noise impacts associated with these construction traffic movements has been undertaken.
7.2.2 This assessment has been based on the results of the scheme Transportation Assessment, in particular the baseline and scheme traffic flow data. The traffic flow data have been used to facilitate series of road traffic noise level predictions for both ‘without development’ and ‘with development’ scenarios. ‘With development’ calculations have been undertaken including for the combined construction trip generation for the Minehead development, the Mineral Transport System (MTS), the Mineral Handling Facility (MHF) and the Port. This approach therefore represents a worst case. The trip generation figures provided from the TA, as adopted for this assessment, are included in Appendix H.
7.2.3 A construction workers Park and Ride scheme is proposed to be operated from a location on the southern outskirts of Whitby, on the A171, which would facilitate access to the Minehead Site for all construction workers.
7.2.4 For the purpose of this assessment, noise level calculations have been undertaken for all 45 road traffic network route sections included within the Transportation Assessment (See Figure 7.1). However, the assessment of results has focussed on the route sections which fall within the North York Moors National Park Boundary and those route sections which are further to the south (including those around Scarborough and Pickering). The only exception is link 45, which has not been included, as this is not subject to any trip generation associated with works at the Minehead Site. This approach ensures the study area considered (See the ‘Minehead site links’, Figure 7.1)
Project number: 42544 Dated: 25/09/2014 24 Revised:
encompasses the primary routes to the park and ride site from all directions, as well as the routes between the park and ride site and the Minehead. For other routes further to the north-west, minimal trip generation arises as a result of works at the Minehead Site, with trip generation being dominated by works associated with the MTS, MHF and Port.
7.2.5 Calculations have been undertaken for different hours of the daytime and night-time (including individual 1 hour periods and full 18 hour (06:00 to 00:00) daytime periods) and for scenarios based on annually averaged baseline data as well as January baseline data (for which lower baseline flows prevail). A January assessment has been included such that account is taken of the off-peak tourist season.
7.2.6 Comparing the resulting ‘with development’ and ‘without development’ noise levels allows determination of the noise level changes associated with the introduction of the construction traffic. These resulting noise level changes have then been assessed according to the scale detailed within Table 7.1 above.
7.2.7 Where the associated traffic flow data falls within the range of validity for application of the prediction methodology detailed within CRTN (i.e. at least 50 vehicles per one hour period, or at least 1000 vehicles per 18 hour period), then this methodology has been applied (see Appendix B). The CRTN calculation method is used to determine resulting road traffic noise levels in terms of either the LA10,1hr or LA10,18hr noise index. This methodology has been used to determine the Basic Noise Level (BNL) as defined within CRTN, which is at a positon 10m from the nearest carriageway edge, and 1.5m above ground. The BNL is obtained by calculation drawing on the traffic flow, the traffic speed, the traffic composition (percentage HGV), the gradient of the road, and the road surface. For the purpose of the completed calculations, the gradient has been assumed to be flat, and the road surface has been assumed to be bituminous and impervious with a texture depth of 2mm. It should be noted that these factors remain unchanged between the ‘with’ and ‘without’ scenarios that are being considered, and therefore have no influence over the noise level change that is being determined for assessment.
7.2.8 For some of the routes considered, different speed limits apply to different sections. Where this is the case, the BNL has been determined based on the highest applicable speed limit. The same speed has been used for the ‘with development’ and ‘without development’ calculations
7.2.9 The BNL is calculated before any additional corrections are applied, for example to reflect the presence of screening and the angle of view of and distance to the road.
7.2.10 Where the traffic flow data fall outside the range of validity for application of the CRTN prediction methodology, it is necessary to apply an alternative method. The alternative method adopted in this case, is that detailed within A Guide to Measurement and Prediction of the Equivalent Continuous Sound Level Leq, Report by a Working Party for the Technical Sub-committee of the [Noise Advisory] Council. This alternative methodology is also detailed within Appendix B, and again predicts the resulting noise level at 10m from the nearside carriageway edge. Separate calculations following this alternative methodology have been undertaken for both LGVs/cars and HGVs with the resulting noise levels summed to determine the overall level associated with a given route (for the scenario being considered). This alternative methodology has been applied for both ‘without development’ and ‘with development’ noise level predictions, where the flow in either case falls outside the range of validity for CRTN (for the scenario being considered). This approach ensures that the resulting noise level change (that which is being assessed) is determined based on the difference of two noise levels calculated following the same approach. Noise level calculations following this approach have again been made based on the highest applicable speed limit for each individual route.
7.2.11 This alternative calculation method determines the resulting road traffic noise levels in terms of the LAeq,T noise index, with a time base (T) in this case being either 1 hour or 18 hours. Whilst this is a different noise index to that associated with CRTN (which adopts the LA10,T noise index), it is considered that the noise level changes thus determined can also be assessed based on the scale detailed within Table 7.1 above.
7.2.12 As part of the Transportation Assessment, consideration has been given to the trip generation associated with the construction works, including preparation of an hour by hour profile for a worst case construction month. Construction traffic flow data have included associated worker trips, construction deliveries, plant deliveries and fuel deliveries etc. (i.e. all construction traffic). This profile for a worst case construction month has been used for all ‘with development’ noise level predictions, therefore representing a worst case in this regard. The Transportation Assessment also included the generation of 24 hour baseline flow profiles for the local road network, based on data obtained from four Automated Traffic Counts (ATCs) located on the A171. These datasets have been considered in the determination of appropriate scenarios and hours/periods for assessment.
7.2.13 The 24 hour baseline flow profiles identified a general trend that, during the daytime, January weekday base flows are lower than those of annually averaged weekday base flows (albeit this is more pronounced at some hours than others). Variations in base flows were also identified between Weekdays, Saturdays and Sundays. Accordingly, several sets of noise level predictions have been undertaken to reflect different days of the week and times of the year. The following sets of predictions have been undertaken, with each set being given a reference (e.g. J1a):
January Scenario Set 1 (Weekdays):
J1a: 2015 Weekdays Without Development
J1b 2015 Weekdays With Development (Minehead + MTS + MHF + Port)
Set 2 (Saturdays):
J2a: 2015 Saturdays Without Development
J2b: 2015 Saturdays With Development (Minehead + MTS + MHF + Port)
Set 3 (Sundays):
J3a: 2015 Sundays Without Development
J3b: 2015 Sundays With Development (Minehead + MTS + MHF + Port)
Annually Averaged Scenario Set 4 (Weekdays)
AA4a: 2015 Weekdays Without Development
AA4b: 2015 Weekdays With Development (Minehead + MTS + MHF + Port)
Set 5 (Saturdays)
AA5a: 2015 Saturdays Without Development
AA5b: 2015 Saturdays With Development (Minehead + MTS + MHF + Port)
Set 6 (Sundays)
AA6a: 2015 Sundays Without Development
AA6b: 2015 Sundays With Development (Minehead + MTS + MHF + Port)
7.2.14 The year 2015 has been selected as worst case, on the basis of having the lowest baseline data (i.e. at the start of proposed construction in the absence of any subsequent natural growth in the baseline conditions).