yoav benjamini, "in the world beyond p
TRANSCRIPT
In the world beyond p < .05:
When & How to use p < .0499…
Yoav Benjamini
Tel Aviv University, Israel
replicability.tau.ac.il
Supported by ERC PSARPS and HBP grants
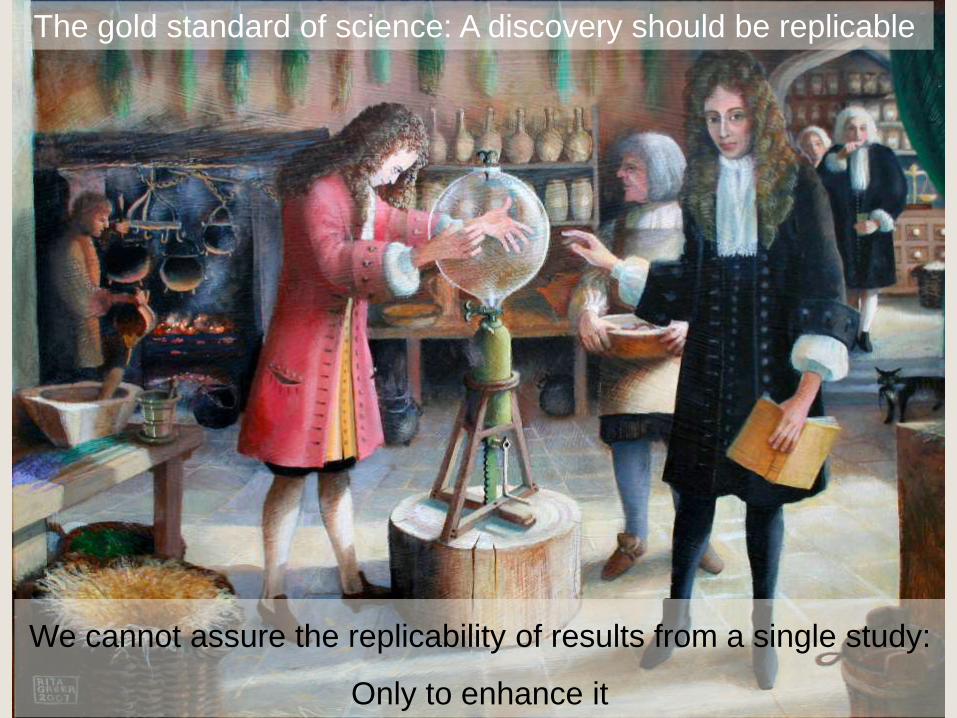
We cannot assure the replicability of results from a single study:
Only to enhance it
The gold standard of science: A discovery should be replicable
When to use p-values? Almost Always
1. Statistical significance testing (via the p-value) is the
first-line defense against being fooled by randomness:
• Valid calculation of the p-value requires minimal
assumptions – less than any other statistical method.
• The “assumptions” need not be merely assumed, but
can be assured by a properly designed experiment
(randomization + non-parametric test)
When to use p-values? Almost Always
• Usable, even if the scale of measurement is
meaningless, and only directional decision is
needed: Significant difference gives sign
determination (the null need not be precisely true).
• In some emerging branches of science it’s the only
way to compare across conditions: GWAS, fMRI,
Brain Networks, Genomics pathways..
• The p-value offers a common concept and language
for addressing randomness across science
When to use with p<“some line”?
Often
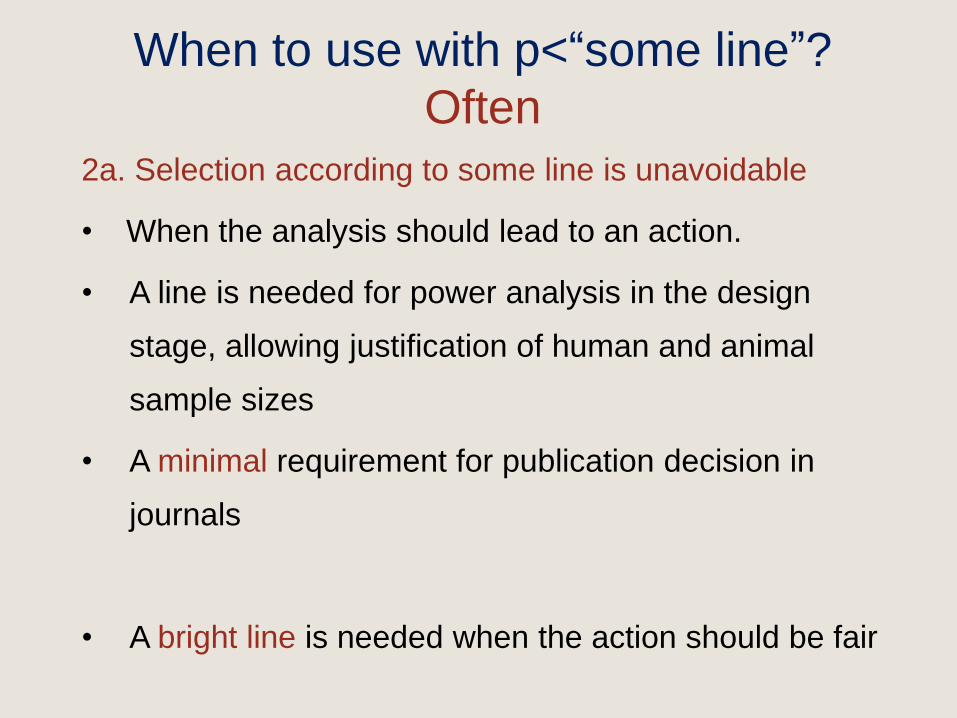
2a. Selection according to some line is unavoidable
• When the analysis should lead to an action.
• A line is needed for power analysis in the design
stage, allowing justification of human and animal
sample sizes
• A minimal requirement for publication decision in
journals
• A bright line is needed when the action should be fair
When to use with p<“some line”?
Often
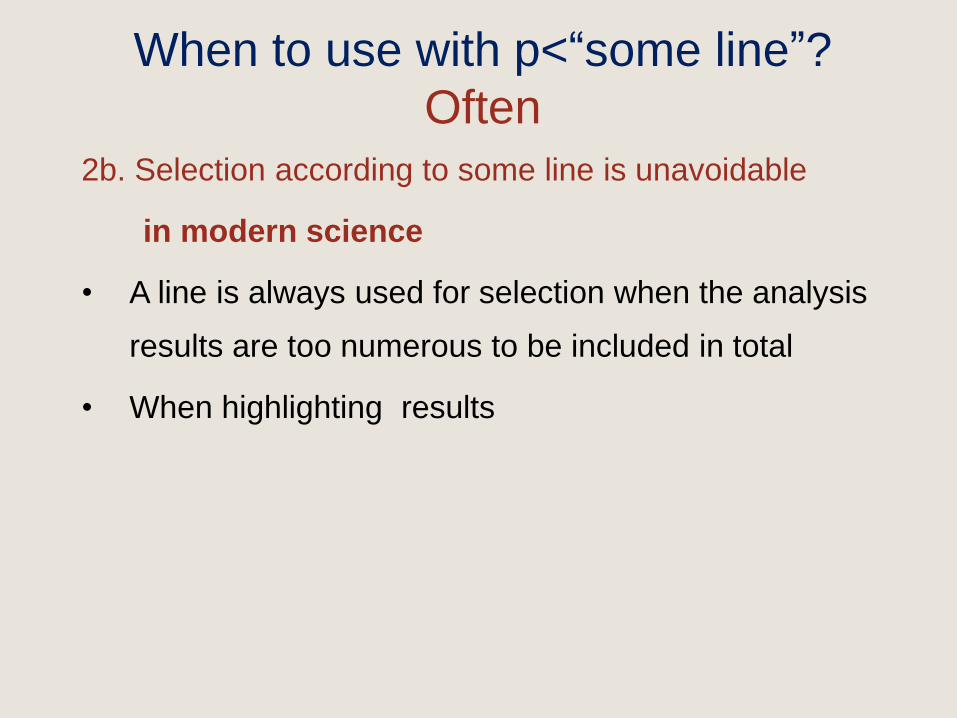
2b. Selection according to some line is unavoidable
in modern science
• A line is always used for selection when the analysis
results are too numerous to be included in total
• When highlighting results
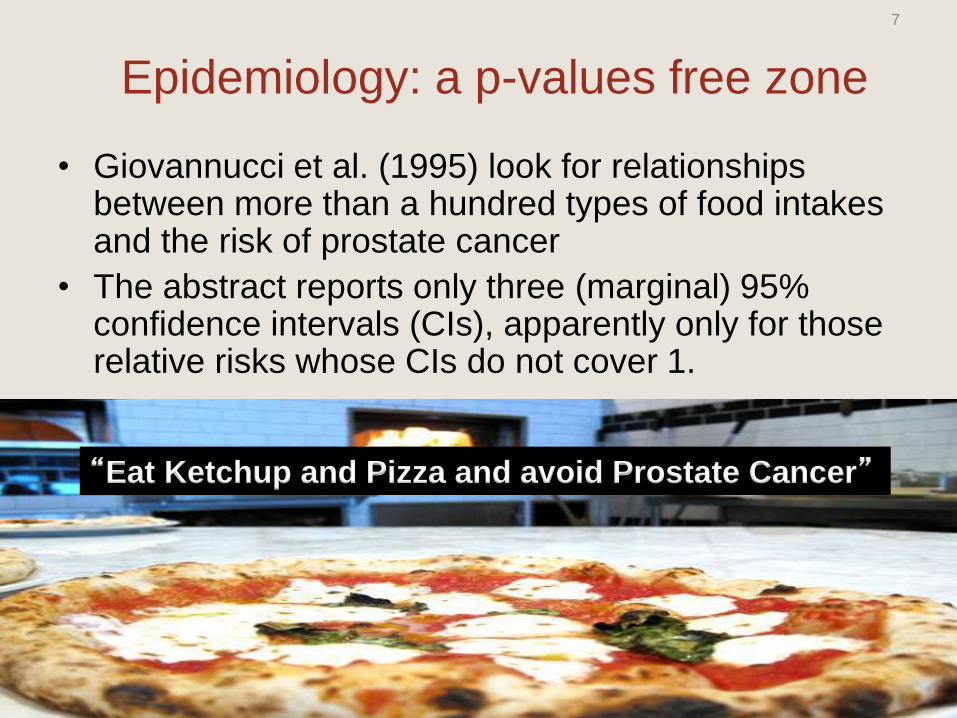
• Giovannucci et al. (1995) look for relationships between more than a hundred types of food intakes and the risk of prostate cancer
• The abstract reports only three (marginal) 95% confidence intervals (CIs), apparently only for those relative risks whose CIs do not cover 1.
“Eat Ketchup and Pizza and avoid Prostate Cancer”
7
Epidemiology: a p-values free zone

Selection by a Table
SCIENCE, ‘07
Y Benjamini
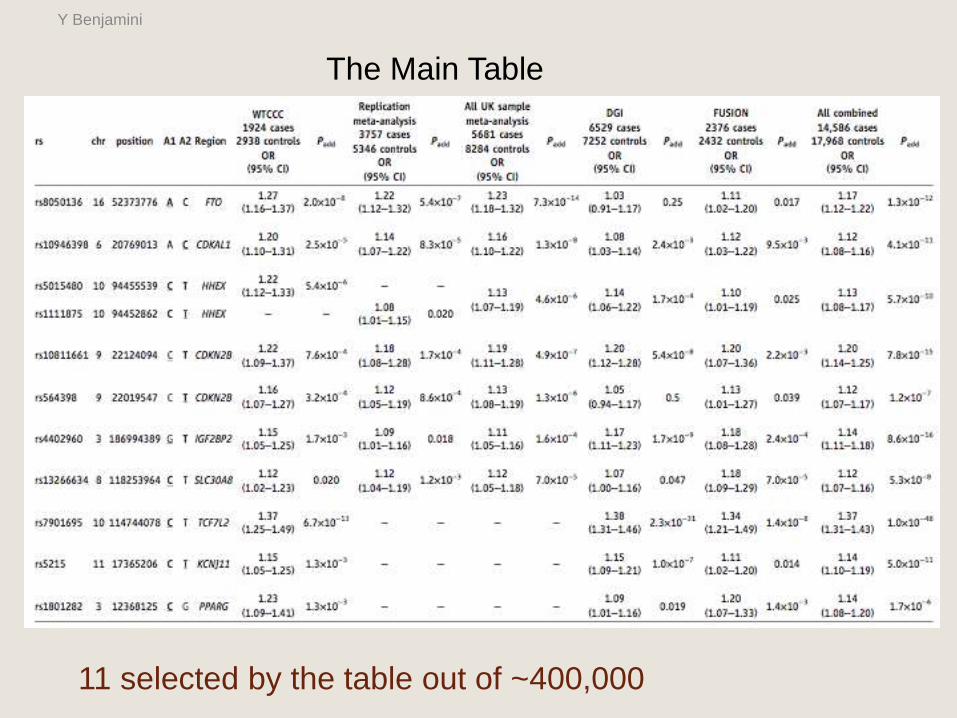
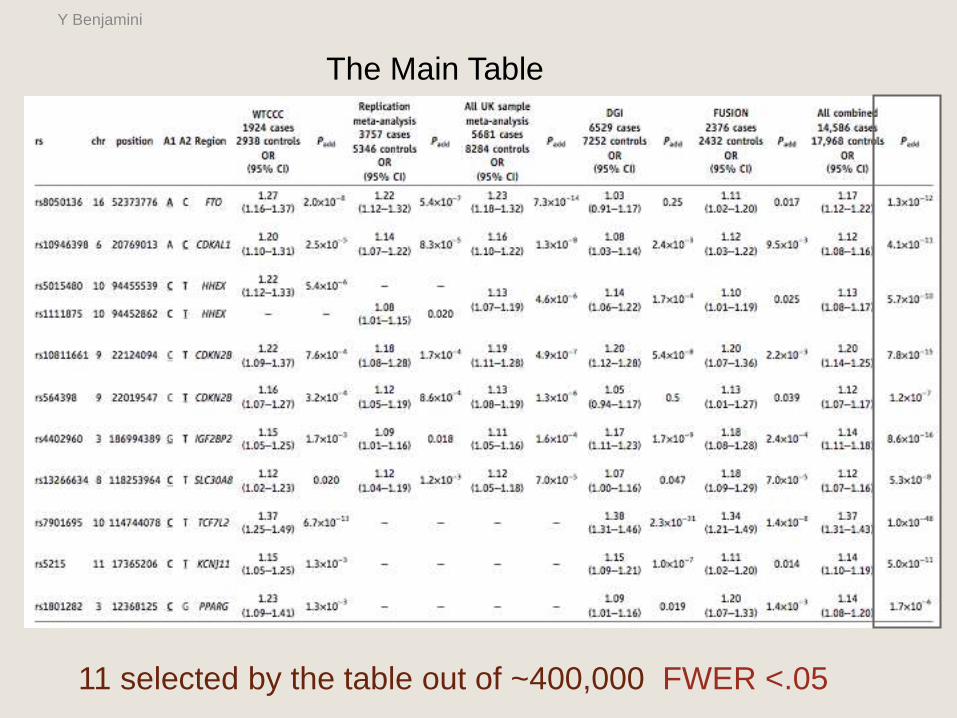
The Main Table
11 selected by the table out of ~400,000
Y Benjamini
YB
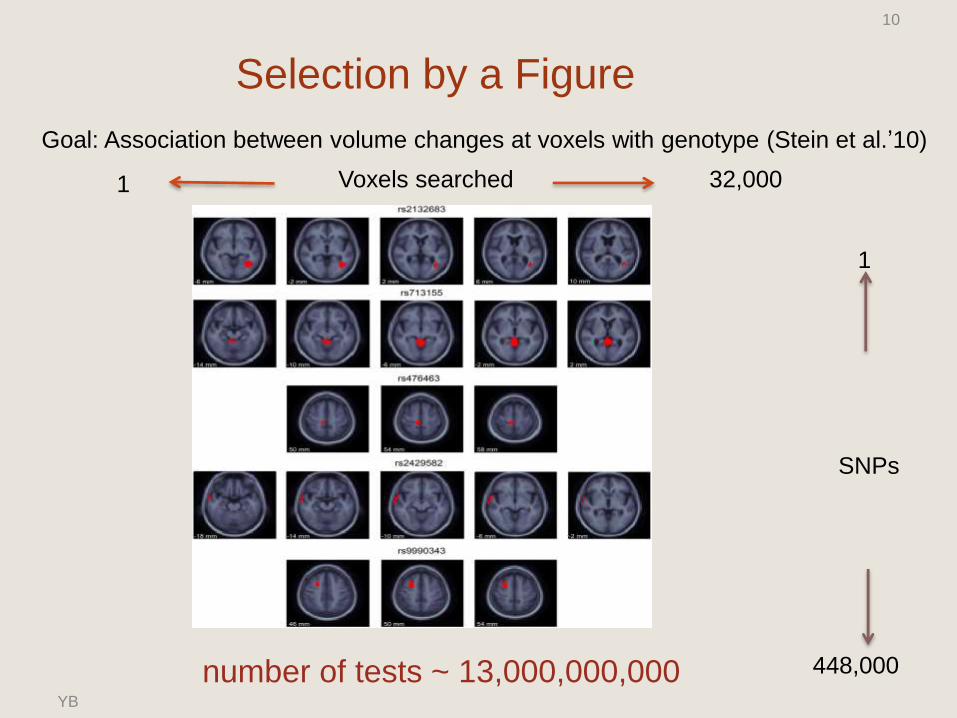
32,0001 Voxels searched
1
448,000
SNPs
Selection by a Figure
number of tests ~ 13,000,000,000
10
Goal: Association between volume changes at voxels with genotype (Stein et al.’10)
When use it with <0.0499…?
3. Selection according to is p < 0.0499… is not too bad
• In a well designed FDA regulated clinical trial with a
single primary endpoint, the .05 line is used to define
success or failure. It managed to screen ~50% too
much.
• Moreover, FDA does not approve a drug based on a
single successful trial. At least twice, and often more.
• Indeed, the p<.05 threshold served us well until the
80’s.
A change in the way science is conducted.

The industrialization of the scientific process
1888 1999
1950 2010
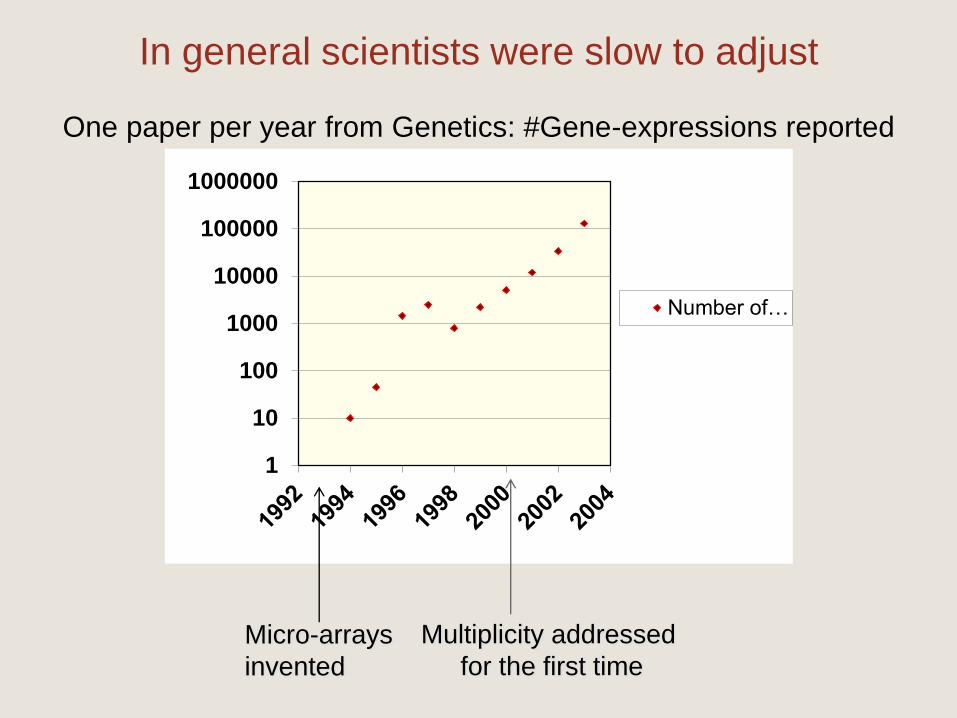
In general scientists were slow to adjust
One paper per year from Genetics: #Gene-expressions reported
1
10
100
1000
10000
100000
1000000
Number of…
Micro-arrays
invented
Multiplicity addressed
for the first time
When use it with <0.0499…?
In large-scale problems lower levels as threshold for significance
are used in order to control some error-rate
With which we can maintain that
most of the selected findings will not be false !
The p < 5*10-8 used in whole genome scan was chosen
to control the prob. of making even one error (FWER) at 0.05
And it works well, without getting rid of the p-value, or of the .0499…
The Main Table
11 selected by the table out of ~400,000 FWER <.05
Y Benjamini
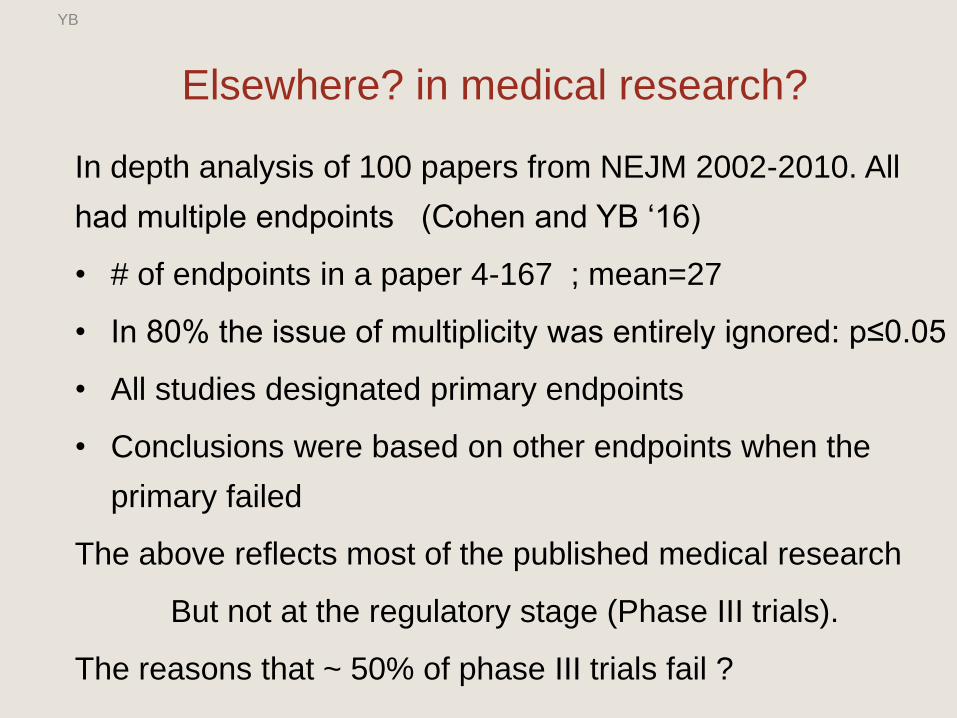
In depth analysis of 100 papers from NEJM 2002-2010. All
had multiple endpoints (Cohen and YB ‘16)
• # of endpoints in a paper 4-167 ; mean=27
• In 80% the issue of multiplicity was entirely ignored: p≤0.05
• All studies designated primary endpoints
• Conclusions were based on other endpoints when the
primary failed
The above reflects most of the published medical research
But not at the regulatory stage (Phase III trials).
The reasons that ~ 50% of phase III trials fail ?
YB
Elsewhere? in medical research?
In Experimental Psychology?
Our analysis of the 100 in the Psychology reproducibility
project:
# of inferences per study (4-700, average 72);
Only 11 (very very partially) addressed selection
YB
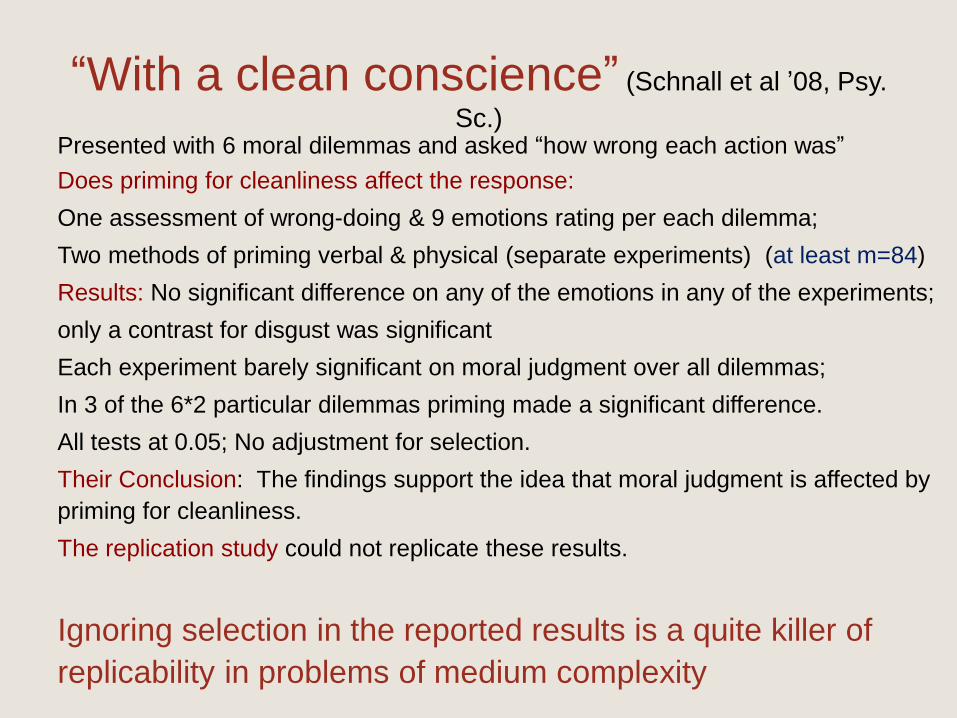
“With a clean conscience” (Schnall et al ’08, Psy.
Sc.)Presented with 6 moral dilemmas and asked “how wrong each action was”
Does priming for cleanliness affect the response:
One assessment of wrong-doing & 9 emotions rating per each dilemma;
Two methods of priming verbal & physical (separate experiments) (at least m=84)
Results: No significant difference on any of the emotions in any of the experiments;
only a contrast for disgust was significant
Each experiment barely significant on moral judgment over all dilemmas;
In 3 of the 6*2 particular dilemmas priming made a significant difference.
All tests at 0.05; No adjustment for selection.
Their Conclusion: The findings support the idea that moral judgment is affected by
priming for cleanliness.
The replication study could not replicate these results.
Ignoring selection in the reported results is a quite killer of
replicability in problems of medium complexity
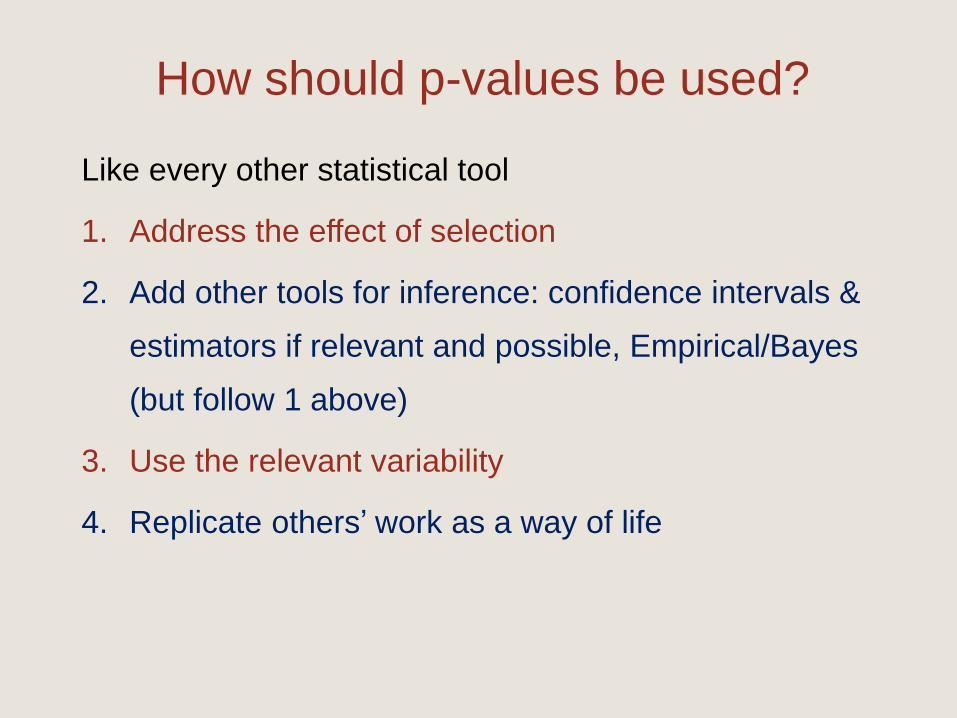
How should p-values be used?
Like every other statistical tool
1. Address the effect of selection
2. Add other tools for inference: confidence intervals &
estimators if relevant and possible, Empirical/Bayes
(but follow 1 above)
3. Use the relevant variability
4. Replicate others’ work as a way of life
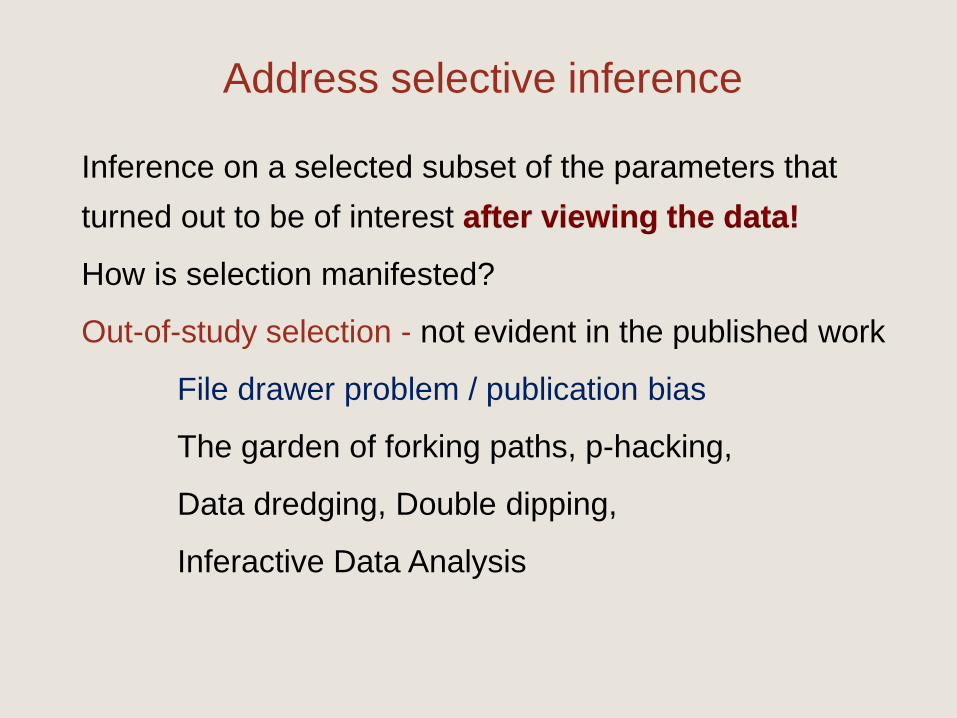
Address selective inference
Inference on a selected subset of the parameters that
turned out to be of interest after viewing the data!
How is selection manifested?
Out-of-study selection - not evident in the published work
File drawer problem / publication bias
The garden of forking paths, p-hacking,
Data dredging, Double dipping,
Inferactive Data Analysis
In-study selection - evident in the published work:
Selection by the Abstract, a Table, a Figure
Selection by highlighting those passing a threshold
Selection by modeling: AIC, Cp, BIC, FDR, LASSO,…
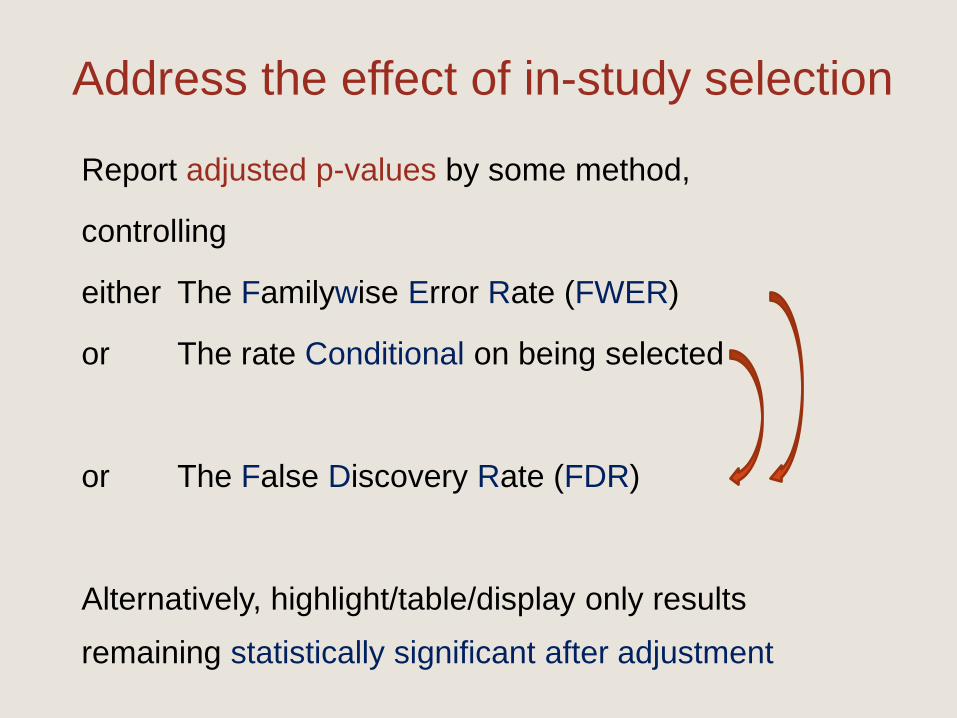
Address the effect of in-study selection
Report adjusted p-values by some method,
controlling
either The Familywise Error Rate (FWER)
or The rate Conditional on being selected
or The False Discovery Rate (FDR)
Alternatively, highlight/table/display only results
remaining statistically significant after adjustment
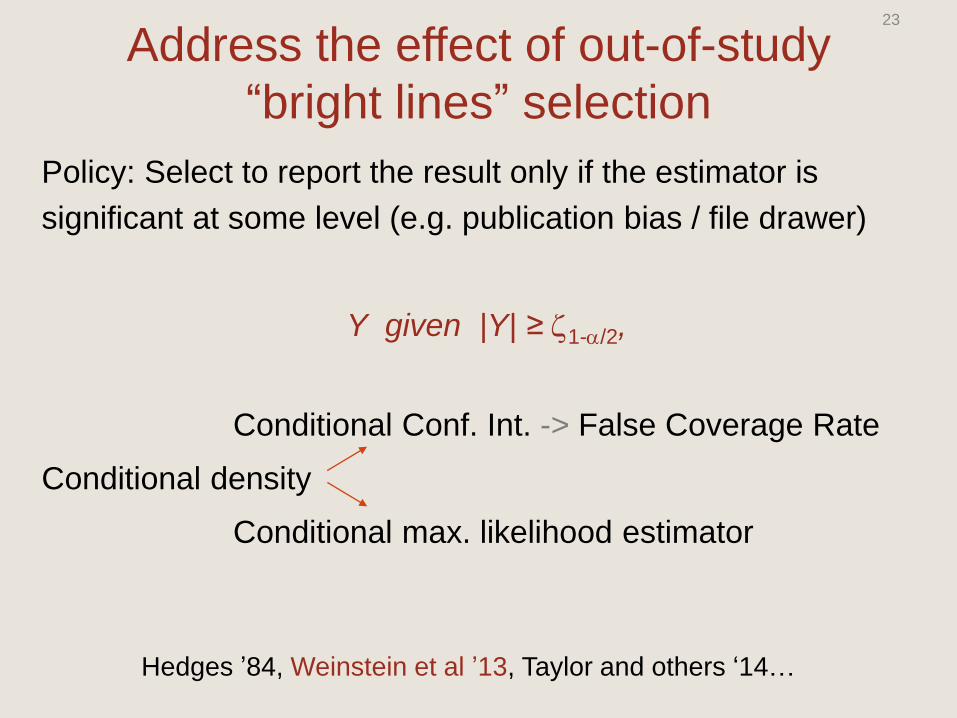
Address the effect of out-of-study
“bright lines” selection
Policy: Select to report the result only if the estimator is
significant at some level (e.g. publication bias / file drawer)
Y given |Y| ≥ z1-a/2,
Conditional Conf. Int. -> False Coverage Rate
Conditional density
Conditional max. likelihood estimator
23
Hedges ’84, Weinstein et al ’13, Taylor and others ‘14…
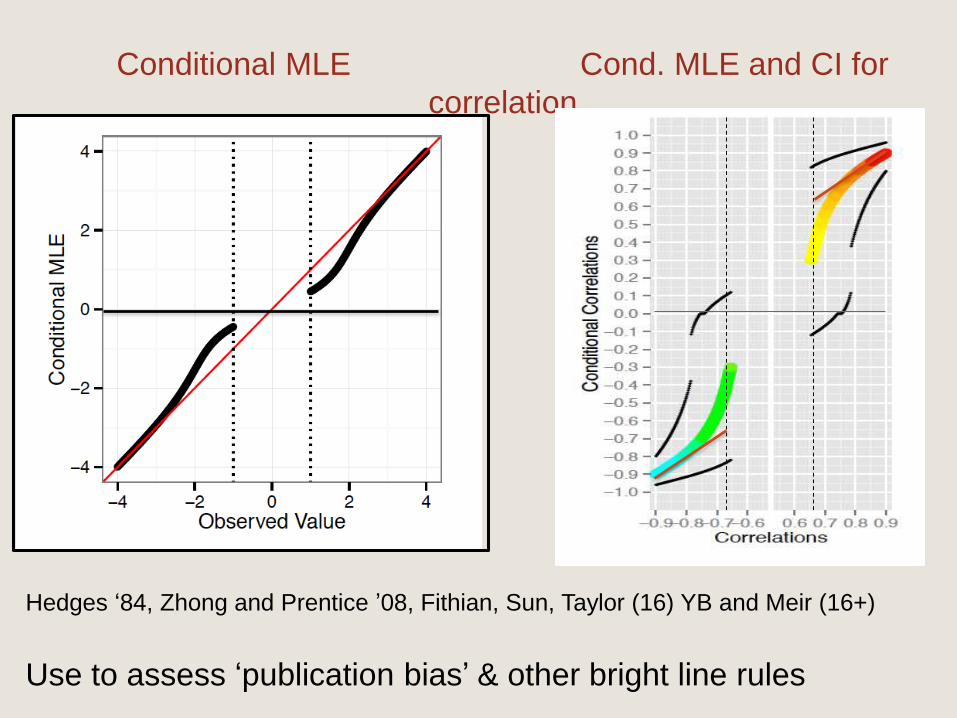
Conditional MLE Cond. MLE and CI for
correlation
Hedges ‘84, Zhong and Prentice ’08, Fithian, Sun, Taylor (16) YB and Meir (16+)
Use to assess ‘publication bias’ & other bright line rules
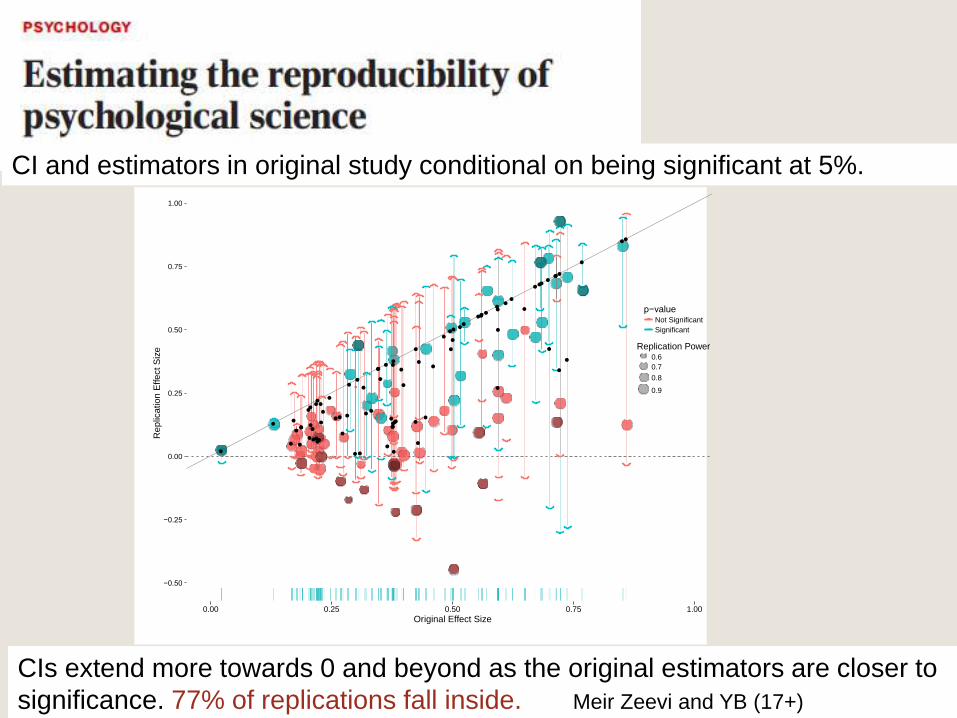
CIs extend more towards 0 and beyond as the original estimators are closer to
significance. 77% of replications fall inside. Meir Zeevi and YB (17+)
-
●
●
●
●
●
●
●
●
●●
●
●
●
●
●
●
●●
●
●
●
●
●
●
●●
●
●
●●
●
●●
●
●●
●
●
●
●
●●
●●●●
●
●
●
●
●
●
●
●
●
●
●
●
●
●
●
●
●
●
●
●
●
●
●
●
●
●
●
●
●
●
●
●●
●
●
●
●●
●
●
●
●
−0.50
−0.25
0.00
0.25
0.50
0.75
1.00
0.00 0.25 0.50 0.75 1.00
Original Effect Size
Re
plic
atio
n E
ffe
ct S
ize
p−valueNot Significant
Significant
Replication Power0.6
0.7
0.8
0.9
CI and estimators in original study conditional on being significant at 5%.
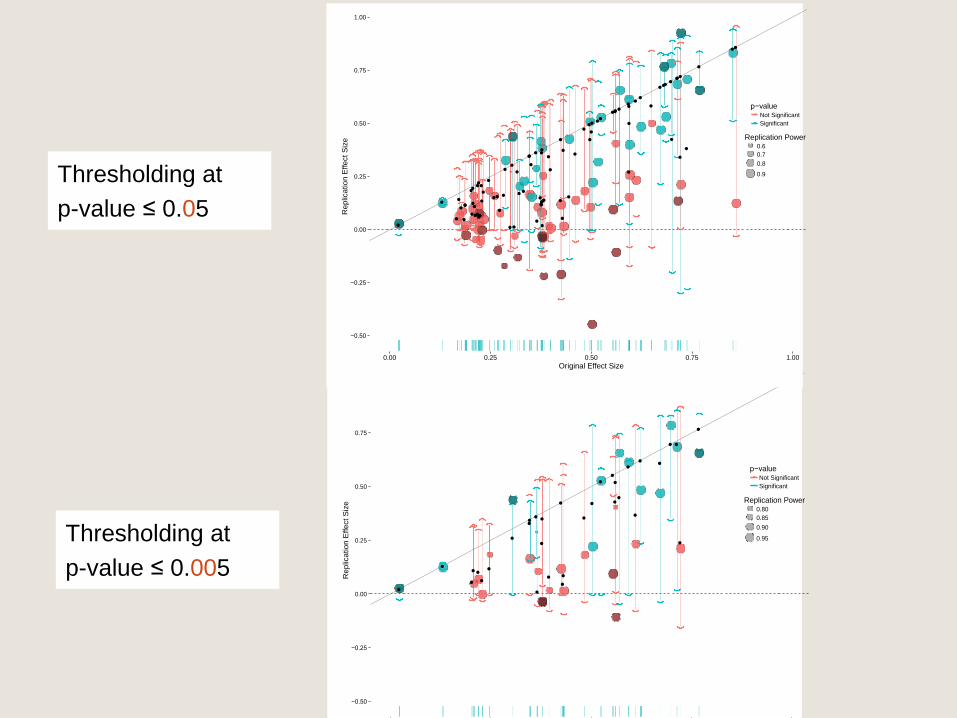
Thresholding at
p-value ≤ 0.005
●
●
●
●
●
●
●
●
●
●●
●
●
●
●
●
●
●
●●
●
●
●
●
●
●
● ●
●
●
●
●
●
−0.50
−0.25
0.00
0.25
0.50
0.75
1.00
0.00 0.25 0.50 0.75 1.00
Original Effect Size
Re
plic
atio
n E
ffe
ct S
ize
p−valueNot Significant
Significant
Replication Power0.80
0.85
0.90
0.95
●
●
●
●
●
●
●
●
●●
●
●
●
●
●
●
●●
●
●
●
●
●
●
●●
●
●
●●
●
●●
●
●●
●
●
●
●
●●
●●●●
●
●
●
●
●
●
●
●
●
●
●
●
●
●
●
●
●
●
●
●
●
●
●
●
●
●
●
●
●
●
●
●●
●
●
●
●●
●
●
●
●
−0.50
−0.25
0.00
0.25
0.50
0.75
1.00
0.00 0.25 0.50 0.75 1.00
Original Effect Size
Re
plic
atio
n E
ffe
ct S
ize
p−valueNot Significant
Significant
Replication Power0.6
0.7
0.8
0.9Thresholding at
p-value ≤ 0.05
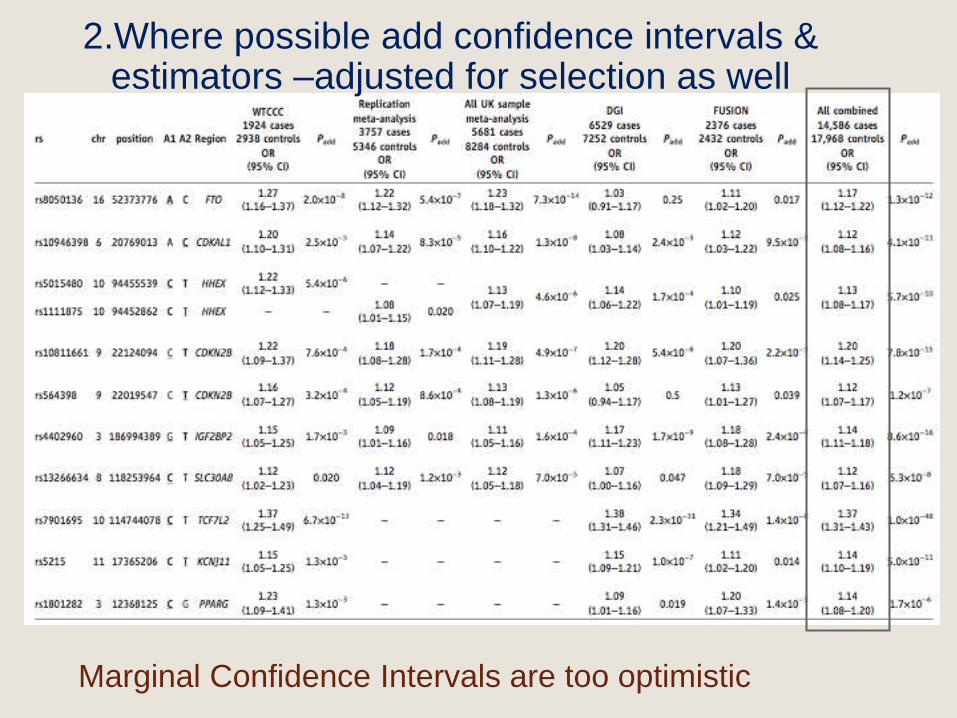
Marginal Confidence Intervals are too optimistic
2.Where possible add confidence intervals & estimators –adjusted for selection as well
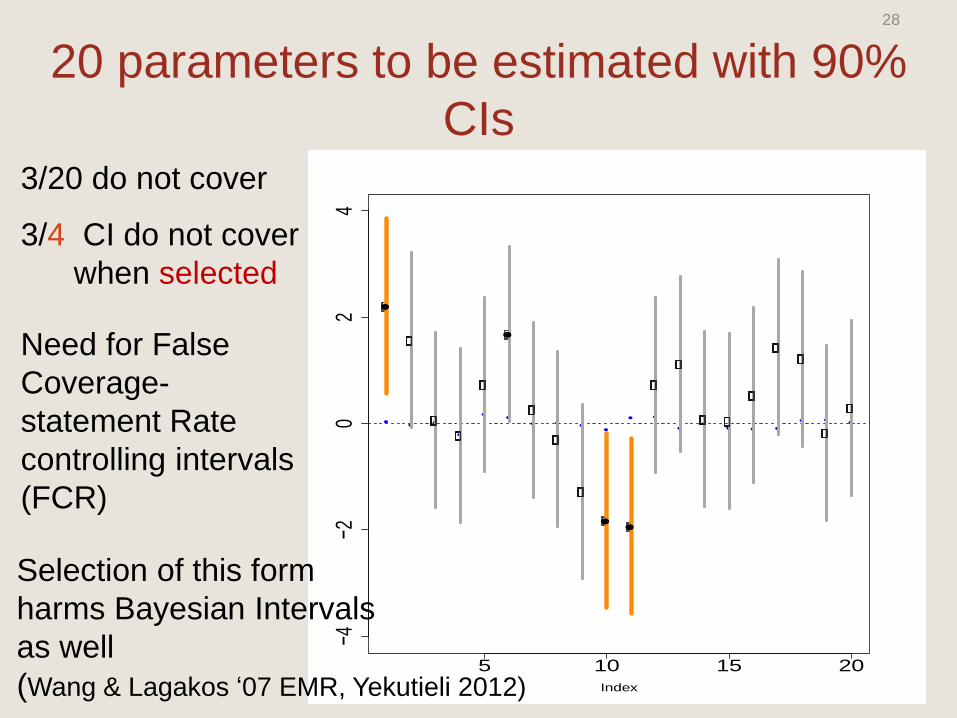
20 parameters to be estimated with 90%
CIs
●● ●
●
● ●● ● ●
●
● ●
●●
● ● ●● ● ●
5 10 15 20
−4−2
02
4
Index
●● ●
●
● ●● ● ●
●
● ●
●●
● ● ●● ● ●
5 10 15 20
−4−2
02
4
Index
●● ●
●
● ●● ● ●
●
● ●
●●
● ● ●● ● ●
5 10 15 20
−4−2
02
4
Index
●● ●
●
● ●● ● ●
●
● ●
●●
● ● ●● ● ●
5 10 15 20
−4−2
02
4
Index
●● ●
●
● ●● ● ●
●
● ●
●●
● ● ●● ● ●
5 10 15 20
−4−2
02
4
Index
●
●
● ●
3/20 do not cover
3/4 CI do not cover
when selected
Need for False
Coverage-
statement Rate
controlling intervals
(FCR)
Selection of this form
harms Bayesian Intervals
as well
(Wang & Lagakos ‘07 EMR, Yekutieli 2012)
28
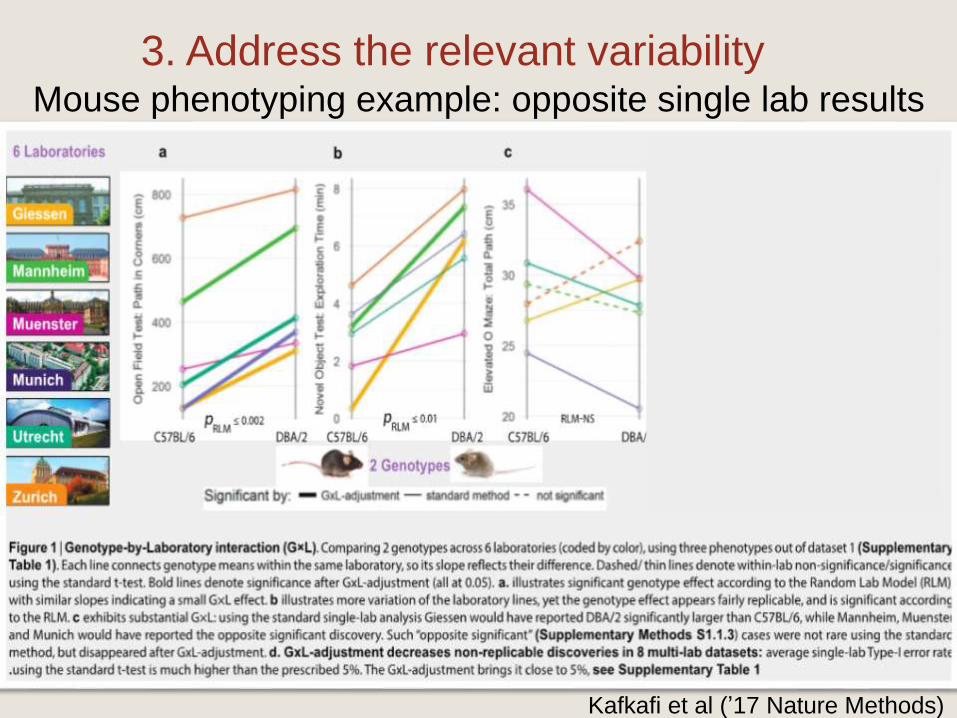
Mouse phenotyping example: opposite single lab results
Kafkafi et al (’17 Nature Methods)
3. Address the relevant variability
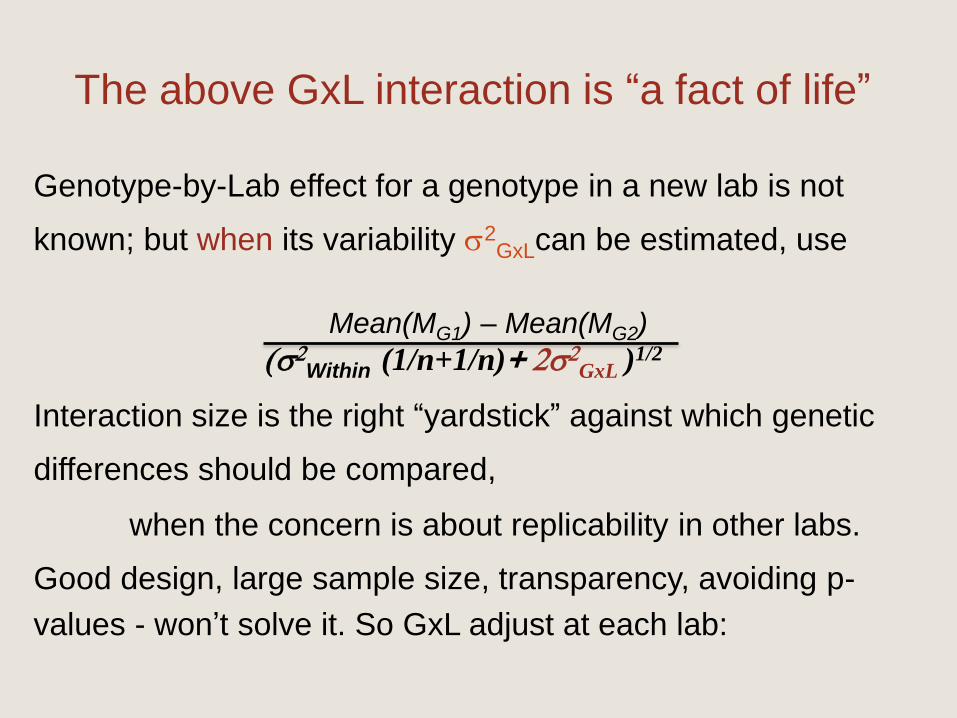
The above GxL interaction is “a fact of life”
Genotype-by-Lab effect for a genotype in a new lab is not
known; but when its variability s2GxLcan be estimated, use
Mean(MG1) – Mean(MG2)
(sWithin (1/n+1/n)+ s
GxL )1/2
Interaction size is the right “yardstick” against which genetic
differences should be compared,
when the concern is about replicability in other labs.
Good design, large sample size, transparency, avoiding p-
values - won’t solve it. So GxL adjust at each lab:
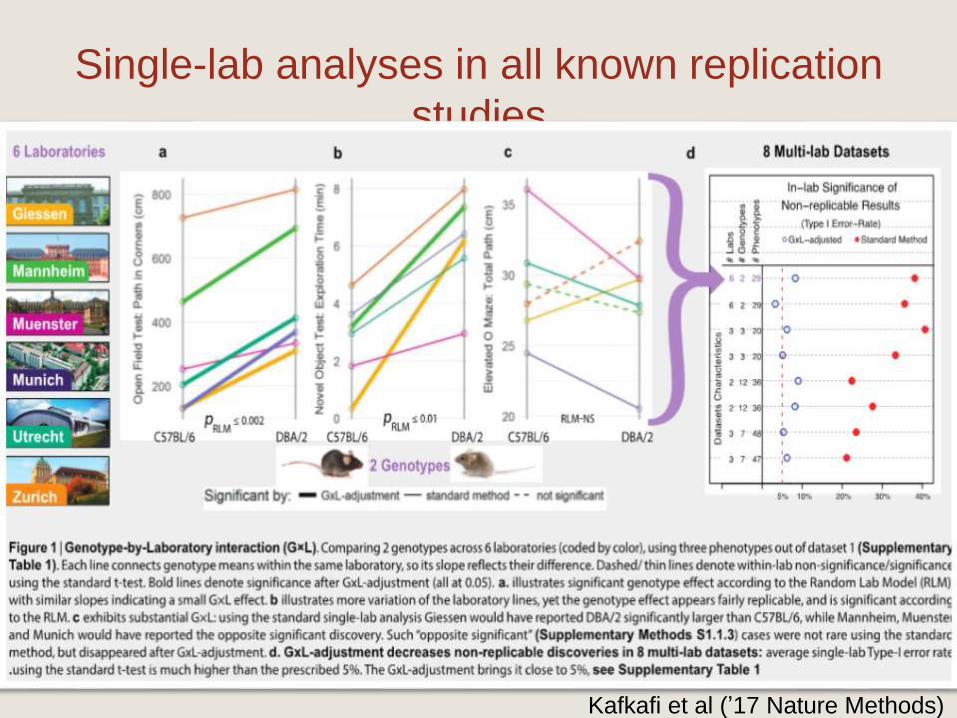
Single-lab analyses in all known replication
studies
Kafkafi et al (’17 Nature Methods)
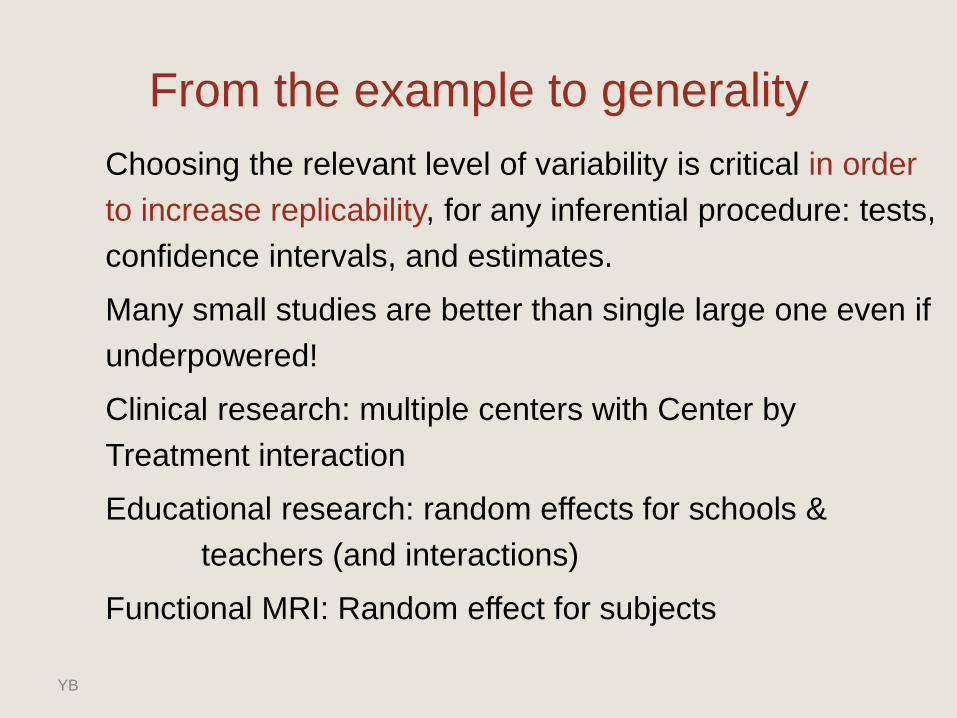
From the example to generality
Choosing the relevant level of variability is critical in order
to increase replicability, for any inferential procedure: tests,
confidence intervals, and estimates.
Many small studies are better than single large one even if
underpowered!
Clinical research: multiple centers with Center by
Treatment interaction
Educational research: random effects for schools &
teachers (and interactions)
Functional MRI: Random effect for subjects
YB
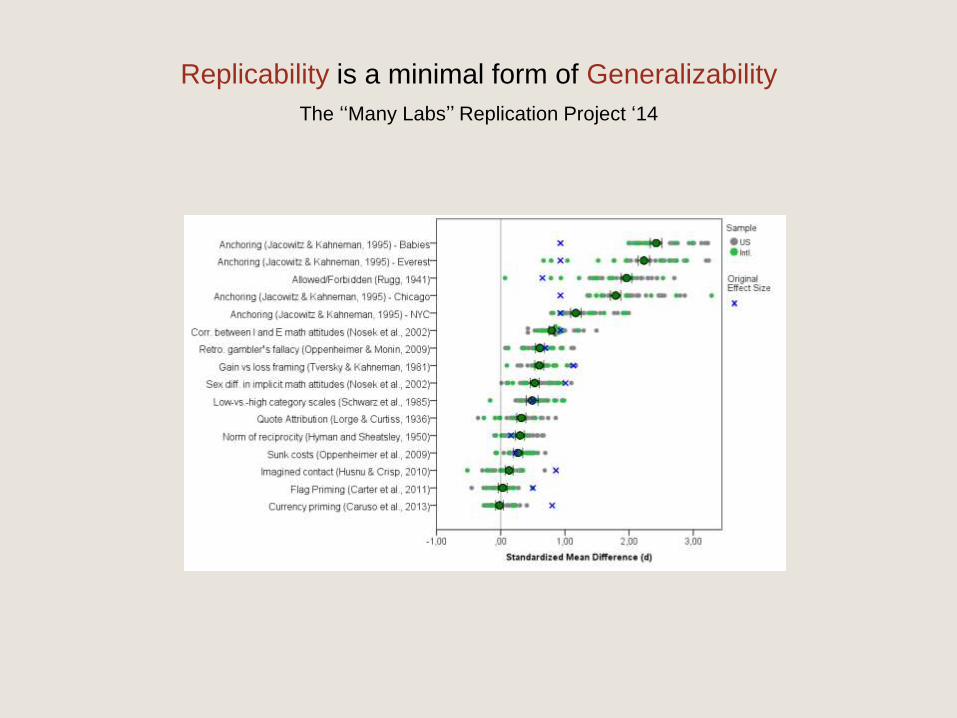
Replicability is a minimal form of Generalizability
The ‘‘Many Labs’’ Replication Project ‘14
4. Replicate others’ work as a way of
life• Check consistency of effect’s directional decision (sign)
Significant (p≤.05) in both studies (Fisher’s definition); or
Both confidence intervals are entirely on same side.
If replicated, strong evidence against randomness, (p<0.0025),
but Scientifically much stronger:
combining different tests by different investigators
r2/2–value = max (p1,p2)
ru/m–value: the smallest significance level at which
effects in at least u out of the m studies
adjusted for selection are significant
Have been used to analyze generalizability of results
In the Psychological Reproducibility Project 36% replicated
Replicate others’ work as a way of life
Reproducibility projects are not sustainable.
Neither are publishing many papers with negative results only.
Instead
• Every research proposal and paper should have a replicability-
check component of a result, considered by the authors
important for their proposed research.
• Its result will be reported whatever the outcome is, in the
extended-abstract/main-body in 1-2 searchable sentences.
• The authors of a replicated study will receive special recognition
for having published a result considered important enough by
others to invest the effort toreplicate it.
• Researchers, Granting agencies, Publishers, Academic leaders