yield stability and population diversity in oats (avena sp.)
TRANSCRIPT

Theor. Appl. Genet. 54, 1-5 (1979)
�9 by Springer-Verlag 1979
Yield Stability and Population Diversity in Oats (A v e n a sp.)
P.L. Pfahler University of Florida, Gainesville, Florida (USA) H.F. Linskens University of Nijmegen, Nijmegen (the Netherlands)
Summary. The relationship between yield stability and populations containing various numbers and combinations of diverse homozygous and homogeneous lines was ex- amined in an environment in which considerable variabil- ity occurs among and within growing seasons. Two groups (1,2), each containing 15 populations (4 pure lines grown singly and 11 multilines consisting of mechanical mixtures of all possible 2,3 and 4 way combinations of these 4 pure lines) were tested in each of 5 consecutive years. The pure lines in group 1 and 2 were selected on the basis of previ- ous yield and yield variability respectively. In group 1, no significant differences were found among the 5 year means or the deviation mean squares of the 15 popula- tions but highly significant differences among regression coefficients were present. The regression coefficients of the 4 pure lines differed considerably, indicating that this stability parameter was genetically influenced. The regres- sion coefficients of the multilines tended towards unity regardless of the regression coefficients of the pure lines involved. In group 2, highly significant differences were found among the 5 year means, regression coefficients and deviation mean squares of the 15 populations. No con- sistent, predictable pattern was apparent between the mean and stability values of the pure lines and the multi- lines in which they were included. Differences between the 2 groups suggest that higher yield and greater stability result in the multilines if relatively high yielding pure lines are selected for inclusion. In general, the results indicated that multilines containing a number of diverse homo- zygous and homogeneous pure lines have satisfactory yields and enhanced yield stability. However, adequate testing of the pure lines and potential multilines over a broad range of environments is essential to determine desirable combinations.
Key words: Homeostasis - Composite Population - Sta- bility Indexes - Genotype x Environment Interactions- Stability Parameters
Introduction
Genotype • environment interactions involving such complex quantitative characters as grain yield represent a major problem in plant improvement programs. The most promising method to reduce this factor to a minimum is to use multiline rather than genetically uniform popula- tions (Allard and Bradshaw 1964). Technically, the degree of genetic diversity possible in multiline populations is ex- tremely broad, ranging from restricted mixtures of isolines differing only at a single locus controlling disease resistance (Browning and Frey 1969) to diverse mixtures of pure lines widely different in many genetic traits (Jensen 1952). In most commercial species, the acceptance of multilines require that they be relatively uniform for cer- tain characters such as height, maturity and seed factors. This problem would be of minor significance with restrict- ed multilines but would become increasingly important as genetic diversity was widened. However, multilines con- taining the greatest amount of genetic diversity possible would probably be more effective in reducing the geno- type • environment interaction unless the genotype x environment interaction is closely associated with disease incidence. Thus, the major difficulty in developing ac- ceptable diverse multiline populations is the selection of pure lines which, in competition, complement each other in their response to various environments and still, in com- bination, satisfy the uniformity requirements.
In self-pollinated crops such as oats, the use of diverse multilines could be advantageous especially in geographi- cal areas where extreme environmental fluctuations occur. This study was designed to evaluate grain yield stability of multiline populations containing various numbers of pure lines over a 5-year period in an area where considerable variability occurs among and within growing seasons. Sub- stantial genetic variability among the pure lines was pre- sent but all multilines tested met necessary uniformity standards.
0040-5752/79/0054/0001/$ 1.00
2 Theor. Appl. Genet. 54 (1979)
Ma te r i a l s a n d M e t h o d s
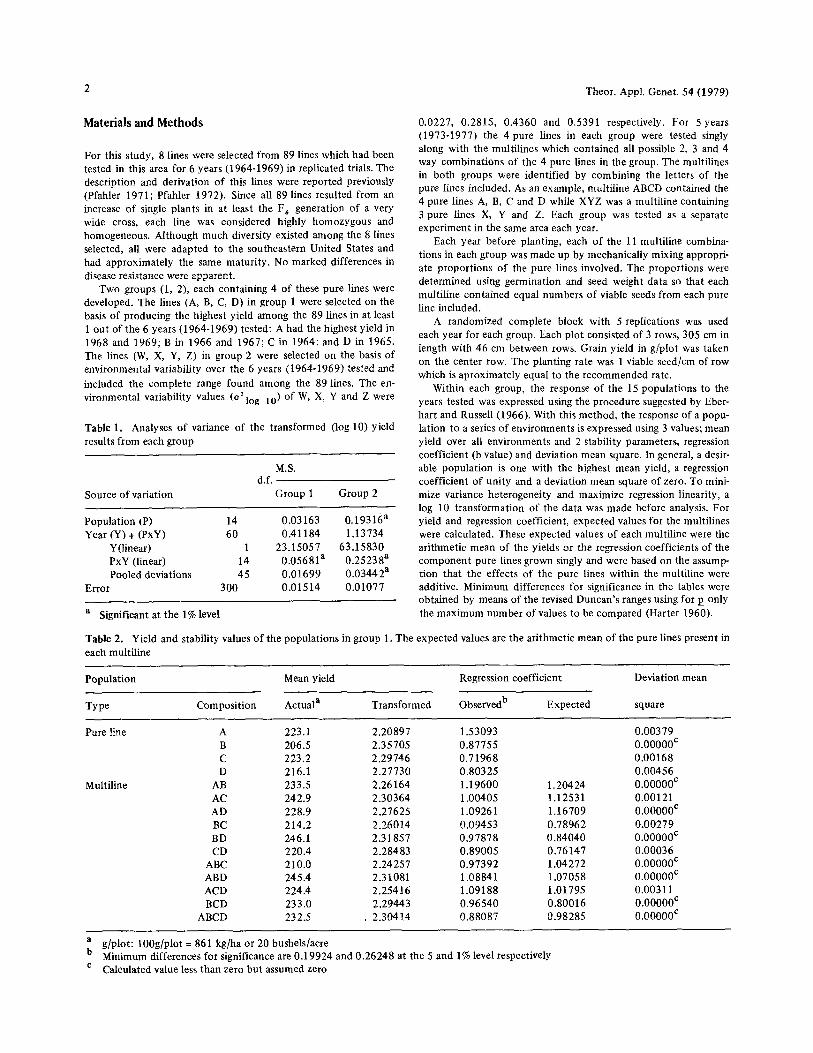
For this study, 8 lines were selected from 89 lines which had been tested in this area for 6 years (1964-1969) in replicated trials. The description and derivation o f this lines were reported previously (Pfahler 1971; Pfahler 1972). Since aU 89 lines resulted from an increase of single plants in at least the F 6 generation of a very wide cross, each line was considered highly homozygous and homogeneous. Al though much diversity existed among the 8 lines selected, all were adapted to the southeastern United States and had approximately the same matur i ty . No marked differences in disease resistance were apparent.
Two groups (1, 2), each containing 4 of these pure lines were developed. The lines (A, B, C, D) in group 1 were selected on the basis o f producing the highest yield among the 89 lines in at least 1 out of the 6 years (1964-1969) tested: A had the highest yield in 1968 and 1969; B in 1966 and 1967; C in 1964; and D in 1965. The lines (W, X, Y, Z) in group 2 were selected on the basis of environmental variability over the 6 years ( t964-1969) tested and
included the complete range found among the 89 lines. The en- vironmental variability values (or 2 log 10 ) of W, X, Y and Z were
Table 1. Analyses o f variance o f the t ransformed (log 10) yield results from each group
M.S. d.f.
Source of variation Group 1 Group 2
Populat ion (P) 14 0.03163 0.19316 a Year (Y) + (PxY) 60 0.41184 1.13734
Y(linear) 1 23.15057 63.15830 PxY (linear) 14 0.05681 a 0 .25238 a Pooled deviations 45 0 .01699 0.03442 a
Error 300 0.01514 0.01077
a Significant at the 1% level
Table 2. Yield and stability values o f the each multil ine
populat ions in group 1. The
0.0227, 0.2815, 0.4360 and 0.5391 respectively. For 5 years (1973-1977) the 4 pure lines in each group were tested singly along with the multi l ines which contained all possible 2, 3 and 4 way combinat ions of the 4 pure lines in the group. The multi l ines in both groups were identified by combining the letters of the pure lines included. As an example, multi l ine ABCD contained the 4 pure lines A, B, C and D while XYZ was a multil ine containing 3 pure lines X, Y and Z. Each group was tested as a separate exper iment in the same area each year.
Each year before planting, each of the 11 multil ine combina- tions in each group was made up by mechanical ly mixing appropri- ate proport ions o f the pure lines involved. The proport ions were determined using germinat ion and seed weight data so that each multil ine contained equal numbers o f viable seeds from each pure line included.
A randomized complete block with 5 replications was used each year for each group. Each plot consisted of 3 rows, 305 cm in length with 46 cm between rows. Grain yield in g/plot was taken on the center row. The planting rate was 1 viable seed/cm of row which is aproximately equal to the recommended rate.
Within each group, the response of the 15 populat ions to the years tested was expressed using the procedure suggested by Eber- hart and Russell (1966). With this method , the response of a popu- lation to a series of envi ronments is expressed using 3 values; mean yield over all environments and 2 stability parameters, regression coefficient (b value) and deviation mean square. In general, a desir- able populat ion is one with the highest mean yield, a regression coefficient o f uni ty and a deviation mean square of zero. To mini- mize variance heterogeneity and maximize regression linearity, a log 10 t ransformat ion of the data was made before analysis. For yield and regression coefficient, expected values for the rnultilines were calculated. These expected values of each multil ine were the ar i thmetic mean of the yields or the regression coefficients of the componen t pure lines grown singly and were based on the assump- tion that the effects of the pure lines within the multil ine were additive. Minimum differences for significance in the tables were obtained by means of the revised Duncan ' s ranges using for p only the m a x i m u m number of values to be compared (Harter 1960).
expected values are the ar i thmetic mean of the pure lines present in
Populat ion
Type Composi t ion
Mean yield
Actual a Transformed
Regression coefficient Deviation mean
Observed b Expected square
Pure line
Multiline
A 223.1 2.20897 1.53093 0.00379 B 206.5 2.35705 0.87755 0.00000 c C 223.2 2.29746 0.71968 0.00168 D 216.1 2.27730 0.80325 0.00456
AB 233.5 2.26164 1.19600 1.20424 0 .00000 c AC 242.9 2.30364 1.00405 1.12531 0.00121 AD 228.9 2.27625 1.09261 1.16709 0 .00000 c BC 214.2 2.26014 0.09453 0.78962 0.00279 BD 246.1 2.31857 0.97878 0.84040 0 .00000 c CD 220.4 2.28483 0.89005 0.76147 0.00036
ABC 210.0 2.24257 0.97392 1.04272 0.00000 c ABD 245.4 2.31081 1.08841 1.07058 0.00000 c ACD 224.4 2.25416 1.09188 1.01795 0.00311 BCD 233.0 2.29443 0.96540 0.80016 0.00000 c
ABCD 232.5 . 2.30414 0.88087 0.98285 0.00000 c
a g/plot: 100g/plot = 861 kg/ha or 20 bushels/acre b Minimum differences for significance are 0.19924 and 0.26248 at the 5 and c Calculated value less than zero bu t assumed zero
1% level respectively

P.L. Pfahler and H.F. Linskens: Yield Stability and Population Diversity in Oats 3
Results
Group 1
Statistically significant F values were found only for the P x Y (linear) interaction indicating that differences among the regression coefficients of the 15 populations were pre- sent (Table 1). According to the model, a b value of 1.0 indicates a stable population over the environments test- ed. However, the variability of the environments in an important factor and in large part determines the use- fulness of this stability parameter. For group 1, the en- vironmental indexes for each year were as follows, with the actual mean (g/plot) in parentheses: 1973 = 2.32277 (221.3); 1974 = 1.87515 (82.1); 1975 = 2.17342 (153.5); 1976 ---- 2.60576 (411.2); and 1977 = 2.44003 (283.3). The variability among years was extremely large with the mean actual yield in 1976 being almost 5 times that in 1974.
Substantial differences among the regression coeffi- cient of the 4 pure lines grown singly were obtained (Table 2). A had a b value (1.53093) significantly higher than both the other 3 pure lines and 1.0 indicating that A had a lower than average yield in the years with generally low yields and a higher than average yield in the years with generally high yield. B, C and D with b values con- siderably less than 1.0 responded in an opposite manner with higher yields in low yielding years and Iower yields in high yielding years. Apparently, genetic differences among the pure lines for this stability parameter are present. The observed regression coefficients of the multilines differed considerably from the arithmetic mean of the pure lines grown singly. In most multilines, the observed regression coefficients more closely approached unity rather than the arithmetic mean indicating not only that the multi- lines had greater stability but that the effects of the pure lines in the multiline were not additive for this parameter. However, the direction and magnitude of this effect was modified by the number and the pure lines involved.
Group 2
Highly significant F values were found for population, the P x Y (Linear) interaction and the pooled deviations (Table 1). According to the model, the most desirable population would have a high mean yield over the en- vironments tested, a b value of 1.0 and a deviation mean square of O. In group 2, differences among the popula- tions were present for all these parameters.
As in group 1, the environmental indexes used to determine these parameters are vitally important. For group 2, the environmental indexes for each year were as follows, with the actual mean (g/plot) in parentheses:
1973 = 2.31598 (214.6); 1974 --- 1.43065 (35A); 1975 = 1.92413 (86.6); 1976 = 2.56572 (402.9); and 1977 = 2.37318 (240.3). The variability among years was ex- tremely large with the mean actual yield in 1976 more than 11 times as large as that in 1974.
Significant differences were present among the mean yields of the pure lines grown singly with W having the highest yield, Y intermediate and X and Z the lowest (Table 3). The yield of most multilines was intermediate in relation to the pure lines grown singly. However, the yield of some multilines differed substantially from the intermediate value indicating that the effect of certain pure lines was not additive when included in a multiline. As an example, WY yielded about the same as Y which had an intermediate yield when grown singly but was the lower yielding pure line in this multiline. No multiline containing W which was the highest yielding pure line equalled the yield of,W grown singly. However, X and Z which had approximately equal yields but were the lowest yielding among the pure lines produced a multiline XZ whose yield considerably exceeded both pure lines grown singly.
Substantial differences among the regression coeffi- cients of the 4 pure lines grown singly were found in- dicating that genetic diversity for this stability parameter was present (Table 3). In relation to the multilines, differ- ences between the observed and expected regression coef- ficients were quite pronounced in some cases. However, unlike group 1, the regression coefficients of the multi- lines did not approach unity more closely than the arith. metic mean of the pure fines grown singly. The same un- predictability was evident in the deviation mean squares (Table 3). Thus, it appears as if the mean and stability parameters of the multilines cannot be accurately pre- dicted from those of the pure lines grown singly.
Discussion
In the model proposed by Eberhart and Russell (1966), an ideal population is one which has the highest yield over a broad range of environments, a regression coefficient or b value of unity and a deviation mean square of zero. The results of this study indicated that some multilines con- taining a mixture of diverse pure lines approached this ideal more closely than their component pure lines in the environments tested. Although the yield and stability parameters of the multilines were associated with those of their component pure lines grown singly, substantial dif- ferences among the pure lines when mixed in various multiline combinations were found. Apparently, an inter- genotypic interaction occurs in the multilines so that the yield of each component pure line or genotype depends on the other component pure lines or genotypes in the

4 Theor. Appl. Genet. 54 (1979)
Table 3. Yield and stability values of the populations in group 2. The expected values are the arithmetic mean of the pure lines present in each multiline
Population Mean yield Regression coefficient Deviation mean
Type Composition Actual a Transformed Observed c Expected square
Observed b Expected
Pure line
Multiline
W 243.0 2.32115 0.51452 0.00450 e X 168.5 2.02788 1.14207 0.00000 d Y 201.3 2.13472 1.06260 0.00000 Z 161.9 1.95465 1.43749 0.03253 f
WX 195.6 2.17862 2.17452 0.76826 0.82830 0.00623 e WY 204.9 2.19786 2.22794 0.78423 0.78856 0.00628 e WZ 204.6 2.20740 2.13790 0.72288 0.97601 0.00492 e XY 204.2 2.13154 2.08130 1.06544 1.10234 0.00000 a XZ 188.3 2.05430 1.99127 1.21523 1.28978 0.00414 e YZ 194.5 2.08579 2.04469 1.24728 1.25005 0.00292
WXY 199.1 2.17266 2.16125 0.82346 0.90640 0.00809 f WXZ 193.6 2.13796 2.10123 0.91466 1.03136 0.00068 WYZ 198.0 2.12993 2.13684 1.03496 1.00487 0.00000 d XYZ 180.1 2.04168 2.03908 1.24278 1.21405 0.00326
WXYZ 201.7 2.14288 2.10960 1.02452 1.03917 0.00049
a g/plot: 100 g/plot = 861 kg/ha or 20 bushels/acre b Minimum differences for significance are 0.12684 and 0.16711 at the 5 and 1% level respectively c Minimum differences for significance are 0.28359 and 0.37361 at the 5 and 1% level respectively d Calculated value less than zero but assumed zero e,f Significantly different from zero at the 5 and 1% level respectively
multiline. This interaction among pure lines for yield have been reported in other self-pollinated cereal crops (Jensen 1952; Simonds 1962).
Many factors varying in their effect and intensity can contribute to this intergenotypic interaction in multilines (Allard and Bradshaw 1964; Allard and Jones 1969). Yield represents a final character resulting after many developmental and biochemical pathways from germina- tion to maturity have been involved. Thus, yield can be influenced by genotypic differences in growth rate and development, plant type, disease resistance and efficiency in the uptake and utilization of water, nutrients and light. The effects of some, if not all of these factors in a multi- line situation, would be amplified in a crop species such as oats in which plants are grown in close proximity to each other and as a result, interplant competition is relatively intense. Another important contributing factor, if multi- lines containing a mixture of diverse pure lines are in- volved, is that the diversity among pure lines for certain morphological and/or physiological characters would probably intensify this intergenotypic interaction. The impact o f this intergenotypic interaction is further com- plicated if production is in a geographical area where con- siderable variability within and among years is present and where substantial genotype • year interactions would be expected. In this experiment, the extremely large year differences in yield were probably the result of tempera-
ture and moisture conditions during the growing season. Little or no soil type or fertility differences were expected since all experiments were conducted in the same area under similar fertility practices. Also, possible differences in disease resistance among the pure lines did not appear to be a major contributing factor since in all years, the disease spectra and their severity were very limited. At the present time, little information is available to interpret the effect of these numerous factors and their interactions on a dynamic living system in which change .occurs from germination to maturity (Allard and Bradshaw 1964).
In plant improvement programs with self-pollinated, closely-spaced crop species, the reduction of the genotype • environment interaction is of prime concern. Until re- cently, the commercial use of homogeneous and homo- zygous lines which display differing degrees of individual buffering (Allard and Bradshaw 1964) to various environ- ments has been practiced. Although individual buffering capacity has been recognized as a genetic trait (BhuUar et al. 1977; Johnson et al. 1968; Frey 1972), the develop- ment of pure lines using individual buffering as a selection criterion is an involved and complex procedure. The dif- ficulty of selecting buffered pure lines is emphasized by the fact that isolines derived by 6 backcrosses and presum- ably differing in only one disease resistant locus differed significantly in yield and stability parameters although they were quite homogeneous for plant height, general

P.L. Pfahler and H.F. Linskens: Yield Stability and Population Diversity in Oats 5
appearance, heading date and seed traits (Frey 1972). The
results of the study reported here indicated that multilines
containing a mixture of diverse pure lines have reduced genotype x environment interaction and thus, represent a more desirable alternative to pure lines especially in an area with considerable environmental variability. How- ever, differences in intergenotypic interaction among the pure lines complicate the development process since test- ing of the pure lines and potential multilines over a broad range of environments is essential to determine the most desirable buffered multilines. This development process can be somewhat simplified by selecting only high yield- flag pure lines for consideration since the yield of pure lines was found to be positively correlated with yield sta-
bility (Pfahler 1972) and this study showed that the most desirable multilines resulted when relatively high yielding pure lines were included in the multiline.
Acknowledgement
Thanks are extended to Dr. F.G. Martin for statistical assistance and to H.S. Anspach and W.T. Mixon for technical assistance. Ap- preciation is expressed to Dr. R.W. Allard for his thorough and constructive review of this manuscript.
Literature
Allard, R.W.; Adams, J.: The role of intergenotypic interactions in plant breeding. Proc. XII Intern. Congr. Genet. 3. 349-370 (1969)
Allard, R.W.; Bradshaw, A.D.: Implications of genotype-environ- mental interactions in applied plant breeding. Crop Sci. 4 503- 508 (1964)
Bhullar, G.S.; Gill, K.S.; Khehra, A.S.: Stability analysis over vari- ous filial generations in bread wheat. Theor. Appl. Genet. 51, 41-44 (1977)
Browning, J.A.; Frey, K.J.: Multiline cultivars as a means of dis- ease control. Ann. Rev. Phytopath. 7, 355-382 (1969)
Eberhart, S.A.; Russell, W.A.: Stability parameters for comparing varieties. Crop Sci. 6, 36-40 (1966)
Frey, K.J.: Stability indexes for isolines of oats (Arena sativa L.). Crop Sci. 12, 809-812 (1972)
Harter, H.L.: Critical values for Duncan's multiple range test. Bio- metrics 16, 671-685 (1960)
Jensen, N.F.: Intra-varietal diversification in oat breeding. Agron. J. 44, 30-34 (1952)
Johnson, V.A.; Shafer, S.L.; Schmidt, J.W.: Regression analysis of general adaptation in hard red winter wheat (Triticum aestivum L.) Crop Sci. 8, 187-191 (1968)
Pfahler, P.L.: Heritability estimates for grain yield in oats (Arena sp.). Crop Sci. 11,378-381 (1971)
Pfahler, P.L.: Relationship between grain yield and environmental variability in oats (Arena sp). Crop Sci. 12, 254-255 (1972)
Simmonds, N.W.: Variability in crop plants, its use and conserva- tion. Biol. Rev. 37, 422-465 (1962)
Received September 5, 1978 Communicated by R.W. Allard
Prof. Dr. P.L. Pfahler Agronomy Department 304 Newell Hall, University of Florida, Gainesville, Florida 32611 (USA)