year 2 magnet schools assistance program (msap) annual ... · pdf fileyear 2 magnet schools...
TRANSCRIPT
Year 2 Magnet Schools Assistance Program (MSAP)
Annual Progress Report
Contact: Jon Brasfield, E&R (850-1840) E&R Report No. 09.35 October 2009
OVERVIEW
The following report is the required Annual Progress Report for grant year 2008-2009 as submitted to the Department of Education’s Office of Innovation and Improvement. It provides a status report on implementation and initial outcomes of the grant program as of May 15, 2009. The first section presents an executive summary, outlining the project as it stands at the end of Year 2. The second section provides information on each performance measure and each school’s progress toward the associated targets. The third section contains budget information, the district’s voluntary desegregation plan, and data tables related to minority enrollment. Note that while the evaluation reporting period includes information through the end of the 2008-2009 school year, the budget reporting period ended April 15, 2009. The MSAP is a federal grant initiative designed to reduce or eliminate minority group isolation in elementary, middle, and secondary schools where minority group students comprise a substantial population. The awarded funds are distributed to school districts with the goal of developing and implementing systemic reforms and programs that challenge and enrich students. Districts receiving the grant are required to submit annual progress reports, as well as a summative report at the conclusion of the grant period. Continuation of grant funds is predicated on a district’s progress toward stated goals and objectives. The 2007-2010 MSAP grant was awarded to Wake County Public Schools by the U.S. Department of Education in the amount of $8,320,469 in order to support revised magnet themes at three WCPSS schools: Southeast Raleigh Magnet High School for Leadership & Technology, Garner Magnet High School (GMHS), and East Garner Magnet Middle School (EGMMS) for International Baccalaureate programmes. The leadership and technology theme at Southeast Raleigh is embodied by the school’s partnership with the New Tech foundation (an organization dedicated to revising educational models for the 21st century through technology and collaboration), its implementation of a leadership curriculum, use of modern technology in art, broadcasting, music, and core classes, and development of leadership and technology-focused clubs. The themes at Garner High and East Garner Middle are associated with the International Baccalaureate (IB) programme, which focuses on instruction in eight core areas (Language A, Language B, Physical Education, Sciences, Arts, Mathematics, Technology, and Humanities) through five areas of interaction: approaches to learning, community and service, human ingenuity, environment, and health and social education. The IB Middle Years Programme at EGMMS is a whole-school program, in which all students and teachers participate. At GMHS, the IB Middle Years and Diploma Programmes are limited to students who apply and are admitted. The primary focus is on enhancing GMHS arts and foreign language offerings to incorporate multicultural themes into arts instruction.
1
U.S. Department of Education Grant Performance Report (ED 524B)
Executive Summary
OMB No. 1890 - 0004 Expiration: 10-31-2007 PR/Award #: U165A070026
Introduction The theme for MSAP this past year has been “What you focus on expands”. Considerable effort and attention have been focused on building upon the strengths and potential of our three MSAP schools: East Garner International Baccalaureate Magnet Middle School (EGMMS), Garner International Baccalaureate Magnet High School (GMHS), and Southeast Raleigh Leadership and Technology Magnet High School (SRMHS). Significant progress has been made in Year 2 by each of the three MSAP schools as a concerted effort has been made by the schools, district, community, and students to implement and expand our grant objectives. The schools have utilized opportunities afforded by the MSAP funds to continue the transformation process. Unlike Year 1, Year 2 reflects the outcomes of having all key stakeholders hired, trained, and fully focused on MSAP performance measures. Year 2 represents an amalgamation of Year 1 activities that were not implemented due to a delay in hiring key personnel, original objectives assigned to Year 2, and several activities that arose from our deliberate “Plan, Do, Study, Act” (PDSA) sessions. Our PDSA generated user-friendly blue prints for each school that captured each school’s performance measures, target outcomes, yearly activities, staff development activities, and resources. In addition, we developed for each MSAP school a detailed customized yearly time line that includes specific monthly activities. These activities address four focal areas: program implementation, marketing and recruitment, budget reconciliation, and evaluation. At our monthly school coordinator/ principal meetings, schools rotated through customized discussions to discuss each of those four areas with corresponding MSAP staff: MSAP Director (program implementation), MSAP Recruiter (marketing and recruitment), MSAP Budget Technician (budget), and MSAP Evaluator (evaluation). The approved MSAP grant requires that data on 17 performance measures (pm) be collected in each project year. Of the 17, one pm (5.1) can not be adequately measured until three years after federal funds are ended. Of the 16 remaining, six belong to the “Desegregation and Choice” category, two belong to “Building Capacity,” and eight (seven for EGMMS) belong to “Academic Achievement of Students.” Across the board, the “Desegregation and Choice” category was the most difficult for schools to attain, with SRMHS, GMHS, and EGMMS achieving 3/6, 4/6, and 4/6 stated goals, respectively. All schools achieved both “Building Capacity” performance measures. In the “Academic Achievement” category, which is measured heavily by Adequate Yearly Progress (AYP) attainment, SRMHS achieved 5/8, GMHS achieved 4/8, and EGMMS achieved 6/7 (4-year graduation rate is measured for the two high schools, but not for the middle school). In all, SRMHS achieved the stated target on 10/16 performance measures, GMHS on 10/16, and EGMMS met 12/15. Three of the performance measures (2.2, 4.1, and 4.2) deal directly with AYP attainment. Results from these three measures were mixed, with none of the three schools meeting their targets with respect to percentage of students meeting their growth targets on End Of Course and/or End Of Grade (EOC/EOG) exams. Two schools, EGMMS and SRMHS, saw each eligible racial and ethnic subgroup meet all AYP targets for proficiency, while GMHS did not achieve AYP in math for African-American students. Overall, 100% of AYP targets were met at EGMMS, 95% were met at SRMHS, and 68% were met at GMHS. The Wake County Public School System was awarded $2,487,728 for Year 2; this, combined with a Year 1 carryover of $1,138,203, resulted in $3,625,931 available for Year 2. Once again, we relied on a PDSA process to develop a revised Year 2 budget. Priority for Year 2 budget expenditures was given to activities that would assist schools in meeting any Year 1 performance measures that had not been met. Maximizing the use of MSAP funds by seeking innovative and fiscally responsible processes have kept our focus on each school’s target outcomes, meeting and exceeding performance measures, and establishing structures that will ensure long-term sustainability. The following reflects a summary of initiatives implemented during Year 2 at each MSAP school:
2
Year 2 Implementation
East Garner International Baccalaureate Middle School (EGMMS): • The Year 3 Middle Years Programme (MYP) students were direct beneficiaries of the Personal Project IB staff
development sessions that EGMMS staff attended during the summer of Year 1. As a result of the training, the teachers developed and implemented Learning Community Projects (LCP). Through the LCP, 8th grade students completed career interest inventories and partnered with advisors who mentored them throughout their career research and community projects. The research projects culminated in oral presentations.
• Field trips to museums and theater performances afforded students with experience-based learning opportunities targeting the enhancement of cultural capital. After-school tutoring and clubs provided access to innovative choice opportunities, while also offering students rigorous academic support.
• Through a school-wide interdisciplinary unit, the EGMMS students and staff “journeyed” through Africa, immersing themselves in the culture, literature, music, and dance of West Africa. Their “180-day journey around the world” also included “traveling” through Latin America and Australia, accentuating key IB learner profile characteristics and MYP areas of interaction such as becoming open minded learners of languages and cultures.
• EGMMS’s progress has not only been recognized locally, but also nationally. They have been selected as a Magnet School of Excellence for the first time by Magnet Schools of America.
Garner Magnet International Baccalaureate High School (GMHS): • In an effort to provide choice and innovation, five new arts curriculum units were written. In addition, all five
classes were taught in 2008-2009, including offering Ballet I and II, World Culture Dance, International Film, and Global Pottery. Four additional classes will be developed during the summer of Year 2.
• Quality arts experiences have been expanded this year via master classes, resident artists, field trips, a Day of Dance, and an International Festival.
• During the summer of Year 1, an artist painted murals in the lobby and throughout the hallways of the school. The paintings were paired with quotations to illustrate key IB objectives. Although initial resistance was expressed echoing sentiments held by pockets of stakeholders towards their IB magnet theme, throughout the year, students and staff have requested expansion of similar art projects, all as examples of the tangible embrace of the IB philosophy and magnet theme.
• Dozens of orchestra instruments, dance costumes, and theater props have been used by music tutors, resident artists, and dance troupes to provide extended learning opportunities for students. During the summer of Year 1 and Year 2, MSAP sponsored a Band Camp. During Year 2 GMHS will add a Visual Arts Camp.
• IB interdisciplinary units were developed and implemented. Through the assistance of MSAP purchased materials, IB interdisciplinary units were enhanced with books, videos, music, and equipment. The GMHS core team was helpful in encouraging IB interdisciplinary partnerships and bridging differences between IB arts teachers and teachers who were only peripherally impacted by MSAP.
Southeast Raleigh Leadership & Technology Magnet High School (SRMHS): • Year 1 of the New Tech Foundation (NTF) program was fully implemented in 9th grade; including the training
of teachers and administrators, retrofitting four classrooms, purchasing hardware, and on-going consultation with NTF staff. Three hundred forty-three students were enrolled in NTF classes; including three sections of Comm/Tech (English/Social Studies), two sections of Math, two sections of Science, and one section of Healthful Living. Project-based learning methodology was expanded to classes outside of the NTF classes such as Broadcast and Digital Arts classes.
• Phase II of retrofitting for Year 3 New Tech classes is slated to begin June 1, 2009. Selection of Year 2 NTF teachers is in progress. Training will take place this summer. School Year ‘09-10 NTF student selection process has begun.
• Monthly visits with the Leadership consultant provided guidance in development, implementation, and monitoring of Leadership activities. The180º Leadership curriculum was selected and teachers and administrators received 180º training. The curriculum was piloted in 2 classes during the ‘09 spring semester. 180º classes were open to all grades. Forty-eight students took advantage of the 180º spring classes. The Bulldog student mentor program was significantly enhanced and started the Interclub Council, enhancing student leadership opportunities and encouraging student decision-making.
• Newly developed courses were offered; including courses in Broadcasting /Non-linear Video, Forensics II, Digital Electronics, Introduction to Engineering Design, Engineering Design, Aerospace Engineering, Civil Engineering and Architecture, Digital music, and Civil Air Patrol.
3
Implementation Changes for 2008-09/Overcoming Challenges
• Improving student academic achievement and building staff capacity are central to meeting our MSAP performance objectives. The schools’ magnet themes provide not only innovative but also academically rigorous programs. Student achievement is directly aligned to the staffs’ capacity. Due to the economic recession, out-of-state travel plans were restricted. This required getting permission from our program officer to re-write our professional development plan without compromising the “Building Capacity” MSAP objectives so that most training took place either on site or within the State. EGMMS and GMHS were most impacted by this policy change. Stipends will be offered for most summer staff development sessions.
• As we continue the MSAP journey and work towards overcoming the challenges facing each school with the goals and objectives woven into the Renaissance grant, all 3 schools have faced the challenge of creating a systemic paradigm shift. Enthusiastic pockets of practitioners are evident in each MSAP school. The MSAP coordinators and principals must be acknowledged for their germinating efforts. However; it is by observing and conversing with the students that one becomes convinced of the scope and depth of the transformation at each school. The children discuss the tangible differences in the physical appearance of their school, the impact of the new curriculum, the empowering effects in the change of instructional methodology, and the correlation between their current school experience with the enabling opportunities for future success in post-secondary education and their career. A most rewarding and notable symptom of Year 2 has been the change in tone of students’ conversation: their dialogue, focus, and projects reflect a distinct global flavor and 21st century framework.
Marketing and Recruitment
Unlike Year 1, when the Marketing and Recruiting Senior Administrator was hired three months after the magnet application process concluded, in Year 2 our marketing and recruitment efforts were well planned, strategic, targeted, and all-encompassing. As included in the OCR report, our district implemented a 3-year student assignment plan. In addition, two IB schools had their magnet status removed, while one school became an IB magnet. Each of our MSAP schools was impacted by the new student assignment plan. SRMHS lost nodes with predominantly higher socio-economic students and GMHS did not get significant relief in its overcrowding, therefore a limited amount of space is available for new magnet students. This was compounded by a decision to postpone proposing a construction bond that would have resulted in the rebuilding of a new and larger GMHS campus. Efforts were made to encourage families from the demagnetized schools to apply to EGMMS and GMHS. Although our recruitment efforts rendered better outcomes than in Year 1, MSAP schools were still unable to meet several performance objectives tied to minority group isolation, and increasing the applicant pool. Much can be attributed to issues related to the large geographical size of our district, making MSAP schools less convenient options to families who live more than 45 minutes away from our target schools; families from demagnetized schools are not yet convinced that our newer IB programs at EGMMS and GMHS offer the same quality programs as the demagnetized yet more established IB program. Magnet Programs staff has developed online surveys to continue to shed light on parent’s perceptions so that we can better assist schools to expand their appeal, provide more choice for parents, and ultimately improve the quality of their magnet program. All marketing and recruitment efforts are carefully designed so that they do not negatively impact the health of our entire district, but rather continue to make WCPSS a healthy, diverse, and high-achieving school district. Working with district staff and marketing firms, school Web sites were redesigned at two of the three schools, and marketing materials were developed including videos, brochures, flyers, and display banners. Promotional information was posted on media Web sites, television channels, and newspapers. Concerted planning and training of key personnel allowed teachers, administrators, and students to reach the entire district, providing dozens of information sessions, and distributing promotional DVDs and flash drives. Each school provided numerous open houses with customized guided tours. Most information sessions were provided at each respective school. In the summer of 2009 the Magnet Resource Center will provide some enhancements to our information center in order to provide parents with a more centralized location to gather information about our MSAP schools.
Year 2 of the MSAP grant exemplifies the desire of principals, coordinators, and teachers at EGMMS, GMHS, and SRMHS to acquire, develop, implement, and sustain a learning environment that will facilitate the acquisition of skills, knowledge, and opportunities for their students to thrive successfully in a global community. In order to do this, much energy has been focused on all components of the grant and with time, support, and caring, the strengths each school has have expanded. Whether through project-based learning, leadership courses,

4
personal projects, essential questions, field trips, interdisciplinary units, new curriculum, or resident artists, the MSAP grant dissolves classroom walls and enables teachers at EGMMS, GMHS, and SRMHS to focus on their students’ gifts and in turn expand their learning throughout the world.
5
School Minority Enrollment Target Actual Performance Data
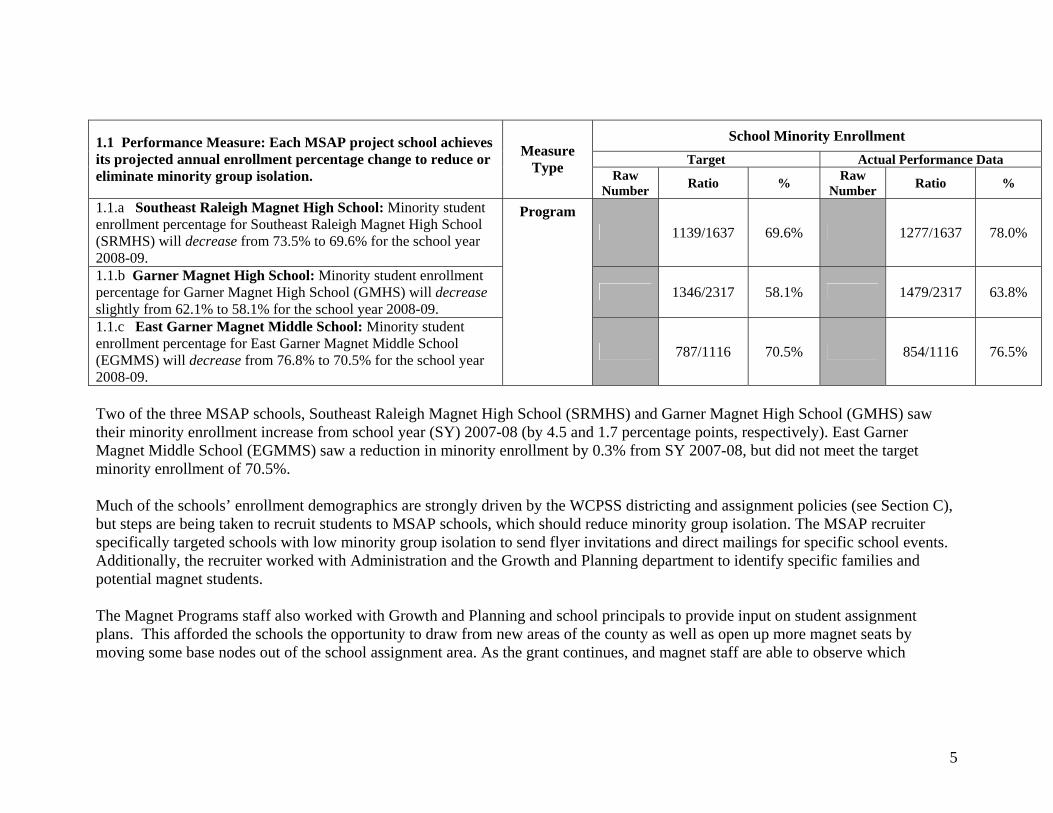
1.1 Performance Measure: Each MSAP project school achieves its projected annual enrollment percentage change to reduce or eliminate minority group isolation.
Measure Type Raw
Number Ratio % Raw Number Ratio %
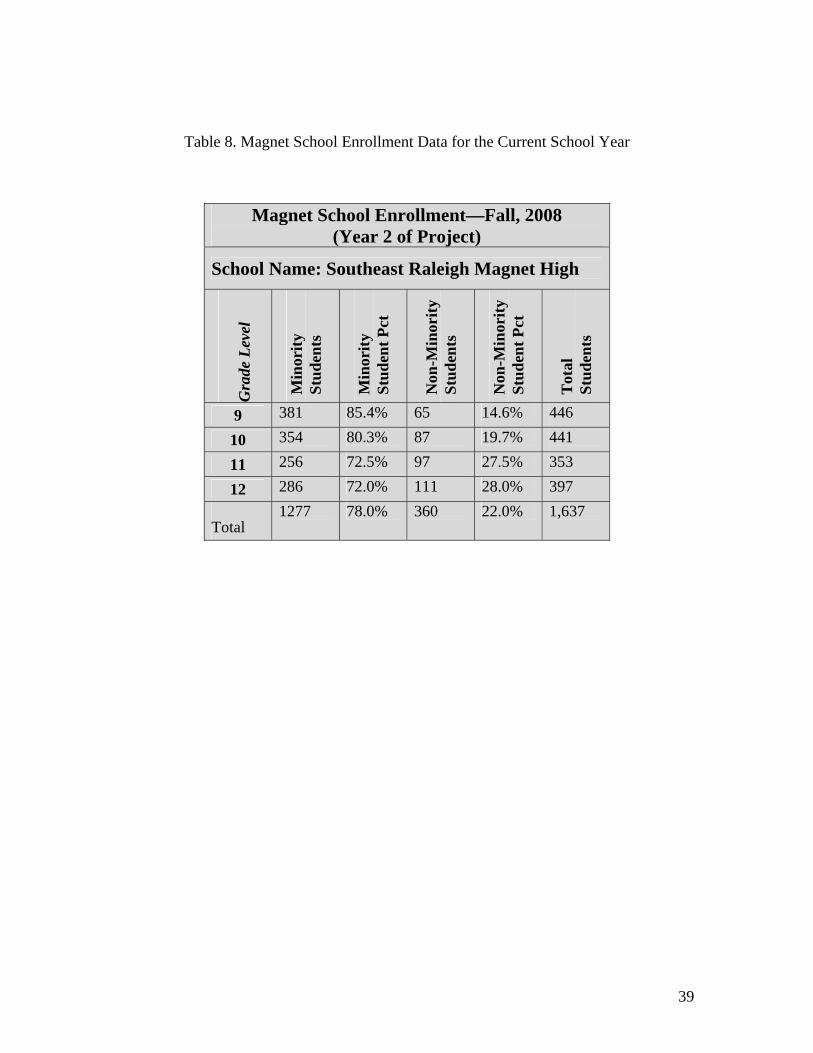
1.1.a Southeast Raleigh Magnet High School: Minority student enrollment percentage for Southeast Raleigh Magnet High School (SRMHS) will decrease from 73.5% to 69.6% for the school year 2008-09.
1139/1637 69.6% 1277/1637 78.0%
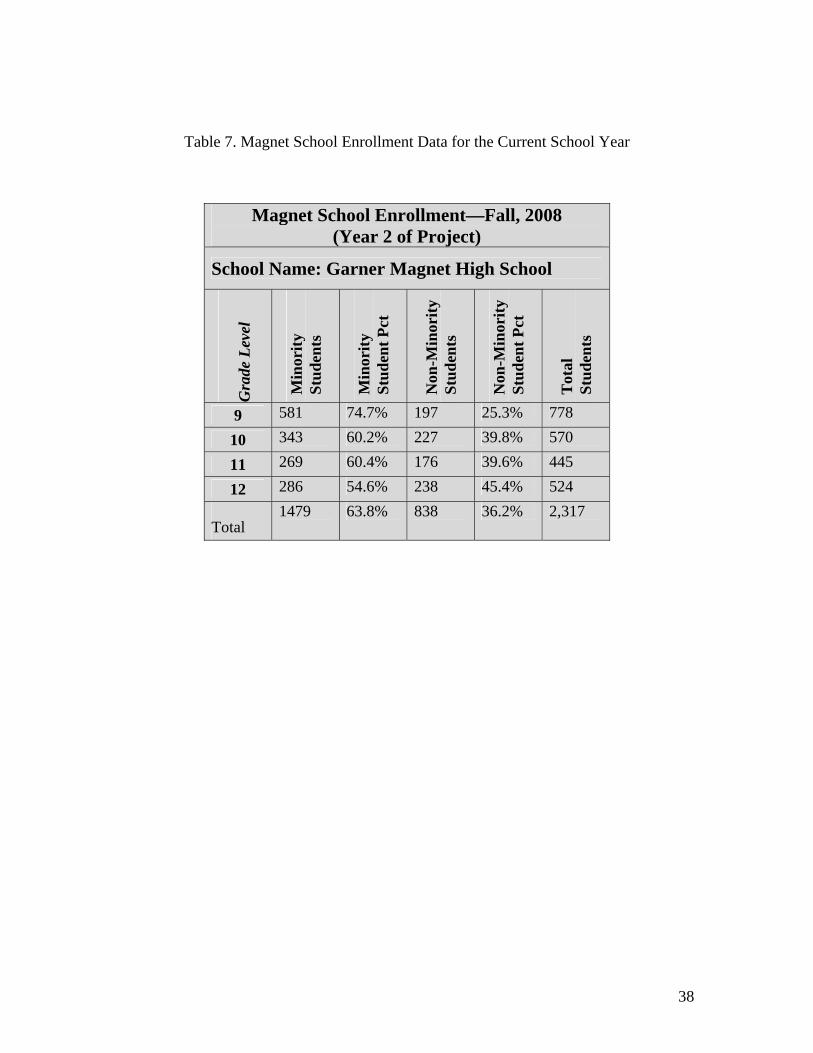
1.1.b Garner Magnet High School: Minority student enrollment percentage for Garner Magnet High School (GMHS) will decrease slightly from 62.1% to 58.1% for the school year 2008-09.
1346/2317 58.1% 1479/2317 63.8%
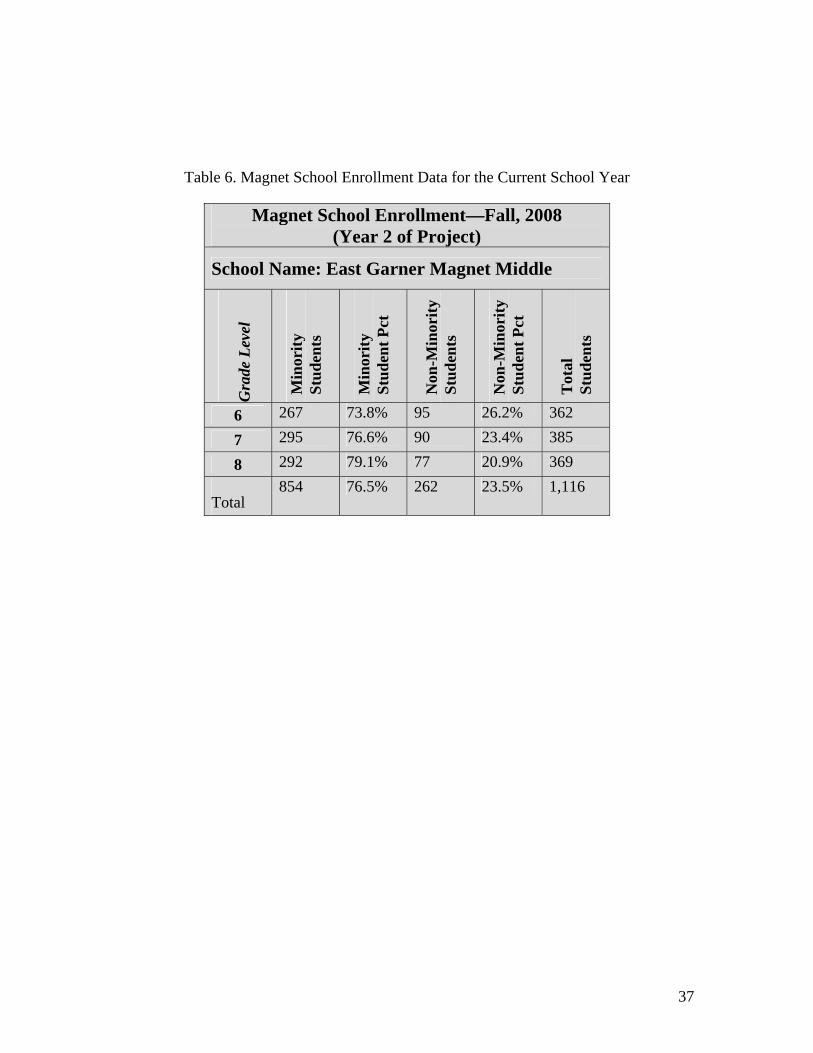
1.1.c East Garner Magnet Middle School: Minority student enrollment percentage for East Garner Magnet Middle School (EGMMS) will decrease from 76.8% to 70.5% for the school year 2008-09.
Program
787/1116 70.5% 854/1116 76.5%
Two of the three MSAP schools, Southeast Raleigh Magnet High School (SRMHS) and Garner Magnet High School (GMHS) saw their minority enrollment increase from school year (SY) 2007-08 (by 4.5 and 1.7 percentage points, respectively). East Garner Magnet Middle School (EGMMS) saw a reduction in minority enrollment by 0.3% from SY 2007-08, but did not meet the target minority enrollment of 70.5%. Much of the schools’ enrollment demographics are strongly driven by the WCPSS districting and assignment policies (see Section C), but steps are being taken to recruit students to MSAP schools, which should reduce minority group isolation. The MSAP recruiter specifically targeted schools with low minority group isolation to send flyer invitations and direct mailings for specific school events. Additionally, the recruiter worked with Administration and the Growth and Planning department to identify specific families and potential magnet students. The Magnet Programs staff also worked with Growth and Planning and school principals to provide input on student assignment plans. This afforded the schools the opportunity to draw from new areas of the county as well as open up more magnet seats by moving some base nodes out of the school assignment area. As the grant continues, and magnet staff are able to observe which
6
marketing and recruiting strategies are most effective at reducing minority group isolation, it is expected that applicant pools will reflect this shift, eventually leading to a reduction in minority group isolation at the school level. As it stands currently, admitted students from magnet recruitment make up a small portion of the entire student body, making student assignment the major force behind minority group enrollment at the MSAP schools.
Applicant Pool Nonminority Proportion
Target Actual 2008-09 Performance Data
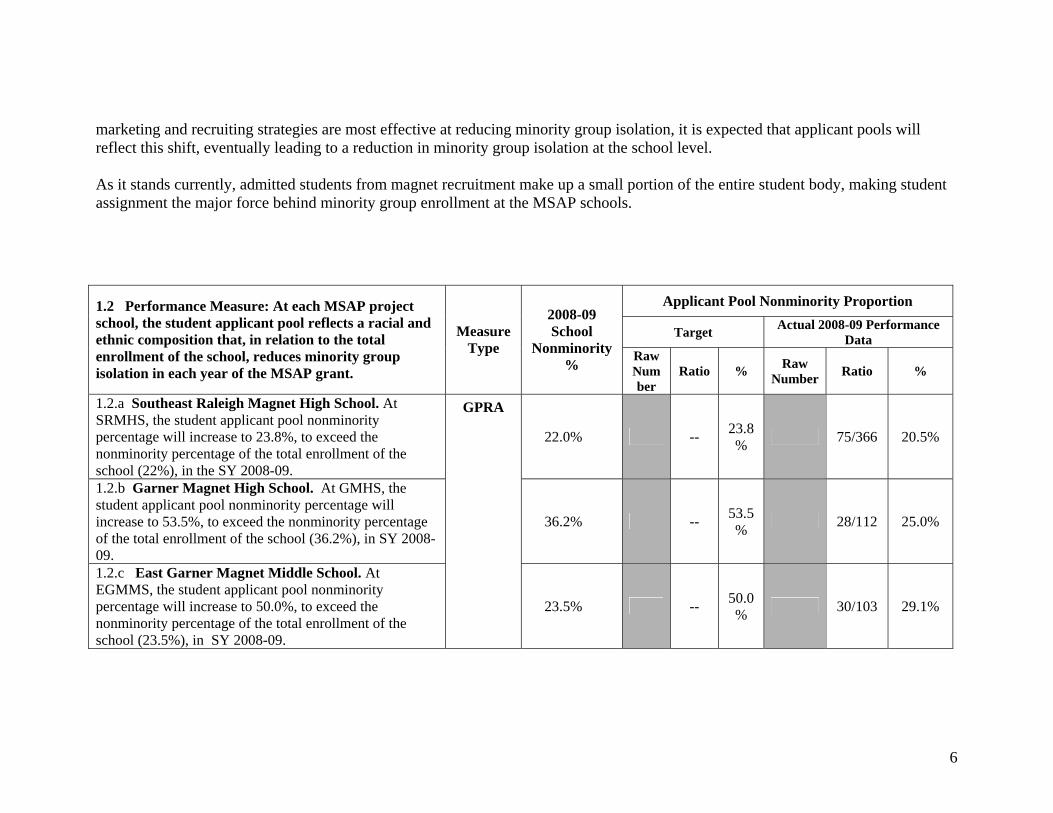
1.2 Performance Measure: At each MSAP project school, the student applicant pool reflects a racial and ethnic composition that, in relation to the total enrollment of the school, reduces minority group isolation in each year of the MSAP grant.
Measure Type
2008-09 School
Nonminority % Raw
Number
Ratio % Raw Number Ratio %
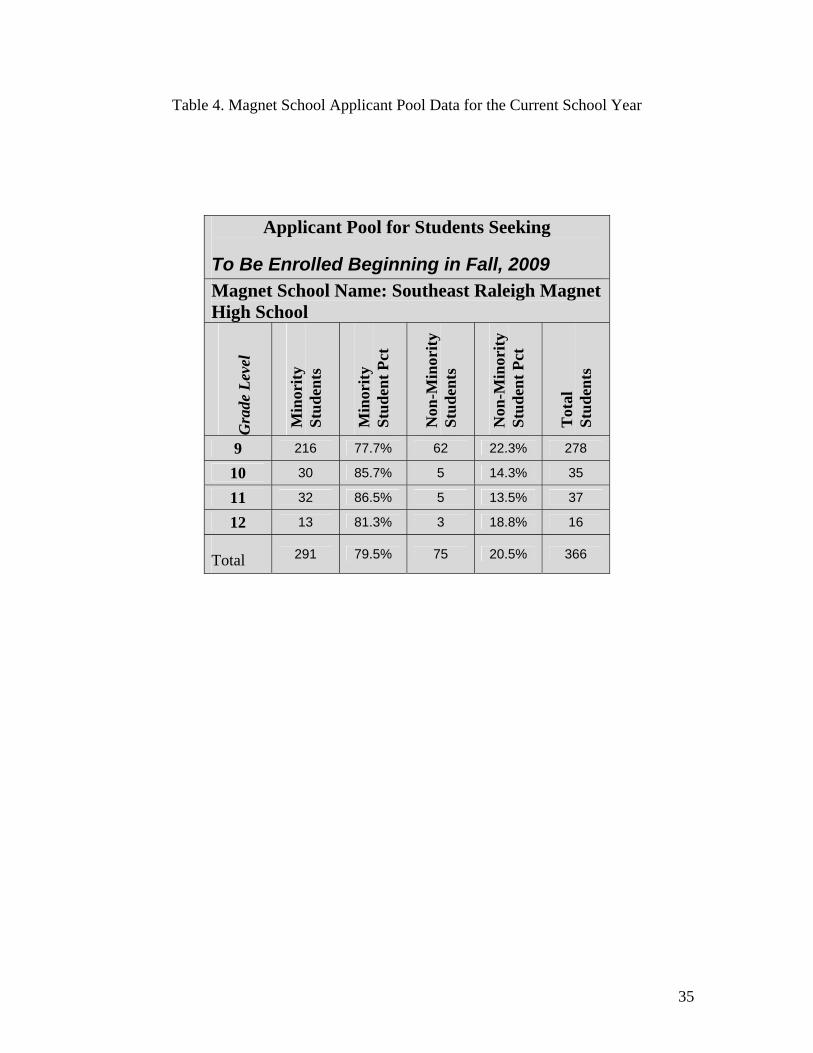
1.2.a Southeast Raleigh Magnet High School. At SRMHS, the student applicant pool nonminority percentage will increase to 23.8%, to exceed the nonminority percentage of the total enrollment of the school (22%), in the SY 2008-09.
22.0% -- 23.8% 75/366 20.5%
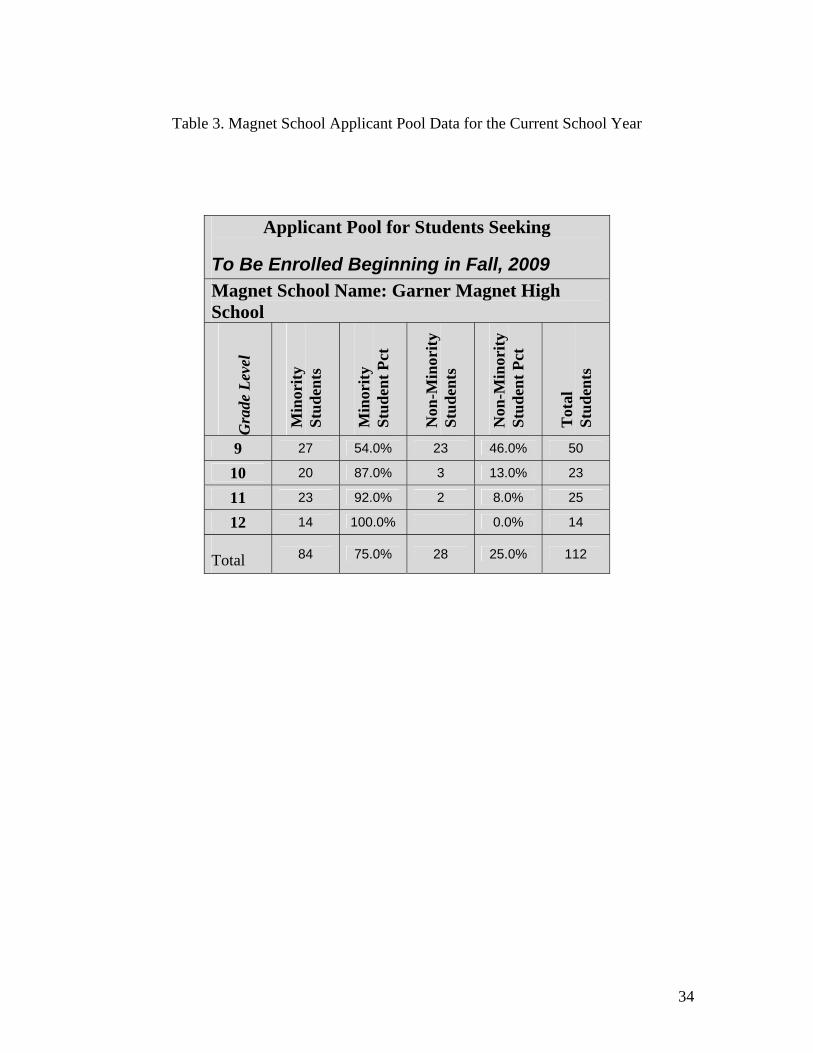
1.2.b Garner Magnet High School. At GMHS, the student applicant pool nonminority percentage will increase to 53.5%, to exceed the nonminority percentage of the total enrollment of the school (36.2%), in SY 2008-09.
36.2% -- 53.5% 28/112 25.0%
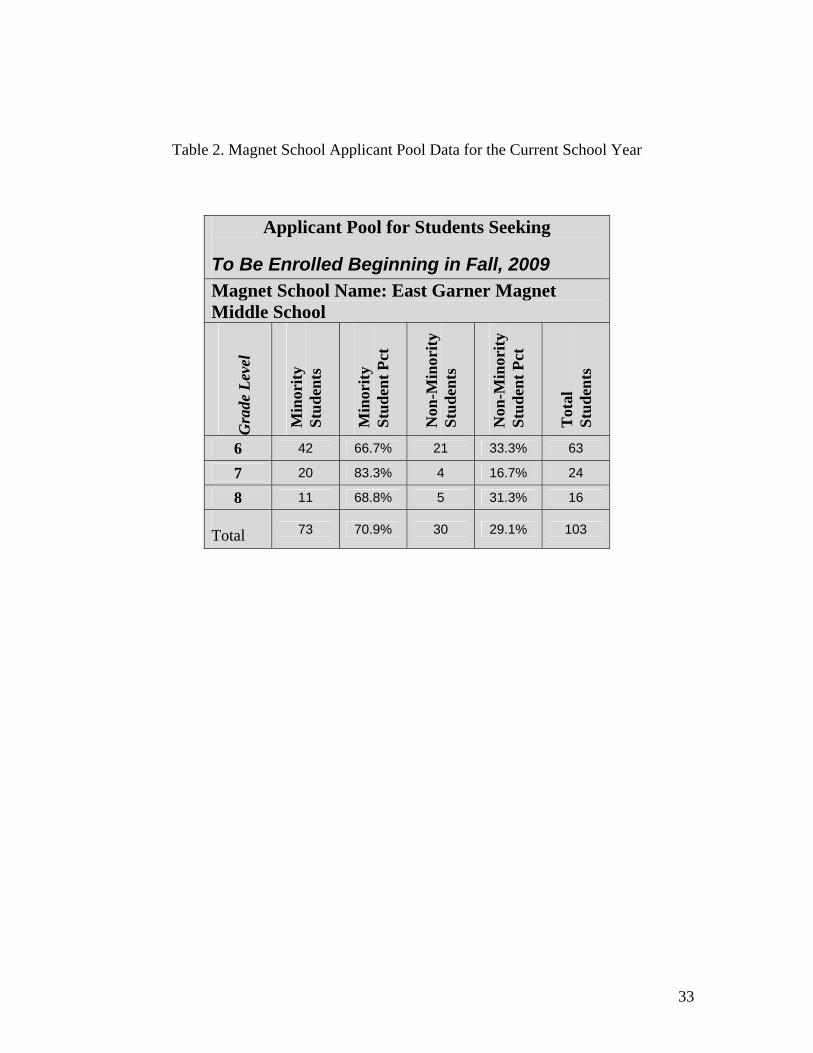
1.2.c East Garner Magnet Middle School. At EGMMS, the student applicant pool nonminority percentage will increase to 50.0%, to exceed the nonminority percentage of the total enrollment of the school (23.5%), in SY 2008-09.
GPRA
23.5% -- 50.0% 30/103 29.1%
7
None of the three schools met their target for applicant nonminority percentage, but EGMMS did receive an applicant pool ratio of 29.1%, which is greater than the school nonminority percentage of 23.5%, aiding in reduction of minority group isolation. According to focus group results conducted with faculty members, each school has unique difficulties in attracting a diverse applicant pool. At GMHS, plans to renovate older arts facilities were changed by the county in light of a bond proposal to build a new structure for the school. It was learned later that the issue will not be voted on, and GMHS will be both without a new building and without substantial renovation to arts facilities. Faculty believe that the condition of some of the facilities has a negative impact on recruiting students to an IB school with a cultural arts emphasis. At SRMHS, faculty and staff believe that there exists a negative public perception around the location and racial balance of the school that negatively affects recruitment efforts. For both GMHS and SRMHS, discussions are currently being held between school-level faculty and staff and MSAP staff about how to increase magnet theme sustainability, a large part of which is overcoming obstacles in recruitment. The following is a sample of recruiting strategies used in SY 2008-2009 that were aimed at recruiting a healthy applicant pool at the three MSAP schools:
• Growth and Planning worked with MSAP to identify top five target schools for recruitment for each MSAP school. Students at each of the five schools were sent flyer invitations to attend an information session. This included nearly 3,000 students invited to learn about their option to attend the schools
• Postcards were sent to additional healthy target areas to invite students and families to the three MSAP schools for Open Houses and Pathway Nights.
• Websites were revamped at two of the three schools to better showcase school and magnet themes. • Targeted notices in the local newspaper invited families to open houses.
8
Target and Actual Increase Ratio Target Actual Performance Data
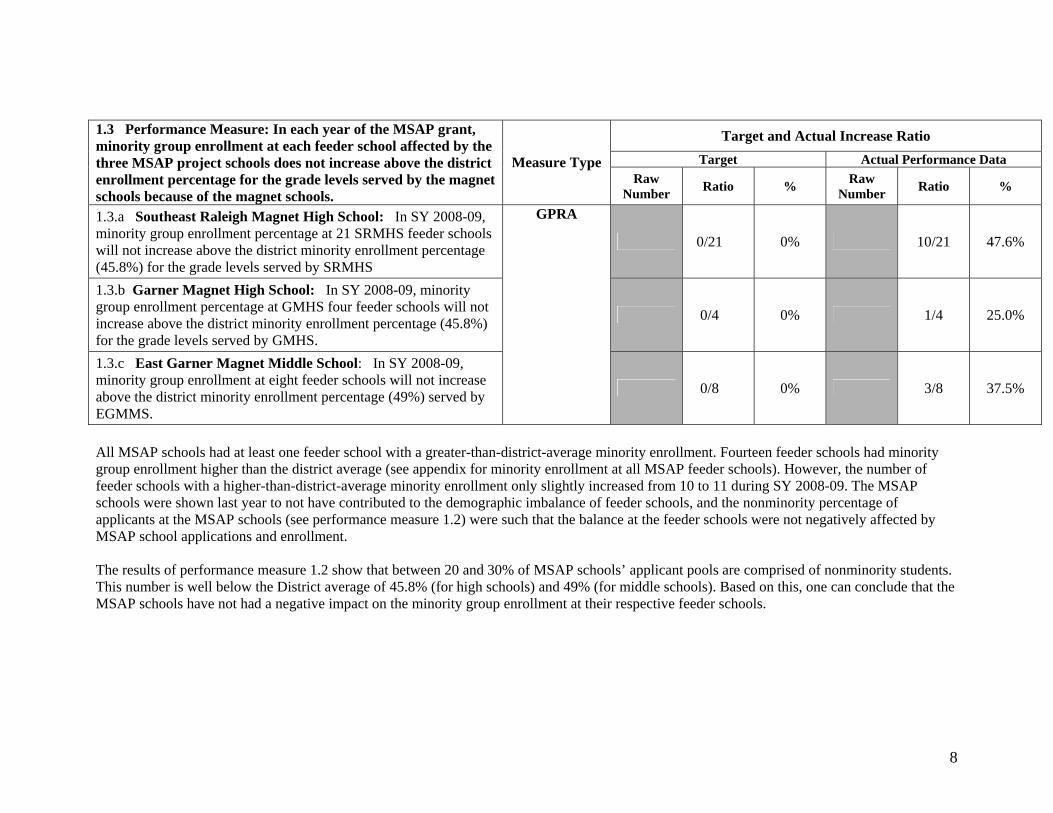
1.3 Performance Measure: In each year of the MSAP grant, minority group enrollment at each feeder school affected by the three MSAP project schools does not increase above the district enrollment percentage for the grade levels served by the magnet schools because of the magnet schools.
Measure Type Raw
Number Ratio % Raw Number Ratio %
1.3.a Southeast Raleigh Magnet High School: In SY 2008-09, minority group enrollment percentage at 21 SRMHS feeder schools will not increase above the district minority enrollment percentage (45.8%) for the grade levels served by SRMHS
0/21 0% 10/21 47.6%
1.3.b Garner Magnet High School: In SY 2008-09, minority group enrollment percentage at GMHS four feeder schools will not increase above the district minority enrollment percentage (45.8%) for the grade levels served by GMHS.
0/4 0% 1/4 25.0%
1.3.c East Garner Magnet Middle School: In SY 2008-09, minority group enrollment at eight feeder schools will not increase above the district minority enrollment percentage (49%) served by EGMMS.
GPRA
0/8 0% 3/8 37.5%
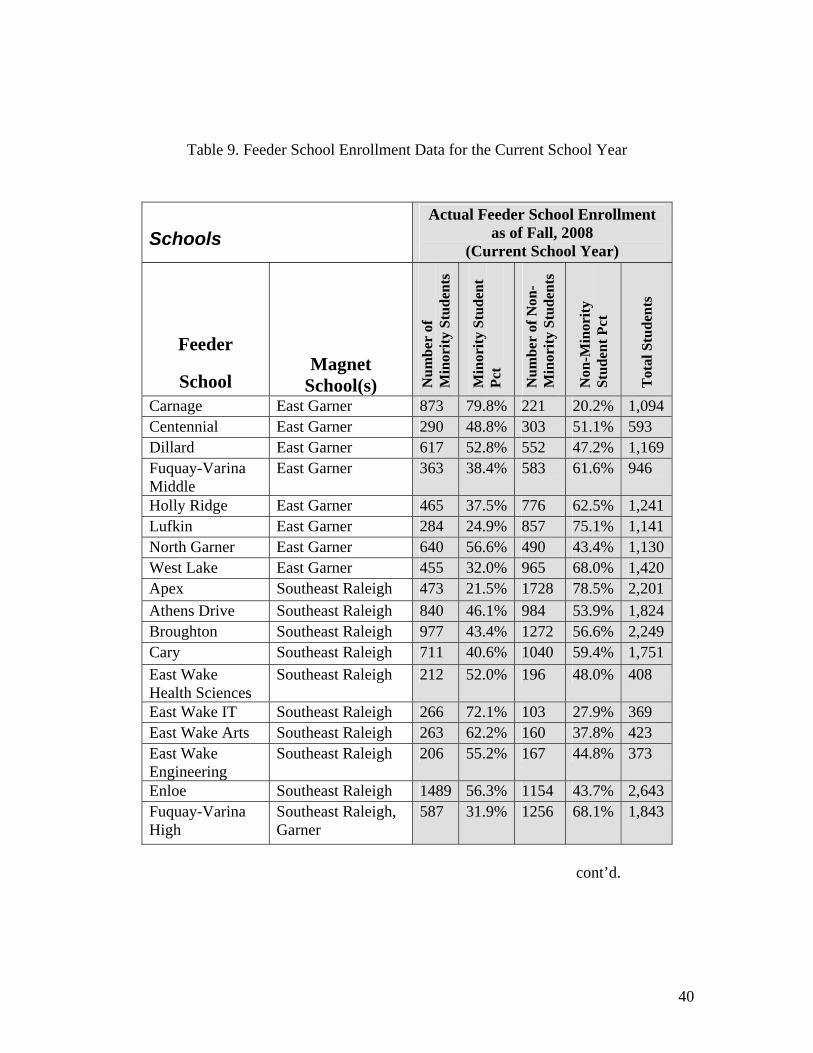
All MSAP schools had at least one feeder school with a greater-than-district-average minority enrollment. Fourteen feeder schools had minority group enrollment higher than the district average (see appendix for minority enrollment at all MSAP feeder schools). However, the number of feeder schools with a higher-than-district-average minority enrollment only slightly increased from 10 to 11 during SY 2008-09. The MSAP schools were shown last year to not have contributed to the demographic imbalance of feeder schools, and the nonminority percentage of applicants at the MSAP schools (see performance measure 1.2) were such that the balance at the feeder schools were not negatively affected by MSAP school applications and enrollment. The results of performance measure 1.2 show that between 20 and 30% of MSAP schools’ applicant pools are comprised of nonminority students. This number is well below the District average of 45.8% (for high schools) and 49% (for middle schools). Based on this, one can conclude that the MSAP schools have not had a negative impact on the minority group enrollment at their respective feeder schools.
9
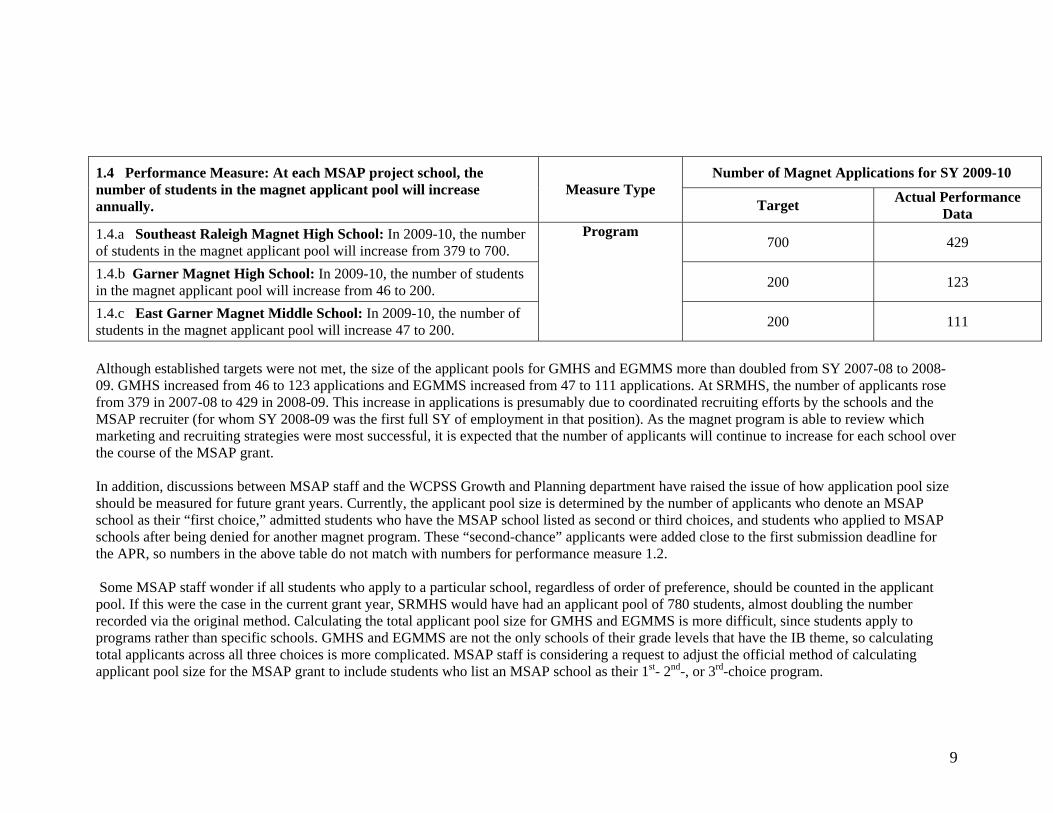
Number of Magnet Applications for SY 2009-10 1.4 Performance Measure: At each MSAP project school, the number of students in the magnet applicant pool will increase annually.
Measure Type Target Actual Performance
Data 1.4.a Southeast Raleigh Magnet High School: In 2009-10, the number of students in the magnet applicant pool will increase from 379 to 700. 700 429
1.4.b Garner Magnet High School: In 2009-10, the number of students in the magnet applicant pool will increase from 46 to 200. 200 123
1.4.c East Garner Magnet Middle School: In 2009-10, the number of students in the magnet applicant pool will increase 47 to 200.
Program
200 111
Although established targets were not met, the size of the applicant pools for GMHS and EGMMS more than doubled from SY 2007-08 to 2008-09. GMHS increased from 46 to 123 applications and EGMMS increased from 47 to 111 applications. At SRMHS, the number of applicants rose from 379 in 2007-08 to 429 in 2008-09. This increase in applications is presumably due to coordinated recruiting efforts by the schools and the MSAP recruiter (for whom SY 2008-09 was the first full SY of employment in that position). As the magnet program is able to review which marketing and recruiting strategies were most successful, it is expected that the number of applicants will continue to increase for each school over the course of the MSAP grant. In addition, discussions between MSAP staff and the WCPSS Growth and Planning department have raised the issue of how application pool size should be measured for future grant years. Currently, the applicant pool size is determined by the number of applicants who denote an MSAP school as their “first choice,” admitted students who have the MSAP school listed as second or third choices, and students who applied to MSAP schools after being denied for another magnet program. These “second-chance” applicants were added close to the first submission deadline for the APR, so numbers in the above table do not match with numbers for performance measure 1.2. Some MSAP staff wonder if all students who apply to a particular school, regardless of order of preference, should be counted in the applicant pool. If this were the case in the current grant year, SRMHS would have had an applicant pool of 780 students, almost doubling the number recorded via the original method. Calculating the total applicant pool size for GMHS and EGMMS is more difficult, since students apply to programs rather than specific schools. GMHS and EGMMS are not the only schools of their grade levels that have the IB theme, so calculating total applicants across all three choices is more complicated. MSAP staff is considering a request to adjust the official method of calculating applicant pool size for the MSAP grant to include students who list an MSAP school as their 1st- 2nd-, or 3rd-choice program.
10
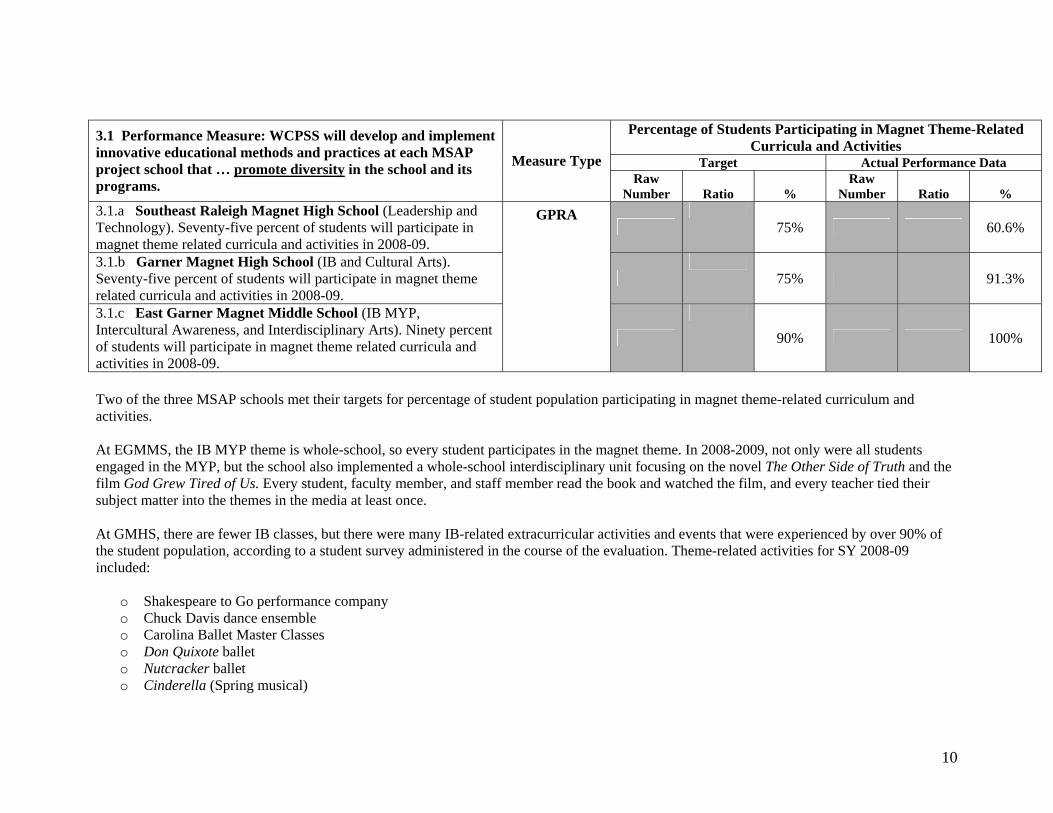
Percentage of Students Participating in Magnet Theme-Related Curricula and Activities
Target Actual Performance Data
3.1 Performance Measure: WCPSS will develop and implement innovative educational methods and practices at each MSAP project school that … promote diversity in the school and its programs.
Measure Type Raw
Number Ratio % Raw
Number Ratio % 3.1.a Southeast Raleigh Magnet High School (Leadership and Technology). Seventy-five percent of students will participate in magnet theme related curricula and activities in 2008-09.
75% 60.6%
3.1.b Garner Magnet High School (IB and Cultural Arts). Seventy-five percent of students will participate in magnet theme related curricula and activities in 2008-09.
75% 91.3%
3.1.c East Garner Magnet Middle School (IB MYP, Intercultural Awareness, and Interdisciplinary Arts). Ninety percent of students will participate in magnet theme related curricula and activities in 2008-09.
GPRA
90% 100%
Two of the three MSAP schools met their targets for percentage of student population participating in magnet theme-related curriculum and activities. At EGMMS, the IB MYP theme is whole-school, so every student participates in the magnet theme. In 2008-2009, not only were all students engaged in the MYP, but the school also implemented a whole-school interdisciplinary unit focusing on the novel The Other Side of Truth and the film God Grew Tired of Us. Every student, faculty member, and staff member read the book and watched the film, and every teacher tied their subject matter into the themes in the media at least once. At GMHS, there are fewer IB classes, but there were many IB-related extracurricular activities and events that were experienced by over 90% of the student population, according to a student survey administered in the course of the evaluation. Theme-related activities for SY 2008-09 included:
o Shakespeare to Go performance company o Chuck Davis dance ensemble o Carolina Ballet Master Classes o Don Quixote ballet o Nutcracker ballet o Cinderella (Spring musical)
11
o Stomp at War Memorial Auditorium o Enhanced cultural arts themes in Band (marching or concert) o Dance Team o Color guard o Winter guard o Pit orchestra o International Festival o Day of Dance
At SRMHS, a majority of students participated in magnet theme curriculum, but not enough to meet the target of 75%. This number is expected to grow as the New Tech Foundation (NTF) program is expanded to include 10th grade, as more magnet classes are added to the curriculum, and as the 180o leadership program is expanded. The following is a list of examples of efforts by SRMHS staff in SY 2008-09 to provide choice in curriculum for all students:
o Offered three new sections of Freshman Communication/Tech (combined Social Studies and English) as NTF classes. Offered two sections of math, two sections of science and one section of Freshman Healthful Living as iSchool classes. All sections using NTF-trained teachers
o Offering 8-10 additional sections of core-subject and elective classes for 2009-2010 available for all students due to retrofitting of
five additional classrooms and conversion into iSchool “workspaces” and the summer training of eight more teachers with NTF
o Reintroduced the M.O.S.A.I.C. (Making Our School An Inclusive Community) class
o Significantly enhanced the Bulldog Mentor Program for students (Student Services-led and all volunteer) and started the Interclub Council (leaders from all school clubs and organizations) to enhance leadership opportunities and offer more student autonomy in school decision making processes
o Offered new upper-level sections of magnet Broadcasting/Non-linear Video classes due to popularity of program
o Offered new course opportunities for students in science (Forensics Level II), engineering and technology (Project Lead the Way
courses – Digital Electronics, Introduction to Engineering Design, Engineering Design, Aerospace Engineering, Civil Engineering and Architecture), fine and performing arts (Digital Music), and magnet-themed leadership (the 180o Program, Civil Air Patrol)
12
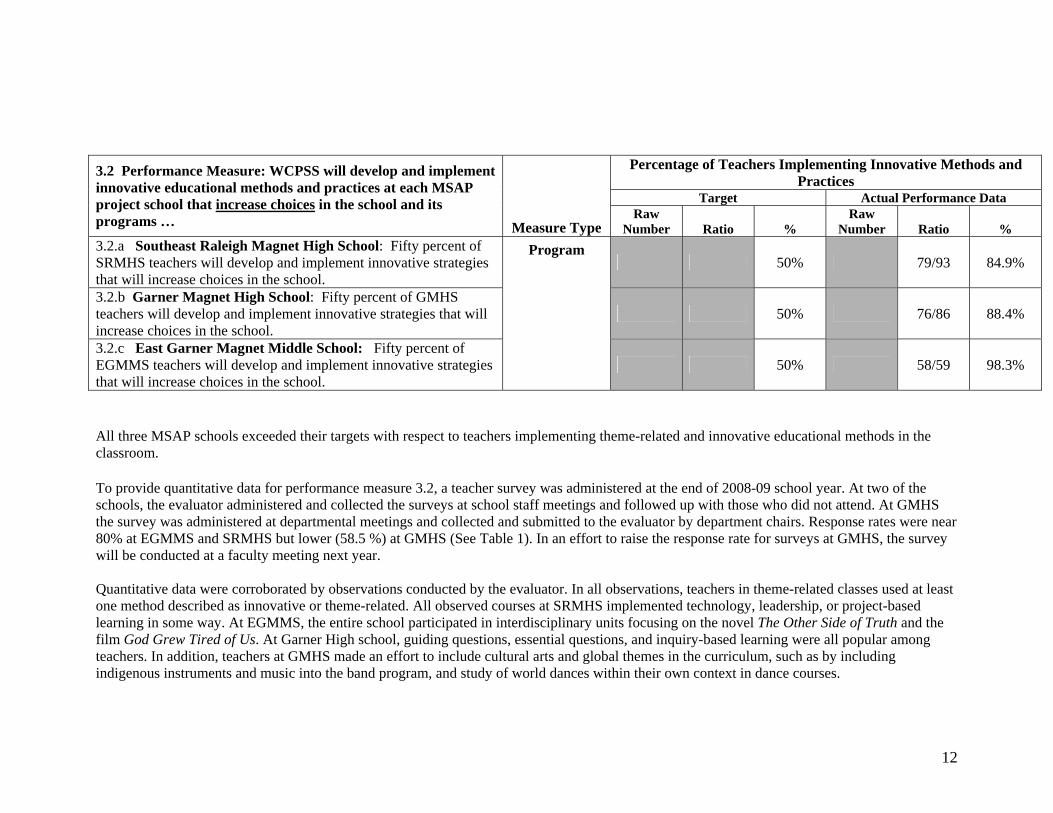
Percentage of Teachers Implementing Innovative Methods and Practices
Target Actual Performance Data
3.2 Performance Measure: WCPSS will develop and implement innovative educational methods and practices at each MSAP project school that increase choices in the school and its programs … Measure Type
Raw Number Ratio %
Raw Number Ratio %
3.2.a Southeast Raleigh Magnet High School: Fifty percent of SRMHS teachers will develop and implement innovative strategies that will increase choices in the school.
50% 79/93 84.9%
3.2.b Garner Magnet High School: Fifty percent of GMHS teachers will develop and implement innovative strategies that will increase choices in the school.
50% 76/86 88.4%
3.2.c East Garner Magnet Middle School: Fifty percent of EGMMS teachers will develop and implement innovative strategies that will increase choices in the school.
Program
50% 58/59 98.3%
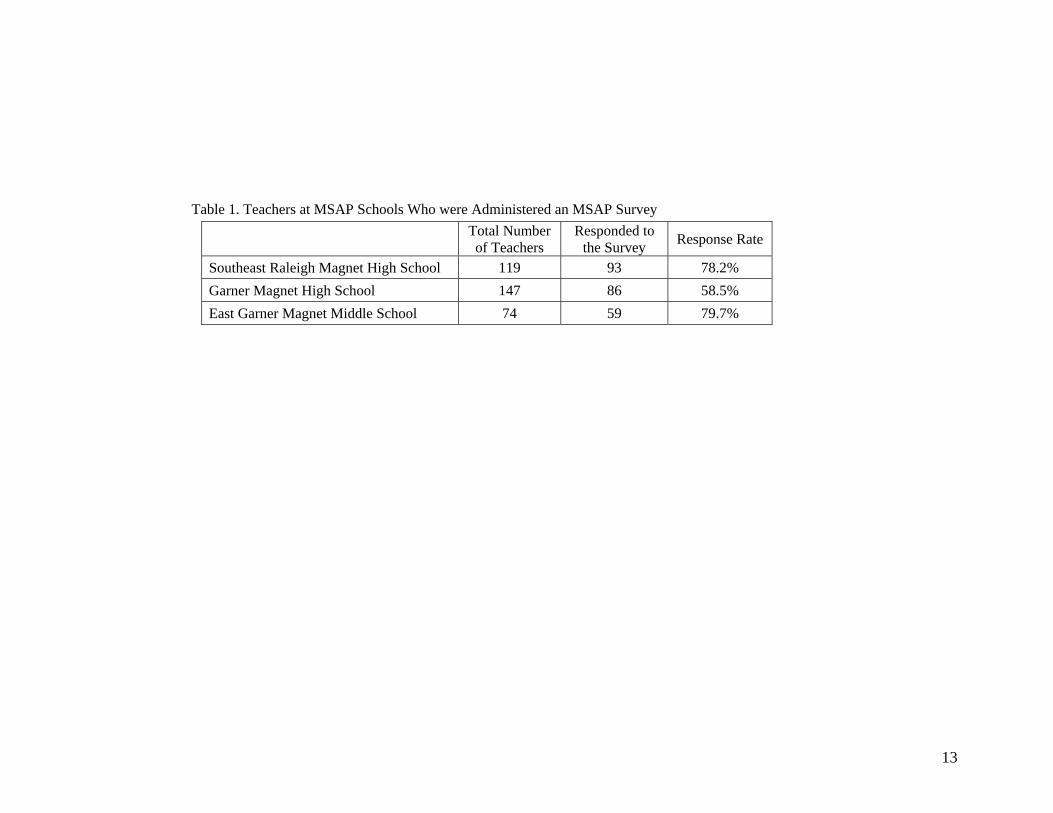
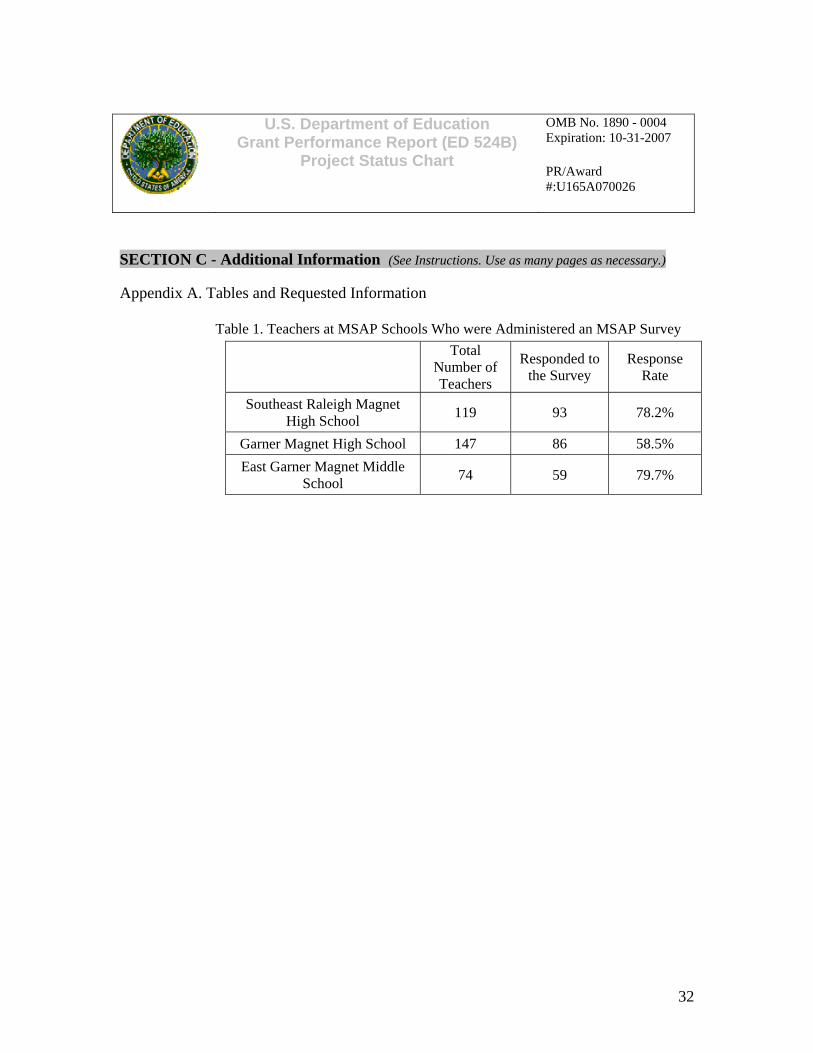
All three MSAP schools exceeded their targets with respect to teachers implementing theme-related and innovative educational methods in the classroom. To provide quantitative data for performance measure 3.2, a teacher survey was administered at the end of 2008-09 school year. At two of the schools, the evaluator administered and collected the surveys at school staff meetings and followed up with those who did not attend. At GMHS the survey was administered at departmental meetings and collected and submitted to the evaluator by department chairs. Response rates were near 80% at EGMMS and SRMHS but lower (58.5 %) at GMHS (See Table 1). In an effort to raise the response rate for surveys at GMHS, the survey will be conducted at a faculty meeting next year. Quantitative data were corroborated by observations conducted by the evaluator. In all observations, teachers in theme-related classes used at least one method described as innovative or theme-related. All observed courses at SRMHS implemented technology, leadership, or project-based learning in some way. At EGMMS, the entire school participated in interdisciplinary units focusing on the novel The Other Side of Truth and the film God Grew Tired of Us. At Garner High school, guiding questions, essential questions, and inquiry-based learning were all popular among teachers. In addition, teachers at GMHS made an effort to include cultural arts and global themes in the curriculum, such as by including indigenous instruments and music into the band program, and study of world dances within their own context in dance courses.
13
Table 1. Teachers at MSAP Schools Who were Administered an MSAP Survey
Total Number of Teachers
Responded to the Survey Response Rate
Southeast Raleigh Magnet High School 119 93 78.2% Garner Magnet High School 147 86 58.5% East Garner Magnet Middle School 74 59 79.7%
14
Schools Continuing Magnet Program and Meeting State Standards in 2012-13 School Year
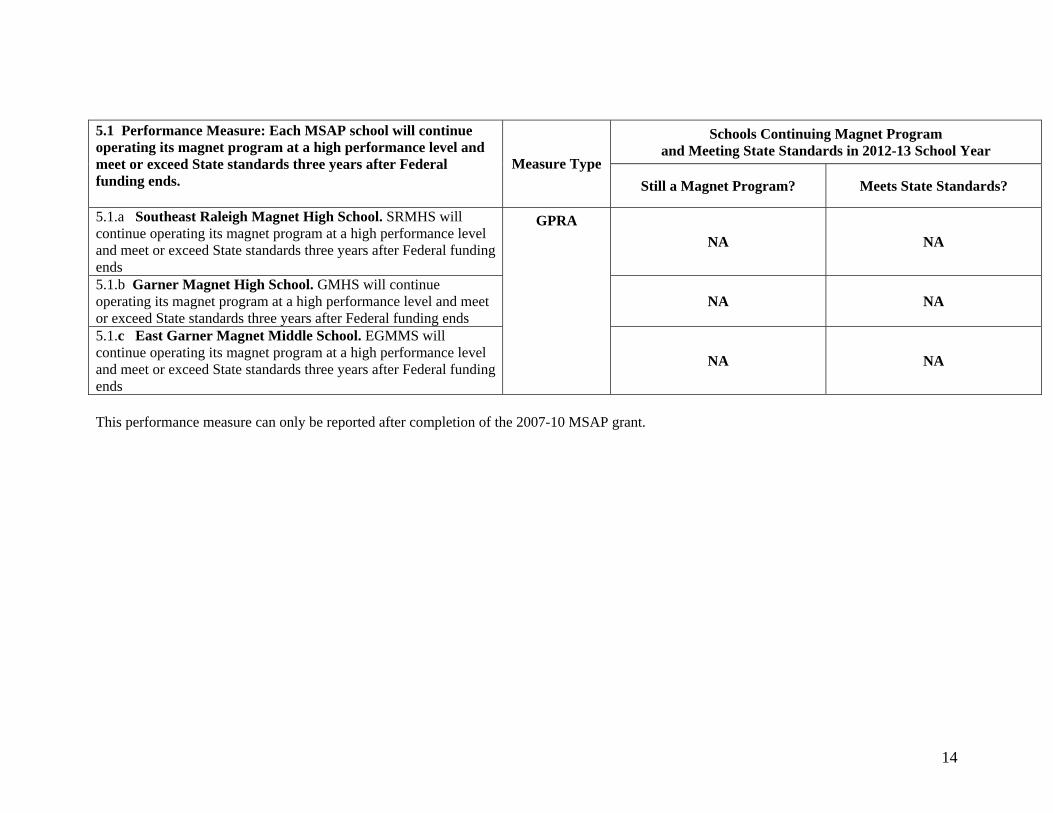
5.1 Performance Measure: Each MSAP school will continue operating its magnet program at a high performance level and meet or exceed State standards three years after Federal funding ends.
Measure Type Still a Magnet Program? Meets State Standards?
5.1.a Southeast Raleigh Magnet High School. SRMHS will continue operating its magnet program at a high performance level and meet or exceed State standards three years after Federal funding ends
NA NA
5.1.b Garner Magnet High School. GMHS will continue operating its magnet program at a high performance level and meet or exceed State standards three years after Federal funding ends
NA NA
5.1.c East Garner Magnet Middle School. EGMMS will continue operating its magnet program at a high performance level and meet or exceed State standards three years after Federal funding ends
GPRA
NA NA
This performance measure can only be reported after completion of the 2007-10 MSAP grant.
15
% of Teachers Using Strategies or Adding Content Learned from
Magnet-Related Professional Development Actual Performance Data
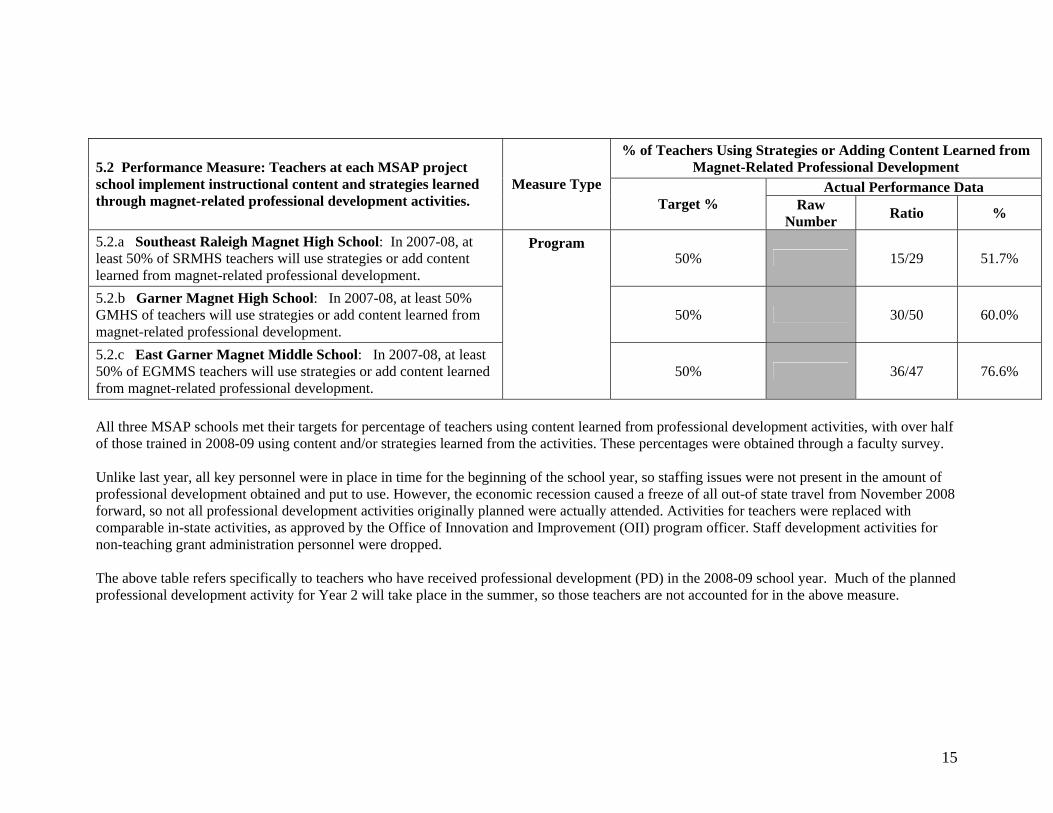
5.2 Performance Measure: Teachers at each MSAP project school implement instructional content and strategies learned through magnet-related professional development activities.
Measure Type Target % Raw
Number Ratio %
5.2.a Southeast Raleigh Magnet High School: In 2007-08, at least 50% of SRMHS teachers will use strategies or add content learned from magnet-related professional development.
50% 15/29 51.7%
5.2.b Garner Magnet High School: In 2007-08, at least 50% GMHS of teachers will use strategies or add content learned from magnet-related professional development.
50% 30/50 60.0%
5.2.c East Garner Magnet Middle School: In 2007-08, at least 50% of EGMMS teachers will use strategies or add content learned from magnet-related professional development.
Program
50% 36/47 76.6%
All three MSAP schools met their targets for percentage of teachers using content learned from professional development activities, with over half of those trained in 2008-09 using content and/or strategies learned from the activities. These percentages were obtained through a faculty survey. Unlike last year, all key personnel were in place in time for the beginning of the school year, so staffing issues were not present in the amount of professional development obtained and put to use. However, the economic recession caused a freeze of all out-of state travel from November 2008 forward, so not all professional development activities originally planned were actually attended. Activities for teachers were replaced with comparable in-state activities, as approved by the Office of Innovation and Improvement (OII) program officer. Staff development activities for non-teaching grant administration personnel were dropped. The above table refers specifically to teachers who have received professional development (PD) in the 2008-09 school year. Much of the planned professional development activity for Year 2 will take place in the summer, so those teachers are not accounted for in the above measure.
16
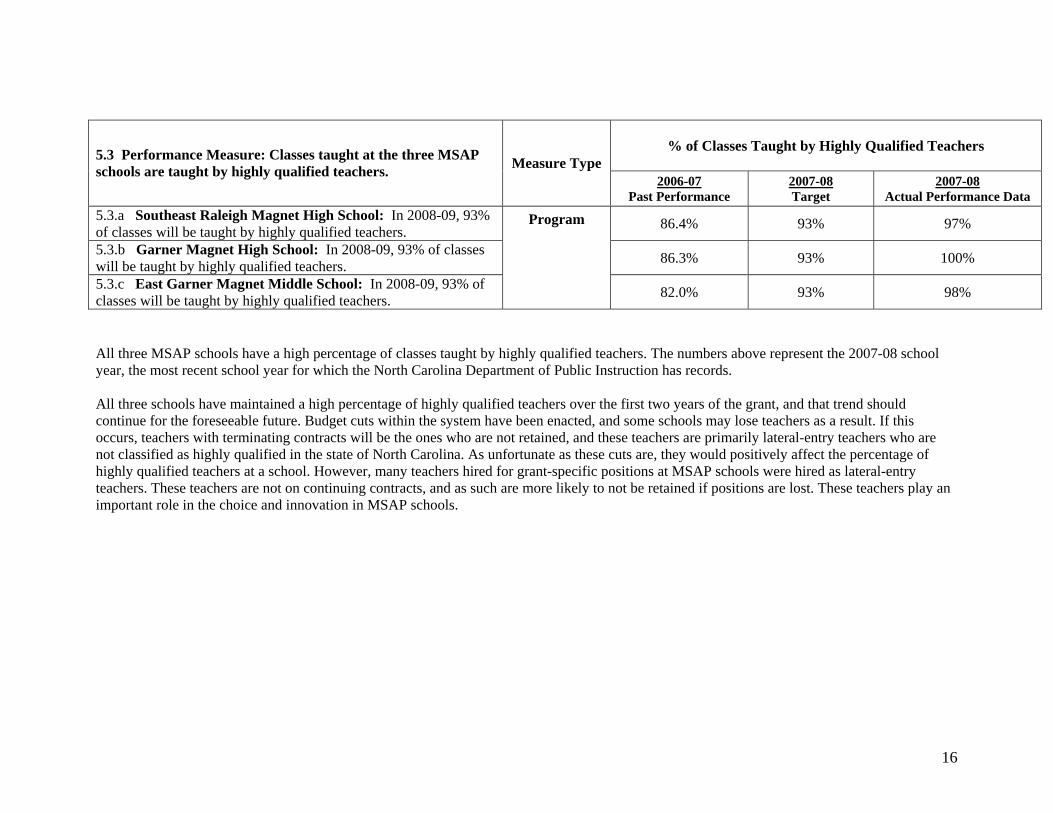
% of Classes Taught by Highly Qualified Teachers 5.3 Performance Measure: Classes taught at the three MSAP schools are taught by highly qualified teachers. Measure Type
2006-07 Past Performance
2007-08 Target
2007-08 Actual Performance Data
5.3.a Southeast Raleigh Magnet High School: In 2008-09, 93% of classes will be taught by highly qualified teachers. 86.4% 93% 97%
5.3.b Garner Magnet High School: In 2008-09, 93% of classes will be taught by highly qualified teachers. 86.3% 93% 100%
5.3.c East Garner Magnet Middle School: In 2008-09, 93% of classes will be taught by highly qualified teachers.
Program
82.0% 93% 98%
All three MSAP schools have a high percentage of classes taught by highly qualified teachers. The numbers above represent the 2007-08 school year, the most recent school year for which the North Carolina Department of Public Instruction has records. All three schools have maintained a high percentage of highly qualified teachers over the first two years of the grant, and that trend should continue for the foreseeable future. Budget cuts within the system have been enacted, and some schools may lose teachers as a result. If this occurs, teachers with terminating contracts will be the ones who are not retained, and these teachers are primarily lateral-entry teachers who are not classified as highly qualified in the state of North Carolina. As unfortunate as these cuts are, they would positively affect the percentage of highly qualified teachers at a school. However, many teachers hired for grant-specific positions at MSAP schools were hired as lateral-entry teachers. These teachers are not on continuing contracts, and as such are more likely to not be retained if positions are lost. These teachers play an important role in the choice and innovation in MSAP schools.
17
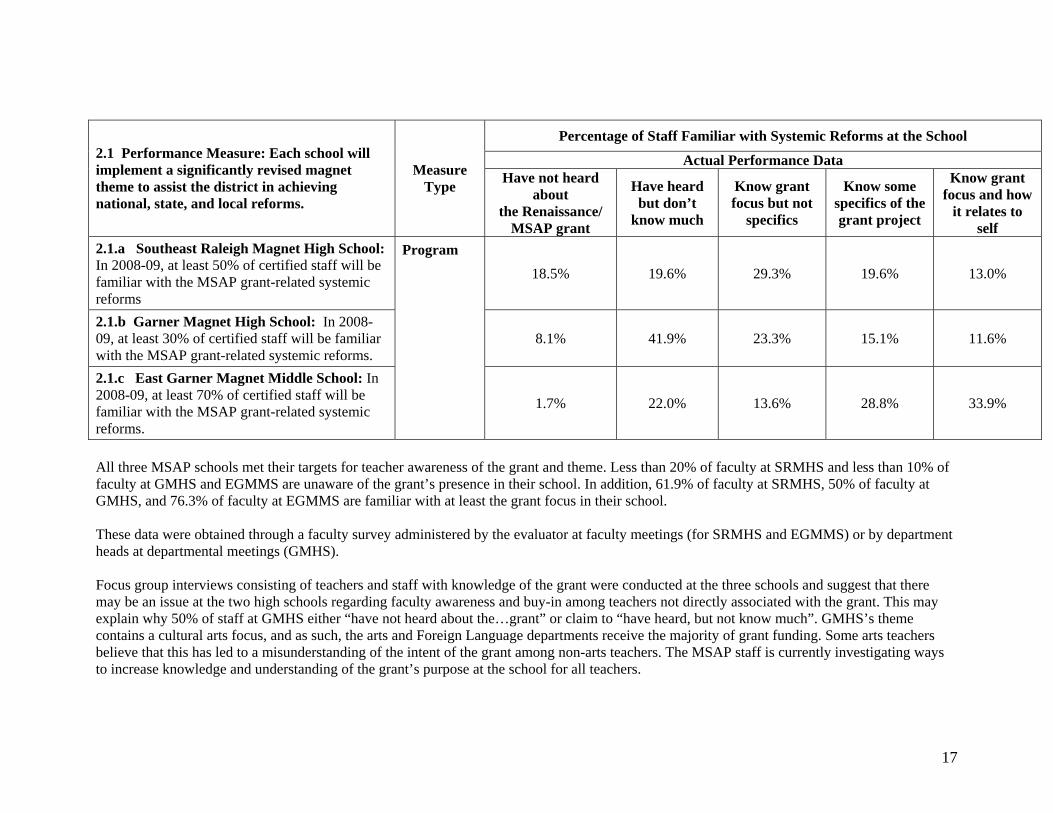
Percentage of Staff Familiar with Systemic Reforms at the School
Actual Performance Data 2.1 Performance Measure: Each school will implement a significantly revised magnet theme to assist the district in achieving national, state, and local reforms.
Measure Type Have not heard
about the Renaissance/
MSAP grant
Have heard but don’t
know much
Know grant focus but not
specifics
Know some specifics of the grant project
Know grant focus and how
it relates to self
2.1.a Southeast Raleigh Magnet High School: In 2008-09, at least 50% of certified staff will be familiar with the MSAP grant-related systemic reforms
18.5% 19.6% 29.3% 19.6% 13.0%
2.1.b Garner Magnet High School: In 2008-09, at least 30% of certified staff will be familiar with the MSAP grant-related systemic reforms.
8.1% 41.9% 23.3% 15.1% 11.6%
2.1.c East Garner Magnet Middle School: In 2008-09, at least 70% of certified staff will be familiar with the MSAP grant-related systemic reforms.
Program
1.7% 22.0% 13.6% 28.8% 33.9%
All three MSAP schools met their targets for teacher awareness of the grant and theme. Less than 20% of faculty at SRMHS and less than 10% of faculty at GMHS and EGMMS are unaware of the grant’s presence in their school. In addition, 61.9% of faculty at SRMHS, 50% of faculty at GMHS, and 76.3% of faculty at EGMMS are familiar with at least the grant focus in their school. These data were obtained through a faculty survey administered by the evaluator at faculty meetings (for SRMHS and EGMMS) or by department heads at departmental meetings (GMHS). Focus group interviews consisting of teachers and staff with knowledge of the grant were conducted at the three schools and suggest that there may be an issue at the two high schools regarding faculty awareness and buy-in among teachers not directly associated with the grant. This may explain why 50% of staff at GMHS either “have not heard about the…grant” or claim to “have heard, but not know much”. GMHS’s theme contains a cultural arts focus, and as such, the arts and Foreign Language departments receive the majority of grant funding. Some arts teachers believe that this has led to a misunderstanding of the intent of the grant among non-arts teachers. The MSAP staff is currently investigating ways to increase knowledge and understanding of the grant’s purpose at the school for all teachers.
18
At SRMHS, many of the same issues arose during the focus group session. Teachers directly involved with NTF curriculum and 180o leadership curriculum feel that other teachers may not understand or buy in to the theme of the grant as much as teachers who are directly involved. As with GMHS, MSAP staff is currently looking into ways to increase knowledge, understanding, and buy-in among all faculty.
19
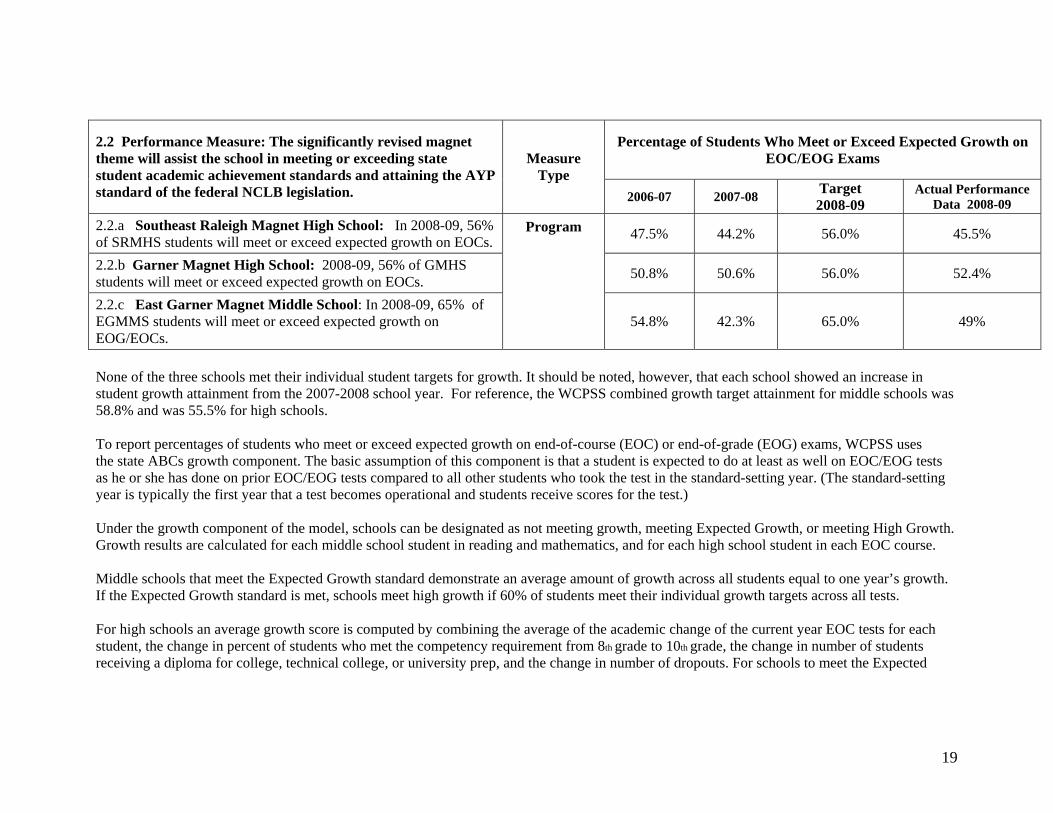
Percentage of Students Who Meet or Exceed Expected Growth on EOC/EOG Exams
2.2 Performance Measure: The significantly revised magnet theme will assist the school in meeting or exceeding state student academic achievement standards and attaining the AYP standard of the federal NCLB legislation.
Measure Type
2006-07 2007-08 Target 2008-09
Actual Performance Data 2008-09
2.2.a Southeast Raleigh Magnet High School: In 2008-09, 56% of SRMHS students will meet or exceed expected growth on EOCs. 47.5% 44.2% 56.0% 45.5%
2.2.b Garner Magnet High School: 2008-09, 56% of GMHS students will meet or exceed expected growth on EOCs. 50.8% 50.6% 56.0% 52.4%
2.2.c East Garner Magnet Middle School: In 2008-09, 65% of EGMMS students will meet or exceed expected growth on EOG/EOCs.
Program
54.8% 42.3% 65.0% 49%
None of the three schools met their individual student targets for growth. It should be noted, however, that each school showed an increase in student growth attainment from the 2007-2008 school year. For reference, the WCPSS combined growth target attainment for middle schools was 58.8% and was 55.5% for high schools. To report percentages of students who meet or exceed expected growth on end-of-course (EOC) or end-of-grade (EOG) exams, WCPSS uses the state ABCs growth component. The basic assumption of this component is that a student is expected to do at least as well on EOC/EOG tests as he or she has done on prior EOC/EOG tests compared to all other students who took the test in the standard-setting year. (The standard-setting year is typically the first year that a test becomes operational and students receive scores for the test.) Under the growth component of the model, schools can be designated as not meeting growth, meeting Expected Growth, or meeting High Growth. Growth results are calculated for each middle school student in reading and mathematics, and for each high school student in each EOC course. Middle schools that meet the Expected Growth standard demonstrate an average amount of growth across all students equal to one year’s growth. If the Expected Growth standard is met, schools meet high growth if 60% of students meet their individual growth targets across all tests. For high schools an average growth score is computed by combining the average of the academic change of the current year EOC tests for each student, the change in percent of students who met the competency requirement from 8th grade to 10th grade, the change in number of students receiving a diploma for college, technical college, or university prep, and the change in number of dropouts. For schools to meet the Expected
20
Growth Standard, the average growth across indicators has to be greater or equal to zero. If a high school meets expected growth, high growth is met if at least 60% of the students in the school meet their individual growth targets on their EOC tests.
21
New Curriculum Units Aligned with North Carolina Standard Course of Study
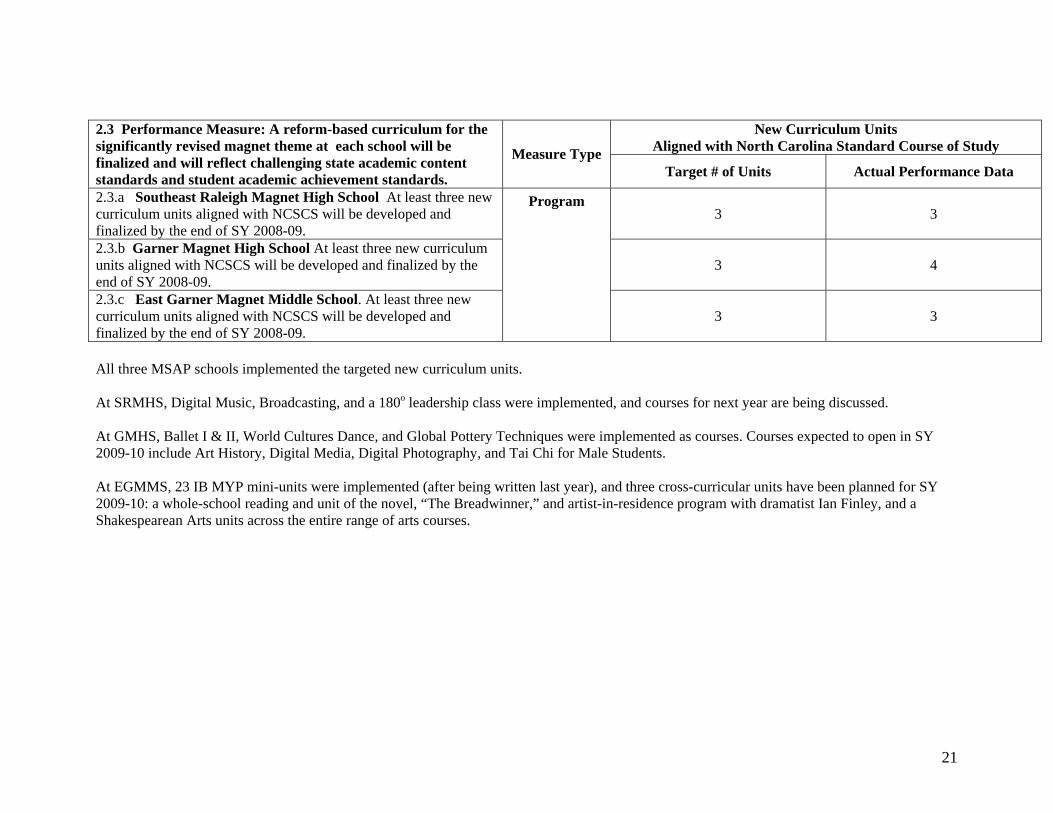
2.3 Performance Measure: A reform-based curriculum for the significantly revised magnet theme at each school will be finalized and will reflect challenging state academic content standards and student academic achievement standards.
Measure Type Target # of Units Actual Performance Data
2.3.a Southeast Raleigh Magnet High School At least three new curriculum units aligned with NCSCS will be developed and finalized by the end of SY 2008-09.
3 3
2.3.b Garner Magnet High School At least three new curriculum units aligned with NCSCS will be developed and finalized by the end of SY 2008-09.
3 4
2.3.c East Garner Magnet Middle School. At least three new curriculum units aligned with NCSCS will be developed and finalized by the end of SY 2008-09.
Program
3 3
All three MSAP schools implemented the targeted new curriculum units. At SRMHS, Digital Music, Broadcasting, and a 180o leadership class were implemented, and courses for next year are being discussed. At GMHS, Ballet I & II, World Cultures Dance, and Global Pottery Techniques were implemented as courses. Courses expected to open in SY 2009-10 include Art History, Digital Media, Digital Photography, and Tai Chi for Male Students. At EGMMS, 23 IB MYP mini-units were implemented (after being written last year), and three cross-curricular units have been planned for SY 2009-10: a whole-school reading and unit of the novel, “The Breadwinner,” and artist-in-residence program with dramatist Ian Finley, and a Shakespearean Arts units across the entire range of arts courses.
22
Schools Achieving AYP for All Racial/Ethnic Groups Past Performance Actual Performance Data
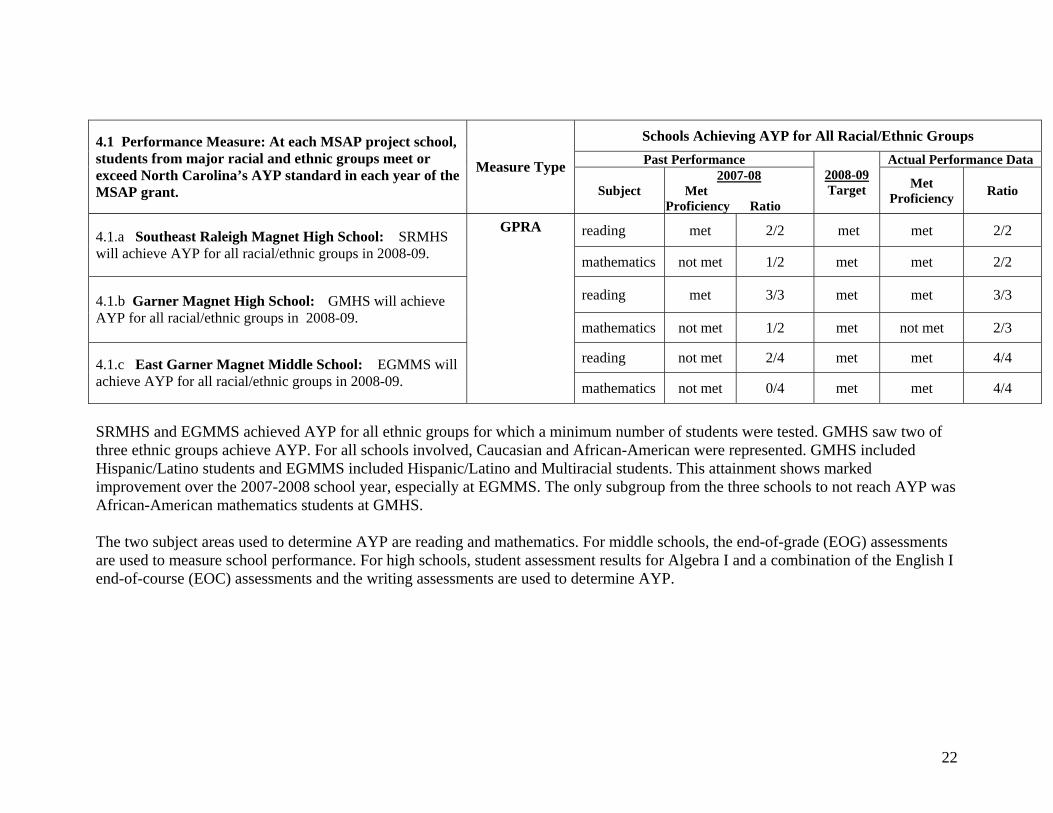
4.1 Performance Measure: At each MSAP project school, students from major racial and ethnic groups meet or exceed North Carolina’s AYP standard in each year of the MSAP grant.
Measure Type Subject
2007-08 Met
Proficiency Ratio
2008-09 Target Met
Proficiency Ratio
reading met 2/2 met met 2/2 4.1.a Southeast Raleigh Magnet High School: SRMHS will achieve AYP for all racial/ethnic groups in 2008-09. mathematics not met 1/2 met met 2/2
reading met 3/3 met met 3/3 4.1.b Garner Magnet High School: GMHS will achieve AYP for all racial/ethnic groups in 2008-09.
mathematics not met 1/2 met not met 2/3
reading not met 2/4 met met 4/4 4.1.c East Garner Magnet Middle School: EGMMS will achieve AYP for all racial/ethnic groups in 2008-09.
GPRA
mathematics not met 0/4 met met 4/4
SRMHS and EGMMS achieved AYP for all ethnic groups for which a minimum number of students were tested. GMHS saw two of three ethnic groups achieve AYP. For all schools involved, Caucasian and African-American were represented. GMHS included Hispanic/Latino students and EGMMS included Hispanic/Latino and Multiracial students. This attainment shows marked improvement over the 2007-2008 school year, especially at EGMMS. The only subgroup from the three schools to not reach AYP was African-American mathematics students at GMHS. The two subject areas used to determine AYP are reading and mathematics. For middle schools, the end-of-grade (EOG) assessments are used to measure school performance. For high schools, student assessment results for Algebra I and a combination of the English I end-of-course (EOC) assessments and the writing assessments are used to determine AYP.
23
AYP Achievement Past Performance Actual 2008-09 Performance Data
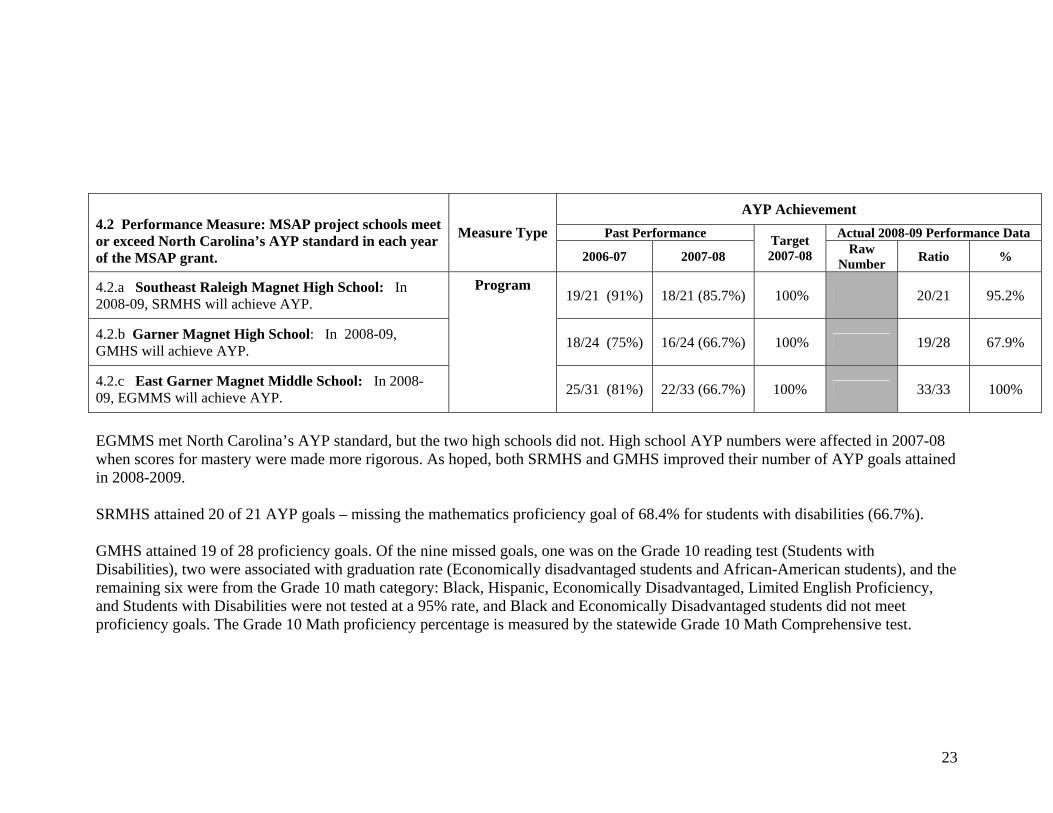
4.2 Performance Measure: MSAP project schools meet or exceed North Carolina’s AYP standard in each year of the MSAP grant.
Measure Type 2006-07 2007-08
Target 2007-08 Raw
Number Ratio %
4.2.a Southeast Raleigh Magnet High School: In 2008-09, SRMHS will achieve AYP. 19/21 (91%) 18/21 (85.7%) 100% 20/21 95.2%
4.2.b Garner Magnet High School: In 2008-09, GMHS will achieve AYP. 18/24 (75%) 16/24 (66.7%) 100% 19/28 67.9%
4.2.c East Garner Magnet Middle School: In 2008-09, EGMMS will achieve AYP.
Program
25/31 (81%) 22/33 (66.7%) 100% 33/33 100%
EGMMS met North Carolina’s AYP standard, but the two high schools did not. High school AYP numbers were affected in 2007-08 when scores for mastery were made more rigorous. As hoped, both SRMHS and GMHS improved their number of AYP goals attained in 2008-2009. SRMHS attained 20 of 21 AYP goals – missing the mathematics proficiency goal of 68.4% for students with disabilities (66.7%). GMHS attained 19 of 28 proficiency goals. Of the nine missed goals, one was on the Grade 10 reading test (Students with Disabilities), two were associated with graduation rate (Economically disadvantaged students and African-American students), and the remaining six were from the Grade 10 math category: Black, Hispanic, Economically Disadvantaged, Limited English Proficiency, and Students with Disabilities were not tested at a 95% rate, and Black and Economically Disadvantaged students did not meet proficiency goals. The Grade 10 Math proficiency percentage is measured by the statewide Grade 10 Math Comprehensive test.
24
Annual School Performance Composites
% of EOC/EOG Exams in Core Subjects at/above Proficiency Past Performance Actual
Performance Data
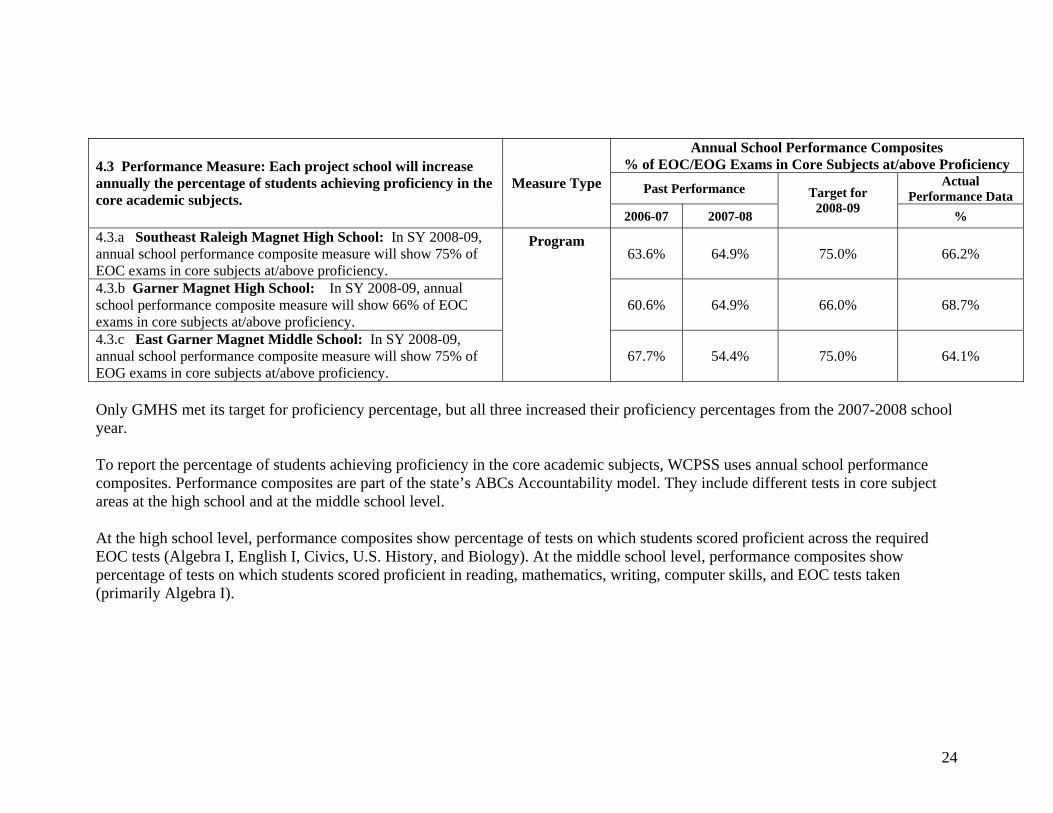
4.3 Performance Measure: Each project school will increase annually the percentage of students achieving proficiency in the core academic subjects.
Measure Type
2006-07 2007-08
Target for 2008-09 %
4.3.a Southeast Raleigh Magnet High School: In SY 2008-09, annual school performance composite measure will show 75% of EOC exams in core subjects at/above proficiency.
63.6% 64.9% 75.0% 66.2%
4.3.b Garner Magnet High School: In SY 2008-09, annual school performance composite measure will show 66% of EOC exams in core subjects at/above proficiency.
60.6% 64.9% 66.0% 68.7%
4.3.c East Garner Magnet Middle School: In SY 2008-09, annual school performance composite measure will show 75% of EOG exams in core subjects at/above proficiency.
Program
67.7% 54.4% 75.0% 64.1%
Only GMHS met its target for proficiency percentage, but all three increased their proficiency percentages from the 2007-2008 school year. To report the percentage of students achieving proficiency in the core academic subjects, WCPSS uses annual school performance composites. Performance composites are part of the state’s ABCs Accountability model. They include different tests in core subject areas at the high school and at the middle school level. At the high school level, performance composites show percentage of tests on which students scored proficient across the required EOC tests (Algebra I, English I, Civics, U.S. History, and Biology). At the middle school level, performance composites show percentage of tests on which students scored proficient in reading, mathematics, writing, computer skills, and EOC tests taken (primarily Algebra I).
25
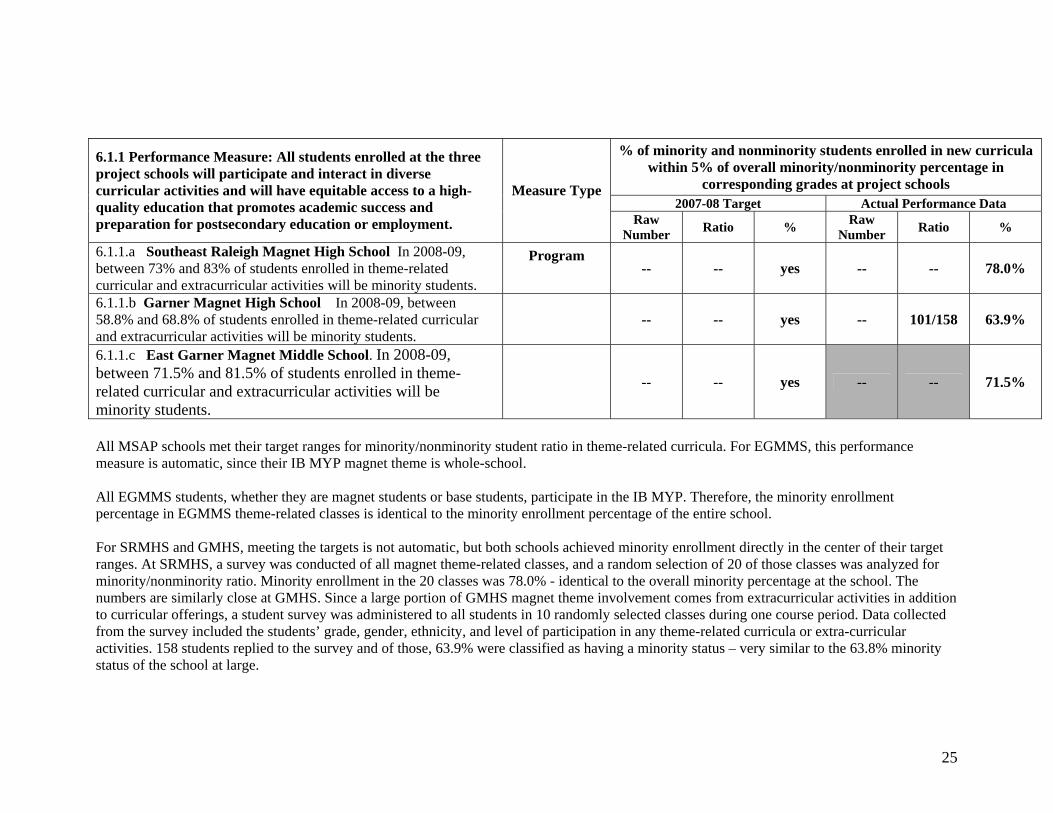
% of minority and nonminority students enrolled in new curricula
within 5% of overall minority/nonminority percentage in corresponding grades at project schools
2007-08 Target Actual Performance Data
6.1.1 Performance Measure: All students enrolled at the three project schools will participate and interact in diverse curricular activities and will have equitable access to a high-quality education that promotes academic success and preparation for postsecondary education or employment.
Measure Type
Raw Number Ratio % Raw
Number Ratio %
6.1.1.a Southeast Raleigh Magnet High School In 2008-09, between 73% and 83% of students enrolled in theme-related curricular and extracurricular activities will be minority students.
Program -- -- yes -- -- 78.0%
6.1.1.b Garner Magnet High School In 2008-09, between 58.8% and 68.8% of students enrolled in theme-related curricular and extracurricular activities will be minority students.
-- -- yes -- 101/158 63.9%
6.1.1.c East Garner Magnet Middle School. In 2008-09, between 71.5% and 81.5% of students enrolled in theme-related curricular and extracurricular activities will be minority students.
-- -- yes -- -- 71.5%
All MSAP schools met their target ranges for minority/nonminority student ratio in theme-related curricula. For EGMMS, this performance measure is automatic, since their IB MYP magnet theme is whole-school. All EGMMS students, whether they are magnet students or base students, participate in the IB MYP. Therefore, the minority enrollment percentage in EGMMS theme-related classes is identical to the minority enrollment percentage of the entire school. For SRMHS and GMHS, meeting the targets is not automatic, but both schools achieved minority enrollment directly in the center of their target ranges. At SRMHS, a survey was conducted of all magnet theme-related classes, and a random selection of 20 of those classes was analyzed for minority/nonminority ratio. Minority enrollment in the 20 classes was 78.0% - identical to the overall minority percentage at the school. The numbers are similarly close at GMHS. Since a large portion of GMHS magnet theme involvement comes from extracurricular activities in addition to curricular offerings, a student survey was administered to all students in 10 randomly selected classes during one course period. Data collected from the survey included the students’ grade, gender, ethnicity, and level of participation in any theme-related curricula or extra-curricular activities. 158 students replied to the survey and of those, 63.9% were classified as having a minority status – very similar to the 63.8% minority status of the school at large.
26
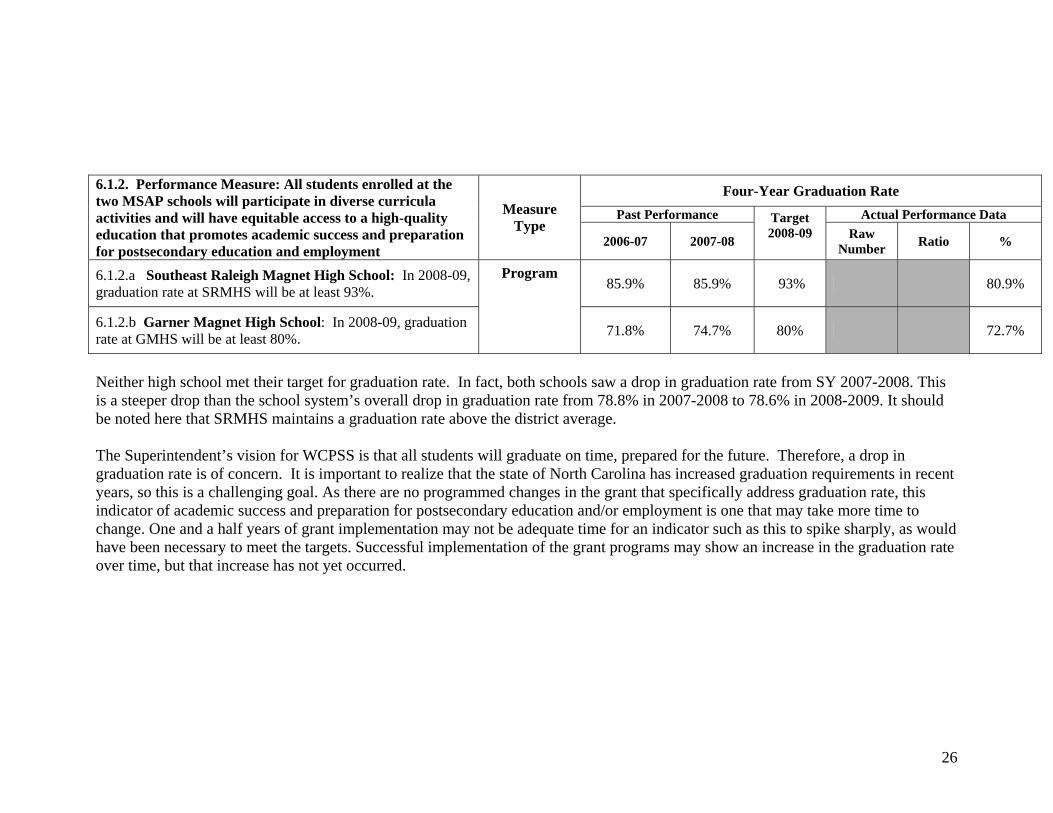
Four-Year Graduation Rate Past Performance Actual Performance Data
6.1.2. Performance Measure: All students enrolled at the two MSAP schools will participate in diverse curricula activities and will have equitable access to a high-quality education that promotes academic success and preparation for postsecondary education and employment
Measure Type
2006-07 2007-08
Target 2008-09
Raw
Number Ratio %
6.1.2.a Southeast Raleigh Magnet High School: In 2008-09, graduation rate at SRMHS will be at least 93%. 85.9% 85.9% 93% 80.9%
6.1.2.b Garner Magnet High School: In 2008-09, graduation rate at GMHS will be at least 80%.
Program
71.8% 74.7% 80% 72.7%
Neither high school met their target for graduation rate. In fact, both schools saw a drop in graduation rate from SY 2007-2008. This is a steeper drop than the school system’s overall drop in graduation rate from 78.8% in 2007-2008 to 78.6% in 2008-2009. It should be noted here that SRMHS maintains a graduation rate above the district average. The Superintendent’s vision for WCPSS is that all students will graduate on time, prepared for the future. Therefore, a drop in graduation rate is of concern. It is important to realize that the state of North Carolina has increased graduation requirements in recent years, so this is a challenging goal. As there are no programmed changes in the grant that specifically address graduation rate, this indicator of academic success and preparation for postsecondary education and/or employment is one that may take more time to change. One and a half years of grant implementation may not be adequate time for an indicator such as this to spike sharply, as would have been necessary to meet the targets. Successful implementation of the grant programs may show an increase in the graduation rate over time, but that increase has not yet occurred.
27
U.S. Department of Education Grant Performance Report (ED 524B)
Project Status Chart
OMB No. 1890 - 0004 Expiration: 10-31-2007 PR/Award #: U165A070026
SECTION B - Budget Information (See Instructions. Use as many pages as necessary.)
Actual Expenditures for Year 2 (July 1, 2008 – April 15, 2009) Year 2 award funds of $2,487,728 were combined with Year 1 carryover funds of $1,138,203 for a total of $3,625,931, available for Year 2 activities. At the time of this report, MSAP expenditures for the period of 07/01/08 – 04/15/09 totaled $1,647,193. Projected expenditures for April - September 2009 are for an additional $1,307,836. Expenditures were made as intended or are otherwise noted. A description follows of Year 2 MSAP related expenditures, as well as projected expenditures for the remaining portion of Year 2 of the MSAP grant. An effort was made to restructure Year 2 activities in order to make up for lost time in Year 1. The budget was a key tool used to ensure that funds were not only utilized with fidelity to the grant’s scope and objectives, but that funds were allotted to performance objectives not met in Year 1. This required submitting a revised MSAP Year 2 budget to the OII. The revised Year 2 budget was developed by meeting with school personnel and following the Plan Do Study Act framework. In an effort to better track MSAP funds the MSAP Director requested the district reconfigure budget codes allowing MSAP funds to be appropriated in categorical funds per school. In addition the MSAP office built a categorical budget per school and per school activity. By developing a more structured budget, district staff, as well as MSAP school staff, tracked and reconciled funds more precisely. Budget discussions were built into the monthly MSAP Principal/Coordinator meetings. WCPSS has strict budget guidelines and deadlines, the yearly MSAP calendar wove the guidelines into the monthly continuum enabling MSAP school and district staff to better map out contracts, staff development, and the purchase of materials and resources. (See Section B, Budget Table 1) Personnel and Fringe All 13 MSAP Year 2 funded positions were filled throughout the entire 2008-2009 school year. Our former MSAP evaluator, Dr. Dina Bulgakov-Cooke, was hired in October 2008 by the district’s Evaluation and Research Department. Jon Brasfield replaced Dr. Bulgakov-Cooke in December of 2008. In addition, through OII approval, year 1 carryover funds were used to convert the half time Marketing and Recruiting position to full time.
28
Travel Travel opportunities were designed to align with MSAP grant objectives. Due to the recent decline in economic conditions, restrictions were placed upon out-of-state travel. District personnel worked in collaboration with school staff, teachers, and administration to identify comparable in-state professional development opportunities that would ensure grant objectives would be met, specifically Purpose 2 (Building Capacity). In fact, district staff prepared a cost analysis proposal which included a comparison of the original and proposed professional development opportunities. The dynamic staff development training sessions that were proposed were ultimately approved by our OII program officer. Although none of the alternative training sessions have taken place at the time of writing this report, it is the hope that these sessions will provide staff with the skills, tools, and experiences that will help their schools enhance the learning of and teaching to all of their students. Although the NTF summer training was one of the few out-of-state trainings that was allowed to take place, the sessions conflicted with SRMHS’s modified calendar; therefore; NTF has agreed to provide their summer session locally. Two of the alternative proposals slated to take place this summer include Pre-Personal Project training for EGMMS teachers, and Arts in the 21st Century for EGMMS and GMHS teachers. In both cases the vendors have designed a customized staff development program aligned directly with the WCPSS Renaissance MSAP grant objectives. All out of state trainings for MSAP administrators scheduled after February 2009, except those required by MSAP, have been cancelled. The funds are available for in state staff development. Supplies and Equipment Supply expenditures were aligned to the Year 2 performance measures and the approved MSAP budget. This included the continued expansion of Year 1expenditures such as:
• Foreign language materials for language B students at EGMMS, • Visual arts supplies, materials and equipment, dance and drama costumes for
GMHS students, • Thin client computers, servers, printers, LCD projectors, and classroom furniture
for SRMHS NTF students, • Whole school books for EGMMS • 180º Leadership books, software, cameras, and memory storage for SRMHS
digital arts, broadcasting, and leadership students, • Wireless access points at EGMMS
Contractual Most contracts in Year 2 were for continued or expanded Year 1 projects. This included contracts for EGMMS and GMHS’s resident artists, afterschool tutors, and summer
29
visual arts, and band camps. In addition SRMHS’s contracts with the NTF, leadership consultant, and engineer retrofitting NTF classrooms were continued. Service agreements were continued with district staff developing new course curriculum, providing art work enhancing magnet themes at MSAP schools, and developing marketing materials. New contracts or service agreements were developed for new or revised staff development, installation of equipment, marketing and advertising, printing, and development of new Web sites. Indirect The State Department of Public Instruction sets the Indirect Cost rate that the district applies to federal grant programs with the restriction to supplement and not supplant. The Indirect Cost rate for the 2008-09 fiscal year is 3.086%. For the entire performance period to date (through 04/09), the district has charged $63,416.55 to the MSAP grant program.
Projected Expenditures for April-September 2009
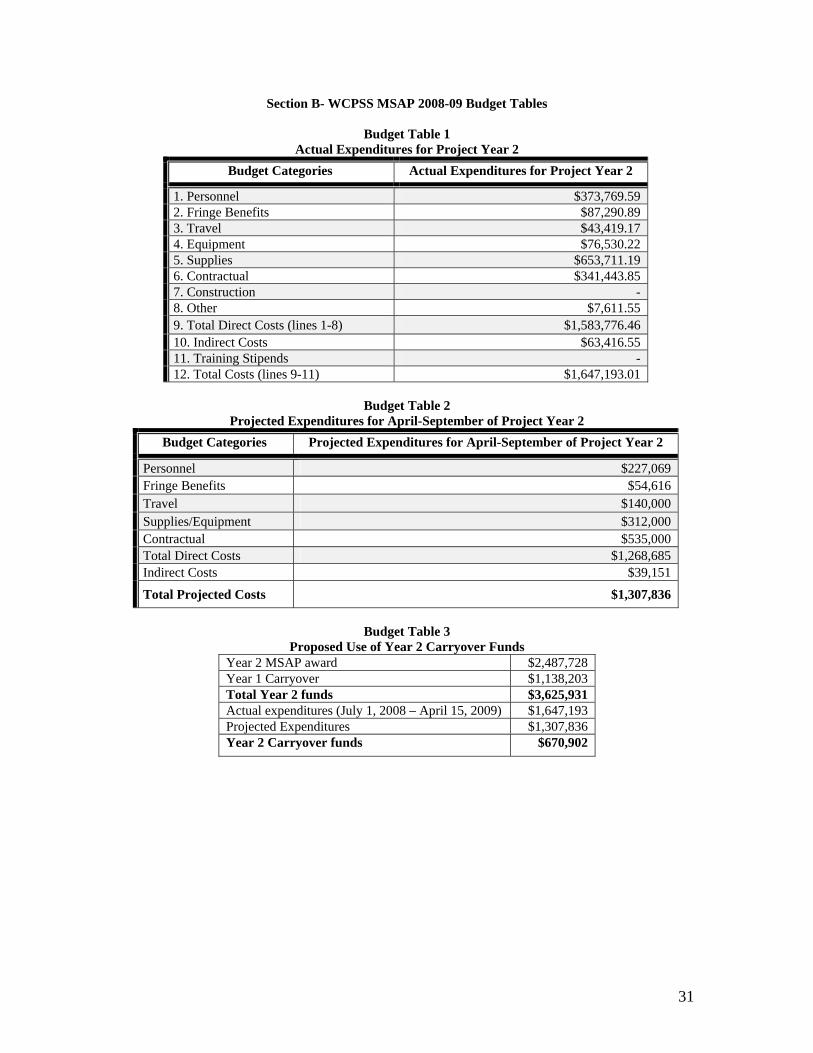
With six months remaining, there are $1,978,738 of unspent Year 2 funds. It is projected that by September 30, 2009 an additional $1,307,836 funds will be spent, leaving $670,902 proposed to be used as carryover funds in Year 3. As a result of having a more structured and planned financial calendar, a much larger amount of MSAP funds have been spent in the first six months of Year 2 than in the entire first year of the grant. A significant percentage of funds were expended as soon as Year 2 funds were awarded and transferred in the corresponding categorical codes. The purpose was to infuse funds into the MSAP schools as quickly as possible in order to create the most impact on students during the 2008-2009 academic school. Aside from salary related expenditures, expenditures during the remainder of Year 2 will mainly focus on staff development related expenses, retrofitting five additional classrooms at SRMHS, marketing and recruitment activities for Fall 2009, and purchasing materials and equipment to be used at the beginning of the 2009-2010 academic school year. (See Section B, Budget Tables 2-3). Progress has been made in Year 2 to complete Year 1 activities which were not completed. In order to better ensure sustainability of grant objectives, it has been critical to also follow a measured pace that does not overwhelm staff and students. This has left us with remainder funds that are proposed to be appropriated for activities that will enhance the three MSAP schools while ensuring high fidelity to the scope and objectives of Renaissance MSAP grant. Description of the proposed use of carryover funds is as follows:
• As was approved for Year 2, we propose using carryover funds to continue funding the full-time marketing and recruiter position. This has been a most critical investment that addresses numerous MSAP performance measures. Our recruiter not only focused her efforts on disseminating information throughout the
30
Wake County community, but more importantly, collaborated with marketing agencies to help staff, parents, and students better articulate and strategically communicate key components of their school and corresponding magnet theme. By focusing on internal and external marketing and recruitment strategies, schools have begun to cast a carefully crafted network of information and resources throughout their recruitment target areas. Funding the marketing and recruitment position as full-time will better ensure our marketing and recruitment momentum for each of the three MSAP schools in the final year grant year.
• Due to out-of-state travel restrictions many staff development activities originally submitted in the Renaissance grant were cancelled. Although the cost analysis proposal resulted in providing quality replacements, it is proposed that carryover funds be used for staff development not attended during Year 2 including IB, Project Zero, and Future of Learning trainings. Attending the training sessions included in the original Renaissance grant are key tools used to build capacity within the MSAP schools and will help ensure sustainability of grant objectives.
• As mentioned in last year’s APR, our proposed WCPSS budget did not include funds for marketing, recruitment, and advertising for EGMMS. It would be proposed that Year 3 carryover funds be used to address this unintended oversight.
• As shown in Years 1 and 2, expenses for retrofitting the NTF classes at SRMHS have been higher than budgeted in the original Renaissance grant. Proposed Year 2 carryover funds will be used to cover the higher costs for the Phase III.
• We propose using carryover funds to continue ensuring that the NTF adaptation model at SRMHS is built for sustainability at the end of the MSAP grant. This entails using carryover funds to contract with a consultant who will build a system that stores project based learning teacher units and student projects.
• We propose that carryover funds be used to enhance the use of technology at SRMHS. It is essential that wireless access points be installed in certain parts of the SRMHS campus in order to replicate the “real world” learning environment modeled in the NTF and 180º SRMHS classes.
31
Section B- WCPSS MSAP 2008-09 Budget Tables
Budget Table 1 Actual Expenditures for Project Year 2
Budget Categories Actual Expenditures for Project Year 2
1. Personnel $373,769.59 2. Fringe Benefits $87,290.89 3. Travel $43,419.17 4. Equipment $76,530.22 5. Supplies $653,711.19 6. Contractual $341,443.85 7. Construction - 8. Other $7,611.55 9. Total Direct Costs (lines 1-8) $1,583,776.46 10. Indirect Costs $63,416.55 11. Training Stipends - 12. Total Costs (lines 9-11) $1,647,193.01
Budget Table 2
Projected Expenditures for April-September of Project Year 2 Budget Categories Projected Expenditures for April-September of Project Year 2
Personnel $227,069 Fringe Benefits $54,616 Travel $140,000 Supplies/Equipment $312,000 Contractual $535,000 Total Direct Costs $1,268,685 Indirect Costs $39,151
Total Projected Costs $1,307,836
Budget Table 3 Proposed Use of Year 2 Carryover Funds
Year 2 MSAP award $2,487,728 Year 1 Carryover $1,138,203 Total Year 2 funds $3,625,931 Actual expenditures (July 1, 2008 – April 15, 2009) $1,647,193 Projected Expenditures $1,307,836 Year 2 Carryover funds $670,902
32
U.S. Department of Education Grant Performance Report (ED 524B)
Project Status Chart
OMB No. 1890 - 0004 Expiration: 10-31-2007 PR/Award #:U165A070026
SECTION C - Additional Information (See Instructions. Use as many pages as necessary.) Appendix A. Tables and Requested Information
Table 1. Teachers at MSAP Schools Who were Administered an MSAP Survey Total
Number of Teachers
Responded to the Survey
Response Rate
Southeast Raleigh Magnet High School 119 93 78.2%
Garner Magnet High School 147 86 58.5% East Garner Magnet Middle
School 74 59 79.7%
33
Table 2. Magnet School Applicant Pool Data for the Current School Year
Applicant Pool for Students Seeking
To Be Enrolled Beginning in Fall, 2009 Magnet School Name: East Garner Magnet Middle School
Gra
de L
evel
Min
ority
St
uden
ts
Min
ority
St
uden
t Pct
Non
-Min
ority
St
uden
ts
Non
-Min
ority
St
uden
t Pct
Tot
al
Stud
ents
6 42 66.7% 21 33.3% 63
7 20 83.3% 4 16.7% 24
8 11 68.8% 5 31.3% 16
Total 73 70.9% 30 29.1% 103
34
Table 3. Magnet School Applicant Pool Data for the Current School Year
Applicant Pool for Students Seeking
To Be Enrolled Beginning in Fall, 2009 Magnet School Name: Garner Magnet High School
Gra
de L
evel
Min
ority
St
uden
ts
Min
ority
St
uden
t Pct
Non
-Min
ority
St
uden
ts
Non
-Min
ority
St
uden
t Pct
Tot
al
Stud
ents
9 27 54.0% 23 46.0% 50
10 20 87.0% 3 13.0% 23
11 23 92.0% 2 8.0% 25
12 14 100.0% 0.0% 14
Total 84 75.0% 28 25.0% 112
35
Table 4. Magnet School Applicant Pool Data for the Current School Year
Applicant Pool for Students Seeking
To Be Enrolled Beginning in Fall, 2009 Magnet School Name: Southeast Raleigh Magnet High School
Gra
de L
evel
Min
ority
St
uden
ts
Min
ority
St
uden
t Pct
Non
-Min
ority
St
uden
ts
Non
-Min
ority
St
uden
t Pct
Tot
al
Stud
ents
9 216 77.7% 62 22.3% 278
10 30 85.7% 5 14.3% 35
11 32 86.5% 5 13.5% 37
12 13 81.3% 3 18.8% 16
Total 291 79.5% 75 20.5% 366
36
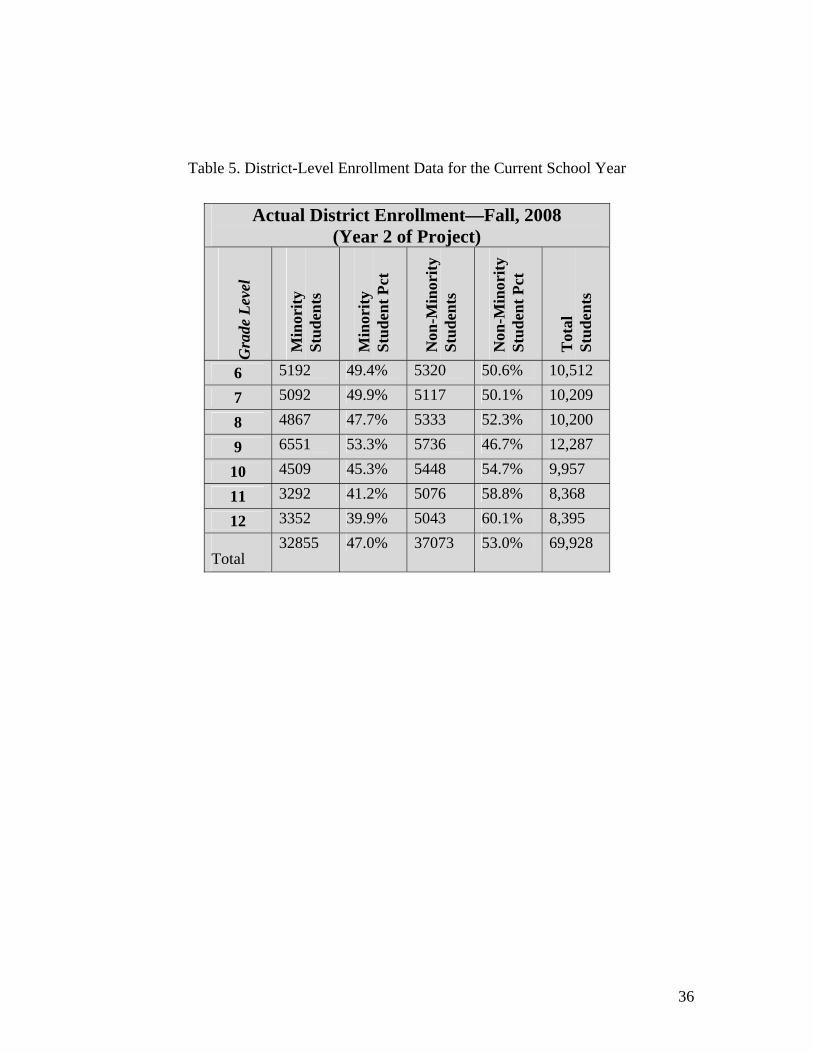
Table 5. District-Level Enrollment Data for the Current School Year
Actual District Enrollment—Fall, 2008 (Year 2 of Project)
Gra
de L
evel
Min
ority
St
uden
ts
Min
ority
St
uden
t Pct
Non
-Min
ority
St
uden
ts
Non
-Min
ority
St
uden
t Pct
Tot
al
Stud
ents
6 5192 49.4% 5320 50.6% 10,512
7 5092 49.9% 5117 50.1% 10,209
8 4867 47.7% 5333 52.3% 10,200
9 6551 53.3% 5736 46.7% 12,287
10 4509 45.3% 5448 54.7% 9,957
11 3292 41.2% 5076 58.8% 8,368
12 3352 39.9% 5043 60.1% 8,395
Total 32855 47.0% 37073 53.0% 69,928
37
Table 6. Magnet School Enrollment Data for the Current School Year
Magnet School Enrollment—Fall, 2008 (Year 2 of Project)
School Name: East Garner Magnet Middle G
rade
Lev
el
Min
ority
St
uden
ts
Min
ority
St
uden
t Pct
Non
-Min
ority
St
uden
ts
Non
-Min
ority
St
uden
t Pct
Tot
al
Stud
ents
6 267 73.8% 95 26.2% 362
7 295 76.6% 90 23.4% 385
8 292 79.1% 77 20.9% 369
Total 854 76.5% 262 23.5% 1,116
38
Table 7. Magnet School Enrollment Data for the Current School Year
Magnet School Enrollment—Fall, 2008 (Year 2 of Project)
School Name: Garner Magnet High School G
rade
Lev
el
Min
ority
St
uden
ts
Min
ority
St
uden
t Pct
Non
-Min
ority
St
uden
ts
Non
-Min
ority
St
uden
t Pct
Tot
al
Stud
ents
9 581 74.7% 197 25.3% 778
10 343 60.2% 227 39.8% 570
11 269 60.4% 176 39.6% 445
12 286 54.6% 238 45.4% 524
Total 1479 63.8% 838 36.2% 2,317
39
Table 8. Magnet School Enrollment Data for the Current School Year
Magnet School Enrollment—Fall, 2008 (Year 2 of Project)
School Name: Southeast Raleigh Magnet High G
rade
Lev
el
Min
ority
St
uden
ts
Min
ority
St
uden
t Pct
Non
-Min
ority
St
uden
ts
Non
-Min
ority
St
uden
t Pct
Tot
al
Stud
ents
9 381 85.4% 65 14.6% 446
10 354 80.3% 87 19.7% 441
11 256 72.5% 97 27.5% 353
12 286 72.0% 111 28.0% 397
Total 1277 78.0% 360 22.0% 1,637
40
Table 9. Feeder School Enrollment Data for the Current School Year
cont’d.
Schools Actual Feeder School Enrollment
as of Fall, 2008 (Current School Year)
Feeder
School Magnet
School(s) Num
ber
of
Min
ority
Stu
dent
s
Min
ority
Stu
dent
Pc
t
Num
ber
of N
on-
Min
ority
Stu
dent
s
Non
-Min
ority
St
uden
t Pct
Tot
al S
tude
nts
Carnage East Garner 873 79.8% 221 20.2% 1,094Centennial East Garner 290 48.8% 303 51.1% 593 Dillard East Garner 617 52.8% 552 47.2% 1,169Fuquay-Varina Middle
East Garner 363 38.4% 583 61.6% 946
Holly Ridge East Garner 465 37.5% 776 62.5% 1,241Lufkin East Garner 284 24.9% 857 75.1% 1,141North Garner East Garner 640 56.6% 490 43.4% 1,130West Lake East Garner 455 32.0% 965 68.0% 1,420Apex Southeast Raleigh 473 21.5% 1728 78.5% 2,201Athens Drive Southeast Raleigh 840 46.1% 984 53.9% 1,824Broughton Southeast Raleigh 977 43.4% 1272 56.6% 2,249Cary Southeast Raleigh 711 40.6% 1040 59.4% 1,751East Wake Health Sciences
Southeast Raleigh 212 52.0% 196 48.0% 408
East Wake IT Southeast Raleigh 266 72.1% 103 27.9% 369 East Wake Arts Southeast Raleigh 263 62.2% 160 37.8% 423 East Wake Engineering
Southeast Raleigh 206 55.2% 167 44.8% 373
Enloe Southeast Raleigh 1489 56.3% 1154 43.7% 2,643Fuquay-Varina High
Southeast Raleigh, Garner
587 31.9% 1256 68.1% 1,843
41
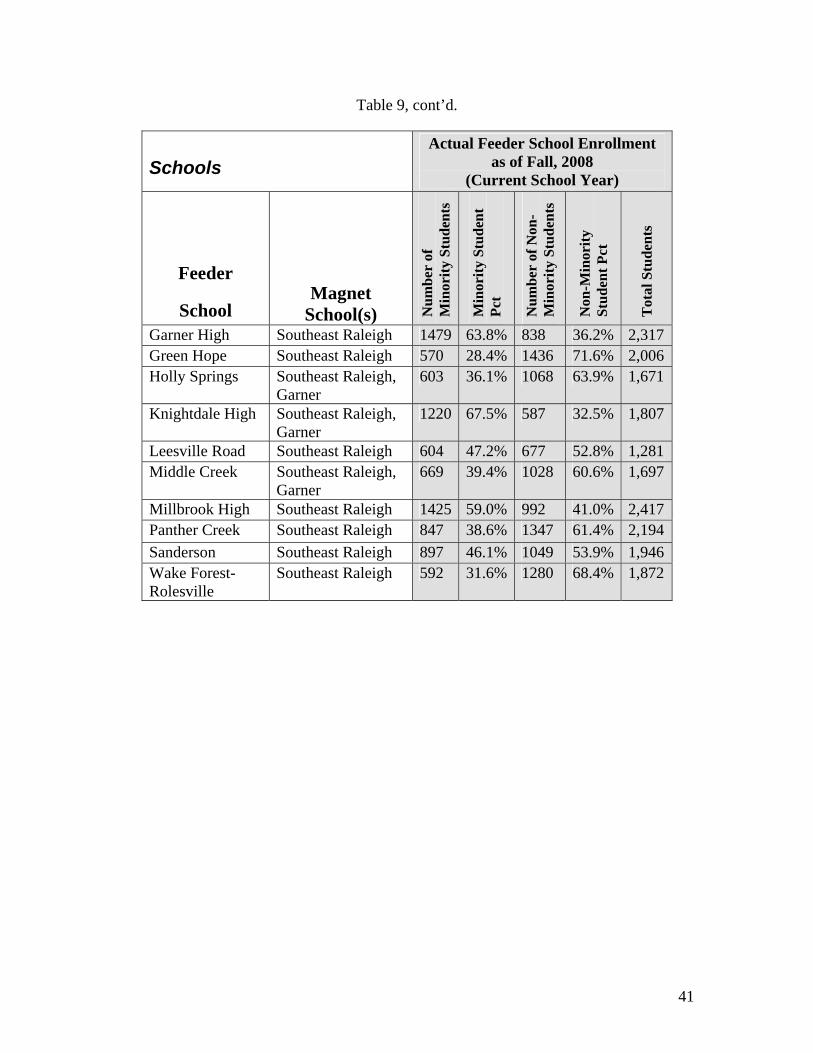
Table 9, cont’d.
Schools Actual Feeder School Enrollment
as of Fall, 2008 (Current School Year)
Feeder
School Magnet
School(s) Num
ber
of
Min
ority
Stu
dent
s
Min
ority
Stu
dent
Pc
t
Num
ber
of N
on-
Min
ority
Stu
dent
s
Non
-Min
ority
St
uden
t Pct
Tot
al S
tude
nts
Garner High Southeast Raleigh 1479 63.8% 838 36.2% 2,317Green Hope Southeast Raleigh 570 28.4% 1436 71.6% 2,006Holly Springs Southeast Raleigh,
Garner 603 36.1% 1068 63.9% 1,671
Knightdale High Southeast Raleigh, Garner
1220 67.5% 587 32.5% 1,807
Leesville Road Southeast Raleigh 604 47.2% 677 52.8% 1,281Middle Creek Southeast Raleigh,
Garner 669 39.4% 1028 60.6% 1,697
Millbrook High Southeast Raleigh 1425 59.0% 992 41.0% 2,417Panther Creek Southeast Raleigh 847 38.6% 1347 61.4% 2,194Sanderson Southeast Raleigh 897 46.1% 1049 53.9% 1,946Wake Forest-Rolesville
Southeast Raleigh 592 31.6% 1280 68.4% 1,872
42
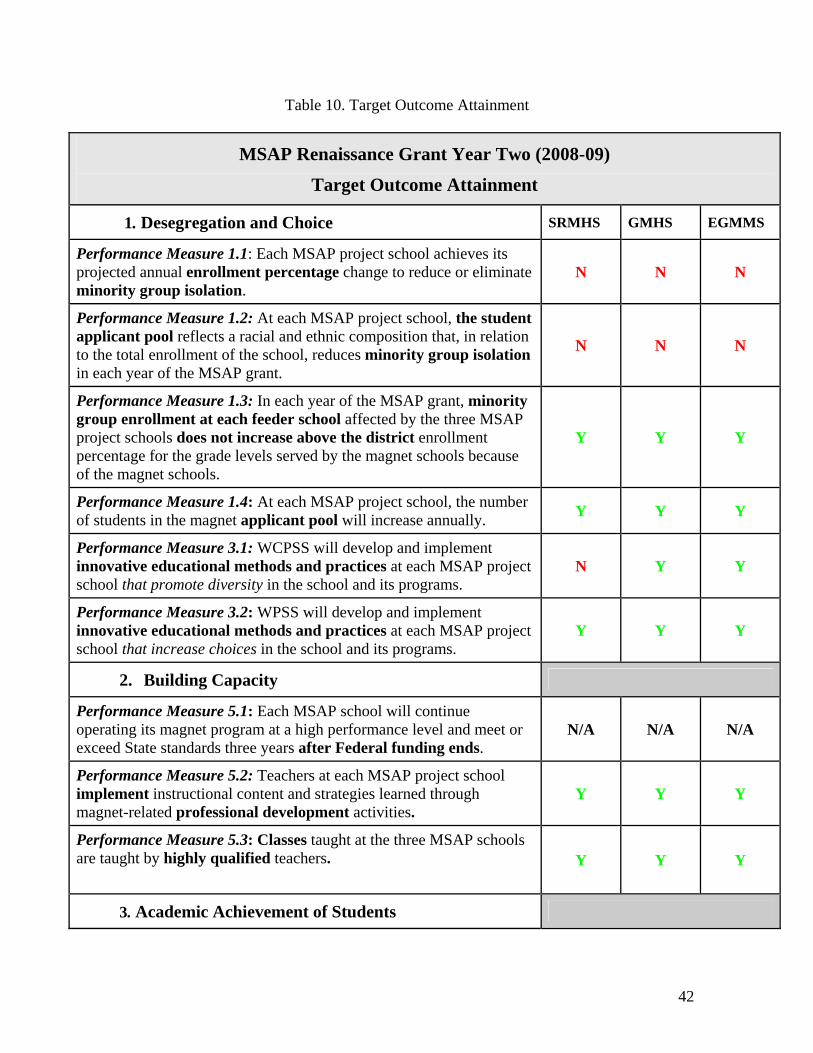
Table 10. Target Outcome Attainment
MSAP Renaissance Grant Year Two (2008-09)
Target Outcome Attainment
1. Desegregation and Choice SRMHS GMHS EGMMS
Performance Measure 1.1: Each MSAP project school achieves its projected annual enrollment percentage change to reduce or eliminate minority group isolation.
N N N
Performance Measure 1.2: At each MSAP project school, the student applicant pool reflects a racial and ethnic composition that, in relation to the total enrollment of the school, reduces minority group isolation in each year of the MSAP grant.
N N N
Performance Measure 1.3: In each year of the MSAP grant, minority group enrollment at each feeder school affected by the three MSAP project schools does not increase above the district enrollment percentage for the grade levels served by the magnet schools because of the magnet schools.
Y Y Y
Performance Measure 1.4: At each MSAP project school, the number of students in the magnet applicant pool will increase annually. Y Y Y
Performance Measure 3.1: WCPSS will develop and implement innovative educational methods and practices at each MSAP project school that promote diversity in the school and its programs.
N Y Y
Performance Measure 3.2: WPSS will develop and implement innovative educational methods and practices at each MSAP project school that increase choices in the school and its programs.
Y Y Y
2. Building Capacity
Performance Measure 5.1: Each MSAP school will continue operating its magnet program at a high performance level and meet or exceed State standards three years after Federal funding ends.
N/A N/A N/A
Performance Measure 5.2: Teachers at each MSAP project school implement instructional content and strategies learned through magnet-related professional development activities.
Y Y Y
Performance Measure 5.3: Classes taught at the three MSAP schools are taught by highly qualified teachers.
Y Y Y
3. Academic Achievement of Students
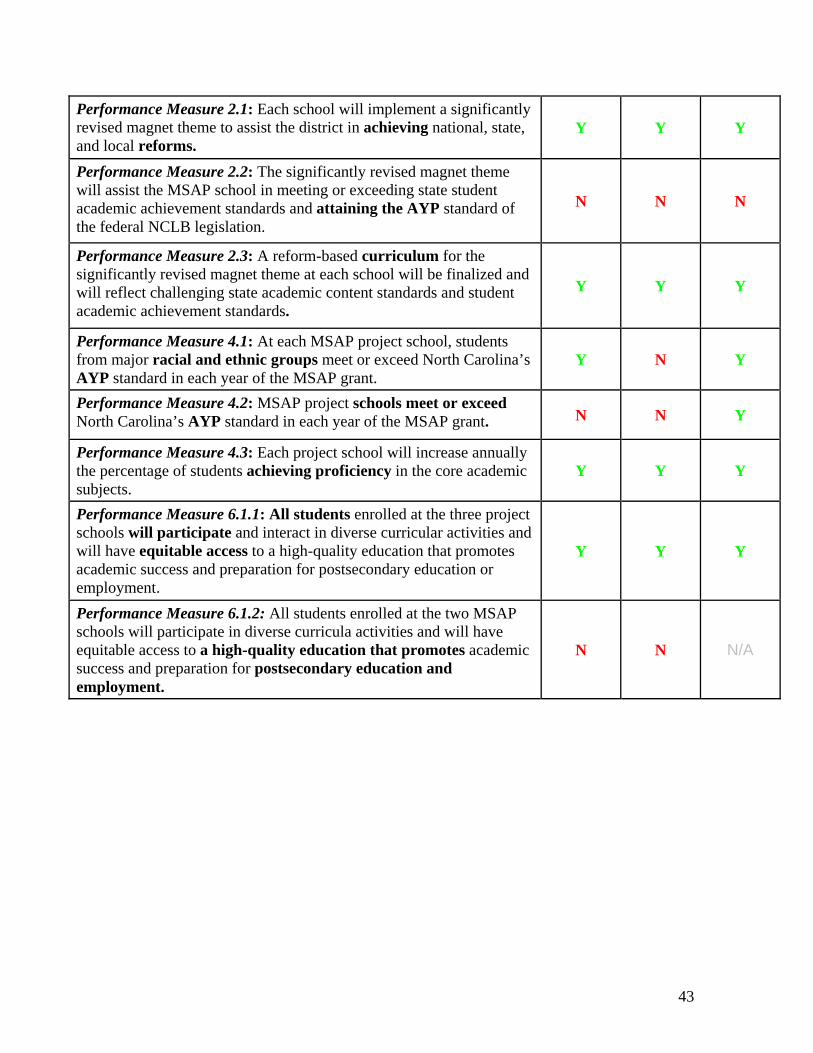
43
Performance Measure 2.1: Each school will implement a significantly revised magnet theme to assist the district in achieving national, state, and local reforms.
Y Y Y
Performance Measure 2.2: The significantly revised magnet theme will assist the MSAP school in meeting or exceeding state student academic achievement standards and attaining the AYP standard of the federal NCLB legislation.
N N N
Performance Measure 2.3: A reform-based curriculum for the significantly revised magnet theme at each school will be finalized and will reflect challenging state academic content standards and student academic achievement standards.
Y Y Y
Performance Measure 4.1: At each MSAP project school, students from major racial and ethnic groups meet or exceed North Carolina’s AYP standard in each year of the MSAP grant.
Y N Y
Performance Measure 4.2: MSAP project schools meet or exceed North Carolina’s AYP standard in each year of the MSAP grant. N N Y
Performance Measure 4.3: Each project school will increase annually the percentage of students achieving proficiency in the core academic subjects.
Y Y Y
Performance Measure 6.1.1: All students enrolled at the three project schools will participate and interact in diverse curricular activities and will have equitable access to a high-quality education that promotes academic success and preparation for postsecondary education or employment.
Y Y Y
Performance Measure 6.1.2: All students enrolled at the two MSAP schools will participate in diverse curricula activities and will have equitable access to a high-quality education that promotes academic success and preparation for postsecondary education and employment.
N N N/A
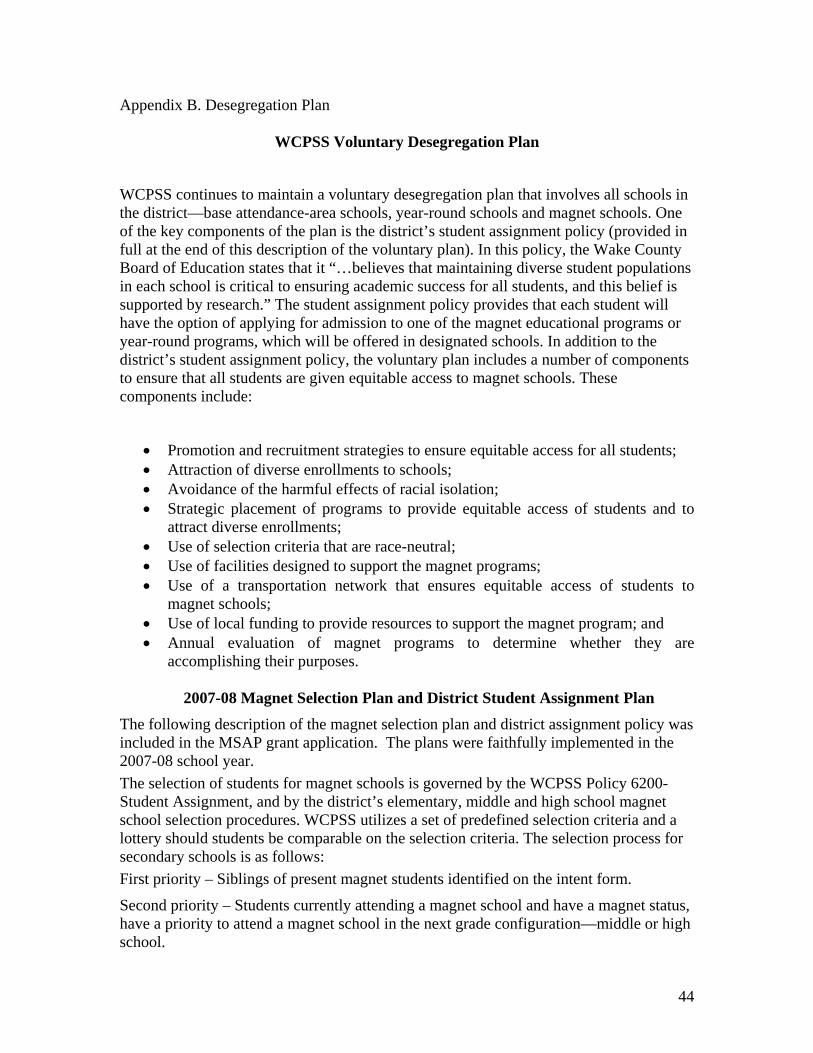
44
Appendix B. Desegregation Plan
WCPSS Voluntary Desegregation Plan
WCPSS continues to maintain a voluntary desegregation plan that involves all schools in the district—base attendance-area schools, year-round schools and magnet schools. One of the key components of the plan is the district’s student assignment policy (provided in full at the end of this description of the voluntary plan). In this policy, the Wake County Board of Education states that it “…believes that maintaining diverse student populations in each school is critical to ensuring academic success for all students, and this belief is supported by research.” The student assignment policy provides that each student will have the option of applying for admission to one of the magnet educational programs or year-round programs, which will be offered in designated schools. In addition to the district’s student assignment policy, the voluntary plan includes a number of components to ensure that all students are given equitable access to magnet schools. These components include:
• Promotion and recruitment strategies to ensure equitable access for all students; • Attraction of diverse enrollments to schools; • Avoidance of the harmful effects of racial isolation; • Strategic placement of programs to provide equitable access of students and to
attract diverse enrollments; • Use of selection criteria that are race-neutral; • Use of facilities designed to support the magnet programs; • Use of a transportation network that ensures equitable access of students to
magnet schools; • Use of local funding to provide resources to support the magnet program; and • Annual evaluation of magnet programs to determine whether they are
accomplishing their purposes.
2007-08 Magnet Selection Plan and District Student Assignment Plan The following description of the magnet selection plan and district assignment policy was included in the MSAP grant application. The plans were faithfully implemented in the 2007-08 school year. The selection of students for magnet schools is governed by the WCPSS Policy 6200-Student Assignment, and by the district’s elementary, middle and high school magnet school selection procedures. WCPSS utilizes a set of predefined selection criteria and a lottery should students be comparable on the selection criteria. The selection process for secondary schools is as follows: First priority – Siblings of present magnet students identified on the intent form.
Second priority – Students currently attending a magnet school and have a magnet status, have a priority to attend a magnet school in the next grade configuration—middle or high school.
45
After assigning the students who meet the criteria above, the school will determine the number of vacancies available; 90% of these vacancies will be filled from valid applications in the following order:
• Round One o Live in a node where the socioeconomic status (free or reduced-price lunch)
percentage of elementary aged children is at least 5% below the county average AND
o Assigned to a base school where the SES percentage of elementary aged children is at least 5% below the county average AND
o Assigned to a base school where the 2-year average of Level I and II percentage students tested is 20% or less AND
o Assigned to a base school that has a current crowding factor above 100% of the adjusted building capacity AND
o Submitted a valid application for the same program the previous year.
• Round Two o Same as Round One with deletion of previous year’s application.
• Round Three o Same as Round Two with the revision of the crowding factor to be above 90% of
the adjusted building capacity. • Round Four
o Assigned to a base school that has a crowding factor above 90% of the adjusted building capacity AND
o Assigned to a base school where the SES percentage of elementary aged children is less than 40% AND
o Assigned to a base school where the 2-year average of Level I and II percentage students tested is 20% or less.
Ten percent (10%) of vacancies identified above will be filled randomly from all remaining valid applications.
Socioeconomic Status The district considers socioeconomic status one of the factors in assigning students to its magnet schools for several reasons. First, it wants to ensure that all students have access to magnet schools regardless of their socioeconomic background. Second, national research has shown that attending schools with high concentrations of poverty is educationally harmful to students because such schools tend to have higher teacher turnover, teachers with less experience and teachers with fewer advanced degrees. Such factors can contribute to lower student achievement. Third, the district believes that there are educational benefits for students to have the opportunity to attend school with students from different socioeconomic backgrounds because it provides students the chance to learn together and to break down stereotypes about poor, middle-class and upper-middle class students.
46
Academic Achievement The district also considers academic achievement of students as another factor in assigning students to all schools. Research has shown that having high concentrations of low-achieving students in a school can have a negative impact on all of the students attending that particular school. In keeping with NCLB legislation, the district has set a goal for the 2008 year of having 95% of students in grades 3 through 12 at or above grade level as measured by NC End-of-Grade (EOG) and NC End-of-Course (EOC) tests, with all student groups demonstrating high growth by 2008. So as to optimize learning opportunities and experiences for all students, the district will consider both socioeconomic and academic achievement variables when assigning attendance nodes to base schools.
School Capacity Due to the unrelenting growth in student population over the past and foreseeable future years and the consequent school crowding, it is also necessary for the district to consider school capacity when assigning students to magnet schools. Accordingly, the district gives a preference to students who are assigned to overcrowded schools or who have older siblings already attending the magnet school to which a younger sibling is applying.
Racial Considerations The application for grants under the Magnet Schools Assistance Program, OMB No. 1855-0011, Exp. Date 4/30/2007, indicates that “The Department believes that LEAs submitting voluntary plans can achieve the statutory purposes of reducing, eliminating, or preventing minority group isolation using race-neutral admissions practices.” WCPSS does not currently use race of student in assignment determinations, and does not envision the need to use race as a factor in admitting students to magnet schools. The district’s strategies address the educational benefits of giving students the opportunities to attend schools with students of different backgrounds, economic levels, and achievement levels.
WCPSS Student Assignment Board Policy (2006-07) Below is the WCPSS Student Assignment Board Policy-6200 that was in effect for the 2007-08 school year. This was the policy used to select magnet students for the 2007-08 school year. The policy was revised in December 2007. Information about the revised student assignment process follows in the subsequent section.
WCPSS Policy 6200-Student Assignment The Wake County Public School System believes that maintaining diverse student populations in each school is critical to ensuring academic success for all students, and
47
this belief is supported by research. The school system also must consider such factors as cost effective use of facilities. Each student enrolled in the Wake County Public School System shall be assigned to the school of his or her grade level serving the attendance area in which that student’s parents or court-appointed guardian lives. Exceptions will be made as necessary to limit enrollment of a school due to overcrowding or for special programmatic reasons; e.g., special education, English as a Second Language, or alternative school programs. Each student will have the option of applying for admission to one of the magnet educational programs or year-round programs, which will be offered in designated schools. All of the following factors, not in priority order, will be used in the development of the annual student assignment plan: A. Instructional program; e.g., magnet programs, special education, ESL, etc. B. Adherence to K-5, 6-8, 9-12 grade organization. C. Facility utilization, including crowding (projected enrollment should be between 85%
and 115% of approved campus capacity). New schools may operate with less than 85% of capacity enrolled if some grade levels will not be assigned during the first year or if significant growth is anticipated in the following years.
D. Diversity in student achievement (percentage of students scoring below grade level
should be no higher than 25%, averaged across a two-year period). Schools with more than 25% of students below grade level will receive an instructional review to ascertain the reasons for the low achievement; improvement trends will be considered in deciding whether to address this issue in development of the assignment plan.
E. Diversity in socioeconomic status (percentage of students eligible for free or reduced
price lunch will be no higher than 40%). Schools with more than 40% of students eligible for free or reduced prince lunch will receive an instructional review; improvement trends will be considered in deciding whether to address this issue in development of the assignment plan.
F. Stability (the percentage of students who will remain at the same school). G. Proximity (no student will travel more than the maximum established by board
policy). Beginning in the fall 2000, the board will review and approve the factors to be considered in developing the student assignment plan and will approve the list of factors and ways to measure those factors by their first meeting in October each year.
Legal Reference: G.S. 115C-366; -367
Cross Reference: Policies 6202 and 6203
Adopted: 5/4/1981; Revised: 1/17/1983; Revised: 5/16/1983; Revised: 11/18/1991; Revised: 4/21/1997; Revised: 1/10/2000
48
2008-09 Magnet Selection Plan and District Student Assignment Plan
There were no significant changes to the magnet selection plan and district student assignment plan for the 2008-09 school year. The 2007-08 plans described above were implemented at the three MSAP schools and throughout the district in the 2008-09 school year. One minor change that was made to the magnet selection plan was lowering the crowding factor in Round Three and Round Four from 90% to 85%. This change was made to increase the magnet applicant pool and provide more access to applicants from year-round schools whose membership/capacity percentages are lower than the district average in some cases.
The selection process for secondary schools was as follows:
First priority – Siblings of present magnet students identified on the intent form.
Second priority – Students currently attending a magnet school and have a magnet status, have a priority to attend a magnet school in the next grade configuration—middle or high school.
After assigning the students who meet the criteria above, the school will determine the number of vacancies available; 90% of these vacancies will be filled from valid applications in the following order:
• Round One o Live in a node where the SES (free or reduced-price lunch) percentage of
elementary aged children is at least 5% below the county average AND o Assigned to a base school where the SES percentage of elementary aged children
is at least 5% below the county average AND o Assigned to a base school where the 2-year average of Level I and II percentage
students tested is 20% or less AND o Assigned to a base school that has a current crowding factor above 100% of the
adjusted building capacity AND o Submitted a valid application for the same program the previous year.
• Round Two
o Same as Round One with deletion of previous year’s application.
49
• Round Three
o Same as Round Two with the revision of the crowding factor to be above 85% of the adjusted building capacity.
• Round Four
o Assigned to a base school that has a crowding factor above 85% of the adjusted building capacity AND
o Assigned to a base school where the SES percentage of elementary aged children is less than 40% AND
o Assigned to a base school where the 2-year average of Level I and II percentage students tested is 20% or less.
Ten percent (10%) of vacancies identified above will be filled randomly from all remaining valid applications. The WCPSS Board of Education revised its policy on student assignment on December 4, 2007. Following is the text of WCPSS Board Policy 6200-Student Assignment and WCPSS Regulations and Procedures 6200-Student Assignment. The policy retains its commitment to maintaining diverse student populations in WCPSS schools and provides more guidance to the Office of Growth and Planning in designing student assignment plans. The policy specifies six factors that should be considered in drafting the annual plan: populations of students with higher needs, facility utilization, alignment with magnet schools program, grade structure, stability of assignment, and distance.
WCPSS Policy 6200-Student Assignment (Revised 12/4/2007 for implementation in the 2008-09 school year))
The Board of Education’s goals for the student assignment process include: • Creating stable school environments (families, classmates, and peers) • Protecting the ability to offer quality programs in every school • Collaborating with the community (all parties/stakeholders) • Creating and maintaining a diverse student body. • Alleviating overcrowding • Filling seats efficiently • Achieving academic success for all children • Providing a logical progression between elementary, middle, and high school • Creating good teaching conditions (the social, emotional, and physical
environment). • Retaining good teachers • Ensuring consistency across the System over time • Building a sense of community and connection (i.e. neighborhoods, parent
involvement) • Fairness
50
Maintaining diverse student populations in each Wake County school is critical to ensuring academic success for all students. This is supported by research. The school system will also consider other factors that impact communities, families and costs.
Each student enrolled in the Wake County Public School System shall be assigned to the school of his or her grade level serving the attendance area in which that student’s parents or court-appointed custodian is domiciled and the student resides. Exceptions will be made as necessary to limit enrollment of a school due to overcrowding or for special programmatic reasons such as the need for special education services or alternative school programs. Each student will have the option of applying for admission to one of the magnet educational programs offered in designated schools or to a school which operates on a different calendar than the assigned school.
All of the following factors, not in priority order, will be used in the development of the annual student assignment plan. While absolute balance of each factor across all schools is not achievable, comparability between neighboring schools in regard to each factor is the desired outcome of the student assignment process.
A. Populations of Students With Higher Needs
The student assignment plan will create balance across schools in the distribution of students who:
1. are eligible to receive free or reduced price lunches in the child nutrition program,
2. perform below grade level on End-of-Grade tests,
3. are identified as being Limited English Proficient (LEP),
4. require services from Special Education programs.1
Whenever any of the following targets are exceeded, the Board directs the Superintendent to review the reasons for exceeding the target, study trends across several years, and recommend ways in which the student assignment plan could help achieve the targets:
1. Less than 25% of students at any school, averaged across a two-year period, will score below grade level on the Reading End-of-Grade test.
2. Less than 40% of students at any school will qualify for free or reduced price lunches.
B. Facility Utilization
The student assignment plan will seek optimal utilization of each school’s long-range capacity and, whenever possible, reduce utilization of mobile or modular classrooms that cause a school to operate at more than the approved long-range capacity. 2
51
C. Alignment With The Magnet Schools Program
The student assignment plan will include a review of the extent to which the system-wide objectives of the Magnet Program are being achieved.
D. Grade Structure
The student assignment plan will adhere to K-5, 6-8, 9-12 grade organization whenever possible with consideration for moving groups of students together across levels.
E. Stability Of Assignment
Nodes will remain assigned to the schools at each level (Elementary, Middle, High) for at least three years before being considered for reassignment, whenever possible.
F. Distance
Proximity of nodes to assigned schools will be considered, and no student should travel more than the maximum time established by Board Policy 7125.
Footnote: 1. Board policy regarding special education services is specified in Board Policy 6222. 2. Long-range capacity is defined as the capacity of the permanent building(s) plus the
capacity of the optimal number of mobile or modular classrooms for the campus. Legal Reference: G.S.115C-366; -367 Cross Reference: Policies 6202, 6203, and 7125 Adopted: May 4, 1981 Revised: January 17, 1983 Revised: May 16, 1983 Revised: November 18, 1991 Revised: April 21, 1997 Revised: January 10, 2000 Revised: March 18, 2003 Revised: December 4, 2007
WCPSS Regulations and Procedures 6200-Student Assignment
It is the intent of the Wake County Board of Education to promote a variety of educational program choices for students and families, and to:
1. Preserve the integrity of the instructional program at all schools. 2. Adhere to appropriate grade structures. 3. Achieve student diversity in all schools. 4. Utilize facilities as efficiently as practical.
To meet these goals, it is sometimes necessary to reassign students and to implement assignment strategies that cause a disruption in assignment stability for students and families. It is the desire of the Board to implement
52
assignment plans in a manner that cause the least disruption to students and families while meeting these goals. The frequency and magnitude of reassignments is also a function of student membership growth and the school system’s response to that growth.
The following regulations and procedures are designed to assist in the implementation of the school assignment plan:
A. Base School Assignments
1. Parents or legal custodians wishing to enroll a child in the base school should go directly to the base school with proof of domicile (closing statement from purchase of domicile (permanent residence), lease agreement, recent utility bill, i.e., electric, gas, water bill; no cable or telephone bills are accepted), and a certified copy of the birth certificate if the parent is enrolling from outside Wake County schools. The school will check the address and school assignment carefully to ensure appropriate enrollment based upon address. Parents or legal custodians wishing to enroll a child in the base school but who are unable to provide proof of domicile should be sent to the Office of Growth Management.
An exception to the above stated enrollment requirements should be made if the student meets the qualifications of the McKinney-Vento Homeless Assistance Act. In such case, the school shall enroll the student immediately and shall request any necessary records on behalf of the student.
2. Students, other than those with special needs are assigned to their “base school”; that is the school assignment based on the parent’s or legal custodian’s domicile. In some instances the base school may be a magnet or year round school since these schools may have base populations in addition to accepting students through applications. Base school assignment, using the student’s address, can be determined from the current edition of the “STREET DIRECTORY” which is published by Information Systems or from the mainframe data base. The Growth Management staff will provide assistance if the specific address is not included in the Directory or on the mainframe.
3. In some cases, a student may be assigned to a school other than the regular base school. For example, a child may have a special need that requires a program not available at the base school. Information regarding programs for children with special needs is available from the special programs department. Information about which magnet or year-round school serve a particular address may be found using the student assignment link at www.wcpss.net or from the Office of Growth Management.
B. Application and Assignment Process for Magnet and Year Round Programs
1. Any student enrolled in the Wake County Public School System is eligible for admission into one of the magnet or year round programs with no special performance standards or test scores required for admission, except for the academically gifted (AG) program. This includes gifted and talented magnet programs in which students enroll based on interests rather than on any academic criteria.
2. Siblings, school capacity, classroom capacity, diversity, transportation patterns and date of postmark are the criteria used to accept students.
3. Specific windows of time are established each year for the acceptance of magnet/year round applications. Only applications received and postmarked via US Mail or time-stamped via the online application process will be considered. Applications for siblings should be submitted in the same envelope.
4. Applications submitted prior to the first official day for acceptance will be considered late. Faxed or incomplete applications will not be considered.
5. Kindergarten and other students not currently-enrolled in Wake County Schools should be registered at their base school prior to the submission of an application in order to be considered. The date for kindergarten registration is established on an annual basis.
6. Only the information on the application is considered during the selection process. Selection of applications is random based on stated criteria. Additional attachments and/or extenuating circumstances are not considered during the selection process.
7. Applications are for programs, not specific schools. Students will be assigned to a magnet or year round-
53
school based on domicile or permanent home address. Requests for specific schools will not be considered.
8. An applicant pool and not a waiting list is maintained of applicants who are not selected to a magnet or year round school. If openings occur in a magnet or year round school after acceptances are mailed, and before, the tenth day of school, applications from the original applicant pool will be considered to fill any available spaces before consideration of new requests.
9. Current magnet students in the 5th and 8th grades must complete a magnet application in order to be accepted into the middle school magnet program or high school magnet program. All other current magnet students complete an intent to return form in order to remain in the magnet program. Current year round students in grade 8 must complete an application in order to be considered and accepted into a high school magnet program. Year round students in eighth grade (8th) receive priority to the magnet high school which is on a modified calendar only and not other magnet schools.
10. Siblings who live within magnet/year round transportation patterns are given highest priority for acceptance.
11. After siblings and current magnet/year round students have been accepted, applicants whose applications were received on time, who live within the transportation pattern, and who meet stated criteria are given next priority for acceptance to 90% of available seats. If there are more applications than available seats, a random selection is used to accept applicants. All on time applicants who live within the transportation pattern are eligible for random selection to 10% percent of the available seats in a magnet or year round school. The Growth Management staff has no input regarding who is selected except to insure all polices and procedures are followed.
12. Late applications or applications outside the attendance patterns are considered only after all “on time” applicants living within transportation patterns have been considered.
13. The Growth Management office will establish a time line for notification of selection or denial. If selected, the student will have the opportunity to accept or decline the offer.
14. After June 1 a student accepted to or continuing in a magnet or year round school must remain in the assigned school for the full academic year.
15. If accepted to a year round school, there can be no track changes during the first year.
16. Certain magnet schools may not accept students for an academic year due to a large base population. This fact will be determined by the Growth Management staff prior to the acceptance of applications.
17. If a student has not presented himself/herself for enrollment in the year-round school by the third day of school the student will lose his/her seat, and another applicant may be selected to fill the opening.
Issued: April 21, 1997 Revised: March 18, 2003 Revised: May 20, 2005 Revised: August 24, 2006
2009-10 Magnet Selection Plan and District Student Assignment Plan
During the summer and fall of 2008, the WCPSS Growth and Planning Department developed a three-year student assignment plan based upon Board Policy 6200 (shown above) which had been revised and adopted by the Board of Education in December 2007. The three-year plan anticipates the opening of ten schools during the 2009-10, 2010-11, and 2011-12 school years and was formally approved by the Board of Education on February 3, 2009. There were no significant changes to the magnet program and magnet selection and placement process associated with the three-year plan. However, there were some changes for some schools that were designed to target magnet
54
program resources and improve alignment of the districtwide Magnet Program and the student assignment plan. In October 2008, the Board of Education decided to phase out magnet programs at two schools (the Middle Years International Baccalaureate Program at Daniels Middle School and the International Baccalaureate Middle Years and Diploma programs at Broughton High School). It was determined that these two schools did not need to draw magnet students in order to maintain socio-economically and racially diverse student bodies and that the funding associated with those programs should be used to address the needs of other schools. The Board designated two new elementary magnet programs at Smith Elementary and Brentwood Elementary, planning for which began in the winter of 2009. Applicants to those two new programs are being accepted for the 2009-10 school year. The Board also designated Millbrook High School to become a new International Baccalaureate Middle Years and Diploma program beginning in the 2010-11 school year. Applications to the new Millbrook program will be accepted in the winter of 2010. In response to slower enrollment growth across the district and the increased capacity provided by the district’s multi-track year-round schools, the magnet selection and placement process was again revised by lowering the crowding factor in Round One from 100% to 95% and in Round Four from to 85% to 60%. This change was made to increase the magnet applicant pool and provide more access to applicants from year-round schools whose membership/capacity percentages are lower than the district average in some cases. The 2-year average percentage of Level I and II students was dropped from the selection process for 2009-10 because changes in the state reading tests made multi-year comparisons meaningless and one year comparisons were considered unreliable. When the new reading tests and norms have been in place for two years this criteria will be reinstated. Finally, a new process of follow-up recruitment for under-enrolled magnet schools was implemented for magnet applicants who could not be placed in the program indicated as their first choice on their application. Staff in the Growth and Planning Department and the Magnet Programs Office worked together to identify schools that could accept additional applicants and schools that could lose additional students without hurting the diversity of the student population in the sending school. Staff from the Magnet Office then contacted the parents of students from the targeted schools who had applied but not been placed and remained on the waiting list for full magnet programs. The Magnet staff explained the availability of seats in other magnet schools and invited parents to modify their magnet application to include a program in which they could be placed. The results of this follow-up recruitment process are not known at the time this report is being compiled. The selection process for magnet schools for the 2009-10 school year for elementary schools was as follows:
55
The school and the WCPSS Growth and Planning Department determined the number of vacancies available; 90% of those vacancies were filled from valid applications in the priority order shown below and 10% of those vacancies were filled randomly from the entire applicant pool after priority applicants had been placed.
• Round One
o Live in a node where the SES (free or reduced-price lunch) percentage of elementary aged children is at or below the county average (33%) AND
o Assigned to a base school where the SES percentage of elementary aged children is at or below the county average AND
o Assigned to a base school that has a current crowding factor above 95% of the adjusted building capacity AND
o Submitted a valid application for the same program the previous year.
• Round Two
o Same as Round One with deletion of previous year’s application.
• Round Three
o Same as Round Two with the revision of the crowding factor to be above 85% of the adjusted building capacity.
• Round Four
o Assigned to a base school that has a crowding factor above 85% of the adjusted building capacity AND
o Assigned to a base school where the SES percentage of elementary aged children is less than 40% AND
The selection process for secondary schools was the same as for elementary schools with the following modifications:
First priority – Siblings of present magnet students identified on the intent form.
Second priority – Students currently attending a magnet school and have a magnet status, have a priority to attend a magnet school in the next grade configuration—middle or high school.