xxxviii iah congress - strona główna...
TRANSCRIPT

Editors:
Jarosław Kania
Ewa Kmiecik
Andrzej Zuber
University
of Silesia
Press 2010
XXXVIIIIAH Congress
Groundwater Quality Sustainability
Krakow, 12–17 September 2010
Extended Abstracts

abstract id: 175topic: 4
Mineral and thermal water
4.2Origin of mineral and thermal waters
title: Modelling of a pumping test conducted in the mixing zonebetween a thermal aquifer and a surface aquifer usingphysico-chemical parameters monitoring
author(s): Jean-Yves JosninLaboratoire EDYTEM UMR CNRS 5204 Universite de Savoie, France,[email protected]
Stéphanie GallinoLaboratoire EDYTEM UMR CNRS 5204 Universite de Savoie, France,[email protected]
keywords: thermal aquifer, pumping tests, hydrodynamical-thermal modelling, Aix-les-Bains,Alps
Krakow, Poland 2010
INTRODUCTION
The hydrodynamic behaviour of deep aquifers is often characterised using pumping tests that
are interpreted with the petroleum engineering formalism (pressure instead of hydraulic head,
artesian tests, permeability instead of hydraulic conductivity, etc.) (Bourdarot, 1996; Miller,
1979, Murphy et al., 1999). Moreover, for both petroleum pumping tests and geothermal pump-
ing tests, only the temperature is measured in addition to the pressure variation (linked to the
drawdown). We propose here to use both electric conductivity and temperature monitoring
during a pumping test in order to obtain some information about the hydrodynamic character-
istics and the position of a deep water plume emerging into a shallow aquifer. Indeed, the mix-
ing between deep waters with thermal characteristics and surface water is common in French
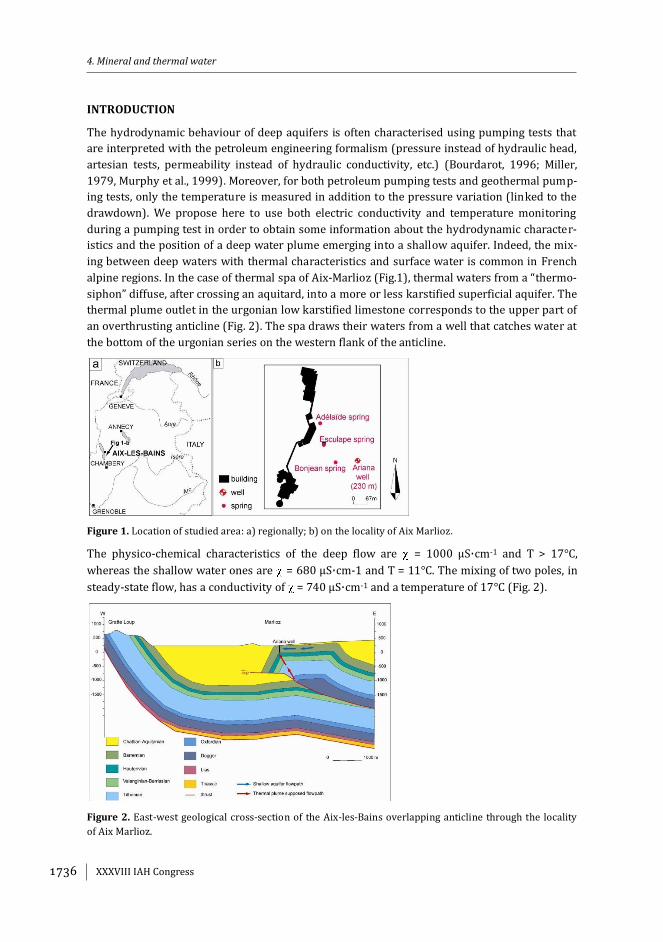
alpine regions. In the case of thermal spa of Aix-Marlioz (Fig.1), thermal waters from a “thermo-
siphon” diffuse, after crossing an aquitard, into a more or less karstified superficial aquifer. The
thermal plume outlet in the urgonian low karstified limestone corresponds to the upper part of
an overthrusting anticline (Fig. 2). The spa draws their waters from a well that catches water at
the bottom of the urgonian series on the western flank of the anticline.
Figure 1. Location of studied area: a) regionally; b) on the locality of Aix Marlioz.
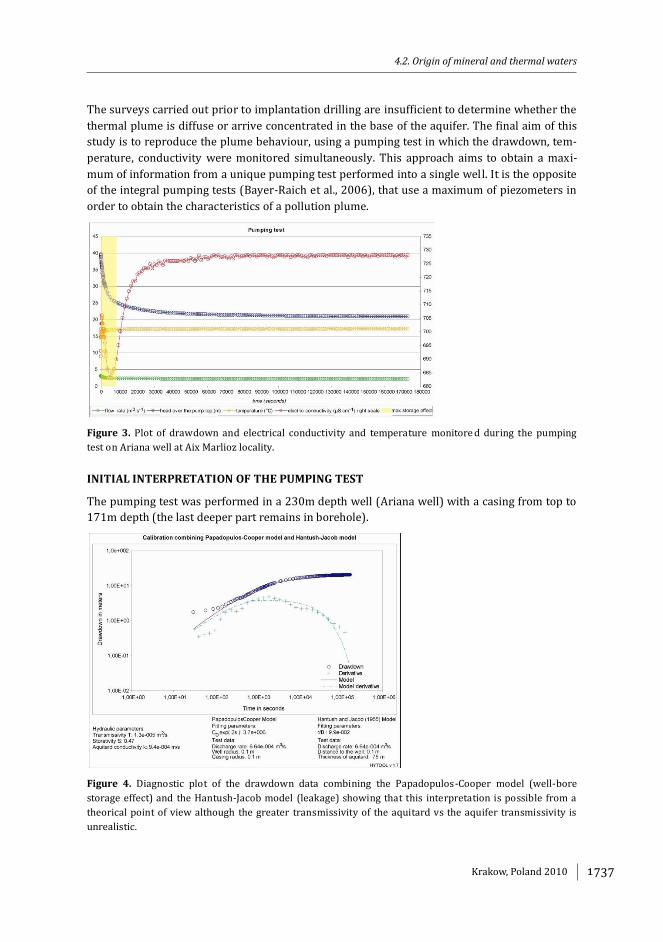
The physico-chemical characteristics of the deep flow are = 1000 μS·cm-1 and T > 17°C,
whereas the shallow water ones are = 680 μS·cm-1 and T = 11°C. The mixing of two poles, in
steady-state flow, has a conductivity of = 740 μS·cm-1 and a temperature of 17°C (Fig. 2).
Figure 2. East-west geological cross-section of the Aix-les-Bains overlapping anticline through the locality
of Aix Marlioz.
4. Mineral and thermal water
XXXVIII IAH Congress
The surveys carried out prior to implantation drilling are insufficient to determine whether the
thermal plume is diffuse or arrive concentrated in the base of the aquifer. The final aim of this
study is to reproduce the plume behaviour, using a pumping test in which the drawdown, tem-
perature, conductivity were monitored simultaneously. This approach aims to obtain a maxi-
mum of information from a unique pumping test performed into a single well. It is the opposite
of the integral pumping tests (Bayer-Raich et al., 2006), that use a maximum of piezometers in
order to obtain the characteristics of a pollution plume.
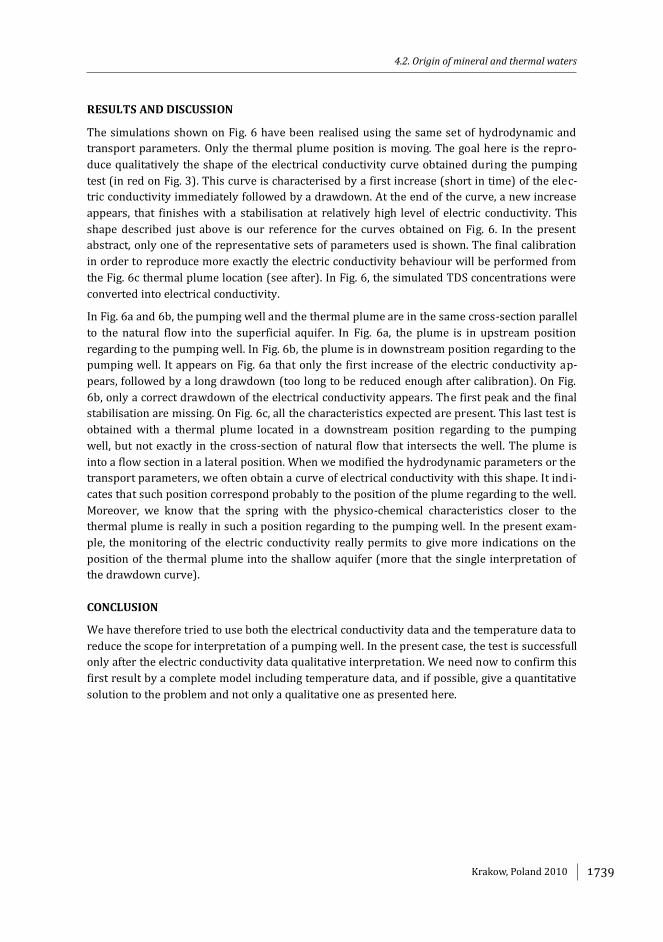
Figure 3. Plot of drawdown and electrical conductivity and temperature monitore d during the pumping
test on Ariana well at Aix Marlioz locality.
INITIAL INTERPRETATION OF THE PUMPING TEST
The pumping test was performed in a 230m depth well (Ariana well) with a casing from top to
171m depth (the last deeper part remains in borehole).
Figure 4. Diagnostic plot of the drawdown data combining the Papadopulos-Cooper model (well-bore
storage effect) and the Hantush-Jacob model (leakage) showing that this interpretation is possible from a
theorical point of view although the greater transmissivity of the aquitard vs the aquifer transmissivity is
unrealistic.
4.2. Origin of mineral and thermal waters
Krakow, Poland 2010

The results of monitoring are presented on Fig. 3. As expected (karst low developed), the draw-
down can be explained as an essay in porous media with a well-bore storage effect due to the
depth of the well (Papadopulos-Cooper) combined with a drainance (Hantush-Jacob) (see
Fig. 4). This classical interpretation from drawdown was carried out using Hytool (P. Renard,
Hytool, user manual, 2003) (see Fig. 4). However, the hydraulic conductivity obtained for the
aquitard is greater than that obtained for the aquifer, which is illogical. This is probably because
the aquifer is not clearly identified as a both fractured and weakly karstified aquifer (failure of
calibrations type Warren and Root). The interpretation of the pumping test using the draw-
down only led to an unsatisfactory result from a hydrodynamic point of view.
It may be noted on Fig. 3 that conductivity and temperature showed different behaviours at the
beginning of pumping. In particular, the temperature is stabilized 8 hours before the electrical
conductivity. This cannot be due to the well-bore storage effect because its duration is less than
1h30. The phenomenon observed on the electric conductivity curve is then related to the water
mixing in the media. On Fig. 3, the maximal time (beyond the theory) of the well-bore storage
effect duration is shown in yellow.
THE MODEL
Considering that we have frequently obtained differences between total mineralization behav-
iour and temperature behaviour with identical transport and hydraulic parameters, we focus in
the present abstract on the modelling total mineralization behaviour. The software used to
perform the modelling is Feflow (Diersch, 2002), which permits both flow, mass and heat
transport in saturated and unsaturated media. The calculations are done into finite element
mesh (Fig.5).
Figure 5. 3D finite element model of the Aix Marlioz locality around the Ariana well.
The information given during the drilling indicates a more fractured and productive zone be-
tween 170 and 180 m depth in the borehole. The information given by the field indicates that
the thermal plume can potentially be located downstream to the well in lateral position. Indeed,
the spring located upstream to the well (to the east) has chemical and thermal characteristics of
the shallow aquifer, when the springs located downstream (to the west) show intermediate
chemical facies that become closer to the thermal one from South to North.
4. Mineral and thermal water
XXXVIII IAH Congress
RESULTS AND DISCUSSION
The simulations shown on Fig. 6 have been realised using the same set of hydrodynamic and
transport parameters. Only the thermal plume position is moving. The goal here is the repro-
duce qualitatively the shape of the electrical conductivity curve obtained during the pumping
test (in red on Fig. 3). This curve is characterised by a first increase (short in time) of the elec-
tric conductivity immediately followed by a drawdown. At the end of the curve, a new increase
appears, that finishes with a stabilisation at relatively high level of electric conductivity. This
shape described just above is our reference for the curves obtained on Fig. 6. In the present
abstract, only one of the representative sets of parameters used is shown. The final calibration
in order to reproduce more exactly the electric conductivity behaviour will be performed from
the Fig. 6c thermal plume location (see after). In Fig. 6, the simulated TDS concentrations were
converted into electrical conductivity.
In Fig. 6a and 6b, the pumping well and the thermal plume are in the same cross-section parallel
to the natural flow into the superficial aquifer. In Fig. 6a, the plume is in upstream position
regarding to the pumping well. In Fig. 6b, the plume is in downstream position regarding to the
pumping well. It appears on Fig. 6a that only the first increase of the electric conductivity ap-
pears, followed by a long drawdown (too long to be reduced enough after calibration). On Fig.
6b, only a correct drawdown of the electrical conductivity appears. The first peak and the final
stabilisation are missing. On Fig. 6c, all the characteristics expected are present. This last test is
obtained with a thermal plume located in a downstream position regarding to the pumping
well, but not exactly in the cross-section of natural flow that intersects the well. The plume is
into a flow section in a lateral position. When we modified the hydrodynamic parameters or the
transport parameters, we often obtain a curve of electrical conductivity with this shape. It indi-
cates that such position correspond probably to the position of the plume regarding to the well.
Moreover, we know that the spring with the physico-chemical characteristics closer to the
thermal plume is really in such a position regarding to the pumping well. In the present exam-
ple, the monitoring of the electric conductivity really permits to give more indications on the
position of the thermal plume into the shallow aquifer (more that the single interpretation of
the drawdown curve).
CONCLUSION
We have therefore tried to use both the electrical conductivity data and the temperature data to
reduce the scope for interpretation of a pumping well. In the present case, the test is successfull
only after the electric conductivity data qualitative interpretation. We need now to confirm this
first result by a complete model including temperature data, and if possible, give a quantitative
solution to the problem and not only a qualitative one as presented here.
4.2. Origin of mineral and thermal waters
Krakow, Poland 2010
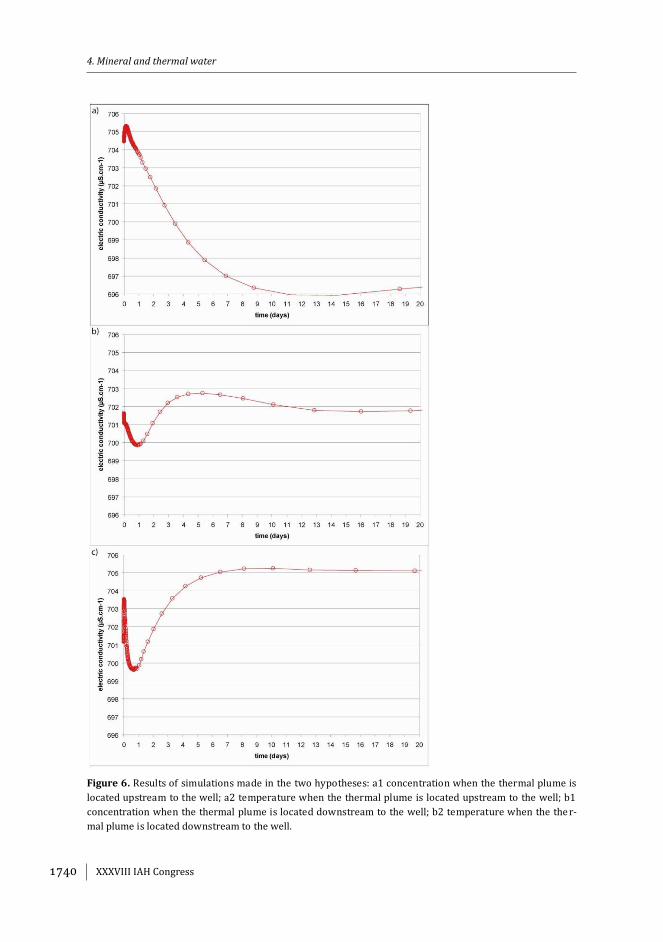
Figure 6. Results of simulations made in the two hypotheses: a1 concentration when the thermal plume is
located upstream to the well; a2 temperature when the thermal plume is located upstream to the well; b1
concentration when the thermal plume is located downstream to the well; b2 temperature when the the r-
mal plume is located downstream to the well.
4. Mineral and thermal water
XXXVIII IAH Congress

REFERENCES
Bayer-Raich M., Jarsjö J., Liedl R., Ptak T., Teutsch G., 2006: Integral pumping test analyses of
linearly sorbed groundwater contaminants using multiple wells. Inferring mass flows and natural
attenuation rates, Water Resour, Res. 42, W08411, doi:10.1029/2005WR004244.
Bourdarot G., 1996: Essais de puits: méthodes d’interprétation. Pumping tests: interpretation
methods. Editions Technip, 350 p. in French.
Diersch H.-J.G., 2002: Feflow, Finite Element subsurface FLOW and transport simulation system.
Reference Manual, WASY.
Miller C., 1979: Wellbore storage effects in geothermal wells. Master degree, Lawrence Berkeley
Laboratory, University of California, for the U.S. Department of Energy W-7405-ENG-48, 12p.
Renard P., 2003: Hytool v.1.3. Users manual, 10 p.
4.2. Origin of mineral and thermal waters
Krakow, Poland 2010

International Association of Hydrogeologists
AGH University of Science and Technology
2-vol. set + CD
ISSN 0208-6336
ISBN 978-83-226-1979-0