xps study of sulfur and phosphorus compounds with ... kim s. siow.pdf · keempat ditambah kepada...
TRANSCRIPT

Sains Malaysiana 47(8)(2018): 1913–1922 http://dx.doi.org/10.17576/jsm-2018-4708-33
XPS Study of Sulfur and Phosphorus Compounds with Different Oxidation States(Kajian XPS untuk Sebatian Sulfur dan Fosforus yang Mempunyai Pengoksidaan yang Berbeza)
KIM S. SIOW*, LEANNE BRITCHER, SUNIL KUMAR & HANS J GRIESSER
ABSTRACT
In this report, we demonstrate that continuous improvement in XPS instruments and the calibration standards as well as analysis with standard component-fitting procedures can be used to determine the binding energies of compounds containing phosphorus and sulfur of different oxidation states with higher confidence. Based on such improved XPS analyses, the binding energies (BEs) of S2p signals for sulfur of increasing oxidation state are determined to be 166-167.5 eV for S=O in dimethyl sulfoxide, 168.1 eV for S=O2 in polysulfone, 168.4 eV for SO3 in polystyrene sulfonate and 168.8 eV for SO4 in chondroitin sulfate. The BEs of P2p signals show the following values: 132.9 eV for PO3 in triisopropyl phosphite, 133.3 eV for PO4 in glycerol phosphate, 133.5 eV for PO4 in sodium tripolyphosphate and 134.0 eV for PO4 in sodium hexametaphosphate. These results showed that there are only small increases in the binding energy when additional oxygen atoms are added to the S-O chemical group. A similar result is obtained when the fourth oxygen or poly-phosphate environment is added to the phosphorus compound. These BE values are useful to researchers involved in identifying oxidation states of phosphorus and sulfur atoms commonly observed on modified surfaces and interfaces found in applications such as biomaterials, super-capacitors and catalysis.
Keywords: Binding energies; oxidation state; phosphorus; sulfur; XPS
ABSTRAK
Kajian ini menunjukkan bahawa penambahbaikan yang berterusan dalam spektroskopi foto-elektron x-ray (XPS), piawaian penentukuran dan prosedur pencocokan lengkung puncak, boleh menentukan tenaga pengikat untuk sebatian fosforus dan sulfur yang terdiri daripada pengoksidaan yang berbeza dengan lebih jitu. Berdasarkan analisis XPS ini, tenaga pengikat (BE) untuk puncak S2p daripada sebatian sulfur yang mempunyai pengoksidaan yang meningkat ialah: 166-167.5 eV untuk S=O dalam dimetil sulfoxida, 168.1 eV untuk S=O2 dalam poli-sulfon, 168.4 eV untuk SO3 dalam polistirena sulfonat dan 168.8 eV untuk SO4 dalam kondroitin sulfat. BE untuk puncak P2p daripada sebatian fosforus menunjukkan bacaan berikut: 132.9 eV untuk PO3 dalam tri-isopropil fosfit, 133.3 eV untuk PO4 dalam fosfat gliserol, 133.5 eV untuk PO4 dalam natrium tripolifosfat dan 134.0 eV untuk PO4 dalam natrium hexametafosfat. Keputusan ini menunjukkan bahawa hanya ada peningkatan yang kecil dalam tenaga pengikat (eV) apabila atom oksigen ditambah kepada sebatian yang diikat oleh S-O. Keputusan yang sama diperoleh apabila persekitaran oksigen atau poli-fosfat keempat ditambah kepada sebatian fosforus. Nilai BE untuk sebatian sulfur dan fosforus ini adalah berguna untuk para penyelidik yang cuba mengenal pasti sebatian yang lazim terdapat di atas permukaan dan antara-muka untuk aplikasi seperti bio-bahan, super-kapasitor dan mangkin.
Kata kunci: Fosforus; keadaan pengoksidaan; spektroskopi fotoelektron sinar-x; sulfur; tenaga pengikat
INTRODUCTION
In the past two decades, X-ray photoelectron spectroscopy (XPS) has emerged as a powerful surface analysis technique to quantify the chemical composition of surfaces of organic and inorganic materials. Several factors such as improvement in electronics, instrument design and calibration standards for binding energy (BE) determination, have played crucial roles in identifying various elements and their oxidation states with improved accuracy. The main aim of the calibration procedures was to minimize the uncertainties in the BE down to 0.1 - 0.2 eV, ensuring a meaningful comparison between XPS instruments, reliable component fitting for component synthesis, detection of chemical shift within the element
and to facilitate easy adoption of quality management system ISO9001 during XPS analysis (ASTM 2010). The continuous improvements result in different but presumably more ‘precise’ BE values being reported in the literature. It is, however, obvious that there are discrepancies in reported BE values and it can be difficult to identify which values are most reliable. In this study, we selected several organic and two inorganic compounds containing sulfur and phosphorus as part of our studies to identify accurate values for the BEs of S and P atoms in different oxidation states. The long history of BE measurement for sulfur (Lindberg et al. 1970) and phosphorus compounds (Pelavin et al. 1970) and their oxidation states motivate us to select these two

1914
elements. In addition, recent interest in using phosphorus and sulfur-containing surfaces for research on solar cells (Perkins 2009), catalysis (Seredych et al. 2012), super-capacitors (Wen et al. 2015) and biomaterials (Siow et al. 2015, 2014), also necessitate accurate determination of BEs for these two compounds. The variation in BE for organic compounds containing sulfur and phosphorus of different oxidation states are shown in Figures 1 and 2, respectively. Here we demonstrate that the widely used XPS component-fitting or signal synthesis of high resolution spectra (Fairley 2003; Fairley & Carrick 2005) is capable of resolving the overlapping components to obtain their respective binding energies within a single signal. Hence,
the accurate identification of sulfur and phosphorus compounds with different oxidation states can be made.
EXPERIMENTAL DETAILS
REFERENCE MATERIALS
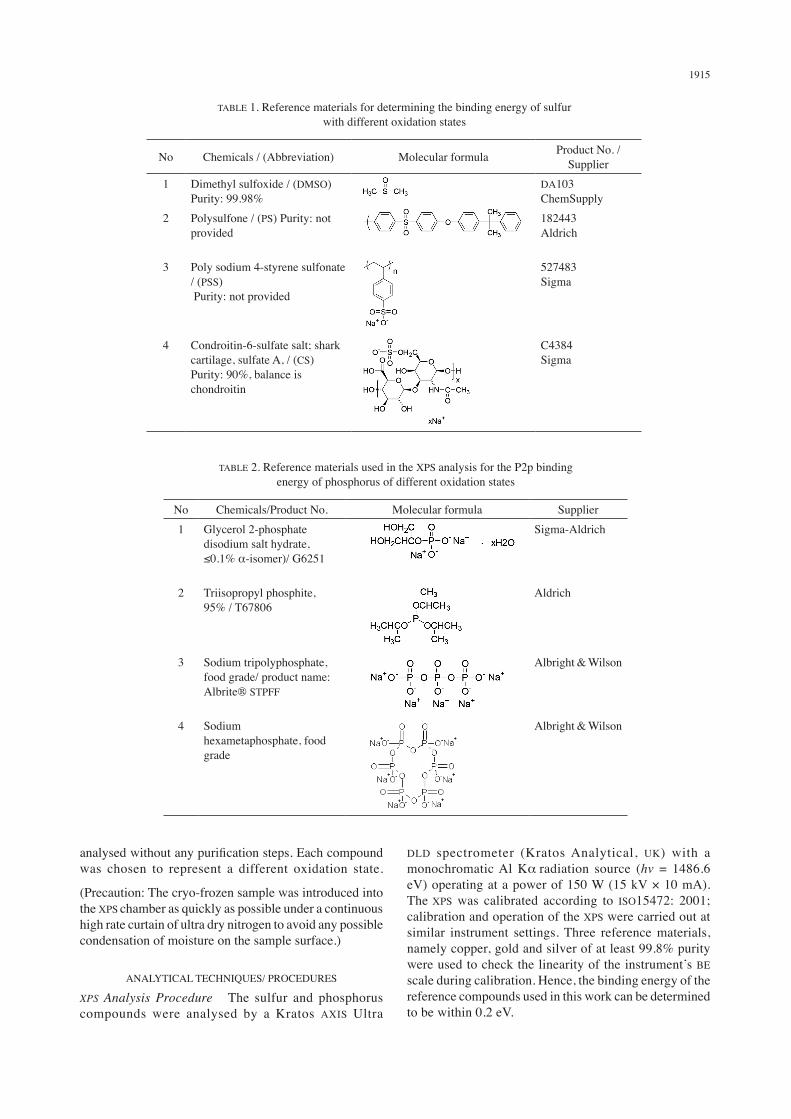
Tables 1 and 2 list the reference materials chosen to calibrate the binding energies of sulfur and phosphorus compounds with different oxidation states. The respective suppliers and molecular structures are also included in the tables. Dimethyl sulfoxide (DMSO) and triisopropyl phosphite (TIP) were subjected to cryo-freezing with liquid nitrogen before being analysed by XPS. All the reference compounds were
FIGURE 1. Binding energies of the S2p signal for organo-sulfur compounds with various oxidation states. All data have been normalized to a reference value of 285.0 eV for C-C and C-H components (Siow 2007)
FIGURE 2. Binding energies of the P2p signal for organo-phosphorus compounds with various oxidation states. All data have been normalized to a reference value of 285.0 eV for C-C and C-H components (Siow 2007)
1915
analysed without any purification steps. Each compound was chosen to represent a different oxidation state.
(Precaution: The cryo-frozen sample was introduced into the XPS chamber as quickly as possible under a continuous high rate curtain of ultra dry nitrogen to avoid any possible condensation of moisture on the sample surface.)
ANALYTICAL TECHNIQUES/ PROCEDURES
XPS Analysis Procedure The sulfur and phosphorus compounds were analysed by a Kratos AXIS Ultra
DLD spectrometer (Kratos Analytical, UK) with a monochromatic Al Ka radiation source (hv = 1486.6 eV) operating at a power of 150 W (15 kV × 10 mA). The XPS was calibrated according to ISO15472: 2001; calibration and operation of the XPS were carried out at similar instrument settings. Three reference materials, namely copper, gold and silver of at least 99.8% purity were used to check the linearity of the instrument’s BE scale during calibration. Hence, the binding energy of the reference compounds used in this work can be determined to be within 0.2 eV.
TABLE 1. Reference materials for determining the binding energy of sulfur with different oxidation states
No Chemicals / (Abbreviation) Molecular formula Product No. / Supplier
1 Dimethyl sulfoxide / (DMSO) Purity: 99.98%
DA103ChemSupply
2 Polysulfone / (PS) Purity: not provided
182443Aldrich
3 Poly sodium 4-styrene sulfonate / (PSS) Purity: not provided
527483Sigma
4 Condroitin-6-sulfate salt; shark cartilage, sulfate A, / (CS) Purity: 90%, balance is chondroitin
C4384Sigma
TABLE 2. Reference materials used in the XPS analysis for the P2p binding energy of phosphorus of different oxidation states
No Chemicals/Product No. Molecular formula Supplier1 Glycerol 2-phosphate
disodium salt hydrate, ≤0.1% α-isomer)/ G6251
Sigma-Aldrich
2 Triisopropyl phosphite, 95% / T67806
Aldrich
3 Sodium tripolyphosphate, food grade/ product name: Albrite® STPFF
Albright & Wilson
4 Sodium hexametaphosphate, food grade
Albright & Wilson

1916
After calibration, the compositional analyses of the phosphorus and sulfur compounds were recorded in survey mode at pass energy of 160 eV with a resolu tion of 1.0 eV for the energy range of 0 to 1100 eV. The dwell time for the survey scans was 50 ms and was repeated during the three scans. Another set of high-resolution signals of C1s, O1s, S2p and P2p with a resolution of 0.1 eV were recorded for the component-fitting exercise at pass energy of 20 eV. The dwell time for high resolution scans was 50 ms, repeated during the five scans. The BE window for each element varied accordingly and this is reflected in the next figures. The spectra did not show any evidence of radiation damage during the XPS analysis. The take-off angle of the XPS analysis was maintained at 90° to the sample surface. The pressure in the main chamber remained at less than 10-9 mbar during the XPS analysis. The XPS lens was operated in the hybrid mode.
Quantification of Elemental Composition Besides the binding energies, another important parameter used in this investigation is the atomic percentage concentrations of the different elements in the reference compounds. Although there are variations for the quantification of elements present (Andrade 1985), the general equation is: (Ratner et al. 2003)
Iij = KT(KE)Lij(γ)σij ni λ(KE) cosθ (1)
% ni = (2)
where Iij is the X-ray photoelectron flux (measured); K is the instrument constant; T(KE) is the transmission function of analyser; Lij(γ) is the angular asymmetry factor for orbital j of element i; σij is the photoionization cross section; ni is the concentration element i at distance z below the surface; λ(KE) is the inelastic mean free path; cosθ is the take-off angle of the photoelectrons measured with respect to the surface normal. Equations 1 and 2 assume a homogeneous material within the sampling depth. In most quantitative analyses, including those presented here, only the ratios and elemental percentages were calculated (Equation 2), rather than absolute intensities. Therefore, factors like the instrument constant cancelled out. Absolute XPS intensities are seldom used and are not necessary for the interpretation of the spectra generated for this publication. Instead of the Scofield photoionization cross-sections, the Kratos library of relative sensitivity factors was used throughout this quantification process for the spectra recorded. The Kratos library is an empirical library that incorporates angular asymmetry, the photoionization cross-section and an escape depth correction in the calculation. The escape depth correction refers to the influence of the inelastic mean free path λ(KE) in the quantification calculation (Fairley & Carrick 2005). The transmission
function is provided by the instrument software when the data files are analysed by the CasaXPS software version 2.3.12. The full width at half maximum (FWHM) values used for fitting the C1s, O1s, P2p and S2p signals were constrained to between 0.9 and 1.8 eV. The same FWHM was used for all components within a single signal to maintain consistency (Fairley 2003; Fairley & Carrick 2005). We used Gaussian-Lorentzian as the line shapes of the signals with 30% Lorentzian components and Shirley-type background throughout the analysis. This percentage of Lorentzian and Gaussian was selected as a compromise to account for the different compounds selected in this study as well as the instrumental settings of our XPS. Due to the doublet nature of the S2p signal, additional criteria were also applied during analysis and they were: The area under the S2p1/2 signal was half of the area under the S2p3/2 signal and the difference of binding energies between the two signals was set to 1.2 eV (Beamson & Briggs 1992; Lindberg et al. 1970). The same constraint on the area was applied to P2p but the BE difference between the P2p3/2 and P2p1/2 signals was set to 0.9 eV (Beamson & Briggs 1992; Lindberg et al. 1970). The C-C and C-H components of the component-fitted C1s spectra were charge-corrected to 285.0 eV to compensate for the over-correction of charging in the instrument’s neutraliser setting.
STANDARD DEVIATION OF XPS ATOMIC CONCENTRATIONS
The precision of an XPS instrument is more important than its accuracy in determining the binding energies and atomic ratios of reference materials. Hence, systematic errors associated with component fitting and instrumental settings are not included in this study. In the case of random errors, the uncertainty associated with the measured XPS atomic concentration of a given element is inversely related to the amount of that element present in the compound. We use the following rule-of-thumb for our calculations (Siow et al. 2009): When the atomic concentration was only about 1% or less, the standard deviation or uncertainty was deemed to be 20% of the measured atomic concentration. This standard deviation was considered to decrease to 10% of the value if the atomic concentration was between 1% and 5%. The uncertainty or standard deviation was deemed to be 5% of the atomic concentration if it exceeded 5%. An error of quotient, as per Equation 3, was used to calculate ratios such as S/O, S/C, P/O and P/C:
E quotient = (3) (Austin 1978)
‘A’ and ‘B’ are the variables. ‘EA’ and ‘EB’ are the errors of uncertainty/standard deviations associated with each atomic concentration. Within the context of this publication, the error of uncertainty is also known as the ‘standard deviation (stdev/sm)’ of the atomic concentration ratios.

1917
RESULTS AND DISCUSSION
SULFUR-CONTAINING REFERENCE MATERIALS
As shown in Figure 1, there are only three publications that attempted to provide binding energies for S in organo-sulfur compounds of lower oxidation states than SO3 or SO4
(Giroux & Cooper 1991; Seredych et al. 2012; Ward & Short 1994). The results of the reference compounds measured in this work are included in Table 3 for comparison with those published results. The component-fitted results for the S2p signals obtained from the XPS spectra of the sulfur-containing reference materials are shown in Figure 3. The increase in binding energies with increasing sulfur oxidation state is well-documented (Lindberg et al. 1970). In this study, the inclusion of third and fourth oxygen neighbour atoms did not increase binding energies of S substantially (Table 3).
One possible explanation is that the behaviour of oxygen binding to sulfur could be similar to silicon; the main binding energy shift occurs in the bonding of the first oxygen to the silicon (Alexander et al. 1996). Addition of a second and third oxygen atom only causes a small shift in the silicon binding energy (Alexander et al. 1996). The binding energies of polystyrene sulfonate and chondroitin sulfate are comparable with the results shown in Figure 1. The FWHMs of the signals recorded with sulfur containing reference materials also increased with an increase in oxidation states. The FWHM values of the S2p signals for DMSO (frozen) and polysulfone were found to be 0.80 eV, while the polystyrene sulfonate and chondroitin sulfate had FWHM values of 0.96 and 1.18 eV, respectively. Although constraint of the FWHM in a high resolution signal is a purely mathematical approach to ensure consistency (Fairley 2003; Fairley & Carrick 2005), the value of the FWHM normally indicates the complexity of the molecular
TABLE 3. Binding energies of sulfur with different oxidation states as measured on organic materials and component-fitted from Figure 3. *based on a BE assignment for the C-S bond of 286.5 eV
No Chemical groups
Binding energies of reference materials (eV)SO2 plasma treated
polyurethane (Giroux & Cooper 1991)
Vinyl sulfone plasma polymers (Ward &
Short 1994)
Sulfur or phosphorus adsorbed polymer
(Seredych et al. 2012)Current results
1 R2-S /H 165 163.5-164.0 163.5 -2i R2-SO /H 165 165.6- 166.4 164.5 -2ii R2-S=O 167.0 167.5
(dimethyl sulfoxide)*3 H/R2-SO2 168 167.4-168.2 168.0 168.1
(polysulfone)4 H/R2-SO3- 168 168-168.8 169.7 168.4
(polystyrene sulfonate)5 H/R-SO4 - - 168.8
(chondroitin sulfate)
FIGURE 3. Component-fitted S2p signals for chondroitin sulfate, styrene sulfonate, polysulfone and dimethyl sulfoxide (frozen). The C-C and C-H components of
corresponding C1s signals were fixed at 285.0 eV

1918
structure and heterogeneity of the compound (Harrison et al. 1992). Within the charge neutralization setup of our instrument, the different oxidation states of sulfur, phosphorus and carbon could be resolved with confidence. As shown in Table 1, DMSO has the simplest molecular structure amongst the four reference materials studied and hence the smallest FWHM. The FWHM values of the S2p signals did not differ from those of the C1s signals by more than 0.50 eV. The C1s signals recorded with DMSO (frozen), polysulfone, polystyrene sulfonate and chondroitin sulfate had FWHM values of 1.13, 1.15, 1.07 and 1.21 eV, respectively. The comparable FWHM values between C1s and S2p signals also suggest reasonable fitting and consistency of the components. Hence, the binding energies were considered to be accurate and reliable. Comparisons were made between elemental compositions of the reference materials with the calculated composition from their molecular formulae (Table 4). The ratios were not expected to be exactly the same because of various assumptions and elemental libraries used by the XPS software as discussed in the experimental section. This assumption is the likely reason for the difference between theoretical values and the XPS analysis of DMSO (frozen). Figure 4 shows the presence of a single carbon group at 286.5 eV that has been designated to the component related to C-S bonding based on similar bonding C-S from the
literature (Lin et al. 2000; Siow et al. 2009). Others have assigned the BE of the C-S bond to be 285 eV (Dietrich et al. 2011). Neither extreme accords with expectations based on electronegativity, which for S is in-between that of C and O. Accordingly, it would seem more reasonable to expect the C in C-S to have a BE intermediate between those of C in C-C and C-O. Hydrocarbon contributions from C in C-C and C-H are not present in the C1s signal despite the mismatch of the S/C ratios in theoretical and XPS analysis in Table 4. This designation of the C-S bond to a binding energy of 286.5 eV introduces a deviation of 1.5 eV to the measurement of the BE of the S=O bond reported in Table 3. Hence, the bonding energy of the S=O bond varies between 166.0 and 167.5 eV depending on the BE assignment of the C-S bond. This result compares favourably with published results in Figure 1. The XPS analyses and the theoretical ratios for chondroitin sulfate and styrene sulfonate were reasonably well matched, though the percentage of carbon was elevated possibly due to the presence of some adventitious carbon. Some oxidation might occur with polysulfone and polystyrene sulfonate as evident by the reduced S/O ratios. However, the C1s signal of polysulfone did not show any additional information during component-fitting because C-O bonds are present in the original molecular structure. Component-fitting of the C1s signal of polystyrene
TABLE 4. Atomic percentages and their elemental ratios recorded on reference materials containing sulfur
No Reference materials Elemental signals Elemental composition
XPS analysis Theoretical1 Dimethyl sulfoxide
(frozen) C1sS2pO1s
S2p / C1sS2p / O1s
53.7 ± 2.721.2 ± 1.125.1 ± 1.30.39 ± 0.030.84 ± 0.06
50.025.025.00.501.00
2 Polysulfone C1sS2pO1s
S2p / C1sS2p / O1s
85.1 ± 4.32.5 ± 0.312.4 ± 0.60.03 ± 0.000.20 ± 0.02
87.13.29.70.040.33
3 Poly sodium 4-styrene Sulfonate
C1sS2pO1sNa1s
S2p / C1sS2p / O1s
52.5 ± 2.66.4 ± 0.329.1 ± 1.512.0 ± 0.60.12 ± 0.010.22 ± 0.02
61.57.723.17.70.130.33
4 Condroitin-6-sulfate salt shark cartilage
C1sS2pO1sNa1sN1s
S2p / C1sS2p / O1s
51.2 ± 2.62.7 ± 0.334.6 ± 1.74.4 ± 0.47.1 ± 0.4
0.05 ± 0.010.08 ± 0.01
43.83.146.93.13.10.070.07

1919
FIGURE 4. Component-fitted C1s signals of chondroitin sulfate, styrene sulfonate, polysulfone and DMSO (frozen). The C-C
and C-H components were fixed at 285.0 eV
FIGURE 5. Component-fitted P2p signals for glycerol phosphate, sodiumtripolyphosphate and sodium hexametaphosphate. The
C-C and C-H components of corresponding C1s signals were fixed at 285.0 eV
FIGURE 6. Component fitted P2p signals of triisopropyl phosphite (frozen) for two different scenarios: (a) single doublet (b) two
doublets. The C-C and C-H components of corresponding C1s signals were fixed at 285.0 eV
sulfonate suggested some oxidation, in the form of C-O bonds (Figure 4).
PHOSPHORUS CONTAINING REFERENCE MATERIALS
This section discusses the binding energies of compounds containing PO4, PO3 and C-P groups. The component-fitted P2p signals of the phosphorus-containing reference materials chosen for this study are shown in Figures 5 and 6. The binding energies for the P2p3/2 signals recorded with sodium hexametaphosphate, sodium tripolyphosphate and glycerol phosphate samples were measured to be 134.0, 133.5 and 133.3 eV, respectively. Apart from sodium hexametaphosphate, the binding energies of sodium tripolyphosphate and glycerol phosphate appear to be lower than literature values for equivalent organo-phosphorus
compounds shown in Figure 2. These differences may reflect advances in instrumentation and the different procedures employed in the analysis. As shown in Figure 5, the FWHM of the P2p photoelectron signals for sodium hexametaphosphate, sodium tripolyphosphate and glycerol phosphate are 1.21, 1.25 and 1.37 eV, respectively. These P2p FWHM values agree well with the FWHM of the C1s signal of the same compounds, which were 1.34 eV (sodium hexametaphosphate), 1.14 eV (sodium tripolyphosphate) and 1.32 eV (glycerol phosphate). Figure 6 shows two possible scenarios for component-fitting of the P2p signal for the triisopropyl phosphate (TIP) frozen sample. If a single doublet is fitted to the P2p signal (Figure 6(a)), the FWHM is 1.76 eV. This FWHM of the P2p signal does not compare well with the FWHM of the C1s signal, which was 1.20 eV (Figure 7(a)). This difference suggested that the P2p signal is complicated by the superimposed presence of another doublet arising from P atoms with a higher oxidation state, such as PO4. The fit obtained with component fitting two doublets into the P2p signal is illustrated in Figure 6(b). The postulated presence of two doublets in the P2p signal reduces the FWHM of each to 1.15 eV, making the fit and binding energies more reasonable. Therefore, the binding energies for the P2p3/2 signals for the TIP (frozen) sample were determined to be 132.9 eV (assigned to the PO3 P) and 134.0 eV (assigned to PO4 P). The BE value for the PO3 P determined here is in the middle of the range of the reported values (Figure 2) whereas the value derived thus for P in PO4 is at the lower end of the range of the reported values. The observation of P with 4 oxygen neighbours suggested that the sourced TIP material is not as pure as stated by the supplier; evidently there exists an impurity with an oxidation state of PV as opposed to PIII in TIP. A possible candidate is tri-isopropyl-phosphate produced by the addition of one O onto the P. The intensity is too large to be consistent with the stated purity of 95%; according

1920
FIGURE 7. Component-fitted (a) C1s and (b) O1s signals for triisopropyl phosphite (frozen). Further details of the component-fitted C1s signal are presented in Figure 9. The C-C and C-H
components of corresponding C1s signals were fixed at 285.0 eV
FIGURE 8. Two possible molecular structures of oxidized TIP (frozen)
TABLE 5. Atomic percentages and their elemental ratios recorded on reference materials containing phosphorus
No Reference materials Elemental composition
Elemental signals XPS Calculated
1
Triisopropyl phosphite (frozen)
C1sP2pO1s
P2p / C1sP2p / O1s
65.5 ± 3.35.9 ± 0.328.6 ± 1.40.09 ± 0.010.21 ± 0.01
69.27.723.10.110.33
2 Glycerol 2-phosphate disodium salt
C1s P2pO1sNa1s
P2p / C1sP2p / O1s
26.0 ± 1.3 5.4 ± 0.358.5 ± 2.910.1 ± 0.50.21 ± 0.010.09 ± 0.01
25.0 8.350.016.70.330.17
3
Na tripolyphosphate
P2pO1sC1sNa1s
P2p / C1sP2p / O1s
8.8 ± 0.444.6 ± 2.225.3 ± 1.321.3 ± 1.10.35 ± 0.020.20 ± 0.01
16.755.60.027.8na
0.30
4
Na hexametaphosphate
P2pO1sC1sNa1s
P2p / C1sP2p / O1s
11.4 ± 0.652.0 ± 2.618.6 ± 0.918.0 ± 0.90.61 ± 0.040.22 ± 0.02
19.059.00.022.0na
0.32
to Figure 6(b), the ratio of phosphite to phosphate in TIP (frozen) is approximately 3 to 1. The P/O ratio of TIP (frozen) appears to support this possibility (Table 5) as the elemental percentages do not agree well with the theoretical values for TIP.
As shown in Table 5, the elemental compositions determined by XPS for the other reference materials also differed significantly from the theoretical values. The presence of a C signal in sodium tripolyphosphate and sodium hexametaphosphate indicates the presence of
The theoretical ratio of P/O in TIP (frozen) is 0.33 compared to 0.21 as determined by XPS. Two possible molecular structures of oxidised TIP are shown in Figure 8. It is difficult to fit the O1s signal, shown in Figure 7(b), as there were no appropriate reference data available for O in such structures and adjacent to P. When a single component was fitted to the O1s signal, a FWHM of 1.77 eV was obtained. As for the P2p signal, this FWHM value for O1s signal is substantially larger than that of the C1s signal (Figure 7(b)), which again suggests that the O1s signal may consist of two close-lying components.

1921
hydrocarbon contamination in those samples; it is not surprising that these high surface energy materials would avidly attract adventitious hydrocarbon contaminants. For the present purposes, such hydrocarbon contamination is considered inconsequential as it should not affect the binding energy of the P atoms, which these experiments aim to measure. On the contrary, this hydrocarbon contamination proved to be an advantage as it serves as a reference for determination of the magnitude of the charging, to fix C in C-C and C-H bonds at 285.0 eV. The P/O ratios of these two inorganic phosphates are higher than the calculated values. On the other hand, there is little hydrocarbon contamination of glycerol phosphate based on the P/C ratio. The component-fitting of the C1s signals of TIP (frozen) and glycerol phosphate is illustrated in Figure 9(a) and 9(b), respectively. According to Figure 9(a), the binding energy of C in the C-O-PO2R structure for TIP (frozen) is approximately 286.6 eV, which agrees reasonably well with values reported for similar bonds, at 286.4-5 eV (Beamson & Briggs 1992; Lin et al. 1999).
CONCLUSION
This paper demonstrates the ability of component-fitting procedures for resolving the binding energies of S and P atoms in organo-phosphorus/sulfur compounds with different oxidation states within their high-resolution spectra. The results showed that the binding energy of S in organo-sulfur compounds increases much less with each additional O neighbour after bonding of the first oxygen. A similar result is reported for phosphorus compounds. These small yet significant differences in binding energies serve as pointers for researchers in the field when searching for markers to distinguish the various oxidation states of phosphorus and organo-sulfur compounds.
ACKNOWLEDGEMENTS
This work was partially supported by the Australian Research Council via the Special Research Centre for Particle and Material Interfaces, including a Ph.D. scholarship for KSS. We also acknowledge the Ministry of Education, Malaysia for research grants GUP-2015-039 and Hi-COE Bio-MEMS AKU95.
REFERENCES
Alexander, M.R., Short, R.D., Jones, F.R., Stollenwerk, M., Zabold, J. & Michaeli, W. 1996. An x-ray photoelectron spectroscopic investigation into the chemical structure of deposits formed from hexamethyldisiloxane/oxygen plasmas. Journal of Materials Science 31(7): 1879-1885.
Andrade, J.D. 1985. Principles of protein adsorption. In Surface and Interfacial Aspects of Biomedical Polymers, edited by Andrade, J.D. New York: Plenum Press. pp. 1-80.
ASTM. 2010. E2108-10 Standard practice for calibration of the electron binding-energy scale of an x-ray photoelectron spectrometer. West Conshohocken, PA: ASTM.
Austin, B.B. 1978. Errors in Practical Measurement in Science, Engineering and Technology. New York: Wiley-Interscience Publication.
Beamson, G. & Briggs, D. 1992. High Resolution XPS of Organic Polymers. New York: Wiley.
Dietrich, P.M., Horlacher, T., Girard-Lauriault, P.L., Gross, T., Lippitz, A., Min, H., Wirth, T., Castille, R., Seeberger, P.H. & Unger, W.E.S. 2011. Adlayers of dimannoside thiols on gold: Surface chemical analysis. Langmuir 27(8): 4808-4815.
Fairley, N. 2003. XPS Lineshapes and Component Fitting in Surface Analysis by Auger and X-ray Photoelectron Spectroscopy. Chichester: IM Publications and SurfaceSpectra Limited.
Fairley, N. & Carrick, A. 2005. The Casa Cookbook: Part 1: Recipes for XPS Data Processing. Cheshire: Acolyte Science.
Giroux, T.A. & Cooper, S.L. 1991. Surface characterization of plasma-derivatized polyurethanes. Journal of Applied Polymer Science 43(1): 145-155.
Harrison, K. & Hazell, L.B. 1992. The determination of uncertainties in quantitative XPS/AES and its impact on data acquisition strategy. Surface and Interface Analysis 18(5): 368-376.
Lin, J.C. & Chuang, W.H. 2000. Synthesis, surface characterization, and platelet reactivity evaluation for the self-assembled monolayer of alkanethiol with sulfonic acid
FIGURE 9. Component-fitted C1s signals of (a) TIP (frozen) and (b) glycerol phosphate, showing the relevant carbon bonds and binding energies. The C-C and C-H components of corresponding
C1s signals were fixed at 285.0 eV
An additional component assigned to C-O-PO3R was fitted into the C1s signal of TIP (frozen). If the binding energy of C-O-PO3R bonds was set in the range of 287.0-287.2 eV, the ratio of C associated with C-C/C-H to C associated with C-O-PO2R approximate the theoretical ratio in the molecular formula of TIP. The best fit was obtained with the binding energy value for C linked to phosphate (C-O-PO3R) at 287.2 eV. If the same binding energy for C-O-PO3H2 of TIP (frozen) was used for fitting the C1s spectrum of glycerol phosphate, the ratio of the C in C-C/C-H groups to C in C-OH groups approximates the theoretical ratio in the molecular formula of glycerol phosphate. This best fit was also obtained by setting the binding energies of C=O bonds to 288.2 eV.

1922
functionality. Journal of Biomedical Materials Research 51(3): 413-423.
Lin, J.C., Chen, Y.F. & Chen, C.Y. 1999. Surface characterization and platelet adhesion studies of plasma polymerized phosphite and its copolymers with dimethylsulfate. Biomaterials 20(16): 1439-1447.
Lindberg, B.J., Hamrin, K., Johansson, G., Gelius, U., Fahlman, A., Nordling, C. & Siegbahn, K. 1970. Molecular spectroscopy by means of ESCA [electron spectroscopy for chemical analysis]. II. Sulfur compounds. Correlation of electron binding energy with structure. Physica Scripta 1(5-6): 286-298.
Pelavin, M., Hendrickson, D.N., Hollander, J.M. & Jolly, W.L. 1970. Phosphorus 2p electron binding energies. Correlation with extended Hueckel charges. Journal of Physical Chemistry 74(5): 1116-1121.
Perkins, C.L. 2009. Molecular anchors for self-assembled monolayers on zno: A direct comparison of the thiol and phosphonic acid moieties. Journal of Physical Chemistry C 113(42): 18276-18286.
Ratner, B.D., & Castner, D.G. 2003. Electron spectroscopy for chemical analysis. In Surface Analysis: The Principal Techniques, edited by Vickerman, J.C. Chichester: John Wiley and Sons. pp: 43-98.
Seredych, M., Wu, C.T., Brender, P., Ania, C.O., Vix-Guterl, C. & Bandosz, T.J. 2012. Role of phosphorus in carbon matrix in desulfurization of diesel fuel using adsorption process. Fuel 92(1): 318-326.
Siow, K.S. 2007. Plasma based methods for producing controlled polymer surfaces with sulfur and phosphorus containing chemical groups and interactions between such surfaces and proteins. PhD thesis. Ian Wark Research Institute, University of South Australia (Unpublished).
Siow, K.S., Kumar, S. & Griesser, H.J. 2015. Low-pressure plasma methods for generating non-reactive hydrophilic and hydrogel-like bio-interface coatings - a review. Plasma Processes and Polymers 12(1): 8-24.
Siow, K.S., Leanne, B., Sunil, K. & Hans, J.G. 2014. Deposition and XPS and FTIR analysis of plasma polymer coatings containing phosphorus. Plasma Process Polymer 11(2): 133-141.
Siow, K.S., Britcher, L., Kumar, S. & Griesser, H.J. 2009. Sulfonated surfaces by sulfur dioxide plasma surface treatment of plasma polymer films. Plasma Process Polymer 6(9): 583-592.
Ward, A.J. & Short, R.D. 1994. A spectroscopic analysis of plasma polymers prepared from a series of vinyl sulfones. Surface and Interface Analysis 22(1-12): 477-482.
Wen, Y., Wang, B., Huang, C., Wang, L. & Hulicova-Jurcakova, D. 2015. Synthesis of phosphorus-doped graphene and its wide potential window in aqueous supercapacitors. Chemistry - A European Journal 21(1): 80-85.
Kim S Siow*, Leanne Britcher, Sunil Kumar & Hans J GriesserIan Wark Research InstituteUniversity of South AustraliaMawson Lakes, SA 5095Australia
Kim S SiowInstitute of Microengineering and NanoelectronicsUniversiti Kebangsaan Malaysia43600 UKM Bangi, Selangor Darul EhsanMalaysia
Sunil KumarCoatings Mantra Science and Technology Consulting11 Beresina PlaceGreenwith, Adelaide, SA 5125Australia
Hans J GriesserMawson InstituteUniversity of South AustraliaMawson Lakes, SA 5095Australia
*Corresponding author; email: [email protected]
Received: 9 February 2018Accepted: 14 March 2018