xmm–newton observations of bright rosat selected active galactic nuclei with low intrinsic...
TRANSCRIPT
Mon. Not. R. Astron. Soc. 365, 688–698 (2006) doi:10.1111/j.1365-2966.2005.09755.x
XMM–Newton observations of bright ROSAT selected active galacticnuclei with low intrinsic absorption
L. C. Gallo,1� I. Lehmann,1 W. Pietsch,1 Th. Boller,1 W. Brinkmann,1
P. Friedrich1 and D. Grupe2
1Max-Planck-Institut fur extraterrestrische Physik, Postfach 1312, 85741 Garching, Germany2Department of Astronomy and Astrophysics, The Pennsylvania State University, 525 Davey Lab, University Park, PA 16802, USA
Accepted 2005 October 14. Received 2005 October 13; in original form 2005 April 6
ABSTRACTWe present a sample of 21 ROSAT bright active galactic nuclei (AGNs), representing a rangeof spectral classes, and selected for follow-up snapshot observations with XMM–Newton. Thetypical exposure was between 5 and 10 ks. The objects were primarily selected on the basesof X-ray brightness and not on hardness ratio; thus the sample cannot be strictly defined as a‘soft’sample. One of the main outcomes from the XMM–Newton observations was that all ofthe AGN, including 11 type 1.8–2 objects, required low levels of intrinsic absorption (N H �1021 cm−2). The low absorption in type 2 systems is a challenge to account for in the standardorientation-based unification model, and we discuss possible physical and geometrical modelswhich could elucidate the problem. Moreover, there does not appear to be any relation betweenthe strength and shape of the soft excess, and the spectral classification of the AGN in thissample. We further identify a number of AGN which deserve deeper observations or furtheranalysis: for example, the low-ionization nuclear emission regions (LINERs) NGC 5005 andNGC 7331, where optically thin thermal and extended emission is detected, and the narrow-lineSeyfert 1 II Zw 177, which shows a broad emission feature at ∼ 5.8 keV.
Key words: galaxies: active – galaxies: nuclei – X-rays: galaxies.
1 I N T RO D U C T I O N
Orientation-based unification models adopt the same physical emis-sion process in all active galactic nuclei (AGNs), attributing the ap-parent diversity to line-of-sight obscuration. The crux of the modelis a dense, obscuring torus. When our line of sight crosses the torus,emission from the accretion disc and broad-line region (BLR) isobscured, and we identify objects as type 2 AGN. When we see thetorus face-on, our view of the accretion disc and BLR is unobscuredand we recognize a type 1 AGN. There is substantial evidence,mostly based on the detection of the BLR in polarized light (e.g.Antonucci & Miller 1985), that this model is correct in distinguish-ing between type 1 and type 2 AGNs.
There are two pieces of compelling X-ray evidence in support ofthis model (e.g. Awaki et al. 1991; Moran et al. 2001). First, in mosttype 2 Seyferts the direct continuum below 2–3 keV is highly ab-sorbed, indicating that the X-rays transverse a large column density(N H � 1023 cm−2) as expected from a torus. Secondly, a reflectioncomponent is often detected in Seyfert 2s. It is primarily identifiedby the presence of a strong Fe Kα fluorescence line, which is pro-duced when the primary X-rays reflect off the cold inner walls of
�E-mail: [email protected]
the putative torus. Heavily absorbed AGNs are not likely to exhibitmany of the X-ray properties seen in type 1 AGN (e.g. relativisticlines, rapid variability, soft excess emission), which are associatedwith the innermost regions of the accretion disc.
Recently, X-ray observations have been presented which compli-cate matters. Objects which are clearly identified by optical meansas type 2 AGN, nevertheless exhibit type 1 AGN behaviour in theX-rays (e.g. Pappa et al. 2001; Panessa & Bassani 2002, hereafterPB02; Barcons, Carrera & Ceballos 2003; Boller et al. 2003; Matt,Guainazzi & Maiolino 2003; Risaliti et al. 2005). The apparent lackof emission from the BLR and low intrinsic absorption measured inthe X-rays is a challenge to explain with orientation-based unifiedmodels. It requires that we preferentially obscure the BLR whileviewing the accretion disc directly.
We present a small sample of AGNs observed with XMM–Newton(Jansen et al. 2001) that cover a range of spectral types. The ob-jects were all detected with ROSAT and most were optically ob-served in a follow-up survey by Pietsch et al. (1998) and Bischoff(2004). The benefit of such a soft X-ray selected sample is that it al-lows the identification and investigation of intrinsic low-absorptiontype 2 systems, which do not clearly fit into the orientation-basedunification scheme. In addition, we identify a number of AGNs,which are individually interesting and certainly warrant deeperobservations.
C© 2005 The Authors. Journal compilation C© 2005 RAS
XMM–Newton observations of ROSAT selected AGN 689
2 S A M P L E S E L E C T I O N
Cross correlation of the ROSAT All Sky Survey (RASS; Voges et al.1999) source catalogue with the Catalogue of Principal Galaxies(Paturel et al. 1989) yielded 904 X-ray sources with galaxy coun-terparts (Zimmermann et al. 2001). Follow-up optical spectroscopywas conducted to identify many of the X-ray bright objects. Manywere identified for the first time as active galaxies, resulting in thediscovery of >100 nearby AGN (Pietsch et al. 1998; Bischoff 2004).
We have compiled 24 XMM–Newton observations of 21 AGNsfrom this sample with the intention of studying AGN unification.Most of the objects were observed as part of the guaranteed timeallocated to the XMM–Newton telescope scientist. The objects wereselected for follow-up observations because they were:
(i) bright in the RASS energy band (0.1–2 keV) with countrates > 0.1 count s−1 (corresponding to a 0.5–2 keV flux >
10−12 erg cm−2 s−1 for a standard AGN power-law spectrum with� = 2);
(ii) nearby (z < 0.129; 〈z〉 = 0.04);(iii) observed through a relatively low Galactic column
(<1021 cm−2).
As such, a reasonable broad-band (0.3–10 keV) spectrum couldbe obtained with a typical exposure of 5–10 ks. To acquire repre-sentation from all AGN spectral types, a few objects were retrievedfrom the XMM–Newton science archive. In total, the sample in-
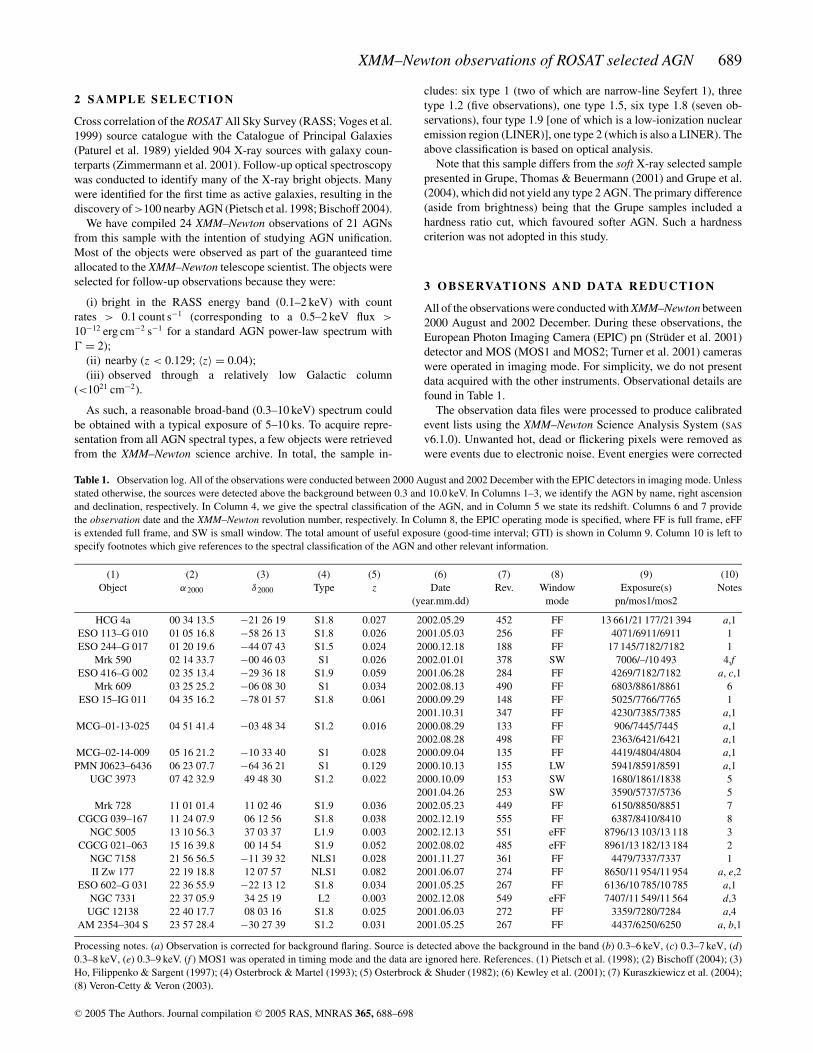
Table 1. Observation log. All of the observations were conducted between 2000 August and 2002 December with the EPIC detectors in imaging mode. Unlessstated otherwise, the sources were detected above the background between 0.3 and 10.0 keV. In Columns 1–3, we identify the AGN by name, right ascensionand declination, respectively. In Column 4, we give the spectral classification of the AGN, and in Column 5 we state its redshift. Columns 6 and 7 providethe observation date and the XMM–Newton revolution number, respectively. In Column 8, the EPIC operating mode is specified, where FF is full frame, eFFis extended full frame, and SW is small window. The total amount of useful exposure (good-time interval; GTI) is shown in Column 9. Column 10 is left tospecify footnotes which give references to the spectral classification of the AGN and other relevant information.
(1) (2) (3) (4) (5) (6) (7) (8) (9) (10)Object α2000 δ2000 Type z Date Rev. Window Exposure(s) Notes
(year.mm.dd) mode pn/mos1/mos2
HCG 4a 00 34 13.5 −21 26 19 S1.8 0.027 2002.05.29 452 FF 13 661/21 177/21 394 a,1ESO 113–G 010 01 05 16.8 −58 26 13 S1.8 0.026 2001.05.03 256 FF 4071/6911/6911 1ESO 244–G 017 01 20 19.6 −44 07 43 S1.5 0.024 2000.12.18 188 FF 17 145/7182/7182 1
Mrk 590 02 14 33.7 −00 46 03 S1 0.026 2002.01.01 378 SW 7006/–/10 493 4,fESO 416–G 002 02 35 13.4 −29 36 18 S1.9 0.059 2001.06.28 284 FF 4269/7182/7182 a, c,1
Mrk 609 03 25 25.2 −06 08 30 S1 0.034 2002.08.13 490 FF 6803/8861/8861 6ESO 15–IG 011 04 35 16.2 −78 01 57 S1.8 0.061 2000.09.29 148 FF 5025/7766/7765 1
2001.10.31 347 FF 4230/7385/7385 a,1MCG–01-13-025 04 51 41.4 −03 48 34 S1.2 0.016 2000.08.29 133 FF 906/7445/7445 a,1
2002.08.28 498 FF 2363/6421/6421 a,1MCG–02-14-009 05 16 21.2 −10 33 40 S1 0.028 2000.09.04 135 FF 4419/4804/4804 a,1PMN J0623–6436 06 23 07.7 −64 36 21 S1 0.129 2000.10.13 155 LW 5941/8591/8591 a,1
UGC 3973 07 42 32.9 49 48 30 S1.2 0.022 2000.10.09 153 SW 1680/1861/1838 52001.04.26 253 SW 3590/5737/5736 5
Mrk 728 11 01 01.4 11 02 46 S1.9 0.036 2002.05.23 449 FF 6150/8850/8851 7CGCG 039–167 11 24 07.9 06 12 56 S1.8 0.038 2002.12.19 555 FF 6387/8410/8410 8
NGC 5005 13 10 56.3 37 03 37 L1.9 0.003 2002.12.13 551 eFF 8796/13 103/13 118 3CGCG 021–063 15 16 39.8 00 14 54 S1.9 0.052 2002.08.02 485 eFF 8961/13 182/13 184 2
NGC 7158 21 56 56.5 −11 39 32 NLS1 0.028 2001.11.27 361 FF 4479/7337/7337 1II Zw 177 22 19 18.8 12 07 57 NLS1 0.082 2001.06.07 274 FF 8650/11 954/11 954 a, e,2
ESO 602–G 031 22 36 55.9 −22 13 12 S1.8 0.034 2001.05.25 267 FF 6136/10 785/10 785 a,1NGC 7331 22 37 05.9 34 25 19 L2 0.003 2002.12.08 549 eFF 7407/11 549/11 564 d,3UGC 12138 22 40 17.7 08 03 16 S1.8 0.025 2001.06.03 272 FF 3359/7280/7284 a,4
AM 2354–304 S 23 57 28.4 −30 27 39 S1.2 0.031 2001.05.25 267 FF 4437/6250/6250 a, b,1
Processing notes. (a) Observation is corrected for background flaring. Source is detected above the background in the band (b) 0.3–6 keV, (c) 0.3–7 keV, (d)0.3–8 keV, (e) 0.3–9 keV. (f ) MOS1 was operated in timing mode and the data are ignored here. References. (1) Pietsch et al. (1998); (2) Bischoff (2004); (3)Ho, Filippenko & Sargent (1997); (4) Osterbrock & Martel (1993); (5) Osterbrock & Shuder (1982); (6) Kewley et al. (2001); (7) Kuraszkiewicz et al. (2004);(8) Veron-Cetty & Veron (2003).
cludes: six type 1 (two of which are narrow-line Seyfert 1), threetype 1.2 (five observations), one type 1.5, six type 1.8 (seven ob-servations), four type 1.9 [one of which is a low-ionization nuclearemission region (LINER)], one type 2 (which is also a LINER). Theabove classification is based on optical analysis.
Note that this sample differs from the soft X-ray selected samplepresented in Grupe, Thomas & Beuermann (2001) and Grupe et al.(2004), which did not yield any type 2 AGN. The primary difference(aside from brightness) being that the Grupe samples included ahardness ratio cut, which favoured softer AGN. Such a hardnesscriterion was not adopted in this study.
3 O B S E RVAT I O N S A N D DATA R E D U C T I O N
All of the observations were conducted with XMM–Newton between2000 August and 2002 December. During these observations, theEuropean Photon Imaging Camera (EPIC) pn (Struder et al. 2001)detector and MOS (MOS1 and MOS2; Turner et al. 2001) cameraswere operated in imaging mode. For simplicity, we do not presentdata acquired with the other instruments. Observational details arefound in Table 1.
The observation data files were processed to produce calibratedevent lists using the XMM–Newton Science Analysis System (SAS
v6.1.0). Unwanted hot, dead or flickering pixels were removed aswere events due to electronic noise. Event energies were corrected
C© 2005 The Authors. Journal compilation C© 2005 RAS, MNRAS 365, 688–698
690 L. C. Gallo et al.
for charge-transfer losses, and response matrices were generated foreach spectrum using the SAS tasks ARFGEN and RMFGEN. Light curveswere extracted from these event lists to search for periods of highbackground flaring. Background flaring was problematic in severalobservations. Data which were corrected for background flaring areindicated in Table 1. The source plus background photons wereextracted from a circular region with a radius of 35 arcsec, and thebackground was selected from an off-source region with a radius of50 arcsec and appropriately scaled to the source region. Single anddouble events were selected for the pn and single-quadruple eventsfor the MOS. The data quality flag was set to zero (i.e. events nextto a CCD edge or bad pixel were omitted).
4 S P E C T R A L A NA LY S I S
Each AGN spectrum was compared to the respective backgroundspectrum to determine the energy range in which the source was
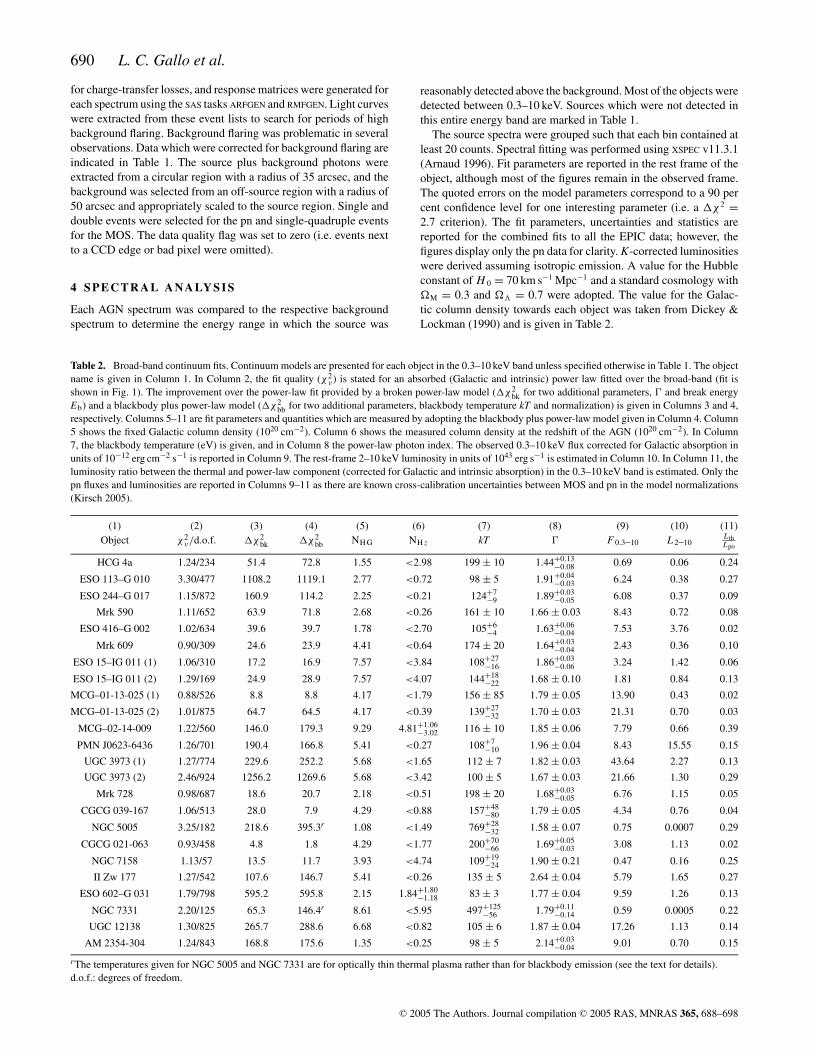
Table 2. Broad-band continuum fits. Continuum models are presented for each object in the 0.3–10 keV band unless specified otherwise in Table 1. The objectname is given in Column 1. In Column 2, the fit quality (χ2
ν ) is stated for an absorbed (Galactic and intrinsic) power law fitted over the broad-band (fit isshown in Fig. 1). The improvement over the power-law fit provided by a broken power-law model (�χ2
bk for two additional parameters, � and break energyEb) and a blackbody plus power-law model (�χ2
bb for two additional parameters, blackbody temperature kT and normalization) is given in Columns 3 and 4,respectively. Columns 5–11 are fit parameters and quantities which are measured by adopting the blackbody plus power-law model given in Column 4. Column5 shows the fixed Galactic column density (1020 cm−2). Column 6 shows the measured column density at the redshift of the AGN (1020 cm−2). In Column7, the blackbody temperature (eV) is given, and in Column 8 the power-law photon index. The observed 0.3–10 keV flux corrected for Galactic absorption inunits of 10−12 erg cm−2 s−1 is reported in Column 9. The rest-frame 2–10 keV luminosity in units of 1043 erg s−1 is estimated in Column 10. In Column 11, theluminosity ratio between the thermal and power-law component (corrected for Galactic and intrinsic absorption) in the 0.3–10 keV band is estimated. Only thepn fluxes and luminosities are reported in Columns 9–11 as there are known cross-calibration uncertainties between MOS and pn in the model normalizations(Kirsch 2005).
(1) (2) (3) (4) (5) (6) (7) (8) (9) (10) (11)Object χ2
ν/d.o.f. �χ2bk �χ2
bb NH G NH z kT � F 0.3–10 L 2–10L thLpo
HCG 4a 1.24/234 51.4 72.8 1.55 <2.98 199 ± 10 1.44+0.13−0.08 0.69 0.06 0.24
ESO 113–G 010 3.30/477 1108.2 1119.1 2.77 <0.72 98 ± 5 1.91+0.04−0.03 6.24 0.38 0.27
ESO 244–G 017 1.15/872 160.9 114.2 2.25 <0.21 124+7−9 1.89+0.03
−0.05 6.08 0.37 0.09
Mrk 590 1.11/652 63.9 71.8 2.68 <0.26 161 ± 10 1.66 ± 0.03 8.43 0.72 0.08
ESO 416–G 002 1.02/634 39.6 39.7 1.78 <2.70 105+6−4 1.63+0.06
−0.04 7.53 3.76 0.02
Mrk 609 0.90/309 24.6 23.9 4.41 <0.64 174 ± 20 1.64+0.03−0.04 2.43 0.36 0.10
ESO 15–IG 011 (1) 1.06/310 17.2 16.9 7.57 <3.84 108+27−16 1.86+0.03
−0.06 3.24 1.42 0.06
ESO 15–IG 011 (2) 1.29/169 24.9 28.9 7.57 <4.07 144+18−22 1.68 ± 0.10 1.81 0.84 0.13
MCG–01-13-025 (1) 0.88/526 8.8 8.8 4.17 <1.79 156 ± 85 1.79 ± 0.05 13.90 0.43 0.02
MCG–01-13-025 (2) 1.01/875 64.7 64.5 4.17 <0.39 139+27−32 1.70 ± 0.03 21.31 0.70 0.03
MCG–02-14-009 1.22/560 146.0 179.3 9.29 4.81+1.06−3.02 116 ± 10 1.85 ± 0.06 7.79 0.66 0.39
PMN J0623-6436 1.26/701 190.4 166.8 5.41 <0.27 108+7−10 1.96 ± 0.04 8.43 15.55 0.15
UGC 3973 (1) 1.27/774 229.6 252.2 5.68 <1.65 112 ± 7 1.82 ± 0.03 43.64 2.27 0.13
UGC 3973 (2) 2.46/924 1256.2 1269.6 5.68 <3.42 100 ± 5 1.67 ± 0.03 21.66 1.30 0.29
Mrk 728 0.98/687 18.6 20.7 2.18 <0.51 198 ± 20 1.68+0.03−0.05 6.76 1.15 0.05
CGCG 039-167 1.06/513 28.0 7.9 4.29 <0.88 157+48−80 1.79 ± 0.05 4.34 0.76 0.04
NGC 5005 3.25/182 218.6 395.3r 1.08 <1.49 769+28−32 1.58 ± 0.07 0.75 0.0007 0.29
CGCG 021-063 0.93/458 4.8 1.8 4.29 <1.77 200+70−66 1.69+0.05
−0.03 3.08 1.13 0.02
NGC 7158 1.13/57 13.5 11.7 3.93 <4.74 109+19−24 1.90 ± 0.21 0.47 0.16 0.25
II Zw 177 1.27/542 107.6 146.7 5.41 <0.26 135 ± 5 2.64 ± 0.04 5.79 1.65 0.27
ESO 602–G 031 1.79/798 595.2 595.8 2.15 1.84+1.80−1.18 83 ± 3 1.77 ± 0.04 9.59 1.26 0.13
NGC 7331 2.20/125 65.3 146.4r 8.61 <5.95 497+125−56 1.79+0.11
−0.14 0.59 0.0005 0.22
UGC 12138 1.30/825 265.7 288.6 6.68 <0.82 105 ± 6 1.87 ± 0.04 17.26 1.13 0.14
AM 2354-304 1.24/843 168.8 175.6 1.35 <0.25 98 ± 5 2.14+0.03−0.04 9.01 0.70 0.15
rThe temperatures given for NGC 5005 and NGC 7331 are for optically thin thermal plasma rather than for blackbody emission (see the text for details).d.o.f.: degrees of freedom.
reasonably detected above the background. Most of the objects weredetected between 0.3–10 keV. Sources which were not detected inthis entire energy band are marked in Table 1.
The source spectra were grouped such that each bin contained atleast 20 counts. Spectral fitting was performed using XSPEC v11.3.1(Arnaud 1996). Fit parameters are reported in the rest frame of theobject, although most of the figures remain in the observed frame.The quoted errors on the model parameters correspond to a 90 percent confidence level for one interesting parameter (i.e. a �χ 2 =2.7 criterion). The fit parameters, uncertainties and statistics arereported for the combined fits to all the EPIC data; however, thefigures display only the pn data for clarity. K-corrected luminositieswere derived assuming isotropic emission. A value for the Hubbleconstant of H 0 = 70 km s−1 Mpc−1 and a standard cosmology with�M = 0.3 and � = 0.7 were adopted. The value for the Galac-tic column density towards each object was taken from Dickey &Lockman (1990) and is given in Table 2.
C© 2005 The Authors. Journal compilation C© 2005 RAS, MNRAS 365, 688–698

XMM–Newton observations of ROSAT selected AGN 691
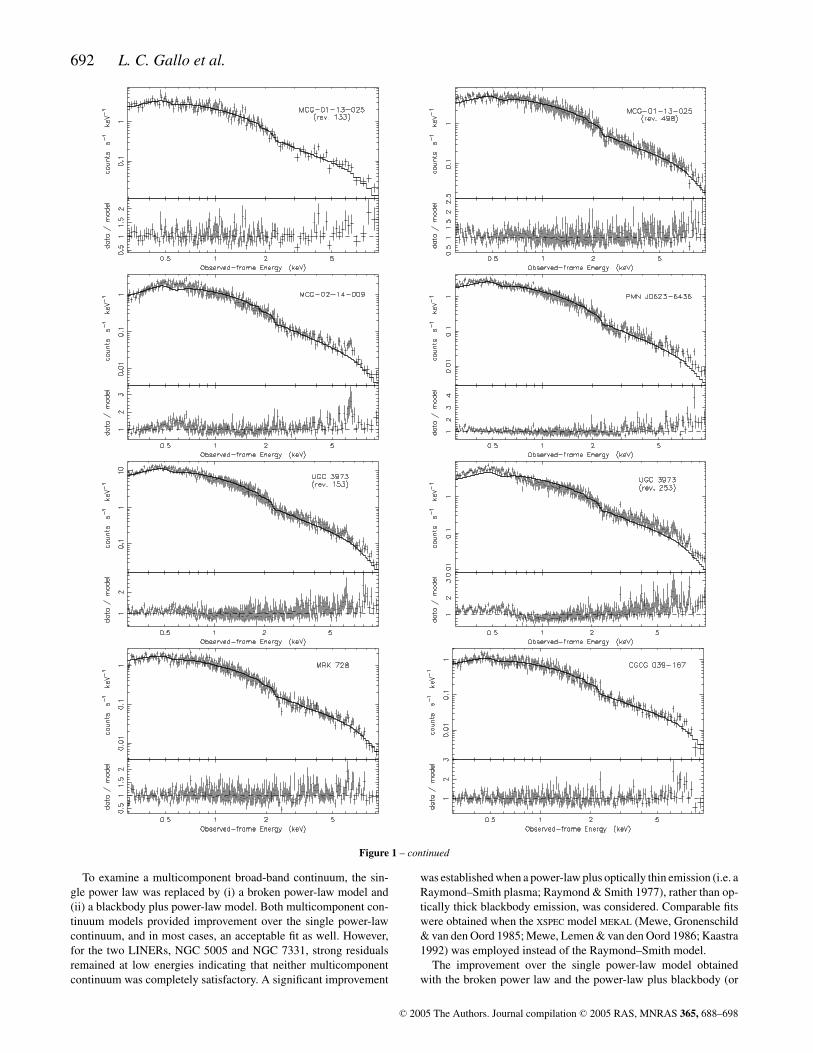
Figure 1. The broad-band (0.3–10 keV, unless stated differently in Table 1) spectrum fitted with an absorbed (Galactic and intrinsic) power law and theresiduals (data/model) resulting from the fit. For clarity, only the pn data are shown. As the fit statistics are dominated by the low-energy photons (E � 3 keV),excess residuals will most likely appear at higher energies.
4.1 The broad-band X-ray continuum
As a first approximation, the 0.3–10 keV spectrum of each objectwas fitted with a single power law which was shaped by a fixedGalactic column density (Dickey & Lockman 1990) and a free in-
trinsic column density. This simple fit is plotted in Fig. 1 for eachAGN, and the quality of the fits are reported in Column 2 of Table 2.For four objects, Mrk 728, Mrk 609, CGCG 021–063 and MCG–01-13-025, this simple model provided a statistically acceptable fit(χ2
ν ≈ 1).
C© 2005 The Authors. Journal compilation C© 2005 RAS, MNRAS 365, 688–698
692 L. C. Gallo et al.
Figure 1 – continued
To examine a multicomponent broad-band continuum, the sin-gle power law was replaced by (i) a broken power-law model and(ii) a blackbody plus power-law model. Both multicomponent con-tinuum models provided improvement over the single power-lawcontinuum, and in most cases, an acceptable fit as well. However,for the two LINERs, NGC 5005 and NGC 7331, strong residualsremained at low energies indicating that neither multicomponentcontinuum was completely satisfactory. A significant improvement
was established when a power-law plus optically thin emission (i.e. aRaymond–Smith plasma; Raymond & Smith 1977), rather than op-tically thick blackbody emission, was considered. Comparable fitswere obtained when the XSPEC model MEKAL (Mewe, Gronenschild& van den Oord 1985; Mewe, Lemen & van den Oord 1986; Kaastra1992) was employed instead of the Raymond–Smith model.
The improvement over the single power-law model obtainedwith the broken power law and the power-law plus blackbody (or
C© 2005 The Authors. Journal compilation C© 2005 RAS, MNRAS 365, 688–698

XMM–Newton observations of ROSAT selected AGN 693
Figure 1 – continued
Raymond–Smith) models are shown in Columns 3 and 4 of Table 2,respectively.
For simplicity, the thermal continuum models are adopted for theremaining analysis in order to characterize the individual spectra andgeneralize the sample. Implications of this decision are discussedin Section 6.1. The resulting best-fitting parameters are provided inTable 2.
4.2 Additional spectral features
4.2.1 High-energy emission features
The most common emission features in the 2–10 keV band of AGNspectra are those of iron between 6.4–6.97 keV (depending on theionization state of Fe). The width and profile of the line can poten-tially reveal its physical origin. If the line is emitted from the BLR
C© 2005 The Authors. Journal compilation C© 2005 RAS, MNRAS 365, 688–698

694 L. C. Gallo et al.
Table 3. Additional spectral features on the blackbody plus power-law continuum shown in Table 2. The object name is given inColumn 1. In Columns 2–4, the parameters energy, width and equivalent width are given for a modelled emission line (Gaussianprofile). The improvement to the continuum fit by adding an emission line is given in Column 5. Columns 6 and 7 are the energyand optical depth of an absorption edge added to the continuum model. In Column 8, the fit improvement obtained by adding anedge is stated. Values marked with an f indicate that the parameter was fixed. In Columns 5 and 8, the values in brackets indicatethe number of free parameters added to improve the fit.
(1) (2) (3) (4) (5) (6) (7) (8)Object E line σ EW �χ2
line Eedge τ �χ2edge
(keV) (eV) (eV) (eV)
HCG 4a 6.93+0.07−0.14 1 f 453+196
−122 9.0 (2) – – –
ESO 244–G 017 6.41+0.04−0.05 1 f 141+12
−16 14.2 (2) – – –
Mrk 590 6.38 ± 0.05 94+72−77 255+24
−13 27.2 (3) – – –
ESO 015–IG 011 (2) 6.45+0.14−0.07 1 f 495+130
−59 11.2 (2) – – –
MCG–02-14-009 6.52+0.10−0.16 177+193
−118 386+147−81 18.0 (3) 751 ± 37 0.32+0.14
−0.13 14.5(2)
UGC 3973 (1) 6.34+0.07−0.10 1 f 97+7
−16 8.5 (2) – – –
UGC 3973 (2) 6.41+0.03−0.04 111+78
−61 176+14−18 23.5 (3) 725 ± 13 0.45+0.10
−0.08 51.9(2)
Mrk 728 6.37 ± 0.08 1 f 141+50−45 12.4 (2) – – –
CGCG 039-167 6.45+0.05−0.07 1 f 141+8
−12 6.9 (2) – – –
II Zw 177 5.75+0.89−0.93 1168+1313
−443 995+1515−198 10.8 (3) – – –
ESO 602–G 031 6.40 ± 0.05 1 f 140 ± 11 16.5 (2) 687+15−16 0.39+0.13
−0.08 52.6(2)
UGC 12139 6.34+0.07−0.05 1 f 124+4
−11 14.2 (2) 731 ± 16 0.32 ± 0.10 30.4(2)
or the molecular torus the width would be narrow and unresolved inthe XMM–Newton pn spectrum, which has a resolution of ∼150 eV[full width at half-maximum (FWHM) at 7 keV; Ehle et al. 2004]. Onthe other hand, a significantly broadened and asymmetric profile canbe manifested from a line emitted in the inner accretion disc closeto the putative supermassive black hole.
Emission features in the high-energy spectra are examined forby adding a Gaussian profile to the continuum model discussedabove. Initially, the linewidth was fixed intrinsically narrow (σ =1 eV). Subsequently, the width parameter was allowed to vary todetermine if it improved the fit. In the interest of brevity, we do nottest the significance of possible detections in a robust manner (e.g.Protassov et al. 2002), instead we claim a detection ‘(marginally)significant’if it meets the criterion �χ2 > 3 for one additional freeparameter. Further, detailed analysis of these spectra should theninclude a more rigorous investigation of the significance of theseline detections, in particular for the marginal cases. The objectswhich satisfy our criteria for a line detection are reported in Table 3.The distribution of line energies and equivalent widths in the sampleis presented in Fig. 2.
4.2.2 Warm absorber-type features
Imprinted on the X-ray continuum of some AGN are features asso-ciated with absorption and/or emission from optically thin ionizedgas along the line of sight, the so-called warm absorber. It was men-tioned that the two LINERs in the sample (NGC 5005 and NGC7331) were better fitted when emission associated with an opticallythin ionized gas was considered. In type 1 AGN, the most prominentfeatures associated with this warm absorber are the O VII and O VIII
absorption edges at 739 and 871 eV, respectively.To examine warm absorption, an absorption edge was added to
the best-fitting continuum model of each object. Following the crite-ria of ‘significance’ established for the high-energy emission lines(see Section 4.2.1), significant detections of absorption edges arereported in four objects (Table 3).
5.5 6 6.5 7
Rest Energy (keV)
100
1000
Equ
ival
ent W
idth
(eV
)
Figure 2. The equivalent widths and rest-frame energies of the detectedemission features in the sample. The vertical dashed lines correspond tothe energy of neutral (6.4 keV) and completely (6.97 keV) ionized Fe Kα.The open circles are associated with intrinsically narrow lines and the filledcircles with broad lines.
5 T I M I N G B E H AV I O U R
An investigation of X-ray variability in the sample was not entirelypractical primarily due to the short exposures and gaps (arising frombackground flaring) in the light curves of many sources. Moreover,rapid variability is not normally expected from type 2 AGN, giventhe high level of absorption usually associated with them. How-ever, as a matter of completeness we did conduct a simple testfor any extreme, possibly atypical, behaviour. Light curves werecreated for each AGN in the 0.2–10 keV range and binned 100 s.Each light curve was then compared to a constant using a χ2-test.Only two light curves were found inconsistent with a constant at>99.9 per cent.
ESO 113–G 010, a Seyfert 1.8, demonstrated fluctuations of about±15 per cent during the short (<5 ks) observation. In combination
C© 2005 The Authors. Journal compilation C© 2005 RAS, MNRAS 365, 688–698
XMM–Newton observations of ROSAT selected AGN 695
with the extreme soft excess and ∼5.4 keV emission feature (seeSection 6.3.3), the variability in this Seyfert 1.8 certainly adds to itsintrigue.
The second object was the Seyfert 1.5, ESO 244–G 017, whichhad the longest observation in our sample (∼20 ks). Given the dura-tion of the observation, the variability cannot be considered atypical.However, a modest flare-like event in which the flux increases by∼50 per cent in ∼5000 s was detected, and was accompanied bymild spectral softening.
6 D I S C U S S I O N
6.1 Soft excess emission and neutral intrinsic absorption
It is beyond the scope of this study to make strong claims aboutthe physical nature of the X-ray continuum, in particular the natureof the soft excess. We note that in all cases the multicomponentcontinuum was an improvement to the absorbed power-law model,though it was not always a statistical necessity. Furthermore, nosingle model (i.e. Comptonization or thermal) stood out as a betterfit to the low-energy spectra in the sample. Sometimes the thermalplus power-law model was better than the broken power law, othertimes the opposite was true.
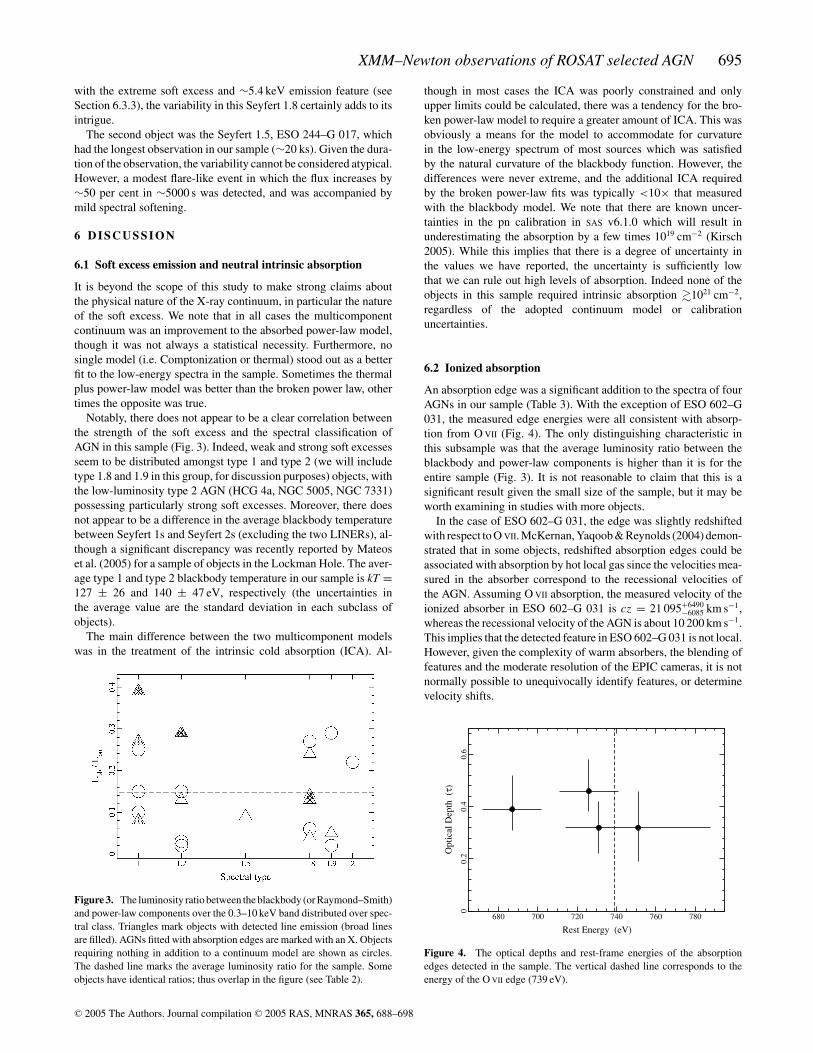
Notably, there does not appear to be a clear correlation betweenthe strength of the soft excess and the spectral classification ofAGN in this sample (Fig. 3). Indeed, weak and strong soft excessesseem to be distributed amongst type 1 and type 2 (we will includetype 1.8 and 1.9 in this group, for discussion purposes) objects, withthe low-luminosity type 2 AGN (HCG 4a, NGC 5005, NGC 7331)possessing particularly strong soft excesses. Moreover, there doesnot appear to be a difference in the average blackbody temperaturebetween Seyfert 1s and Seyfert 2s (excluding the two LINERs), al-though a significant discrepancy was recently reported by Mateoset al. (2005) for a sample of objects in the Lockman Hole. The aver-age type 1 and type 2 blackbody temperature in our sample is kT =127 ± 26 and 140 ± 47 eV, respectively (the uncertainties inthe average value are the standard deviation in each subclass ofobjects).
The main difference between the two multicomponent modelswas in the treatment of the intrinsic cold absorption (ICA). Al-
Figure 3. The luminosity ratio between the blackbody (or Raymond–Smith)and power-law components over the 0.3–10 keV band distributed over spec-tral class. Triangles mark objects with detected line emission (broad linesare filled). AGNs fitted with absorption edges are marked with an X. Objectsrequiring nothing in addition to a continuum model are shown as circles.The dashed line marks the average luminosity ratio for the sample. Someobjects have identical ratios; thus overlap in the figure (see Table 2).
though in most cases the ICA was poorly constrained and onlyupper limits could be calculated, there was a tendency for the bro-ken power-law model to require a greater amount of ICA. This wasobviously a means for the model to accommodate for curvaturein the low-energy spectrum of most sources which was satisfiedby the natural curvature of the blackbody function. However, thedifferences were never extreme, and the additional ICA requiredby the broken power-law fits was typically <10× that measuredwith the blackbody model. We note that there are known uncer-tainties in the pn calibration in SAS v6.1.0 which will result inunderestimating the absorption by a few times 1019 cm−2 (Kirsch2005). While this implies that there is a degree of uncertainty inthe values we have reported, the uncertainty is sufficiently lowthat we can rule out high levels of absorption. Indeed none of theobjects in this sample required intrinsic absorption �1021 cm−2,regardless of the adopted continuum model or calibrationuncertainties.
6.2 Ionized absorption
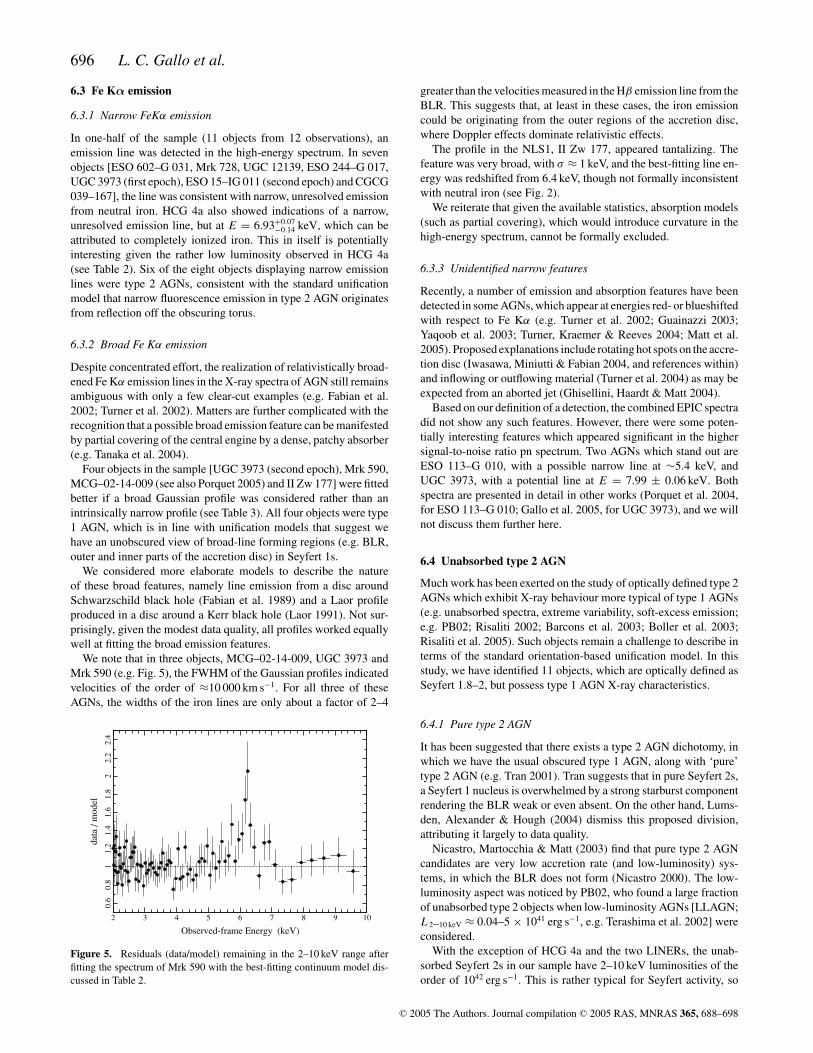
An absorption edge was a significant addition to the spectra of fourAGNs in our sample (Table 3). With the exception of ESO 602–G031, the measured edge energies were all consistent with absorp-tion from O VII (Fig. 4). The only distinguishing characteristic inthis subsample was that the average luminosity ratio between theblackbody and power-law components is higher than it is for theentire sample (Fig. 3). It is not reasonable to claim that this is asignificant result given the small size of the sample, but it may beworth examining in studies with more objects.
In the case of ESO 602–G 031, the edge was slightly redshiftedwith respect to O VII. McKernan, Yaqoob & Reynolds (2004) demon-strated that in some objects, redshifted absorption edges could beassociated with absorption by hot local gas since the velocities mea-sured in the absorber correspond to the recessional velocities ofthe AGN. Assuming O VII absorption, the measured velocity of theionized absorber in ESO 602–G 031 is cz = 21 095+6490
−6085 km s−1,whereas the recessional velocity of the AGN is about 10 200 km s−1.This implies that the detected feature in ESO 602–G 031 is not local.However, given the complexity of warm absorbers, the blending offeatures and the moderate resolution of the EPIC cameras, it is notnormally possible to unequivocally identify features, or determinevelocity shifts.
680 700 720 740 760 780
Rest Energy (eV)
00.
20.
40.
6
Opt
ical
Dep
th (
τ)
Figure 4. The optical depths and rest-frame energies of the absorptionedges detected in the sample. The vertical dashed line corresponds to theenergy of the O VII edge (739 eV).
C© 2005 The Authors. Journal compilation C© 2005 RAS, MNRAS 365, 688–698
696 L. C. Gallo et al.
6.3 Fe Kα emission
6.3.1 Narrow FeKα emission
In one-half of the sample (11 objects from 12 observations), anemission line was detected in the high-energy spectrum. In sevenobjects [ESO 602–G 031, Mrk 728, UGC 12139, ESO 244–G 017,UGC 3973 (first epoch), ESO 15–IG 011 (second epoch) and CGCG039–167], the line was consistent with narrow, unresolved emissionfrom neutral iron. HCG 4a also showed indications of a narrow,unresolved emission line, but at E = 6.93+0.07
−0.14 keV, which can beattributed to completely ionized iron. This in itself is potentiallyinteresting given the rather low luminosity observed in HCG 4a(see Table 2). Six of the eight objects displaying narrow emissionlines were type 2 AGNs, consistent with the standard unificationmodel that narrow fluorescence emission in type 2 AGN originatesfrom reflection off the obscuring torus.
6.3.2 Broad Fe Kα emission
Despite concentrated effort, the realization of relativistically broad-ened Fe Kα emission lines in the X-ray spectra of AGN still remainsambiguous with only a few clear-cut examples (e.g. Fabian et al.2002; Turner et al. 2002). Matters are further complicated with therecognition that a possible broad emission feature can be manifestedby partial covering of the central engine by a dense, patchy absorber(e.g. Tanaka et al. 2004).
Four objects in the sample [UGC 3973 (second epoch), Mrk 590,MCG–02-14-009 (see also Porquet 2005) and II Zw 177] were fittedbetter if a broad Gaussian profile was considered rather than anintrinsically narrow profile (see Table 3). All four objects were type1 AGN, which is in line with unification models that suggest wehave an unobscured view of broad-line forming regions (e.g. BLR,outer and inner parts of the accretion disc) in Seyfert 1s.
We considered more elaborate models to describe the natureof these broad features, namely line emission from a disc aroundSchwarzschild black hole (Fabian et al. 1989) and a Laor profileproduced in a disc around a Kerr black hole (Laor 1991). Not sur-prisingly, given the modest data quality, all profiles worked equallywell at fitting the broad emission features.
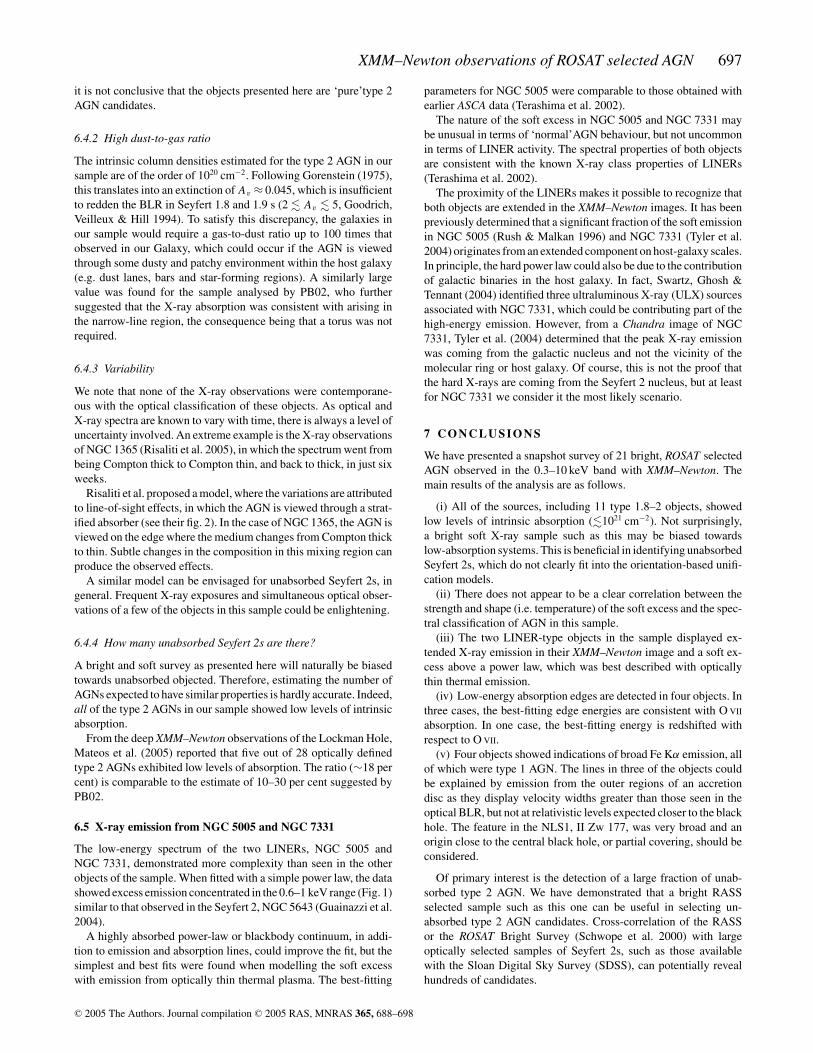
We note that in three objects, MCG–02-14-009, UGC 3973 andMrk 590 (e.g. Fig. 5), the FWHM of the Gaussian profiles indicatedvelocities of the order of ≈10 000 km s−1. For all three of theseAGNs, the widths of the iron lines are only about a factor of 2–4
2 3 4 5 6 7 8 9 10
Observed-frame Energy (keV)
0.6
0.8
11.
21.
41.
61.
82
2.2
2.4
data
/ m
odel
Figure 5. Residuals (data/model) remaining in the 2–10 keV range afterfitting the spectrum of Mrk 590 with the best-fitting continuum model dis-cussed in Table 2.
greater than the velocities measured in the Hβ emission line from theBLR. This suggests that, at least in these cases, the iron emissioncould be originating from the outer regions of the accretion disc,where Doppler effects dominate relativistic effects.
The profile in the NLS1, II Zw 177, appeared tantalizing. Thefeature was very broad, with σ ≈ 1 keV, and the best-fitting line en-ergy was redshifted from 6.4 keV, though not formally inconsistentwith neutral iron (see Fig. 2).
We reiterate that given the available statistics, absorption models(such as partial covering), which would introduce curvature in thehigh-energy spectrum, cannot be formally excluded.
6.3.3 Unidentified narrow features
Recently, a number of emission and absorption features have beendetected in some AGNs, which appear at energies red- or blueshiftedwith respect to Fe Kα (e.g. Turner et al. 2002; Guainazzi 2003;Yaqoob et al. 2003; Turner, Kraemer & Reeves 2004; Matt et al.2005). Proposed explanations include rotating hot spots on the accre-tion disc (Iwasawa, Miniutti & Fabian 2004, and references within)and inflowing or outflowing material (Turner et al. 2004) as may beexpected from an aborted jet (Ghisellini, Haardt & Matt 2004).
Based on our definition of a detection, the combined EPIC spectradid not show any such features. However, there were some poten-tially interesting features which appeared significant in the highersignal-to-noise ratio pn spectrum. Two AGNs which stand out areESO 113–G 010, with a possible narrow line at ∼5.4 keV, andUGC 3973, with a potential line at E = 7.99 ± 0.06 keV. Bothspectra are presented in detail in other works (Porquet et al. 2004,for ESO 113–G 010; Gallo et al. 2005, for UGC 3973), and we willnot discuss them further here.
6.4 Unabsorbed type 2 AGN
Much work has been exerted on the study of optically defined type 2AGNs which exhibit X-ray behaviour more typical of type 1 AGNs(e.g. unabsorbed spectra, extreme variability, soft-excess emission;e.g. PB02; Risaliti 2002; Barcons et al. 2003; Boller et al. 2003;Risaliti et al. 2005). Such objects remain a challenge to describe interms of the standard orientation-based unification model. In thisstudy, we have identified 11 objects, which are optically defined asSeyfert 1.8–2, but possess type 1 AGN X-ray characteristics.
6.4.1 Pure type 2 AGN
It has been suggested that there exists a type 2 AGN dichotomy, inwhich we have the usual obscured type 1 AGN, along with ‘pure’type 2 AGN (e.g. Tran 2001). Tran suggests that in pure Seyfert 2s,a Seyfert 1 nucleus is overwhelmed by a strong starburst componentrendering the BLR weak or even absent. On the other hand, Lums-den, Alexander & Hough (2004) dismiss this proposed division,attributing it largely to data quality.
Nicastro, Martocchia & Matt (2003) find that pure type 2 AGNcandidates are very low accretion rate (and low-luminosity) sys-tems, in which the BLR does not form (Nicastro 2000). The low-luminosity aspect was noticed by PB02, who found a large fractionof unabsorbed type 2 objects when low-luminosity AGNs [LLAGN;L 2–10 keV ≈ 0.04–5 × 1041 erg s−1, e.g. Terashima et al. 2002] wereconsidered.
With the exception of HCG 4a and the two LINERs, the unab-sorbed Seyfert 2s in our sample have 2–10 keV luminosities of theorder of 1042 erg s−1. This is rather typical for Seyfert activity, so
C© 2005 The Authors. Journal compilation C© 2005 RAS, MNRAS 365, 688–698
XMM–Newton observations of ROSAT selected AGN 697
it is not conclusive that the objects presented here are ‘pure’type 2AGN candidates.
6.4.2 High dust-to-gas ratio
The intrinsic column densities estimated for the type 2 AGN in oursample are of the order of 1020 cm−2. Following Gorenstein (1975),this translates into an extinction of Av ≈ 0.045, which is insufficientto redden the BLR in Seyfert 1.8 and 1.9 s (2 � Av � 5, Goodrich,Veilleux & Hill 1994). To satisfy this discrepancy, the galaxies inour sample would require a gas-to-dust ratio up to 100 times thatobserved in our Galaxy, which could occur if the AGN is viewedthrough some dusty and patchy environment within the host galaxy(e.g. dust lanes, bars and star-forming regions). A similarly largevalue was found for the sample analysed by PB02, who furthersuggested that the X-ray absorption was consistent with arising inthe narrow-line region, the consequence being that a torus was notrequired.
6.4.3 Variability
We note that none of the X-ray observations were contemporane-ous with the optical classification of these objects. As optical andX-ray spectra are known to vary with time, there is always a level ofuncertainty involved. An extreme example is the X-ray observationsof NGC 1365 (Risaliti et al. 2005), in which the spectrum went frombeing Compton thick to Compton thin, and back to thick, in just sixweeks.
Risaliti et al. proposed a model, where the variations are attributedto line-of-sight effects, in which the AGN is viewed through a strat-ified absorber (see their fig. 2). In the case of NGC 1365, the AGN isviewed on the edge where the medium changes from Compton thickto thin. Subtle changes in the composition in this mixing region canproduce the observed effects.
A similar model can be envisaged for unabsorbed Seyfert 2s, ingeneral. Frequent X-ray exposures and simultaneous optical obser-vations of a few of the objects in this sample could be enlightening.
6.4.4 How many unabsorbed Seyfert 2s are there?
A bright and soft survey as presented here will naturally be biasedtowards unabsorbed objected. Therefore, estimating the number ofAGNs expected to have similar properties is hardly accurate. Indeed,all of the type 2 AGNs in our sample showed low levels of intrinsicabsorption.
From the deep XMM–Newton observations of the Lockman Hole,Mateos et al. (2005) reported that five out of 28 optically definedtype 2 AGNs exhibited low levels of absorption. The ratio (∼18 percent) is comparable to the estimate of 10–30 per cent suggested byPB02.
6.5 X-ray emission from NGC 5005 and NGC 7331
The low-energy spectrum of the two LINERs, NGC 5005 andNGC 7331, demonstrated more complexity than seen in the otherobjects of the sample. When fitted with a simple power law, the datashowed excess emission concentrated in the 0.6–1 keV range (Fig. 1)similar to that observed in the Seyfert 2, NGC 5643 (Guainazzi et al.2004).
A highly absorbed power-law or blackbody continuum, in addi-tion to emission and absorption lines, could improve the fit, but thesimplest and best fits were found when modelling the soft excesswith emission from optically thin thermal plasma. The best-fitting
parameters for NGC 5005 were comparable to those obtained withearlier ASCA data (Terashima et al. 2002).
The nature of the soft excess in NGC 5005 and NGC 7331 maybe unusual in terms of ‘normal’AGN behaviour, but not uncommonin terms of LINER activity. The spectral properties of both objectsare consistent with the known X-ray class properties of LINERs(Terashima et al. 2002).
The proximity of the LINERs makes it possible to recognize thatboth objects are extended in the XMM–Newton images. It has beenpreviously determined that a significant fraction of the soft emissionin NGC 5005 (Rush & Malkan 1996) and NGC 7331 (Tyler et al.2004) originates from an extended component on host-galaxy scales.In principle, the hard power law could also be due to the contributionof galactic binaries in the host galaxy. In fact, Swartz, Ghosh &Tennant (2004) identified three ultraluminous X-ray (ULX) sourcesassociated with NGC 7331, which could be contributing part of thehigh-energy emission. However, from a Chandra image of NGC7331, Tyler et al. (2004) determined that the peak X-ray emissionwas coming from the galactic nucleus and not the vicinity of themolecular ring or host galaxy. Of course, this is not the proof thatthe hard X-rays are coming from the Seyfert 2 nucleus, but at leastfor NGC 7331 we consider it the most likely scenario.
7 C O N C L U S I O N S
We have presented a snapshot survey of 21 bright, ROSAT selectedAGN observed in the 0.3–10 keV band with XMM–Newton. Themain results of the analysis are as follows.
(i) All of the sources, including 11 type 1.8–2 objects, showedlow levels of intrinsic absorption (�1021 cm−2). Not surprisingly,a bright soft X-ray sample such as this may be biased towardslow-absorption systems. This is beneficial in identifying unabsorbedSeyfert 2s, which do not clearly fit into the orientation-based unifi-cation models.
(ii) There does not appear to be a clear correlation between thestrength and shape (i.e. temperature) of the soft excess and the spec-tral classification of AGN in this sample.
(iii) The two LINER-type objects in the sample displayed ex-tended X-ray emission in their XMM–Newton image and a soft ex-cess above a power law, which was best described with opticallythin thermal emission.
(iv) Low-energy absorption edges are detected in four objects. Inthree cases, the best-fitting edge energies are consistent with O VII
absorption. In one case, the best-fitting energy is redshifted withrespect to O VII.
(v) Four objects showed indications of broad Fe Kα emission, allof which were type 1 AGN. The lines in three of the objects couldbe explained by emission from the outer regions of an accretiondisc as they display velocity widths greater than those seen in theoptical BLR, but not at relativistic levels expected closer to the blackhole. The feature in the NLS1, II Zw 177, was very broad and anorigin close to the central black hole, or partial covering, should beconsidered.
Of primary interest is the detection of a large fraction of unab-sorbed type 2 AGN. We have demonstrated that a bright RASSselected sample such as this one can be useful in selecting un-absorbed type 2 AGN candidates. Cross-correlation of the RASSor the ROSAT Bright Survey (Schwope et al. 2000) with largeoptically selected samples of Seyfert 2s, such as those availablewith the Sloan Digital Sky Survey (SDSS), can potentially revealhundreds of candidates.
C© 2005 The Authors. Journal compilation C© 2005 RAS, MNRAS 365, 688–698
698 L. C. Gallo et al.
AC K N OW L E D G M E N T S
Based on observations obtained with XMM–Newton, an ESA sci-ence mission with instruments and contributions directly funded byESA member states and the USA (NASA). Many thanks to KarstenBischoff, for providing us with a copy of his PhD dissertation, andto Gunther Hasinger for useful discussion. Much appreciation tothe anonymous referee for providing constructive comments, whichlead to improvement of the manuscript.
R E F E R E N C E S
Antonucci R. R. J., Miller J. S., 1985, ApJ, 297, 621Arnaud K., 1996, in Jacoby G., Barnes J., eds, ASP Conf. Ser. Vol. 101,
Astronomical Data Analysis Software and Systems. Astron. Soc. Pac.,San Francisco, p. 17
Awaki H., Koyama K., Inoue H., Halpern J., 1991, PASJ, 43, 195Barcons X., Carrera F., Ceballos M., 2003, MNRAS, 339, 757Bischoff K., 2004, PhD thesis, Univ. GottingenBoller Th. et al., 2003, A&A, 397, 557Dickey J. M., Lockman F. J., 1990, ARA&A, 28, 215Ehle M. et al., 2004, XMM–Newton Users’ Handbook, issue 2.2Fabian A. C., Rees M. J., Stella L., White N. E., 1989, MNRAS, 238,
729Fabian A. C. et al., 2002, MNRAS, 335, 1Gallo L., Fabian A., Boller Th., Pietsch W., 2005, MNRAS, 363, 64Ghisellini G., Haardt F., Matt G., 2004, A&A, 413, 535Goodrich R., Veilleux S., Hill G., 1994, ApJ, 422, 521Gorenstein P., 1975, ApJ, 198, 95Guainazzi M., 2003, A&A, 401, 903Guainazzi M., Rodriguez-Pascual P., Fabian A., Iwasawa K., Matt G., 2004,
MNRAS, 355, 297Grupe D., Thomas H.-C., Beuermann K., 2001, A&A, 367, 470Grupe D., Wills B., Leighly K., Meusinger H., 2004, AJ, 127, 156Ho L. C., Filippenko A. V., Sargent W. L. W., 1997, ApJS, 112, 315Iwasawa K., Miniutti G., Fabian A., 2004, MNRAS, 355, 1073Jansen F. et al., 2001, A&A, 365, L1Kaastra J. S., 1992, An X-Ray Spectral Code for Optically Thin Plasmas.
(Internal SRON-Leiden Report, updated version 2.0)Kewley L. J., Heisler C. A., Dopita M. A., Lumsden S., 2001, ApJS, 132,
37Kirsch M., 2005, XMM–Newton Calibration Documents (CAL-TN-0018-
2.4)Kuraszkiewicz J., Green P., Crenshaw D., Dunn J., Forster K., Vestergaard
M., Aldcroft T., 2004, ApJS, 150, 165Laor A., 1991, ApJ, 376, 90Lumsden S., Alexander D., Hough J., 2004, MNRAS, 348, 1451
Mateos S., Barcons X., Carrera F., Ceballos M., Hasinger G., Lehmann I.,Fabian A., Streblyansk A., 2005, A&A, in press (astro-ph/0506718)
Matt G., Guainazzi M., Maiolino R., 2003, MNRAS, 342, 422Matt G., Porquet D., Bianchi S., Falocco S., Maiolino R., Reeves J.,
Zappacosta L., 2005, A&A, 435, 857Mattson B., Weaver K., 2004, ApJ, 601, 771McKernan B., Yaqoob T., Reynolds C., 2004, ApJ, 617, 232Moran E., Kay L., Davis M., Filippenko A., Barth A., 2001, ApJ, 556, 75Mewe R., Gronenschild E. H. B. M., van den Oord G. H. J., 1985, A&AS,
62, 197Mewe R., Lemen J. R., van den Oord G. H. J., 1986, A&AS, 65, 511Nicastro F., 2000, ApJ, 530, 65Nicastro F., Martocchia A., Matt G., 2003, ApJ, 589, 13Osterbrock D. E., Martel A., 1993, ApJ, 414, 552Osterbrock D. E., Shuder J. M., 1982, ApJS, 49, 149Panessa F., Bassani L., 2002, A&A, 394, 435 (PB02)Pappa A., Georgantopoulos I., Stewart G., Zezas A., 2001, MNRAS, 326,
995Paturel G., Fouque P., Bottinelli L., Gouguenheim L., 1989, A&AS, 80, 299Pietsch W., Bischoff K., Boller Th., Dobereiner S., Kollatschny W., Zim-
mermann H.-U., 1998, A&A, 333, 48Porquet D., 2005, A&A, in press (astro-ph/0511387)Porquet D., Reeves J., Uttley P., Turner T. J., 2004, A&A, 427, 101Protassov R., van Dyk D., Connors A., Kashyap V., Siemiginowska A., 2002,
ApJ, 571, 545Raymond J. C., Smith B. W., 1977, ApJS, 35, 419Risaliti G., 2002, A&A, 386, 379Risaliti G., Elvis M., Fabbiano G., Baldi A., Zezas A., 2005, ApJ, 623, 93Ross R. R., Fabian A. C., Brandt W. N., 1996, MNRAS, 278, 1082Rush B., Malkan M., 1996, ApJ, 456, 466Schwope A. et al., 2000, Astron. Nachrichten, 321, 1Struder L. et al., 2001, A&A, 365, L18Swartz D., Ghosh K., Tennant A., Wu K., 2004, ApJS, 154, 519Tanaka Y., Boller Th., Gallo L., Keil R., Ueda Y., 2004, PASJ, 56, 9Terashima Y., Iyomoto N., Ho L., Ptak A., 2002, ApJS, 139, 1Tran H., 2001, ApJ, 554, 19Turner M. J. et al., 2001, A&A, 365, 27Turner T. J. et al., 2002, ApJ, 574, L123Turner T. J., Kraemer S. B., Reeves J. N., 2004, ApJ, 603, 62Tyler K., Quillen A., LaPage A., Rieke G., 2004, ApJ, 610, 213Veron-Cetty M., Veron P., 2003, A&A, 412, 399Voges W. et al., 1999, A&A, 349, 389Yaqoob T., George I. M., Kallman T. R., Padmanabhan U., Weaver K. A.,
Turner T. J., 2003, ApJ, 596, 85Zimmermann H.-U., Boller Th., Dobereiner S., Pietsch W., 2001, A&A, 378,
30
This paper has been typeset from a TEX/LATEX file prepared by the author.
C© 2005 The Authors. Journal compilation C© 2005 RAS, MNRAS 365, 688–698