wÄrtsilÄ energy solutions electricity …„rtsilÄ energy solutions electricity supply resource...
TRANSCRIPT

© Wärtsilä INTERNAL
WÄRTSILÄ ENERGY SOLUTIONSElectricity Supply Resource Technology Forum
Butte, MT29 November 2017
Phil Rutkowski, Business Development Manager, Energy Solutions
9.5.20161

© Wärtsilä INTERNAL
Oil & gas
Flexible baseload
Industrial self-generation
Grid stability & peaking
Americas
Output: 11.5 GW
Plants: 405
Asia
Output: 19.8 GW
Plants: 1662
Europe
Output: 12.3 GW
Plants: 1802
Total Output:
+60 GW
Plants: 4,742
Engines: 10,802
Countries: 170
Africa & Middle East
Output: 12.6 GW
Plants: 873
USA+3,400 MW
* Includes plants on order and in construction as of April 2017
ABOUT WÄRTSILÄ

© Wärtsilä INTERNAL
Ohio-11 MW
Miami University, Oxford
Hawaii - 32 MW
Kauai Utility 32 MW
HECO – 50 MW*
New Mexico – 47 MW
LCEC 47 MW
Alaska- 247 MW
Eklutna GS (MEA) 171 MW
City of Ketchikan 10 MW
Red Dog Mine 40 MW
Westward Seafoods 6 MW
Dutch Harbor 10 MW
Nome 10 MW
Minnesota-23 MW
Northern States Power, 14MW
Hutchinson, 9 MW
Rochester, 47 MW*
Kansas- 143 MW
Midwest Energy 76 MW
Midwest Energy 28 MW
City of Iola 11 MW
Coffeyville 56 MW
Louisiana-77 MW
City of Alexandria 65 MW
El Paso 16,000 Hp
Compression
Arkansas-18 MW
City of Paragould
Mississippi-12 MW
El Paso 16,000 Hp
Compression
Alabama-41 MW
Mobile Bay
Missouri-12 MW
City of Kennett
Tennessee-12 MW
El Paso 16,000 Hp
Compression
Pennsylvania-23 MW
Borough of Chambersburg
Maryland-31 MW
Sweetheart Cup 11 MW
BG&E 14 MW
Calvert Cliffs (BGE) 6 MW
New Jersey -9 MW
Mannington
Illinois-25 MW
University of Illinois
Michigan- 17 MW
Detroit Airport
Marquette, 51 MW
UMERC, 188MW*
Washington- 39 MW
Boulder Park (Avista)32 MW
Olympic View (MCPUD3) 7 MW
Oregon- 236 MW
Port Westward 2 (PGE), 220 MW*
Wah Chang 16 MW
California- 270 MW
Modesto (MID) 50 MW
Humboldt (PG&E)163 MW
Red Bluff (S&S) 57 MW
Colorado-231 MW
Plains End I (EIF)113 MW
Plains End II (EIF)118 MW
Nevada -118 MW
Barrick Gold Western 102 (BG)
Indiana-8 MW
City of Rensselaer
* Plants Under Construction
Texas- 629 MW
Antelope (Golden Spread) 170 MW
Greenville (GEUS) 25 MW
Pearsall (STEC) 203 MW
Red Gate (STEC) 225 MW
Moss Bluff 8,000 Hp – 6 MW Compression
City of Denton 225MW*
Power Plants greater than 100 MW USA REV 5 NOV 11, 2016
Oklahoma - 56 MW
Stillwater – 56 MW
North Dakota - 112 MW
Williston – 112 MW
+3,400 MW Total CapacityMontana - 18 MW
Montana Dakota Utilities – 18 MW
Nebraska– 9 MW
Fall City 9 MW
Florida-26 MW
Gainesville 7 MW
Tallahassee – 19 MW*Arizona - 188 MW
Tucson Electric Power – 188 MW*

© Wärtsilä INTERNAL
20V34SG-D 18V50SG-B
Output 9,370 kWe 18,817 kWe
Heat Rate*
(LHV)
(HHV)
Speed 720 rpm 514 rpm
Dimensions
(L/WH)
42’ x 11’ x 15’
143 US tons
63’ x 18’ x 21’
391 US tons
•At generator terminals (pf 0.8, 0% tolerance)
WÄRTSILÄ ENGINES
20V34DF-B 18V50DF
Output 9,340 kWe 17,076 kWe
Heat Rate*
(LHV)
(HHV)
Speed 720 rpm 514 rpm
Dimensions
(L/WH)
42’ x 11’ x 15’
143 US tons
63’ x 18’ x 21’
391 US tons
* At generator terminals (pf 0.8, 0% tolerance) when operating
on natural gas with 1% liquid pilot fuel

© Wärtsilä INTERNAL
Start Times 2 min (hot start), 5 min (warm start) – 34SG 5 min (hot), 10 min (warm) – 50SG Ideal for cycling operation No maintenance impact (maintenance is strictly hours based)
Min Up time = 1 min or less
Min Down time = 5 min (gas purge cycle)
Cycling has no impact on O&M
Ramping: Note there are TWO RAMPING REGIMES Start Ramp is 20% to 50% per minute (for 5 and 2 min start) Operational Ramp is 30% to 100% load in 40s (equates to 105%/min) Equivalent to many hydro facilities
5 © Wärtsilä
STARTING/CYCLING/RAMPING
© Wärtsilä INTERNAL
Natural Gas (“NG”) Thermal Resources
:Servant or Master?
5.12.2017 [Presentation name / Author]6

© Wärtsilä INTERNAL
Generation by Fuel Source
5.12.2017 [Presentation name / Author]7
2,012,873
122,225
760,960
781,986
2005
1,352,398
1,333,482
797,178
2015
https://www.eia.gov/electricity/annual/html/epa_03_01_a.html
Coal
NG
Nuke

© Wärtsilä INTERNAL
Like most Thermal Resources, fuel costs drives electricity costs

© Wärtsilä INTERNAL
This plays into the Merit Order dispatch model of resources
5.12.2017 [Presentation name / Author]9

© Wärtsilä INTERNAL
Fracking & economics, not environmental policies have pushed NG
What happened that made NG Resources such a dominant player?

© Wärtsilä INTERNAL
“TYPICAL” GAS POWER PLANT ALTERNATIVES
5.12.2017 [Presentation name / Author]11
Gas Turbine -
Industrial
Gas Turbine –
Aero derivate
RICE Combined Cycle
Power Plant
Configuration 1 X 7FA1 X LM6000PG -
Sprint12 X 18V50SG 1 - 1
Heat rate HHV (ISO)
Output MW (ISO) 205.0 48.7 226.5 308.0
Output MW (5000 fasl) 166.4 37.3 226.5 251.4
Output MW (5000 fasl & 77F) 161.1 35.1 226.5 244.0
Investment cost (ISO) 700 $/kW 1,200 $/kW 900 $/kW 1,000 $/kW
Minimum stable load 25 % 25 % 10 % (per engine) 25%
Variable O&M cost 1 $/MWh 3.5 $/MWh 6 $/MWh 5 $/MWh
Start-up cost 10,000 $/start 0 0 15,000 $/start
Fixed O&M 15 $/kW 20 $/kW 15 $/kW 30 $/kW

© Wärtsilä INTERNAL
BUT THAT’S NOT WHERE THE STORY ENDS…

© Wärtsilä INTERNAL
MARKET VOLATILITY WILL INCREASE
Renewables
• Will depress wholesale market prices and change the
price duration curve
• More very low and very high priced periods
New Market Rules
• ”How to cope with the duck curve?”
• FERC ruling 825 will impact all ISO markets
• Beyond the new ramping product discussion
Volatility as an
Opportunity
• Increasing price volatility is seen as a risk if you don’t have
tools to cope with it
• Volatility is an opportunity for a portfolio with flexible
assets

© Wärtsilä INTERNAL
Once again, this plays into the Merit Order dispatch model of resources. RE is taken first and depresses prices but unfortunately is also intermittent.

© Wärtsilä INTERNAL
As renewable resources increase in the generation portfolio, the “net demand” increases in volatility

© Wärtsilä INTERNAL
Tucson Electric Power – ten minute ramping changes
5.12.2017 [Presentation name / Author]16
THIS LOAD VOLATILITY IS REAL

© Wärtsilä INTERNAL
Loading sequence of thermal power plants
17
SO WHAT RESOURCES ARE BEST TO MEET THIS INTERMITTENCY?
0 5 10 15 20 25 30 35 40 45 50 mins
80
70
60
50
40
30
20
10
0
90
100
Load %
55
Coal Fired power plant
80
70
60
50
40
30
20
10
0
90
100
Load %
Combined Cycle power plant (GTCC)
Industrial GT power plant (GTSC)
Aeroderivative GT power plant (GTSC)
Combustion Engine power plant (W50SG)
Note: Start up times from hot stand-by!

© Wärtsilä INTERNAL
Combined Cycle power plant (GTCC)
0 5 10 15 20 25 30 35 40 45 mins
80
70
60
50
40
30
20
10
0
90
100
Load %
Unloading sequences for power plants
18
OR CAN COME DOWN QUICKLY WHEN RENEWABLE ENERGY IS PLENTIFUL?
80
70
60
50
40
30
20
10
0
90
100
Load %
Industrial GT power plant (GTSC)
Combustion Engine power plant

© Wärtsilä INTERNAL
GAS POWER PLANT ALTERNATIVES – FLEXIBILITY MEASURES
5.12.2017 [Presentation name / Author]19
Gas Turbine -
Industrial
Gas Turbine –
Aero derivate
RICE Combined Cycle
Power Plant
Configuration 1 X 7FA1 X LM6000PG -
Sprint12 X 18V50SG 1 – 1
Start time to Full Power 11 minutes* 10 minutes 5 minutes 45 minutes
Minimum Up Time 4 hours 5 minutes <1 minute 4 – 12 hours
Shut down 15 minutes Few minutes <1 minute 30 minutes
Start costs $10,000/start 0* 0 $15,000/start
Minimum stable load 25% 25% 10% (per engine) 25%*
Minimum stable load (ISO) 52MW 12MW 2MW 77MW*

© Wärtsilä INTERNAL 5.12.2017 [Presentation name / Author]20
HOW DOES FLEXIBILITY MATTER WHEN ANALYZING PORTFOLIOS
Example from a real IRP in the Rocky MountainsDispatch – Base CASE 2035 – Low demand week
Cycling
Every time a Combined Cycle or HD CT starts/stops, it’s a minimum of $10,000

© Wärtsilä INTERNAL 5.12.2017 [Presentation name / Author]21
INCREASE RENEWABLE ENERGY AND REPLACE THERMAL ASSETS WITH WARTSILA
Same weekDispatch – High res 2035 – Low demand week
Combined Cycles still cycling, but overall less GTs w/ start costs are
employed. $0 start cost for Wärtsilä and fast ramps allow for more RE

© Wärtsilä INTERNAL
Net present value of required future revenues
5.12.2017 [Presentation name / Author]22
RESULTS FROM CHANGING IRP BASE CASE
Base Case100 % of New
Gas RICE
High RES –
100 % RICE
Net Present value of required
revenues – 3% Load following$5,553,389,360 $5,470,753,016
Difference to the Base case ($82,636,343)
Net Present value of required
revenues – 7% Load following$5,619,712,486 $5,502,211,222 $5,297,364,073
Difference to the Base case ($117,501,263) ($322,348,413)
*NPV (5.2%, 20 yrs, (VOM + FOM + CAPEX))
Wärtsilä found that this IOU achieved the greatest cost savings by
building MORE Renewable Energy with LESS thermal resources IF they
employed HIGHLY FLEXIBLE Wärtsilä technology

© Wärtsilä INTERNAL
RENEWABLE DENTON – PORTFOLIO (ENERGY MIX)
40%
29%
30% Renewable
PPA
Coal ownership
Market
purchase
Denton’s energy mix 2016 Denton’s energy mix 2019
Wärtsilä flexibility helps City of Denton achieve 70% renewable energy base by 2019 while the ratepayers will save ~$975M over 20 years over the current portfolio

© Wärtsilä INTERNAL
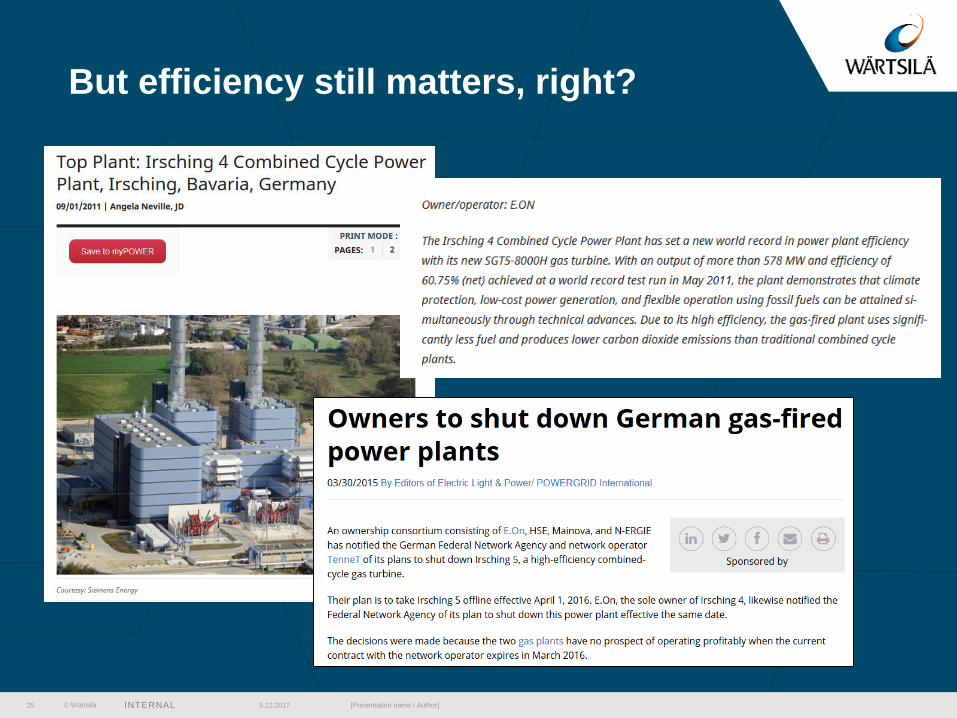
But efficiency still matters, right?
5.12.2017 [Presentation name / Author]24
© Wärtsilä INTERNAL
But efficiency still matters, right?
5.12.2017 [Presentation name / Author]25

© Wärtsilä INTERNAL
But efficiency still matters, right?
5.12.2017 [Presentation name / Author]26

© Wärtsilä 05 December 2017 Energy Solutions 201527
Renewables are the
new base energy
• Not just a green image anymore
• More and more affordable PPA contracts available
• Economical option compared to gas baseload
Volatile market is
your friend
• Generation volatility will increase
• Flexible capacity provides an ability to hedge AND extract
value from the market
Gas as integrator, not
new baseload
• No room for gas baseload – renewables are more
economical option and less risky
• Flexible gas capacity as enabler
SUMMARY

© Wärtsilä INTERNAL
Please enjoy my colleague’s book on the transformation happening to U.S. utilities
https://www.smartpowergeneration.com/content-center/books/goodbye-to-deerland

© Wärtsilä INTERNAL
PHIL RUTKOWSKIBDM – ROCKY MOUNTAINSWÄRTSILÄ ENERGY [email protected]
5.12.2017 [Presentation name / Author]29