world rison opulation ist - prawo.uni.wroc.pl · world rison opulation ist eleventh edition o...
TRANSCRIPT
World Prison Population Listeleventh edition
Roy Walmsley
1
Introduction
This eleventh edition of the World Prison Population List gives details of the number of prisoners held in 223 prison systems in independent countries and dependent territories. It shows the differences in the levels of imprisonment across the world and makes possible an estimate of the world prison population total. The figures include both pre-trial detainees/remand prisoners and those who have been convicted and sentenced. The information is the latest available at the end of October 2015.
The data are presented in two parts. Part one, tables 1-5, sets out prison population totals, rates and trends for each individual country. Part two, tables 6-8, provides data on prison population totals, rates and trends by continent, and includes comparison of male and female prison population levels.
The World Prison Population List*, like the World Female Imprisonment List (the third edition of which was published in September 2015) and the World Pre-trial/Remand Imprisonment List (second edition published in 2014) complement the information held on the World Prison Brief. This is an online database available at www.prisonstudies.org, and is updated monthly.
The World Prison Population List is compiled from a variety of sources. In almost all cases the original source is the national prison administration of the country concerned, or else the Ministry responsible for the prison administration. Most of the figures are recent and efforts are continually made to update them and to obtain information on the number of prisoners in the countries on which figures are not currently available (Eritrea, Somalia and the Democratic People’s Republic of (North) Korea) or are incomplete. We welcome the assistance of readers in notifying us of the latest figures. Care has been taken to ensure that the List is as accurate as possible but we cannot guarantee the reliability of every figure and readers are also invited to draw attention to any errors they notice and, if possible, to supply corrections.
It is hoped that this edition of the World Prison Population List will be useful for policy makers, prison administrators, academic criminologists, non-governmental organisations, other criminal justice experts and everyone who is interested in the extent of imprisonment. The information may prompt fresh thought about the size of prison populations, given the high costs and disputed efficacy of imprisonment and the fact that prison overcrowding is widespread.
More information on prison population rates and trends, alongside discussion of the ethical challenges and imperatives of prisons policy in the 21st century, will be presented in the forthcoming book Imprisonment Worldwide (Andrew Coyle, Helen Fair, Jessica Jacobson and Roy Walmsley), to be published by Policy Press in summer 2016.
* The first five editions of the World Prison Population List were published by the Research and Statistics Directorate of the United Kingdom Home Office; the next five were published by the International Centre for Prison Studies (ICPS). Following the merger in November 2014 of ICPS with the Institute for Criminal Policy Research (ICPR), this eleventh edition is the first to be published by ICPR.
2
World Prison Population List (eleventh edition)
Key points
CC This report shows that more than 10.35 million people are held in penal institutions throughout the world, either as pre-trial detainees/remand prisoners or having been convicted and sentenced. Figures for Eritrea, Somalia and the Democratic People’s Republic of (North) Korea are not available and those for China and Guinea Bissau are incomplete (see footnote to Table 3 concerning China). Also missing are prisoners held in some jurisdictions that are not fully recognised internationally and those pre-trial prisoners who are held in police facilities and not included in published national prison population totals. The full total is therefore higher than 10.35 million and may well be in excess of 11 million.
CC There are more than 2.2 million prisoners in the United States of America, more than 1.65 million in China (plus an unknown number in pre-trial detention or ‘administrative detention’), 640,000 in the Russian Federation, 607,000 in Brazil, 418,000 in India, 311,000 in Thailand, 255,000 in Brazil and 225,000 in Iran.
CC The countries with the highest prison population rate – that is, the number of prisoners per 100,000 of the national population – are Seychelles (799 per 100,000), followed by the United States (698), St. Kitts & Nevis (607), Turkmenistan (583), U.S. Virgin Islands (542), Cuba (510), El Salvador (492), Guam – U.S.A. (469), Thailand (461), Belize (449), Russian Federation (445), Rwanda (434) and British Virgin Islands (425).
CC However, more than half of all countries and territories (55%) have rates below 150 per 100,000.
CC The world prison population rate, based on United Nations estimates of national population levels, is 144 per 100,000.
CC Prison population rates vary considerably between different regions of the world, and between different parts of the same continent. For example:
C• in Africa the median rate for western African countries is 52 whereas for southern African countries it is 188;
C• in the Americas the median rate for south American countries is 242 whereas for Caribbean countries it is 347;
C• in Asia the median rate for south central Asian countries (mainly the Indian sub-continent) is 74 whereas for central Asian countries it is 166.
C• in Europe the median rate for western European countries is 84 whereas for the countries spanning Europe and Asia (e.g. Russia and Turkey) it is 236.
C• in Oceania the median rate is 155.
CC Since about the year 2000 the world prison population total has grown by almost 20%, which is slightly above the estimated 18% increase in the world’s general population over the same period. There are considerable differences between the continents, and variation within continents. The total prison population in Oceania has increased by almost 60% and that in the Americas by over 40%; in Europe, by contrast, the total prison population has decreased by 21%. The European figure reflects large falls in prison populations in Russia and in central and eastern Europe. In the Americas, the prison population has increased by 14% in the USA, by over 80% in central American countries and by 145% in south American countries.
CC The female prison population total has increased by 50% since about 2000, while the equivalent figure for the male prison population is 18%.
CC The female total has increased proportionately more than the male total in every continent. Consequently the proportion of women and girls in the total world prison population has risen from 5.4% in about 2000 to 6.8% in the latest figures available. (For more information on female prison populations, see the third edition of the World Female Imprisonment List.)
3
World Prison Population List (eleventh edition)
Part 1: Prison population totals, rates and trends per country
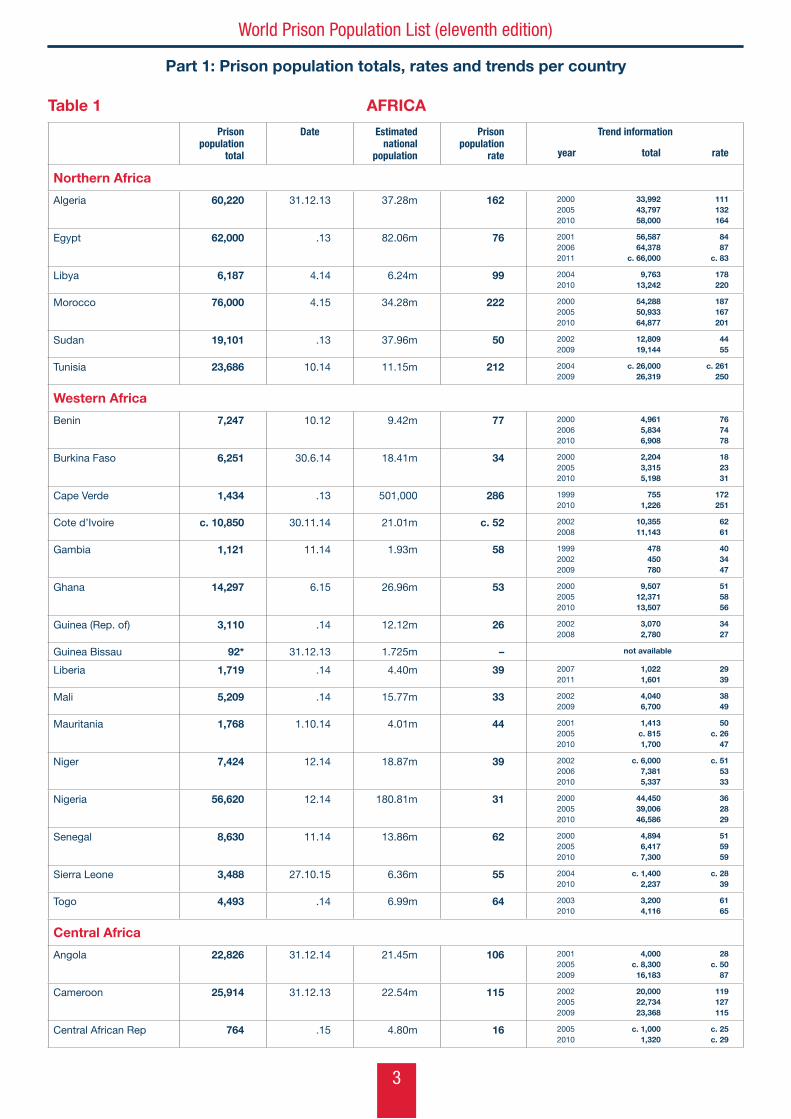
Table 1 AFRICA
Prison population
total
Date Estimated national
population
Prison population
rate
Trend information
year total rate
Northern Africa
Algeria 60,220 31.12.13 37.28m 162 200020052010
33,99243,79758,000
111132164
Egypt 62,000 .13 82.06m 76 200120062011
56,58764,378
c. 66,000
8487
c. 83
Libya 6,187 4.14 6.24m 99 20042010
9,76313,242
178220
Morocco 76,000 4.15 34.28m 222 200020052010
54,28850,93364,877
187167201
Sudan 19,101 .13 37.96m 50 20022009
12,80919,144
4455
Tunisia 23,686 10.14 11.15m 212 20042009
c. 26,00026,319
c. 261250
Western Africa
Benin 7,247 10.12 9.42m 77 200020062010
4,9615,8346,908
767478
Burkina Faso 6,251 30.6.14 18.41m 34 200020052010
2,2043,3155,198
182331
Cape Verde 1,434 .13 501,000 286 19992010
7551,226
172251
Cote d’Ivoire c. 10,850 30.11.14 21.01m c. 52 20022008
10,35511,143
6261
Gambia 1,121 11.14 1.93m 58 199920022009
478450780
403447
Ghana 14,297 6.15 26.96m 53 200020052010
9,50712,37113,507
515856
Guinea (Rep. of) 3,110 .14 12.12m 26 20022008
3,0702,780
3427
Guinea Bissau 92* 31.12.13 1.725m – not available
Liberia 1,719 .14 4.40m 39 20072011
1,0221,601
2939
Mali 5,209 .14 15.77m 33 20022009
4,0406,700
3849
Mauritania 1,768 1.10.14 4.01m 44 200120052010
1,413c. 8151,700
50c. 26
47
Niger 7,424 12.14 18.87m 39 200220062010
c. 6,0007,3815,337
c. 515333
Nigeria 56,620 12.14 180.81m 31 200020052010
44,45039,00646,586
362829
Senegal 8,630 11.14 13.86m 62 200020052010
4,8946,4177,300
515959
Sierra Leone 3,488 27.10.15 6.36m 55 20042010
c. 1,4002,237
c. 2839
Togo 4,493 .14 6.99m 64 20032010
3,2004,116
6165
Central Africa
Angola 22,826 31.12.14 21.45m 106 200120052009
4,000c. 8,300
16,183
28c. 50
87
Cameroon 25,914 31.12.13 22.54m 115 200220052009
20,00022,73423,368
119127115
Central African Rep 764 .15 4.80m 16 20052010
c. 1,0001,320
c. 25c. 29
4
World Prison Population List (eleventh edition)
Prison population
total
Date Estimated national
population
Prison population
rate
Trend information
year total rate
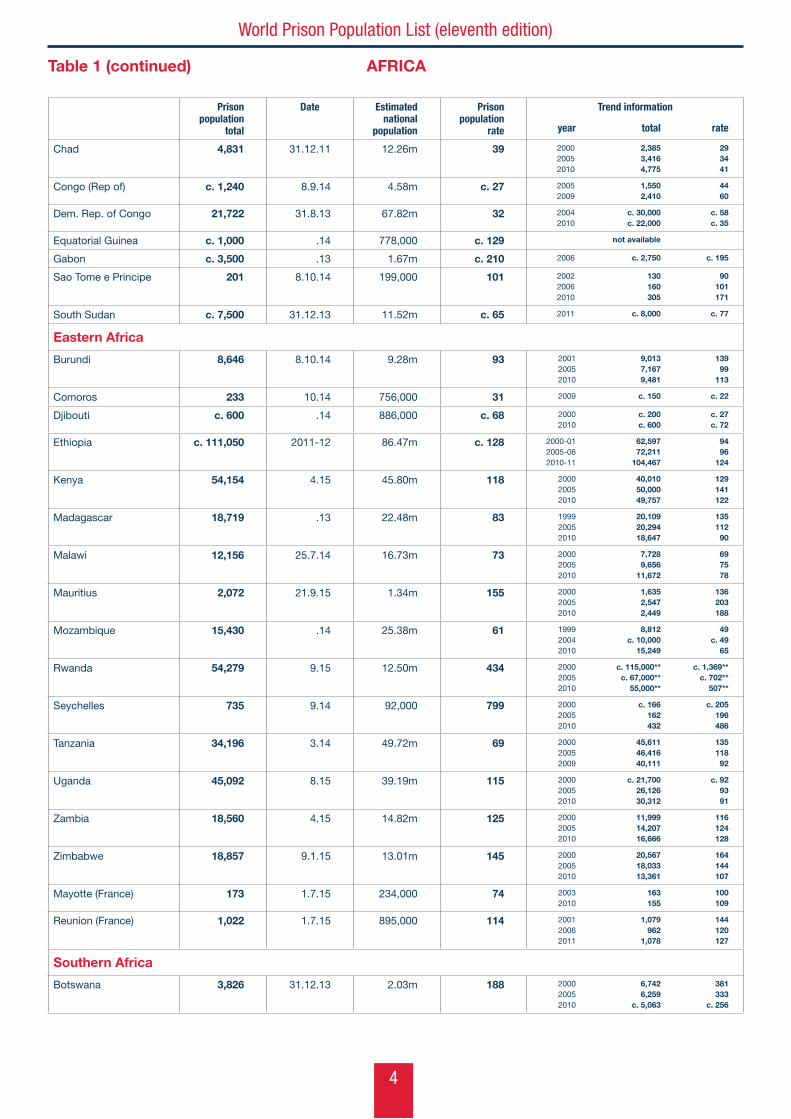
Chad 4,831 31.12.11 12.26m 39 200020052010
2,3853,4164,775
293441
Congo (Rep of) c. 1,240 8.9.14 4.58m c. 27 20052009
1,5502,410
4460
Dem. Rep. of Congo 21,722 31.8.13 67.82m 32 20042010
c. 30,000c. 22,000
c. 58c. 35
Equatorial Guinea c. 1,000 .14 778,000 c. 129 not available
Gabon c. 3,500 .13 1.67m c. 210 2006 c. 2,750 c. 195
Sao Tome e Principe 201 8.10.14 199,000 101 200220062010
130160305
90101171
South Sudan c. 7,500 31.12.13 11.52m c. 65 2011 c. 8,000 c. 77
Eastern Africa
Burundi 8,646 8.10.14 9.28m 93 200120052010
9,0137,1679,481
13999
113
Comoros 233 10.14 756,000 31 2009 c. 150 c. 22
Djibouti c. 600 .14 886,000 c. 68 20002010
c. 200c. 600
c. 27c. 72
Ethiopia c. 111,050 2011-12 86.47m c. 128 2000-012005-062010-11
62,59772,211
104,467
9496
124
Kenya 54,154 4.15 45.80m 118 200020052010
40,01050,00049,757
129141122
Madagascar 18,719 .13 22.48m 83 199920052010
20,10920,29418,647
13511290
Malawi 12,156 25.7.14 16.73m 73 200020052010
7,7289,656
11,672
697578
Mauritius 2,072 21.9.15 1.34m 155 200020052010
1,6352,5472,449
136203188
Mozambique 15,430 .14 25.38m 61 199920042010
8,812c. 10,000
15,249
49c. 49
65
Rwanda 54,279 9.15 12.50m 434 200020052010
c. 115,000**c. 67,000**
55,000**
c. 1,369**c. 702**
507**
Seychelles 735 9.14 92,000 799 200020052010
c. 166162432
c. 205196486
Tanzania 34,196 3.14 49.72m 69 200020052009
45,61146,41640,111
13511892
Uganda 45,092 8.15 39.19m 115 200020052010
c. 21,70026,12630,312
c. 929391
Zambia 18,560 4.15 14.82m 125 200020052010
11,99914,20716,666
116124128
Zimbabwe 18,857 9.1.15 13.01m 145 200020052010
20,56718,03313,361
164144107
Mayotte (France) 173 1.7.15 234,000 74 20032010
163155
100109
Reunion (France) 1,022 1.7.15 895,000 114 200120062011
1,079962
1,078
144120127
Southern Africa
Botswana 3,826 31.12.13 2.03m 188 200020052010
6,7426,259
c. 5,063
381333
c. 256
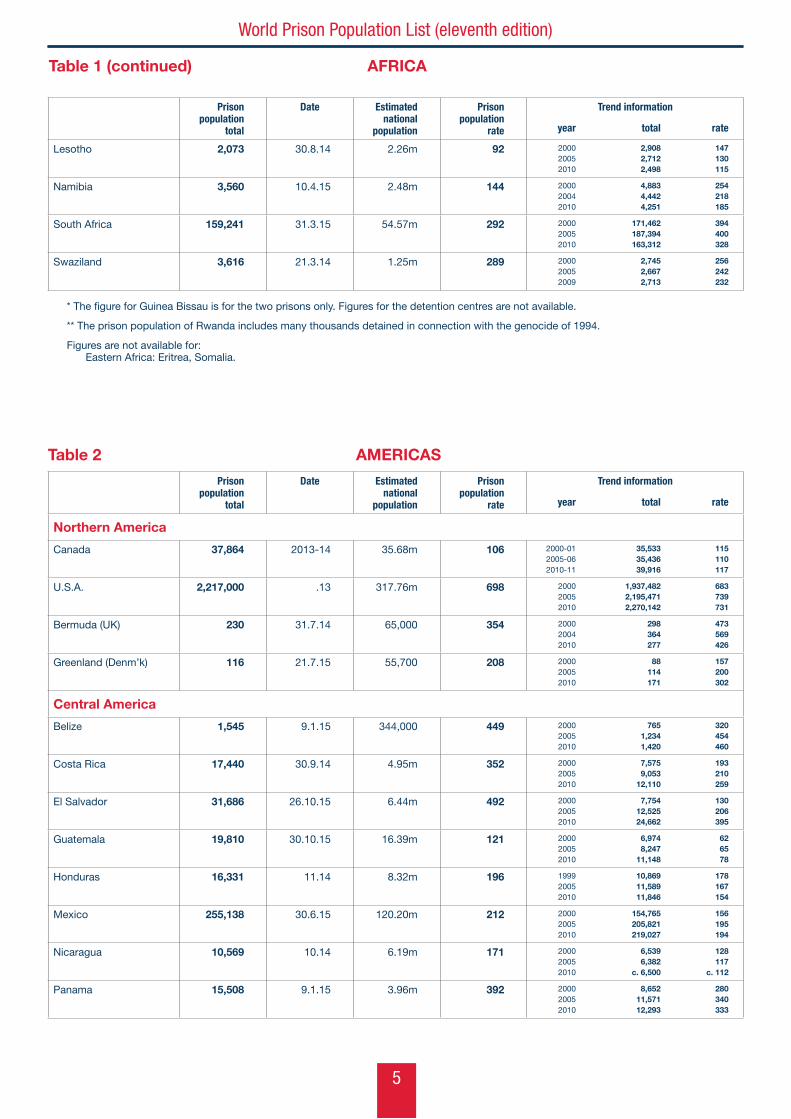
Table 1 (continued) AFRICA
5
World Prison Population List (eleventh edition)
Prison population
total
Date Estimated national
population
Prison population
rate
Trend information
year total rate
Lesotho 2,073 30.8.14 2.26m 92 200020052010
2,9082,7122,498
147130115
Namibia 3,560 10.4.15 2.48m 144 200020042010
4,8834,4424,251
254218185
South Africa 159,241 31.3.15 54.57m 292 200020052010
171,462187,394163,312
394400328
Swaziland 3,616 21.3.14 1.25m 289 200020052009
2,7452,6672,713
256242232
* The figure for Guinea Bissau is for the two prisons only. Figures for the detention centres are not available.
** The prison population of Rwanda includes many thousands detained in connection with the genocide of 1994.
Figures are not available for: Eastern Africa: Eritrea, Somalia.
Table 2 AMERICAS
Prison population
total
Date Estimated national
population
Prison population
rate
Trend information
year total rate
Northern America
Canada 37,864 2013-14 35.68m 106 2000-012005-062010-11
35,53335,43639,916
115110117
U.S.A. 2,217,000 .13 317.76m 698 200020052010
1,937,4822,195,4712,270,142
683739731
Bermuda (UK) 230 31.7.14 65,000 354 200020042010
298364277
473569426
Greenland (Denm’k) 116 21.7.15 55,700 208 200020052010
88114171
157200302
Central America
Belize 1,545 9.1.15 344,000 449 200020052010
7651,2341,420
320454460
Costa Rica 17,440 30.9.14 4.95m 352 200020052010
7,5759,053
12,110
193210259
El Salvador 31,686 26.10.15 6.44m 492 200020052010
7,75412,52524,662
130206395
Guatemala 19,810 30.10.15 16.39m 121 200020052010
6,9748,247
11,148
626578
Honduras 16,331 11.14 8.32m 196 199920052010
10,86911,58911,846
178167154
Mexico 255,138 30.6.15 120.20m 212 200020052010
154,765205,821219,027
156195194
Nicaragua 10,569 10.14 6.19m 171 200020052010
6,5396,382
c. 6,500
128117
c. 112
Panama 15,508 9.1.15 3.96m 392 200020052010
8,65211,57112,293
280340333
Table 1 (continued) AFRICA
6
World Prison Population List (eleventh edition)
Prison population
total
Date Estimated national
population
Prison population
rate
Trend information
year total rate
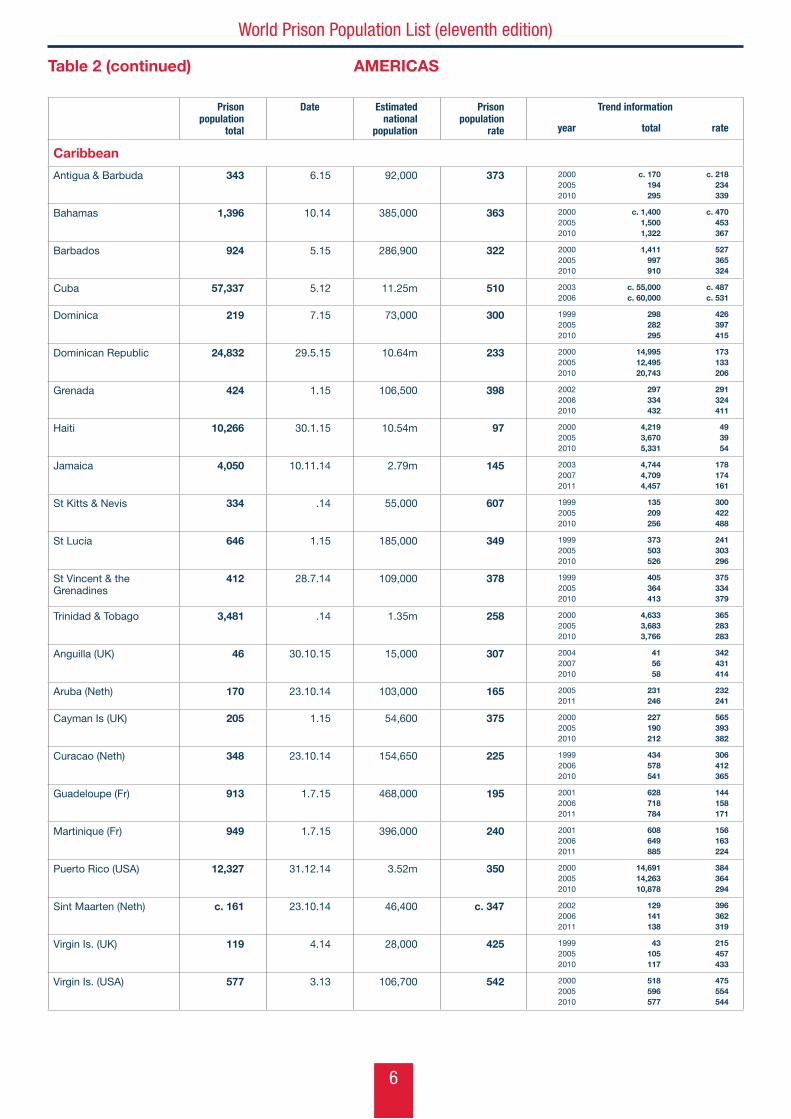
Caribbean
Antigua & Barbuda 343 6.15 92,000 373 200020052010
c. 170194295
c. 218234339
Bahamas 1,396 10.14 385,000 363 200020052010
c. 1,4001,5001,322
c. 470453367
Barbados 924 5.15 286,900 322 200020052010
1,411997910
527365324
Cuba 57,337 5.12 11.25m 510 20032006
c. 55,000c. 60,000
c. 487c. 531
Dominica 219 7.15 73,000 300 199920052010
298282295
426397415
Dominican Republic 24,832 29.5.15 10.64m 233 200020052010
14,99512,49520,743
173133206
Grenada 424 1.15 106,500 398 200220062010
297334432
291324411
Haiti 10,266 30.1.15 10.54m 97 200020052010
4,2193,6705,331
493954
Jamaica 4,050 10.11.14 2.79m 145 200320072011
4,7444,7094,457
178174161
St Kitts & Nevis 334 .14 55,000 607 199920052010
135209256
300422488
St Lucia 646 1.15 185,000 349 199920052010
373503526
241303296
St Vincent & the Grenadines
412 28.7.14 109,000 378 199920052010
405364413
375334379
Trinidad & Tobago 3,481 .14 1.35m 258 200020052010
4,6333,6833,766
365283283
Anguilla (UK) 46 30.10.15 15,000 307 200420072010
415658
342431414
Aruba (Neth) 170 23.10.14 103,000 165 20052011
231246
232241
Cayman Is (UK) 205 1.15 54,600 375 200020052010
227190212
565393382
Curacao (Neth) 348 23.10.14 154,650 225 199920062010
434578541
306412365
Guadeloupe (Fr) 913 1.7.15 468,000 195 200120062011
628718784
144158171
Martinique (Fr) 949 1.7.15 396,000 240 200120062011
608649885
156163224
Puerto Rico (USA) 12,327 31.12.14 3.52m 350 200020052010
14,69114,26310,878
384364294
Sint Maarten (Neth) c. 161 23.10.14 46,400 c. 347 200220062011
129141138
396362319
Virgin Is. (UK) 119 4.14 28,000 425 199920052010
43105117
215457433
Virgin Is. (USA) 577 3.13 106,700 542 200020052010
518596577
475554544
Table 2 (continued) AMERICAS
7
World Prison Population List (eleventh edition)
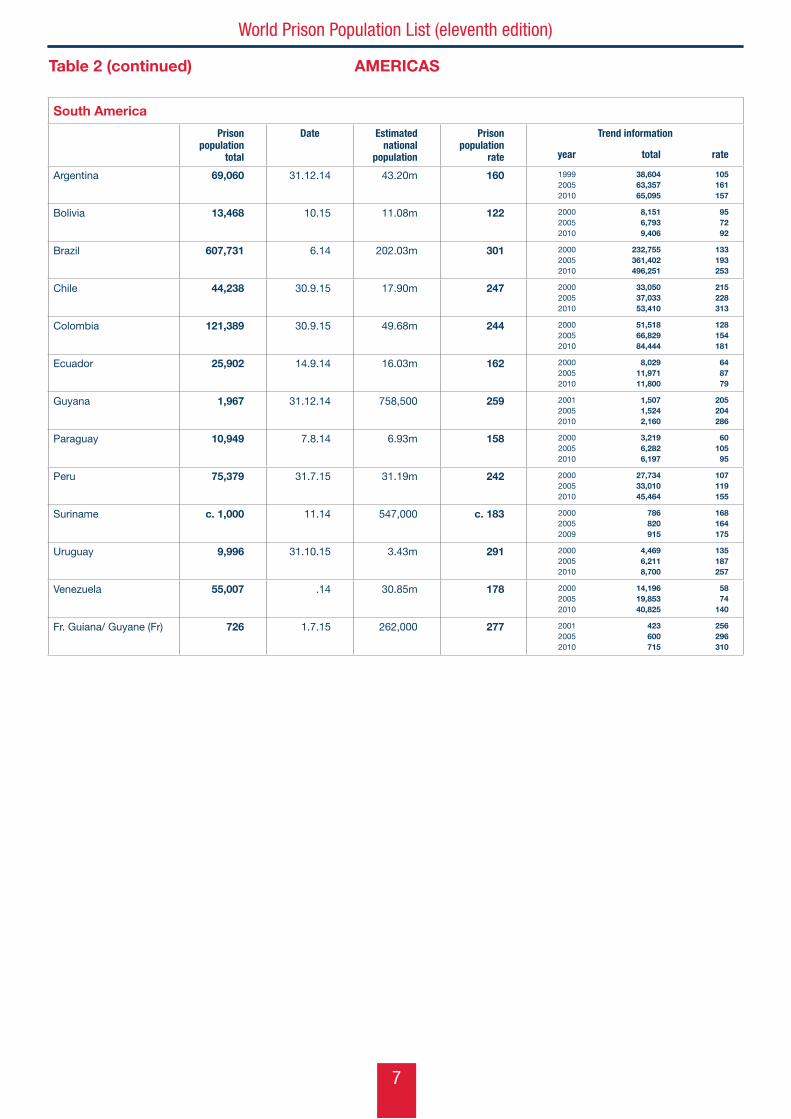
South America
Prison population
total
Date Estimated national
population
Prison population
rate
Trend information
year total rate
Argentina 69,060 31.12.14 43.20m 160 199920052010
38,60463,35765,095
105161157
Bolivia 13,468 10.15 11.08m 122 200020052010
8,1516,7939,406
957292
Brazil 607,731 6.14 202.03m 301 200020052010
232,755361,402496,251
133193253
Chile 44,238 30.9.15 17.90m 247 200020052010
33,05037,03353,410
215228313
Colombia 121,389 30.9.15 49.68m 244 200020052010
51,51866,82984,444
128154181
Ecuador 25,902 14.9.14 16.03m 162 200020052010
8,02911,97111,800
648779
Guyana 1,967 31.12.14 758,500 259 200120052010
1,5071,5242,160
205204286
Paraguay 10,949 7.8.14 6.93m 158 200020052010
3,2196,2826,197
6010595
Peru 75,379 31.7.15 31.19m 242 200020052010
27,73433,01045,464
107119155
Suriname c. 1,000 11.14 547,000 c. 183 200020052009
786820915
168164175
Uruguay 9,996 31.10.15 3.43m 291 200020052010
4,4696,2118,700
135187257
Venezuela 55,007 .14 30.85m 178 200020052010
14,19619,85340,825
5874
140
Fr. Guiana/ Guyane (Fr) 726 1.7.15 262,000 277 200120052010
423600715
256296310
Table 2 (continued) AMERICAS
8
World Prison Population List (eleventh edition)
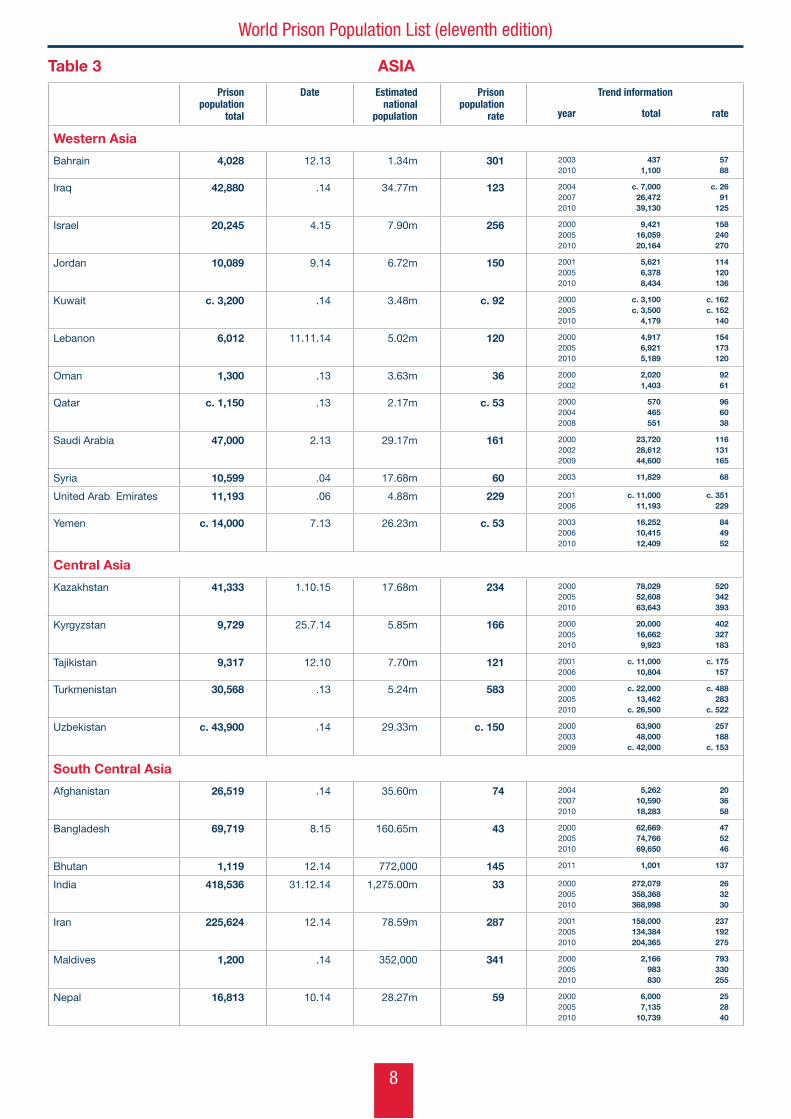
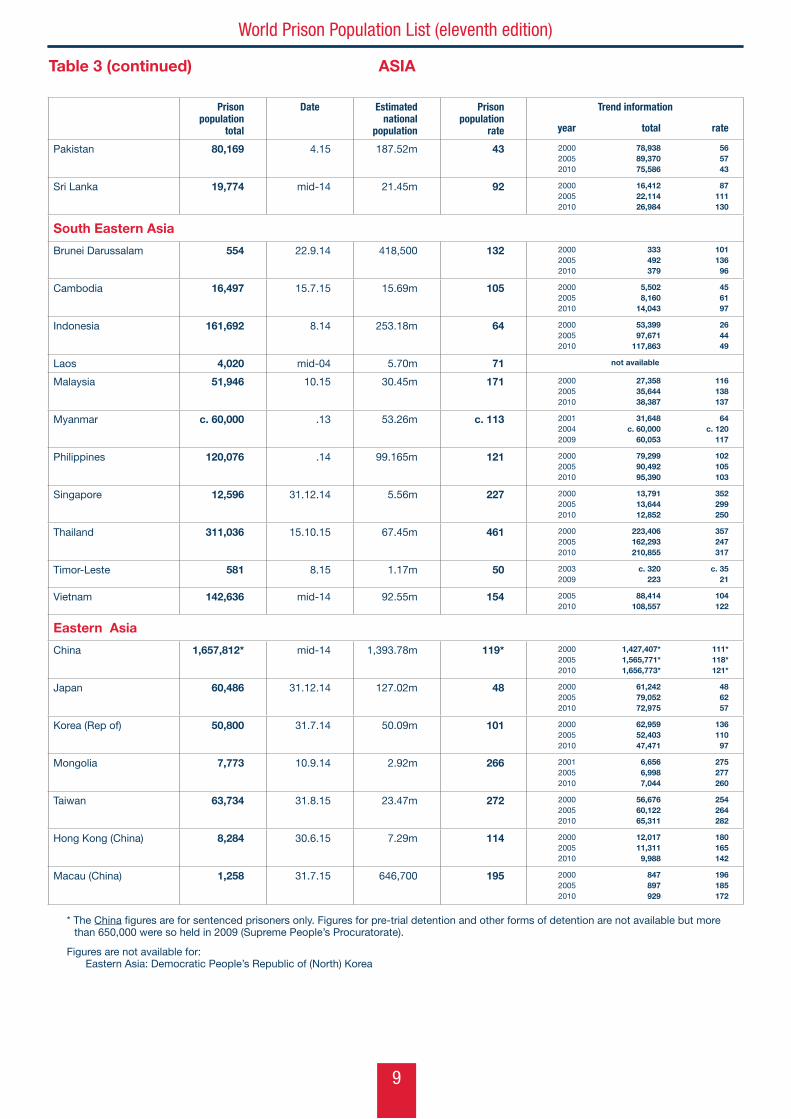
Table 3 ASIA
Prison population
total
Date Estimated national
population
Prison population
rate
Trend information
year total rate
Western Asia
Bahrain 4,028 12.13 1.34m 301 20032010
4371,100
5788
Iraq 42,880 .14 34.77m 123 200420072010
c. 7,00026,47239,130
c. 2691
125
Israel 20,245 4.15 7.90m 256 200020052010
9,42116,05920,164
158240270
Jordan 10,089 9.14 6.72m 150 200120052010
5,6216,3788,434
114120136
Kuwait c. 3,200 .14 3.48m c. 92 200020052010
c. 3,100c. 3,500
4,179
c. 162c. 152
140
Lebanon 6,012 11.11.14 5.02m 120 200020052010
4,9176,9215,189
154173120
Oman 1,300 .13 3.63m 36 20002002
2,0201,403
9261
Qatar c. 1,150 .13 2.17m c. 53 200020042008
570465551
966038
Saudi Arabia 47,000 2.13 29.17m 161 200020022009
23,72028,61244,600
116131165
Syria 10,599 .04 17.68m 60 2003 11,829 68
United Arab Emirates 11,193 .06 4.88m 229 20012006
c. 11,00011,193
c. 351229
Yemen c. 14,000 7.13 26.23m c. 53 200320062010
16,25210,41512,409
844952
Central Asia
Kazakhstan 41,333 1.10.15 17.68m 234 200020052010
78,02952,60863,643
520342393
Kyrgyzstan 9,729 25.7.14 5.85m 166 200020052010
20,00016,6629,923
402327183
Tajikistan 9,317 12.10 7.70m 121 20012006
c. 11,00010,804
c. 175157
Turkmenistan 30,568 .13 5.24m 583 200020052010
c. 22,00013,462
c. 26,500
c. 488283
c. 522
Uzbekistan c. 43,900 .14 29.33m c. 150 200020032009
63,90048,000
c. 42,000
257188
c. 153
South Central Asia
Afghanistan 26,519 .14 35.60m 74 200420072010
5,26210,59018,283
203658
Bangladesh 69,719 8.15 160.65m 43 200020052010
62,66974,76669,650
475246
Bhutan 1,119 12.14 772,000 145 2011 1,001 137
India 418,536 31.12.14 1,275.00m 33 200020052010
272,079358,368368,998
263230
Iran 225,624 12.14 78.59m 287 200120052010
158,000134,384204,365
237192275
Maldives 1,200 .14 352,000 341 200020052010
2,166983830
793330255
Nepal 16,813 10.14 28.27m 59 200020052010
6,0007,135
10,739
252840
9
World Prison Population List (eleventh edition)
Prison population
total
Date Estimated national
population
Prison population
rate
Trend information
year total rate
Pakistan 80,169 4.15 187.52m 43 200020052010
78,93889,37075,586
565743
Sri Lanka 19,774 mid-14 21.45m 92 200020052010
16,41222,11426,984
87111130
South Eastern Asia
Brunei Darussalam 554 22.9.14 418,500 132 200020052010
333492379
10113696
Cambodia 16,497 15.7.15 15.69m 105 200020052010
5,5028,160
14,043
456197
Indonesia 161,692 8.14 253.18m 64 200020052010
53,39997,671
117,863
264449
Laos 4,020 mid-04 5.70m 71 not available
Malaysia 51,946 10.15 30.45m 171 200020052010
27,35835,64438,387
116138137
Myanmar c. 60,000 .13 53.26m c. 113 200120042009
31,648c. 60,000
60,053
64c. 120
117
Philippines 120,076 .14 99.165m 121 200020052010
79,29990,49295,390
102105103
Singapore 12,596 31.12.14 5.56m 227 200020052010
13,79113,64412,852
352299250
Thailand 311,036 15.10.15 67.45m 461 200020052010
223,406162,293210,855
357247317
Timor-Leste 581 8.15 1.17m 50 20032009
c. 320223
c. 3521
Vietnam 142,636 mid-14 92.55m 154 20052010
88,414108,557
104122
Eastern Asia
China 1,657,812* mid-14 1,393.78m 119* 200020052010
1,427,407*1,565,771*1,656,773*
111*118*121*
Japan 60,486 31.12.14 127.02m 48 200020052010
61,24279,05272,975
486257
Korea (Rep of) 50,800 31.7.14 50.09m 101 200020052010
62,95952,40347,471
13611097
Mongolia 7,773 10.9.14 2.92m 266 200120052010
6,6566,9987,044
275277260
Taiwan 63,734 31.8.15 23.47m 272 200020052010
56,67660,12265,311
254264282
Hong Kong (China) 8,284 30.6.15 7.29m 114 200020052010
12,01711,3119,988
180165142
Macau (China) 1,258 31.7.15 646,700 195 200020052010
847897929
196185172
* The China figures are for sentenced prisoners only. Figures for pre-trial detention and other forms of detention are not available but more than 650,000 were so held in 2009 (Supreme People’s Procuratorate).
Figures are not available for: Eastern Asia: Democratic People’s Republic of (North) Korea
Table 3 (continued) ASIA
10
World Prison Population List (eleventh edition)
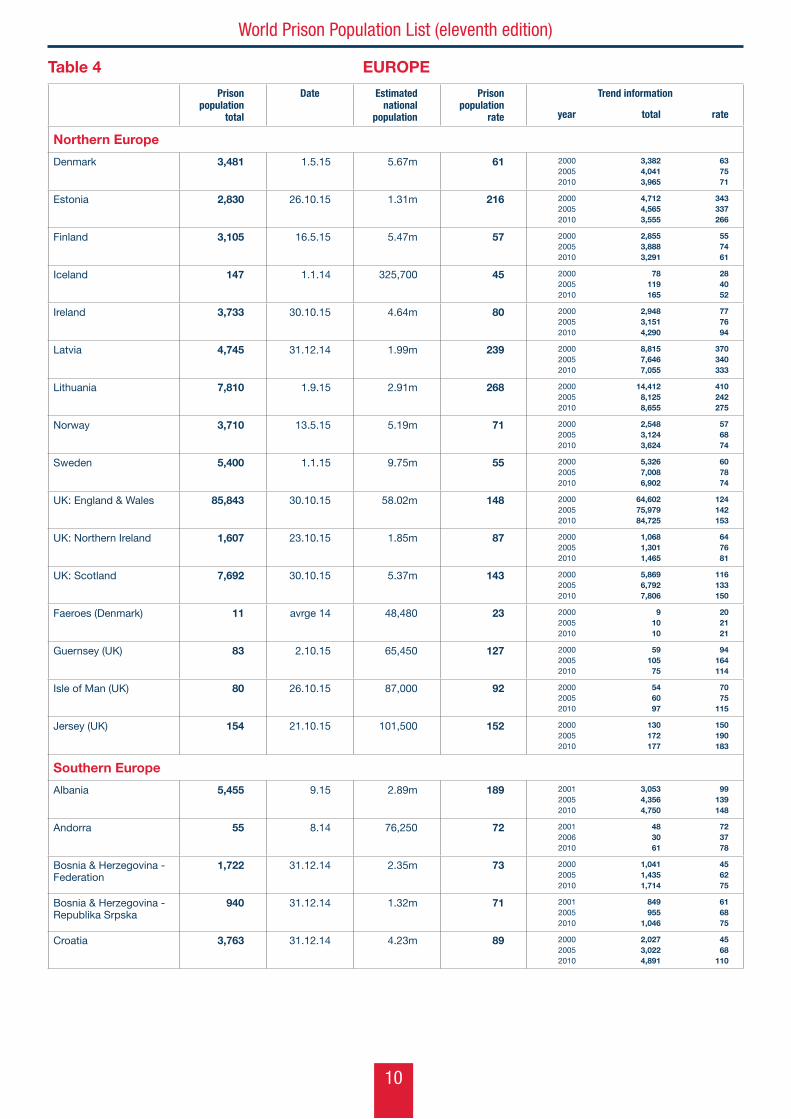
Table 4 EUROPE
Prison population
total
Date Estimated national
population
Prison population
rate
Trend information
year total rate
Northern Europe
Denmark 3,481 1.5.15 5.67m 61 200020052010
3,3824,0413,965
637571
Estonia 2,830 26.10.15 1.31m 216 200020052010
4,7124,5653,555
343337266
Finland 3,105 16.5.15 5.47m 57 200020052010
2,8553,8883,291
557461
Iceland 147 1.1.14 325,700 45 200020052010
78119165
284052
Ireland 3,733 30.10.15 4.64m 80 200020052010
2,9483,1514,290
777694
Latvia 4,745 31.12.14 1.99m 239 200020052010
8,8157,6467,055
370340333
Lithuania 7,810 1.9.15 2.91m 268 200020052010
14,4128,1258,655
410242275
Norway 3,710 13.5.15 5.19m 71 200020052010
2,5483,1243,624
576874
Sweden 5,400 1.1.15 9.75m 55 200020052010
5,3267,0086,902
607874
UK: England & Wales 85,843 30.10.15 58.02m 148 200020052010
64,60275,97984,725
124142153
UK: Northern Ireland 1,607 23.10.15 1.85m 87 200020052010
1,0681,3011,465
647681
UK: Scotland 7,692 30.10.15 5.37m 143 200020052010
5,8696,7927,806
116133150
Faeroes (Denmark) 11 avrge 14 48,480 23 200020052010
91010
202121
Guernsey (UK) 83 2.10.15 65,450 127 200020052010
5910575
94164114
Isle of Man (UK) 80 26.10.15 87,000 92 200020052010
546097
7075
115
Jersey (UK) 154 21.10.15 101,500 152 200020052010
130172177
150190183
Southern Europe
Albania 5,455 9.15 2.89m 189 200120052010
3,0534,3564,750
99139148
Andorra 55 8.14 76,250 72 200120062010
483061
723778
Bosnia & Herzegovina - Federation
1,722 31.12.14 2.35m 73 200020052010
1,0411,4351,714
456275
Bosnia & Herzegovina - Republika Srpska
940 31.12.14 1.32m 71 200120052010
849955
1,046
616875
Croatia 3,763 31.12.14 4.23m 89 200020052010
2,0273,0224,891
4568
110
11
World Prison Population List (eleventh edition)
Prison population
total
Date Estimated national
population
Prison population
rate
Trend information
year total rate
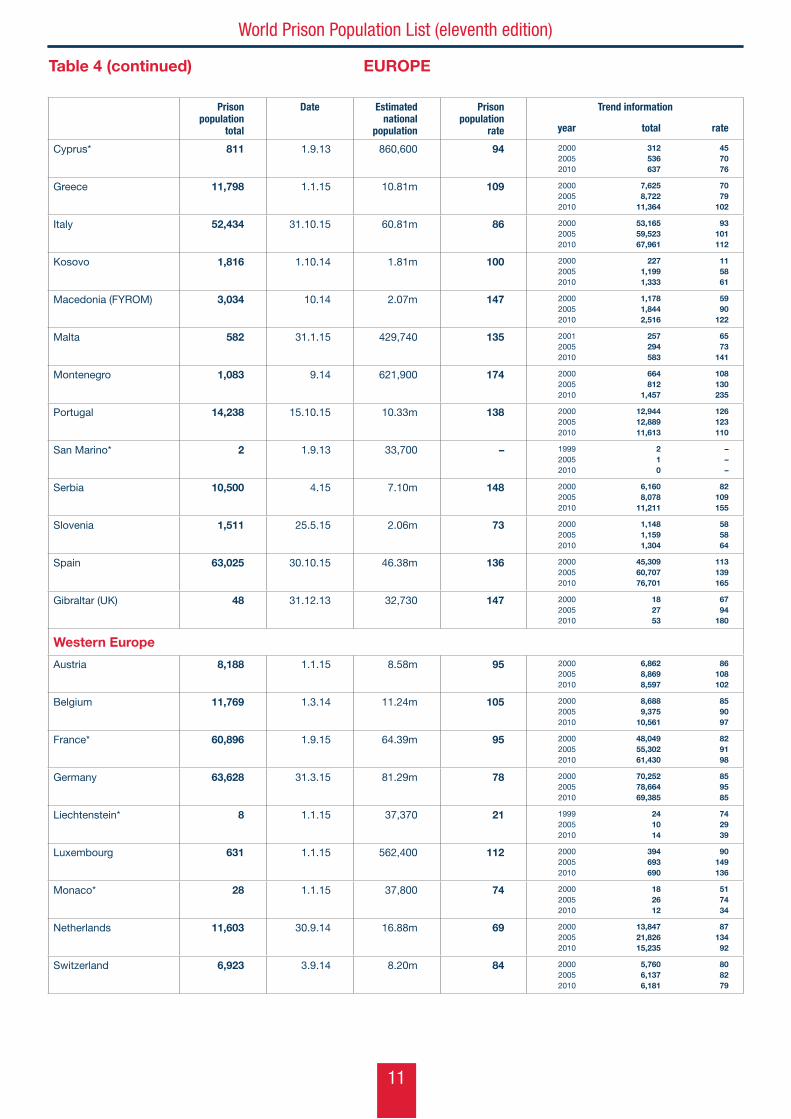
Cyprus* 811 1.9.13 860,600 94 200020052010
312536637
457076
Greece 11,798 1.1.15 10.81m 109 200020052010
7,6258,722
11,364
7079
102
Italy 52,434 31.10.15 60.81m 86 200020052010
53,16559,52367,961
93101112
Kosovo 1,816 1.10.14 1.81m 100 200020052010
2271,1991,333
115861
Macedonia (FYROM) 3,034 10.14 2.07m 147 200020052010
1,1781,8442,516
5990
122
Malta 582 31.1.15 429,740 135 200120052010
257294583
6573
141
Montenegro 1,083 9.14 621,900 174 200020052010
664812
1,457
108130235
Portugal 14,238 15.10.15 10.33m 138 200020052010
12,94412,88911,613
126123110
San Marino* 2 1.9.13 33,700 – 199920052010
210
–––
Serbia 10,500 4.15 7.10m 148 200020052010
6,1608,078
11,211
82109155
Slovenia 1,511 25.5.15 2.06m 73 200020052010
1,1481,1591,304
585864
Spain 63,025 30.10.15 46.38m 136 200020052010
45,30960,70776,701
113139165
Gibraltar (UK) 48 31.12.13 32,730 147 200020052010
182753
6794
180
Western Europe
Austria 8,188 1.1.15 8.58m 95 200020052010
6,8628,8698,597
86108102
Belgium 11,769 1.3.14 11.24m 105 200020052010
8,6889,375
10,561
859097
France* 60,896 1.9.15 64.39m 95 200020052010
48,04955,30261,430
829198
Germany 63,628 31.3.15 81.29m 78 200020052010
70,25278,66469,385
859585
Liechtenstein* 8 1.1.15 37,370 21 199920052010
241014
742939
Luxembourg 631 1.1.15 562,400 112 200020052010
394693690
90149136
Monaco* 28 1.1.15 37,800 74 200020052010
182612
517434
Netherlands 11,603 30.9.14 16.88m 69 200020052010
13,84721,82615,235
8713492
Switzerland 6,923 3.9.14 8.20m 84 200020052010
5,7606,1376,181
808279
Table 4 (continued) EUROPE
12
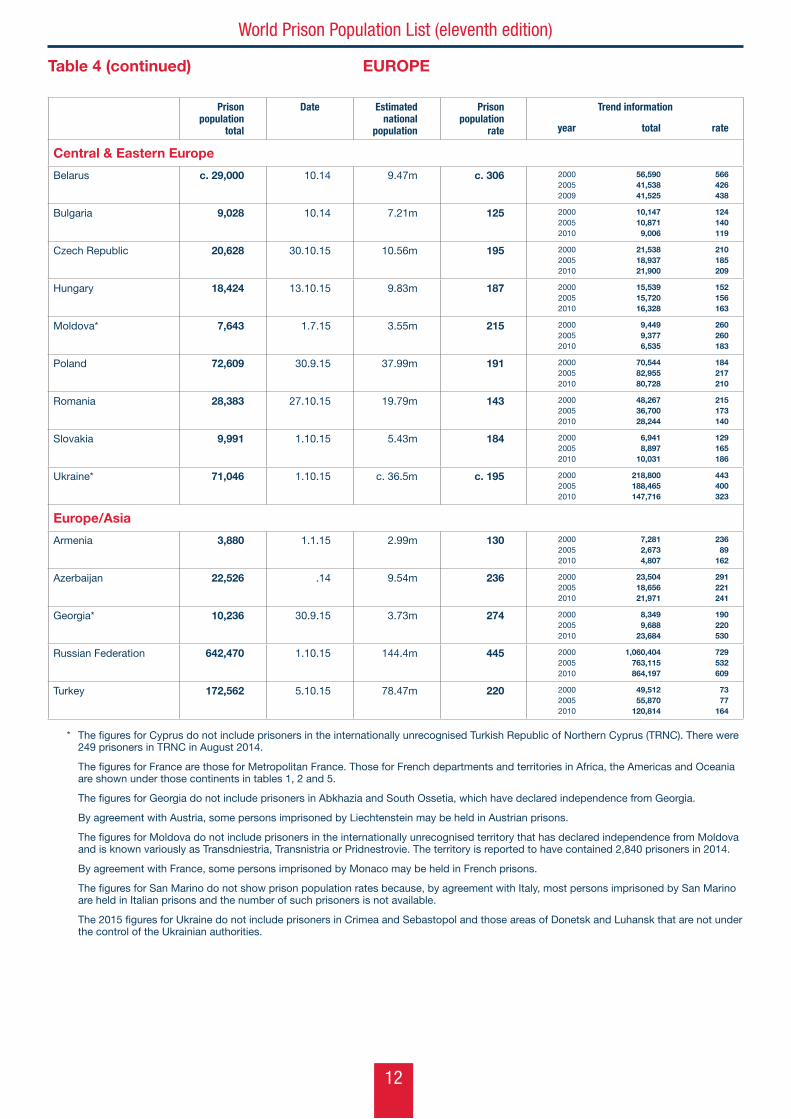
World Prison Population List (eleventh edition)
Prison population
total
Date Estimated national
population
Prison population
rate
Trend information
year total rate
Central & Eastern Europe
Belarus c. 29,000 10.14 9.47m c. 306 200020052009
56,59041,53841,525
566426438
Bulgaria 9,028 10.14 7.21m 125 200020052010
10,14710,8719,006
124140119
Czech Republic 20,628 30.10.15 10.56m 195 200020052010
21,53818,93721,900
210185209
Hungary 18,424 13.10.15 9.83m 187 200020052010
15,53915,72016,328
152156163
Moldova* 7,643 1.7.15 3.55m 215 200020052010
9,4499,3776,535
260260183
Poland 72,609 30.9.15 37.99m 191 200020052010
70,54482,95580,728
184217210
Romania 28,383 27.10.15 19.79m 143 200020052010
48,26736,70028,244
215173140
Slovakia 9,991 1.10.15 5.43m 184 200020052010
6,9418,897
10,031
129165186
Ukraine* 71,046 1.10.15 c. 36.5m c. 195 200020052010
218,800188,465147,716
443400323
Europe/Asia
Armenia 3,880 1.1.15 2.99m 130 200020052010
7,2812,6734,807
23689
162
Azerbaijan 22,526 .14 9.54m 236 200020052010
23,50418,65621,971
291221241
Georgia* 10,236 30.9.15 3.73m 274 200020052010
8,3499,688
23,684
190220530
Russian Federation 642,470 1.10.15 144.4m 445 200020052010
1,060,404763,115864,197
729532609
Turkey 172,562 5.10.15 78.47m 220 200020052010
49,51255,870
120,814
7377
164
* The figures for Cyprus do not include prisoners in the internationally unrecognised Turkish Republic of Northern Cyprus (TRNC). There were 249 prisoners in TRNC in August 2014.
The figures for France are those for Metropolitan France. Those for French departments and territories in Africa, the Americas and Oceania are shown under those continents in tables 1, 2 and 5.
The figures for Georgia do not include prisoners in Abkhazia and South Ossetia, which have declared independence from Georgia.
By agreement with Austria, some persons imprisoned by Liechtenstein may be held in Austrian prisons.
The figures for Moldova do not include prisoners in the internationally unrecognised territory that has declared independence from Moldova and is known variously as Transdniestria, Transnistria or Pridnestrovie. The territory is reported to have contained 2,840 prisoners in 2014.
By agreement with France, some persons imprisoned by Monaco may be held in French prisons.
The figures for San Marino do not show prison population rates because, by agreement with Italy, most persons imprisoned by San Marino are held in Italian prisons and the number of such prisoners is not available.
The 2015 figures for Ukraine do not include prisoners in Crimea and Sebastopol and those areas of Donetsk and Luhansk that are not under the control of the Ukrainian authorities.
Table 4 (continued) EUROPE
13
World Prison Population List (eleventh edition)
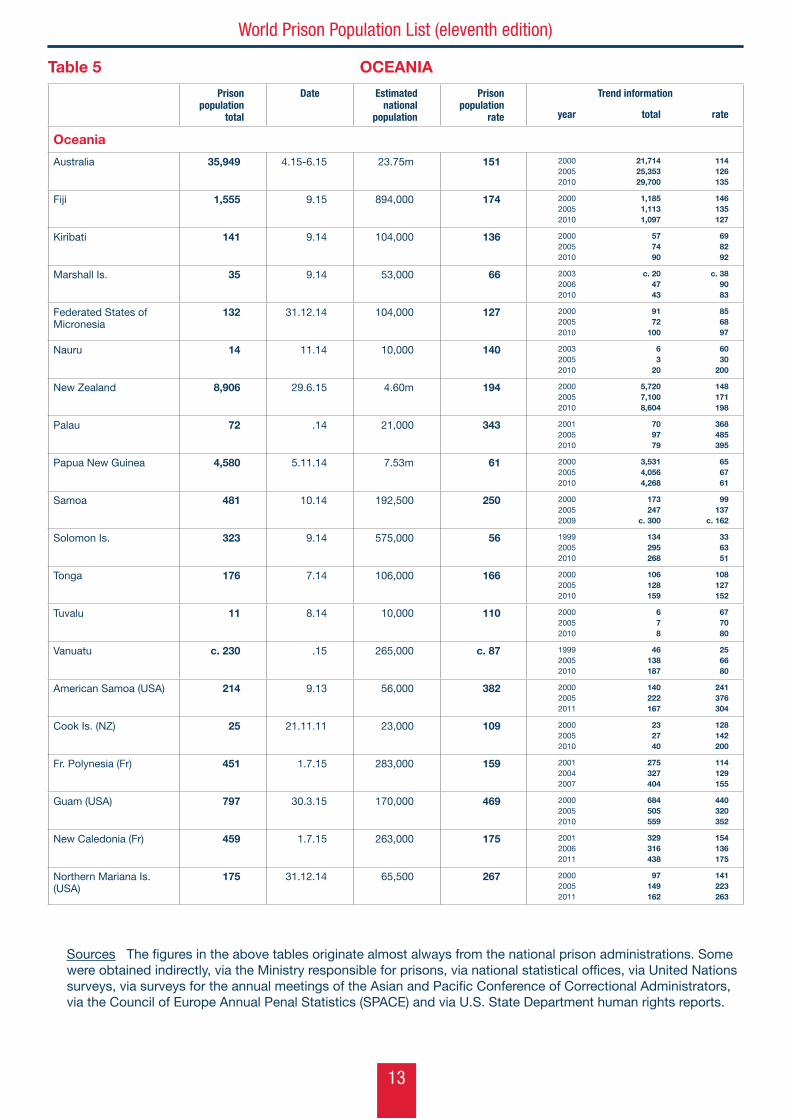
Table 5 OCEANIA
Prison population
total
Date Estimated national
population
Prison population
rate
Trend information
year total rate
Oceania
Australia 35,949 4.15-6.15 23.75m 151 200020052010
21,71425,35329,700
114126135
Fiji 1,555 9.15 894,000 174 200020052010
1,1851,1131,097
146135127
Kiribati 141 9.14 104,000 136 200020052010
577490
698292
Marshall Is. 35 9.14 53,000 66 200320062010
c. 204743
c. 389083
Federated States of Micronesia
132 31.12.14 104,000 127 200020052010
9172
100
856897
Nauru 14 11.14 10,000 140 200320052010
63
20
6030
200
New Zealand 8,906 29.6.15 4.60m 194 200020052010
5,7207,1008,604
148171198
Palau 72 .14 21,000 343 200120052010
709779
368485395
Papua New Guinea 4,580 5.11.14 7.53m 61 200020052010
3,5314,0564,268
656761
Samoa 481 10.14 192,500 250 200020052009
173247
c. 300
99137
c. 162
Solomon Is. 323 9.14 575,000 56 199920052010
134295268
336351
Tonga 176 7.14 106,000 166 200020052010
106128159
108127152
Tuvalu 11 8.14 10,000 110 200020052010
678
677080
Vanuatu c. 230 .15 265,000 c. 87 199920052010
46138187
256680
American Samoa (USA) 214 9.13 56,000 382 200020052011
140222167
241376304
Cook Is. (NZ) 25 21.11.11 23,000 109 200020052010
232740
128142200
Fr. Polynesia (Fr) 451 1.7.15 283,000 159 200120042007
275327404
114129155
Guam (USA) 797 30.3.15 170,000 469 200020052010
684505559
440320352
New Caledonia (Fr) 459 1.7.15 263,000 175 200120062011
329316438
154136175
Northern Mariana Is. (USA)
175 31.12.14 65,500 267 200020052011
97149162
141223263
Sources The figures in the above tables originate almost always from the national prison administrations. Some were obtained indirectly, via the Ministry responsible for prisons, via national statistical offices, via United Nations surveys, via surveys for the annual meetings of the Asian and Pacific Conference of Correctional Administrators, via the Council of Europe Annual Penal Statistics (SPACE) and via U.S. State Department human rights reports.
14
World Prison Population List (eleventh edition)
Part 2: Prison population totals, rates and trends by continent and gender
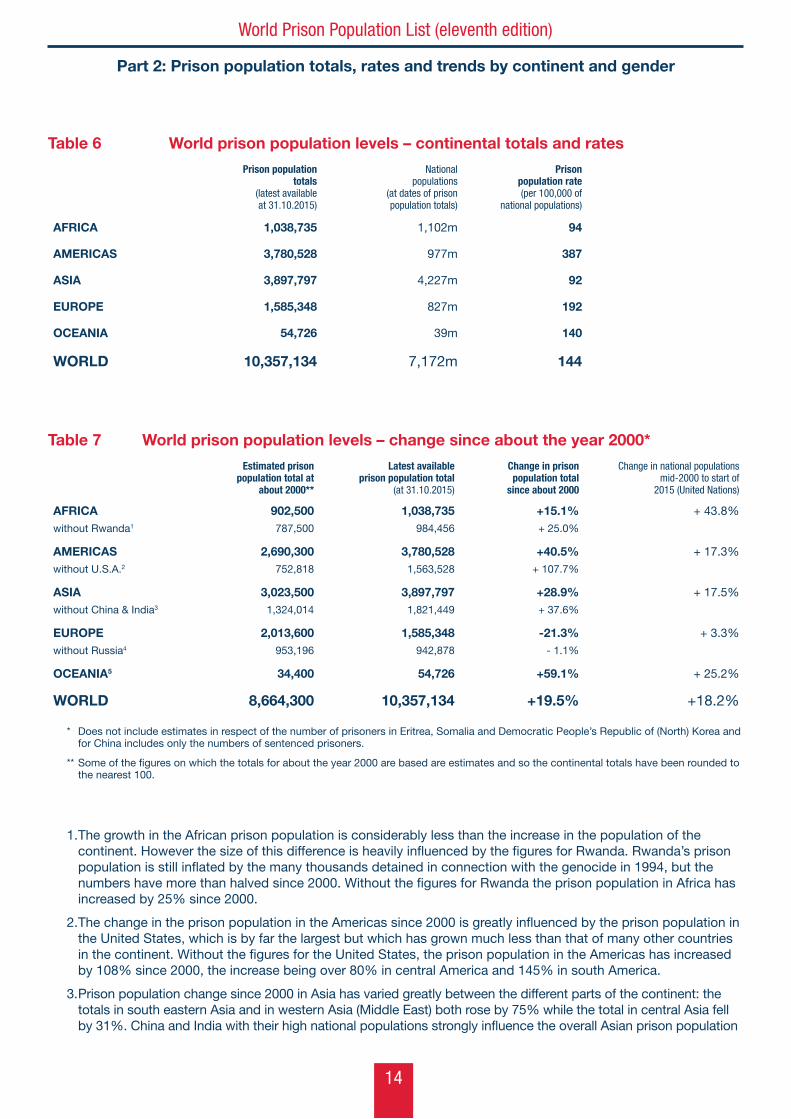
Table 6 World prison population levels – continental totals and rates
Prison populationtotals
(latest availableat 31.10.2015)
Nationalpopulations
(at dates of prisonpopulation totals)
Prisonpopulation rate(per 100,000 of
national populations)
AFRICA 1,038,735 1,102m 94
AMERICAS 3,780,528 977m 387
ASIA 3,897,797 4,227m 92
EUROPE 1,585,348 827m 192
OCEANIA 54,726 39m 140
WORLD 10,357,134 7,172m 144
Table 7 World prison population levels – change since about the year 2000*
Estimated prison population total at
about 2000**
Latest availableprison population total
(at 31.10.2015)
Change in prison population total
since about 2000
Change in national populations mid-2000 to start of
2015 (United Nations)
AFRICAwithout Rwanda1
902,500787,500
1,038,735984,456
+15.1%+ 25.0%
+ 43.8%
AMERICASwithout U.S.A.2
2,690,300752,818
3,780,5281,563,528
+40.5%+ 107.7%
+ 17.3%
ASIAwithout China & India3
3,023,5001,324,014
3,897,7971,821,449
+28.9%+ 37.6%
+ 17.5%
EUROPEwithout Russia4
2,013,600953,196
1,585,348942,878
-21.3%- 1.1%
+ 3.3%
OCEANIA5 34,400 54,726 +59.1% + 25.2%
WORLD 8,664,300 10,357,134 +19.5% +18.2%
* Does not include estimates in respect of the number of prisoners in Eritrea, Somalia and Democratic People’s Republic of (North) Korea and for China includes only the numbers of sentenced prisoners.
** Some of the figures on which the totals for about the year 2000 are based are estimates and so the continental totals have been rounded to the nearest 100.
1. The growth in the African prison population is considerably less than the increase in the population of the continent. However the size of this difference is heavily influenced by the figures for Rwanda. Rwanda’s prison population is still inflated by the many thousands detained in connection with the genocide in 1994, but the numbers have more than halved since 2000. Without the figures for Rwanda the prison population in Africa has increased by 25% since 2000.
2. The change in the prison population in the Americas since 2000 is greatly influenced by the prison population in the United States, which is by far the largest but which has grown much less than that of many other countries in the continent. Without the figures for the United States, the prison population in the Americas has increased by 108% since 2000, the increase being over 80% in central America and 145% in south America.
3. Prison population change since 2000 in Asia has varied greatly between the different parts of the continent: the totals in south eastern Asia and in western Asia (Middle East) both rose by 75% while the total in central Asia fell by 31%. China and India with their high national populations strongly influence the overall Asian prison population
15
World Prison Population List (eleventh edition)
Institute for Criminal Policy Researchwww.prisonstudies.orgwww.icpr.org.uk
Roy Walmsley is Director of the World Prison Brief, a comprehensive online database of information on the prison systems of the world, which can be accessed free of charge at www.prisonstudies.org. He also researches and compiles the World Female Imprisonment List and the World Pre-trial/Remand Imprisonment List.
level, but in opposite directions – the Chinese prison population rose by 16% while the Indian prison population rose by 54%. Without the figures for these two countries the Asian prison population has risen by 38%.
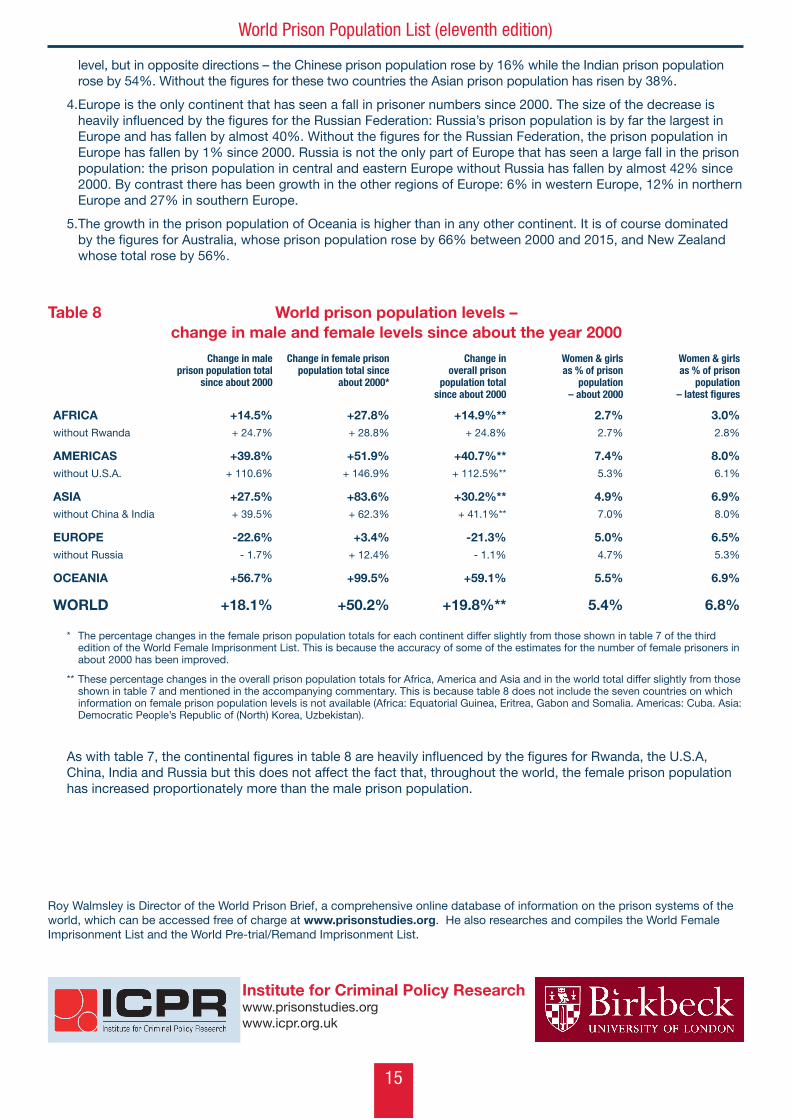
4. Europe is the only continent that has seen a fall in prisoner numbers since 2000. The size of the decrease is heavily influenced by the figures for the Russian Federation: Russia’s prison population is by far the largest in Europe and has fallen by almost 40%. Without the figures for the Russian Federation, the prison population in Europe has fallen by 1% since 2000. Russia is not the only part of Europe that has seen a large fall in the prison population: the prison population in central and eastern Europe without Russia has fallen by almost 42% since 2000. By contrast there has been growth in the other regions of Europe: 6% in western Europe, 12% in northern Europe and 27% in southern Europe.
5. The growth in the prison population of Oceania is higher than in any other continent. It is of course dominated by the figures for Australia, whose prison population rose by 66% between 2000 and 2015, and New Zealand whose total rose by 56%.
Table 8 World prison population levels – change in male and female levels since about the year 2000
Change in male prison population total
since about 2000
Change in female prison population total since
about 2000*
Change in overall prison
population total since about 2000
Women & girlsas % of prison
population– about 2000
Women & girlsas % of prison
population– latest figures
AFRICAwithout Rwanda
+14.5%+ 24.7%
+27.8%+ 28.8%
+14.9%**+ 24.8%
2.7%2.7%
3.0%2.8%
AMERICASwithout U.S.A.
+39.8%+ 110.6%
+51.9%+ 146.9%
+40.7%**+ 112.5%**
7.4%5.3%
8.0%6.1%
ASIAwithout China & India
+27.5%+ 39.5%
+83.6%+ 62.3%
+30.2%**+ 41.1%**
4.9%7.0%
6.9%8.0%
EUROPEwithout Russia
-22.6%- 1.7%
+3.4%+ 12.4%
-21.3%- 1.1%
5.0%4.7%
6.5%5.3%
OCEANIA +56.7% +99.5% +59.1% 5.5% 6.9%
WORLD +18.1% +50.2% +19.8%** 5.4% 6.8%
* The percentage changes in the female prison population totals for each continent differ slightly from those shown in table 7 of the third edition of the World Female Imprisonment List. This is because the accuracy of some of the estimates for the number of female prisoners in about 2000 has been improved.
** These percentage changes in the overall prison population totals for Africa, America and Asia and in the world total differ slightly from those shown in table 7 and mentioned in the accompanying commentary. This is because table 8 does not include the seven countries on which information on female prison population levels is not available (Africa: Equatorial Guinea, Eritrea, Gabon and Somalia. Americas: Cuba. Asia: Democratic People’s Republic of (North) Korea, Uzbekistan).
As with table 7, the continental figures in table 8 are heavily influenced by the figures for Rwanda, the U.S.A, China, India and Russia but this does not affect the fact that, throughout the world, the female prison population has increased proportionately more than the male prison population.