world insurance report 2015
TRANSCRIPT

8/19/2019 World Insurance Report 2015
http://slidepdf.com/reader/full/world-insurance-report-2015 1/60
WORLD
INSURANCEREPORT
2015

8/19/2019 World Insurance Report 2015
http://slidepdf.com/reader/full/world-insurance-report-2015 2/60

8/19/2019 World Insurance Report 2015
http://slidepdf.com/reader/full/world-insurance-report-2015 3/60

8/19/2019 World Insurance Report 2015
http://slidepdf.com/reader/full/world-insurance-report-2015 4/60
4

8/19/2019 World Insurance Report 2015
http://slidepdf.com/reader/full/world-insurance-report-2015 5/60
5
2015 WORLD INSURANCE REPORT PREFACE
Capgemini and Efma are pleased to present the 2015 World Insurance Report (WIR). This
year’s edition, presented in three chapters, provides a comprehensive overview of the current
status of the insurance industry, including detailed assessments of financial performance and
customer experience, as well as an overview of looming challenges. An appendix offers a high-
level overview of the performance of the non-life insurance industry in 15 countries around the
world.
In the first chapter, we analyzed publicly available financial information to see how insurers are
faring against a range of industry-standard efficiency ratios. We found that a healthy reductionin claims-related expenses helped boost profits throughout most regions globally, despite the
resistance of important levers, such as operational and acquisition ratios, to improvement.
Extensive consumer research, based on surveys of more than 15,500 respondents across 30
countries in five regions throughout the world, form the second chapter of our report. In this
section, we documented a disquieting drop in the volume of positive experiences customers are
having as they interact with their insurance providers. This trend is especially troubling given
the strong link we quantified between positive customer experience and advocacy, an important
source of loyalty and profitability.
In the third chapter of our report, we outlined the many changes that threaten to negatively
impact stability in the insurance industry. Some of these forces of change come from unexpected
quarters, while others have been in the works for some time. Alongside this picture of a
changing landscape, we highlighted the tools and strategies available to insurers as they seek to
maintain their competitiveness.
We hope you will find our 2015 WIR useful in helping you understand the challenges and
opportunities facing global insurers. Armed with details related to peer-level performance and
customer attitudes and perceptions, we expect insurers will be better prepared to develop and
implement ongoing strategies for continued profitability.
Preface
Jean LassignardieGlobal Head of Sales and Marketing
Global Financial Services
Capgemini
Introducing the Eighth Annual World Insurance Report
Patrick DesmarèsSecretary General
Efma

8/19/2019 World Insurance Report 2015
http://slidepdf.com/reader/full/world-insurance-report-2015 6/60
6

8/19/2019 World Insurance Report 2015
http://slidepdf.com/reader/full/world-insurance-report-2015 7/60
2015 WORLD INSURANCE REPORT CHAPTER 1
7
C H A P T E
R 1
Non-Life Insurers in Most
Markets DemonstrateImproved UnderwritingPerformance
C H A
P T E R 1
INSURERS RECORDED HIGHER PROFITS AIDEDBY DROP IN CLAIMS EXPENSES
Non-life insurers in most countries recorded healthyprofits, aided by a significant drop in claims payoutexpenses. Global insured losses in 2013 droppedby nearly half to US$45 billion, from US$81 billionin 2012. At the same time, global firms exhibitedproficiency in managing the basic risks of the non-lifebusiness, showing more improvement than not in the
claims ratio, which measures their ability to balancethe volumes and prices of premiums against payouts.Other business basics, such as managing operationaland customer acquisition costs, proved more resistantto improvement, as operational and acquisition ratiosremained largely unchanged or deteriorated slightlyin 2013. Despite those difficulties, profitability in thesector was substantial, with insurers in more than halfthe countries posting double-digit margins.
The global volume of non-life gross writtenpremiums (GWP) increased by 3.3% in 2013, to
reach US$2.03 trillion.1
While the 3.3% increase
was a sizable jump over the very slight increaseposted between 2011 and 2012, it fell short of thecompound annual growth of 4.0% experiencedbetween 2010 and 2012 (see Figure 1.1).
1 “Natural catastrophes and man-made disasters in 2013”, Swiss Re sigma 1/2014, March 2014
Figure 1.1 Global Non-Life Gross Written Premium Volumes (US$ Billion), 2010-2013
1,819.31,968.2 1,968.7 2,032.9
0
600
1,200
1,800
2,400
2010 2011 2012 2013
G r o s s W r i t t e n P r e m i u m
( U S $ b i l l i o n )
CAGR 2010-2012
4.0 %
Growth 2012–2013
3.3%
Source: Capgemini Financial Services Analysis, 2014; Swiss Re sigma Reports
2010-2014
KEY FINDINGS
Non-life insurers in most regions witnessed improved underwriting ratios due to asignificant drop in claims expenses. Australia, Germany, Japan, and Italy recorded thehighest improvements, while Netherlands and Switzerland deteriorated the most. The lowerclaims payouts contrasted with operating and acquisition costs, which were more resistant topositive change. Overall, the improvement in underwriting ratios led to robust profit marginsfor non-life insurers in most markets.
Global non-life premium volume grew by 3.3% aided by strong growth in emergingmarkets and marginal improvement in some of the mature markets. Of the marketsanalyzed, Brazil in Latin America and India in Asia-Pacific witnessed the highest growthin their non-life premiums. Among the developed markets, Sweden and Switzerland postedthe highest growth rates while other countries, such as Australia, Japan, Spain and Italy,experienced declines in their premium growth. Given advancements in technology andwidespread adoption of different risk mitigation measures, especially in developed markets, it
is expected that premium volumes will drop even further in the near future.

8/19/2019 World Insurance Report 2015
http://slidepdf.com/reader/full/world-insurance-report-2015 8/60
8
While emerging markets witnessed robust growthrates, developed markets found it tough to increasetheir premium volumes. Brazil in Latin Americaand India in Asia-Pacific posted the highest increases
in gross written premium volumes, at compoundedannual growth rates of 8.4% and 8.8% respectively.The more mature markets, beset by stiff competition,experienced more modest growth. The United Statesand Germany, for example, expanded only in the
3 percentage point range. Several other advancedmarkets such as Australia, Japan, Spain,and Italy experienced declines in premium growth(see Figure 1.2). This trend is likely to continue further
as adoption of advanced risk mitigation technologiessuch as telematics and automated home systems,mostly in developed markets increases, resultingin lower incidents and likely lead to a reduction inpremiums charged.
Figure 1.2 Non-Life Insurance GWP Volumes by Country (US$ Million), 2010–2013
Gross Written Premium (US$ million) Gross WrittenPremium
(US$ million)
CAGR2010-2013
(2.0%)
(2.5%)
4.8%
5.9%
3.2%
3.5%
2.3%
0.6%
(0.2%)
(1.1%)
5.8%
1.6%
8.4%
8.8%
6.4%
Australia
Japan
Canada
Belgium
Germany
U.S.
U.K.
Netherlands
Spain
Italy
Switzerland
France
Brazil
India
Sweden
32.732.348.434.7
108.8127.7130.7117.2
73.072.269.063.4
16.615.315.114.0
132.8125.8131.3120.8
726.4703.8667.1
655.5
106.8107.4109.5
99.7
75.171.579.773.7
38.638.440.738.9
50.650.955.452.3
28.427.628.523.9
94.689.798.490.1
39.537.437.231.0
13.413.112.210.4
10.69.8
10.2
8.8
2013
2012
2011
2010
200 400 600 8000
Source: Capgemini Financial Services Analysis, 2014; Swiss Re sigma Reports 2010-2014

8/19/2019 World Insurance Report 2015
http://slidepdf.com/reader/full/world-insurance-report-2015 9/60
9
2015 WORLD INSURANCE REPORT CHAPTER 1
Underwriting ratios mostly improved, with reducedclaims costs acting as the most significant lever. In nearly two-thirds of the countries, underwritingratios improved or stayed the same (see Figure 1.3).
The largest improvements in underwriting ratios
occurred in Australia, Germany, Japan, and Italy. Onlyin Germany did a significant decrease in operationalexpense play a role in enhancing the underwritingratio. In all other countries, operating and acquisition
ratios stayed about the same or deteriorated slightly.
Figure 1.3 Non-Life Insurance Underwriting Ratios (Combined Expenses as a Percentage of GWP) %, 2010–2013
(16.9)
(6.6)
(1.5)
(1.1)
(7.6)
(2.2)
1.4
6.7
3.3
(5.6)
7.2
(0.3)
0.0
NA
1.0
70.5
97.6
82.8
65.2
11.1
10.6
9.0
8.6
13.1
13.0
12.6
13.7
201061.0
71.4
64.8
58.8
18.5
17.6
16.6
16.0
16.7
16.4
16.3
16.3
77.4
72.2
65.5
64.9
10.9
11.1
11.9
11.5
17.3
16.3
16.1
15.6
66.0
60.3
56.6
55.0
9.7
14.3
14.2
14.3
15.1
20.4
20.4
20.8
70.6
71.7
68.5
66.0
13.2
15.4
15.8
10.6
12.2
11.2
10.3
10.4
69.1
74.2
69.6
66.6
18.9
19.0
20.9
22.1
17.9
17.3
16.3
15.9
67.2
63.1
63.8
63.1
12.9
13.2
11.1
11.7
19.7
18.9
20.3
21.8
68.0
70.1
68.6
76.0
8.2
8.5
8.6
8.6
15.4
14.9
14.5
13.9
74.7
72.8
72.8
66.3
8.4
8.2
8.5
9.1
16.1
15.9
15.6
15.9
69.0
68.4
66.9
69.8
9.4
9.7
8.3
9.6
16.3
16.3
12.8
15.8
77.0
67.5
76.0
75.7
7.2
7.7
6.7
6.7
15.9
16.4
15.4
15.4
64.5
58.9
60.6
59.3
13.1
14.4
16.9
17.6
16.6
14.2
20.4
21.3
95.3
89.7
67.7
31.8
26.2
21.2
5.7
6.3
3.9
NA
78.8
75.5
73.9
75.0
16.6
13.7
13.4
13.4
4.7
9.6
10.2
10.1
0 20 40 60 80 100 120 140
2010201120122013
2010201120122013
2010201120122013
2010201120122013
2010201120122013
2010201120122013
2010201120122013
2010201120122013
2010201120122013
2010201120122013
2010201120122013
2010201120122013
2010201120122013
2010201120122013
2010201120122013
Underwriting Ratio (%)
Claims ratio Operational Ratio Acquisition ratio
Australia
Japan
Canada
Belgium
Germany
U.S.
U.K.
Netherlands
Spain
Italy
Switzerland
France
Brazil
India
Sweden
% Point Change
2012–13
9.6
1.4
(12.1)
0.4
(1.3)
0.9
(4.6)
0.1
(2.1)
(2.2)
(6.8)
(2.0)
(3.6)
(40.1)
(2.5)
2010–12
70.9
68.4
68.0
70.9
3.7
3.6
3.5
3.7
17.4
17.7
18.4
18.6
Note: The ratios are valid only for non-life insurance; The ratios reflect non-life data as reported by the countries themselves, and hence include health insurance for Italy,
Spain, Switzerland, and Netherlands; At the time of analysis, 2013 data was not available for India; The previous year ratios may have changed based on the refresh of
results for some of the companies; PP refers to Percentage Point Change.
Source: Capgemini Financial Services Analysis, 2014; Company Annual Reports, 2010-2013

8/19/2019 World Insurance Report 2015
http://slidepdf.com/reader/full/world-insurance-report-2015 10/60
10
Coming after a $12.5 billion underwriting loss in2012, the global underwriting profit of $8.52 billion in2013 was a welcome turnaround. The profits were thethird best of the past decade, following $28.9 billion
in 2006 and $23.0 billion in 2007. Fewer naturaldisasters combined with premium rate revision led toimproved claims ratios, which in turn helped propelthe underwriting profits.
Most countries were successful in lowering theirclaims ratio significantly (see Figure 1.4). Australiaexperienced the largest decrease in the claims ratio bya wide margin, thanks to premium rate increases andportfolio remediation measures, as well as decreasedloss and loss adjustment expenses. In Japan, areduction in direct claim payments for fire insurance
helped pull down the claims ratio, while the Italiannon-life insurance market benefited from the decreasein claim frequency and from the major attention onfraudulent claims mitigation (subsidized by newregulations).
In Spain and Netherlands, where claims ratiosexperienced significant degradation, competitionhampered the ability of non-life insurers to employpremium pricing as a tool to improve claims ratios.In both markets, insurers lowered premium prices asa means of gaining share in tough markets. Spanish
motor insurers, for example, reduced premiums by10% to 20%. Such price reductions had the effect ofincreasing claims expenses.
Despite ongoing efforts to drive productivity andimprove the bottom line through automation,little change occurred in the operational ratios ofnon-life insurers in most countries. Companies are
striving to make wise investments in technology andautomation, yet most are still struggling to achievethe types of operational benefits that would give thema clear competitive advantage. Only in Germany,where non-life insurers have successfully deployednumerous cost-reduction measures, did operationalratios improve in a significant manner. In the UnitedStates, where the expenses of supporting the world’slargest insurance market are already high, regulatoryrequirements, anti-fraud measures, and legacyreplacement costs drove operational expenses up evenfurther. The industry as a whole needs to continue
to make technology investments aimed at tamingthe inefficiencies and complexities of basic insuranceunderwriting.
Acquisition ratios remained mostly f lat, even asinsurers embraced the use of alternate channelsto distribute products. The burden of supportingmultiple distribution methods may explain thedifficulty insurers have encountered in bringingdown acquisition ratios. Even though digital channelsoffer enormous upside to enhancing the customerexperience and improving profitability by helpinginsurers lower their commission costs, entrencheddelivery channels are likely to continue to play a rolein product distribution for some time. As insurerscontinue to make gains in moving customers toalternate channels, they will begin to reap the benefitsof more streamlined distribution.
Figure 1.4 Non-Life Insurance Performance in Key Ratios, (percentage point change), 2012–2013
Countries / % Point
Change in Ratios,
(2012-13) A u s t r a l i a
J a p a n
C a n a d a
B e l g i u m
G e r m a n y
U . S .
U . K .
N e t h e r l a n d s
S p a i n
I t a l y
S w i t z e r l a n d
F r a n c e
B r a z i l
Claims Ratio
High Deteriorat ion Medium Deter iorat ion Low Change No change Medium Improvement High Improvement
Operational Ratio
Acquisition Ratio
Underwriting Ratio
-6.5 2.9 -0.3 -1.3-17.6 -6.0 -0.6 -1.6 -2.5 -3.0 -0.7 7.4 2.9
0.6 1.3 0.0 0.7-0.4 -0.6 -0.4 0.1 -5.2 1.2 0.6 0.0 0.2
0.3 3.0 0.0 0.61.1 0.0 -0.5 0.4 0.1 -0.4 1.5 -0.6 0.2
-5.6 7.2 -0.3 0.0
S w e d e n
1.1
0.0
-0.1
1.0-16.9 -6.6 -1.5 -1.1 -7.6 -2.2 1.4 6.7 3.3
Note: PP refers to percentage point change; 2013 data for India is unavailable since the consolidated data for Indian insurance firms has not been published yet
▲ refers to changeSource: Capgemini Financial Services Analysis, 2014; Industry Reports from Insurance Associations and Regulators
2 AM Best Reports

8/19/2019 World Insurance Report 2015
http://slidepdf.com/reader/full/world-insurance-report-2015 11/60
11
2015 WORLD INSURANCE REPORT CHAPTER 1
Profit margins for non-life insurers around theworld mostly rose on the strength of improvedunderwriting ratios. Fewer natural disasters,combined with premium rate revisions, led to better
claims ratios. These improved ratios in turn boostedunderwriting ratios, a measure reflecting the overallefficiency of insurance companies. Operationaland acquisition ratios remained mostly unchanged,causing little impact on underwriting ratios or overallprofitability.
U.S. and Australian non-life insurers witnessed thehighest growth in profit margins. The Australianmarket benefited from a massive improvement in theclaims ratio, while the United States experienced amajor decline in natural disasters following a series of
them the previous year. Canada suffered the highestlosses. Despite growth of 3.2% in premium volumes,a large number of natural disasters took its toll onprofitability. The only other country to experiencelosses was Germany, where severe hailstorms struckheavily populated areas.
CONCLUSION
Though non-life insurers experienced the benefits ofa relatively quiet year in 2013, some of our findingsportend growing difficulties in expanding the business
going forward. For one, the volume of premiumsis growing more slowly in developed markets thanemerging ones. Insurers also face a challenge indeveloping an accurate pricing model to assess theimpact of newer risks such as cyber security andincreasing terror threats, which could have a negativeimpact on claims ratio. In addition, insurers continueto leave profits on the table by largely failing to bringdown operational and acquisition costs. With risingglobal temperatures expected to increase the frequencyand intensity of natural calamities, the non-lifeinsurance business is only going to get tougher. Global
non-life insurers will need to tighten up all aspects oftheir businesses to be prepared for this shift.

8/19/2019 World Insurance Report 2015
http://slidepdf.com/reader/full/world-insurance-report-2015 12/60
12

8/19/2019 World Insurance Report 2015
http://slidepdf.com/reader/full/world-insurance-report-2015 13/60
2015 WORLD INSURANCE REPORT CHAPTER 2
13
Alarming Drop in
Customer ExperienceUnderscores RisingCustomer Expectations
C H A
P T E R 2
KEY FINDINGS
Globally, positive customer experiences decreased significantly in 2014, indicating thatsteps taken by insurers are not matching rising customer expectations. North Americawitnessed the largest drop of 8.3 percentage points, followed by Latin America with 5.3percentage points. A steep drop in positive customer experience by the Gen Y segmentcontributed to the large decline in North America. The huge drop in positive experience levelsof U.S. customers enabled Austria to overtake it and emerge as the country with the highestpercentage of customers citing positive experiences.
The agent channel delivered positive experience levels that were almost double thoseof digital channels, suggesting that digital channels are dragging down global customerexperience levels. Customer expectations of digital channels such as mobile and socialmedia are rising rapidly along with their usage and importance. However, more than 40%of customers cited positive experiences through the agency channel, while less than 30% ofcustomers had positive experiences through digital channels such as mobile and social media.
Claims servicing is still an area of concern for most insurers when it comes to enhancingcustomer experience. This process had the lowest percentage of customers with positiveexperiences. In most regions, customers who made a claim in the past year reported positiveexperience levels that were significantly lower than customers who did not make a claim. Forexample, North American customers who made a property claim in the past year reported apositive experience level of 24%, compared to 47% for customers who did not make a claim.
The drop in positive experience levels was much steeper for the Gen Y segmentcompared to other age groups across all regions, especially in the developed markets. In North America, the drop in experience levels for Gen Y customers was approximately10 percentage points steeper than other age segments, while in developed Asia-Pacific the
difference was around five percentage points.
Positive experiences led to better customer advocacy, however advocacy levels variedacross regions. Developing Asia-Pacific (Developing APAC), Latin America, and North
America displayed higher advocacy levels, while those in developed Asia-Pacific (Developed APAC) and Europe were quite low. Only delighted customers (those with very positiveexperiences) displayed positive advocacy.

8/19/2019 World Insurance Report 2015
http://slidepdf.com/reader/full/world-insurance-report-2015 14/60
14
DROP IN POSITIVE CUSTOMER EXPERIENCEWAS PERVASIVE ACROSS THE WORLD
Despite ongoing efforts to improve service, positivecustomer experience levels decreased significantly
across the world in 2014 (see Figure 2.1). The globallevel, already low in 2013 at 32.6%, decreased byanother 3.7 percentage points to 28.9%. Of the 30countries surveyed, 80% recorded a decline in thepercentage of customers with positive experiences.Furthermore, about one-third of these customerswitnessed a decrease of more than 5 percentagepoints.This was the first time we observed such a drasticdrop since we began tracking customer experiencethree years ago.
North America, which in 2013 had the highest levelof positive customer experience at 47.9%, experiencedthe largest decrease (8.3 percentage points), followedby Latin America with a 5.3 percentage point drop.The United States had been the only country in 2013to record positive customer experiences in excess of50.0%. But a large decline of 10.5 percentage pointsresulted in only 40.8% of U.S. customers citing a
positive experience in 2014. As a result of this drop,the United States dropped down to the secondplace behind Austria (see Figure 2.2). This decreasemay have to do with a decline in satisfaction with
digital channels. Positive experience levels for digitalchannels such as mobile and social media was around30%, compared to 50%+ rates for the traditional agentchannel for both life and non-life.
Positive customer experience levels in Europedecreased by 3.4 percentage points to 30.0%,reflecting large declines in countries throughout theregion. Netherlands, France, Germany, Poland, andSpain witnessed the largest declines in Europe, eachrecording decreases in positive customer experience ofmore than 5 percentage points. Portugal was the only
country that had a significant increase (4.8 percentagepoints) in the number of customers with positiveexperiences. However, this increase reflected alreadylow levels of positive customer experience in thecountry and existing room for improvement.
Figure 2.1 Customers with Positive Experience, by Region (%), 2013–2014
22.0%
23.6%
28.7%
30.0%
39.7%
28.9%
24.3%
25.8%
34.0%
33.4%
47.9%
32.6%
Developing APAC
Developed APAC
Latin America
Europe
North America
Global
2013 2014
% Point Change
2013-14
(8.3%)
(3.4%)
(5.3%)
(2.2%)
(2.3%)
(3.7%)
Source: Capgemini Financial Services Analysis, 2014; Capgemini Insurance Voice of Customer Survey, 2014

8/19/2019 World Insurance Report 2015
http://slidepdf.com/reader/full/world-insurance-report-2015 15/60
15
2015 WORLD INSURANCE REPORT CHAPTER 2
In developed and emerging Asia-Pacific, wherepositive customer experience remained the lowest inthe world, the levels decreased further, by 2.2 and2.3 percentage points, respectively. Seven of the tencountries with the least amount of customers havinga positive experience were located in Asia-Pacific in2014. The inability of insurers to meet the constantlyevolving expectations of the tech-savvy populationsthey serve appeared to play a role, particularly in thedeveloped Asia-Pacific markets of Hong Kong, Japan,and Singapore.
POSITIVE EXPERIENCE DROPPED ACROSS ALL CHANNELS, THOUGH AGENT CHANNELSTANDS TALL
The agent channel continued to be most important tocustomers of all ages across all regions. In addition,
it provided the highest levels of positive customerexperience across all markets for both life and non-life insurers (see Figure 2.3). The agent channel was
the most successful in North America with morethan 50% of customers claiming a positive customerexperience. In all other regions, positive experiencelevels through the agent channel were well ahead ofthe remaining channels.
Digital channels, particularly mobile and socialmedia, were found to drag down experience levelsacross the globe, with less than 30% of customersciting positive experiences from these channels inmost markets. Most customers are now accustomed toreceiving exemplary services via the digital channelsfor sectors such as retail, travel, and to a certainextent, banking. Hence their expectations from thesedigital channels are quite high even while receivinginsurance services. As such, the experience levelsfrom digital channels are lower when compared to the
agent channel. The ongoing importance of agents inthe channel mix and their ability to deliver consistent
Figure 2.2 Top 10 and Bottom 10 Countries with Positive Experience (%), 2014
Top 10 Countries for Customers with a Positive Customer Experience (%), 2014
Bottom 10 Countries for Customers with a Positive Customer Experience (%), 2014
44.5%
39.5%
40.6%
38.6%
43.1%
31.3%
39.8%
41.2%
51.3%
43.6%
32.0%
33.0%
33.3%
35.2%
35.7%
36.1%
36.7%
37.3%
40.8%
43.0%
U.S.
Netherlands
Germany
Australia
Switzerland
South Africa
Portugal
Belgium
Canada
Austria
32.2%
29.7%
25.9%
20.4%
21.1%
19.8%
17.5%
22.2%
16.4%
15.0%
24.6%
20132014
23.6%
22.8%
20.6%
20.5%
20.0%
19.7%
19.6%
19.5%
15.2%
India
Poland
Sweden
Russia
Taiwan
Singapore
Hong Kong
Japan
China
South Korea
2014Rank
2013Rank
01
02
03
04
05
06
07
08
09
10
03
01
05
07
16
04
10
06
08
02
2014Rank
2013Rank
30
29
24
28
27
25
26
23
20
13
30
29
28
27
26
25
24
23
22
21
Source: Capgemini Financial Services Analysis, 2014; Capgemini Insurance Voice of Customer Survey, 2013, 2014

8/19/2019 World Insurance Report 2015
http://slidepdf.com/reader/full/world-insurance-report-2015 16/60
16
positive experiences dictates a moderated approach tochannel management. While insurers need to continueenhancing mobile and social media channels, theyshould take care to ensure that these enhancements
are not carried out at the expense of the agencychannel. Rather, ongoing investments need to supportall types of channels, at least for the foreseeable future.
In addition, insurers should strive to bring some ofthe qualities that define traditional channels to thenewer channels, and vice versa. For example, insurersshould try to replicate the intimacy and personalservice that characterize the agent channel as theydevelop more modern channels. Similarly, they shouldempower their agents with digital tools that advancethe convenience and availability found in newer types
of channels.
In the future, usage of Internet-mobile and socialmedia channels are expected to increase more thanusage of traditional channels. Furthermore, the
Internet-PC may challenge the agent channel as themost frequently used channel. It is currently the mostfrequently used channel during pre-sale (informationgathering and quote search) and insurers need to
enhance their seamless integration capabilities in orderto meet expectations in one of the more prevalentcustomer journeys of research online-purchase offline.Customers will continue to place high importanceacross the full range of channels for their insuranceneeds. Insurers thus need to focus on deliveringexcellent service across all channels. Currently, thefrequency of interactions with their insurers is muchhigher for digital channels such as the Internet-PC,mobile, and social media over traditional channelssuch as agent and phone (see Figure 2.4). Insurersalso have more opportunities to provide positive
experiences to Gen Y customers as they interact withtheir insurer on a more frequent basis, especially usingmobile and social media channels. As the popularity
Figure 2.3 Positive Experience Levels by Channel and Region (%), 2014
38%
34%
36%
35%
43%
34%
30%
29%
31%
38%
Agent Phone Internet-PC
Internet-PC
35%
31%
29%
36%
40%
Agent Phone Internet-Mobile
Internet-Mobile
Social Media
Social Media
35%
30%
33%
38%
43%
Latin America
Developing
APAC
Developed
APAC
Europe
North America
Latin America
Developing
APAC
Developed
APAC
Europe
North America
32%
28%
22%
25%
33%
31%
29%
26%
22%
32%
29%
30%
23%
26%
30%
31%
32%
29%
27%
35%
Non-Life
Life
43%
38%
35%
40%
51%
49%
42%
41%
47%
57%
Source: Capgemini Financial Services Analysis, 2014; Capgemini Insurance Voice of Customer Survey, 2014

8/19/2019 World Insurance Report 2015
http://slidepdf.com/reader/full/world-insurance-report-2015 17/60
17
2015 WORLD INSURANCE REPORT CHAPTER 2
of digital channels continues to rise, insurers can usethem to increase the frequency of touch points and thenumber of opportunities to wow customers.
CLAIMS SERVICING STILL A CONCERN, BUTEFFORTS TO ENHANCE CLAIMS EXPERIENCERESULTED IN MARGINAL IMPROVEMENTS
The multi-faceted insurance lifecycle offers numerousopportunities for insurers to provide positiveexperiences to customers. Yet across almost everydimension of the lifecycle, insurers struggled to do so.
The level of positive customer experience declined fornearly all types of activities related to purchasing andholding all types of insurance policies (see Figure 2.5).
Non-life insurance customers recorded the biggestdeclines in positive experience compared tolife customers. Positive experience in the policyacquisition phase of non-life insurance declined by 5.1percentage points, followed by policy servicing, with adecline of 5.0 percentage points, and quote gatheringwith a decline of 3.6 percentage points. Despitethese large decreases, the level of positive customer
experience in non-life insurance is still considerablyhigher than in the life insurance sector, where year-to-year declines were smaller.
Figure 2.4 Frequency of Channel Usage – Gen Y Customers vs. Others (%), 2014
0%
25%
50%
75%
100%
Gen Y Others Gen Y Others Gen Y Others Gen Y Others Gen Y Others
Agent Phone Internet - PC Internet - Mobile Social Media
YearlyTwice a Year Once in Three MonthsOnce a MonthWeekly Never
11%
3%
15%
8%
12%
10%
14%
17%
19%
33%
28% 29%
17%
7%
18%
11%
15%
14%
13%
19%
14%
25%
23% 24%
25%
14%
20%
16%
14%
14%
11%
15%
12%
19%
19%22%
20%
10%
18%
10%
11%
9%
8%
8%
9%
10%
34%
54%
18%
8%
13%
7%
9%
6%
7%
5%
8%
8%
44%
66%
Source: Capgemini Financial Services Analysis, 2014; Capgemini Insurance Voice of Customer Survey, 2014
Claims servicing remains the lifecycle stage with thelowest levels of positive experience for both life andnon-life customers; however, the decline in experiencelevels was lowest for claims servicing. The lower rateof decline indicates that insurers are taking stepsto enhance the claims experience. Nevertheless,customers still view these efforts as inadequate.Effectively leveraging technology to minimize theimpact of risk and deliver faster processing can helpenhance the overall claims experience of customers.
A close look at the data related to claims servicingunderscores the difficulty of delivering positivecustomer experiences in that area (see Figure 2.6).
Auto and property insurance customers who made anyclaim in the past year had significantly lower positiveexperience levels than customers who did not makea claim. In North America, for example, only 24% ofproperty insurance customers who made a claim inthe past year reported a positive experience, comparedto 47% of customers who did not make a claim.
The lower levels of positive experience related to
claims servicing were pervasive, despite ongoingefforts insurers have made to automate the claimsprocess. For customers increasingly accustomed

8/19/2019 World Insurance Report 2015
http://slidepdf.com/reader/full/world-insurance-report-2015 18/60
18
Figure 2.6 Impact of Claims on Positive Customer Experience
Customers with Positive Experience for
Auto Insurance, by Region (%), 2014
Customers with Positive Experience for
Property Insurance, by Region (%), 2014
Customers who haven’t made any claim in the past yearCustomers who have made a claim in the past year
Developed
APAC
32%
31%
27%
33%
Europe31%
39%
30%
40%
31%
38%Latin America
34%
34%
North America37%
46%
24%
47%
Developing
APAC
26%
29%
20%
29%
Source: Capgemini Financial Services Analysis, 2014; Capgemini Insurance Voice of Customer Survey, 2014
Figure 2.5 Insurance Customers with Positive Experience, by Lifecycle Stage (%), 2013–2014
Life Non-Life
20142013
% Point Change
2013–14
(1.2%)
(1.8%)
(0.1%)
0.7%
% Point Change
2013–14
(3.6%)
(5.1%)
(5.0%)
(2.3%)35.1%
34.4%
37.0%
37.1%
38.6%
40.4%
37.3%
38.5%
40.7%
43.0%
42.8%
47.8%
44.3%
49.5%
44.6%
48.2%
Claims Servicing
Policy Servicing
Policy Acquisition
Quote Gathering
Source: Capgemini Financial Services Analysis, 2014; Capgemini Insurance Voice of Customer Survey, 2014
to conducting a wide range of personal activityvia streamlined, frictionless internet and mobiletransactions, the insurance claims process likelyfeels inconvenient and cumbersome. The pressure
for insurers to provide a quick and efficient response
is even greater, given that claims are typically tied toan undesirable incident. Additionally, faster claimsprocessing can save significant costs for the insurer.The longer a claim remains open, the more it is
going to cost the insurer. Insurers’ performance in

8/19/2019 World Insurance Report 2015
http://slidepdf.com/reader/full/world-insurance-report-2015 19/60
19
2015 WORLD INSURANCE REPORT CHAPTER 2
claims servicing is probably the result of customerexpectations that have been set beyond most insurers’current capabilities.
GEN Y SEGMENT PRESENTS HUGE CHALLENGEFOR INSURERS, ESPECIALLY IN DEVELOPEDMARKETS, AS THEY STRIVE TO MATCH RISINGEXPECTATIONS
Generation Y, the customer segment aged between18 and 34, is said to be comprised of individualswho are confident, ambitious and most important,tech-savvy. Having never experienced adult lifewithout the aid of the internet or smart devices,digital technology is essential to the Gen Y lifestyle.
With Gen Y comprising one-quarter to one-third ofthe population in many markets, this segment is of
high importance to insurance firms, especially giventhe high potential of their lifetime values. Insurersmust devise strategies that can attract and retainthis valuable age segment. The downside is that Gen
Y expectations are quite lofty. Any failure to matchthese expectations will result in a negative impact onexperience, as witnessed in our findings this year.
Especially in developed markets, the drop in customerexperience levels for Gen Y customers was very steep(see Figure 2.7). For life customers in developed Asia-Pacific, for example, the positive experiences of Gen
Yers decreased by 5.4 percentage points, compared
to an increase of 1.5 percentage points for those older
Figure 2.7 Change in Customers with Positive Experience, by Age and Region (%), 2013 –14
Life Non-Life
(1.6%)
(1.4%)
(0.6%)
1.5%
1.3%
(2.3%)
(3.0%)
(3.1%)
(5.4%)
(10.9%)
(6.0%)
(6.4%)
(3.8%)
(2.5%)
(7.9%)
(6.7%)
(2.7%)
(7.2%)
(7.3%)
(14.6%)North America
18-34 Years 34+ Years
Developed APAC
Europe
Developing APAC
Latin America
Source: Capgemini Financial Services Analysis, 2014; Capgemini Insurance Voice of Customer Survey, 2014
than 34. In North America, the difference was evenmore marked, with positive experiences decliningby 10.9 percentage points for Gen Yers, comparedto an increase of 1.3 percentage points for older
respondents.
This decrease in positive experience for Gen Ycustomers contributed significantly to the overalldecline in positive experience levels throughout theindustry. The largest Gen Y-related decreases occurredin North America among life and non-life customers,as well as in developed Asia-Pacific and Europe amongnon-life customers. These results underscore the veryhigh service expectations that Gen Yers have cultivatedas a result of having grown up on a full array of digitalmedia and servicing from a wide range of providers.
As a result, insurers must continue to adapt the qualityof their automated digital services to cater to thehigher expectations of Gen Yers, or risk losing them tonewer, more agile competitors.
Gen Y Customers Place Much Higher Importanceon Mobile, Social Media ChannelsGen Y customers, given their affinity for technologyand their expectations around instant access toinformation and service convenience, are far moreinterested than older customers in using advancedalternate channels (see Figure 2.8). In North America,

8/19/2019 World Insurance Report 2015
http://slidepdf.com/reader/full/world-insurance-report-2015 20/60

8/19/2019 World Insurance Report 2015
http://slidepdf.com/reader/full/world-insurance-report-2015 21/60
21
2015 WORLD INSURANCE REPORT CHAPTER 2
The majority of customers, no matter their age, hadfewer positive experiences regardless of the channelthey used. This widespread dissatisfaction may be areflection of the difficulties providers are having asthey maintain existing channels while also addingnew ones. The most significant difference betweenGen Y and non-Gen Y customers came in theirassessment of social media. More than 50% of Gen
Yers cited social media as an important channel,compared to only 30% of older customers.
CUSTOMER ADVOCACY LAGS IN EUROPE AND DEVELOPED ASIA-PACIFIC
For insurers interested in acquiring new customersand strengthening their market position, there is nobetter ally than the customer advocate. Our findingsrelated to customer advocacy3 proved that positivecustomer experience is fundamental to increasingcustomer advocacy (see Figure 2.10 and Figure 2.11).Further, some regions have much higher advocacylevels than others.
Figure 2.9 Importance vs. Positive Experience with Channel for Gen Y Customers and Others, 2012–2014
Customers with positive experience with channel (%)
C h a n n e l I m p o r t a n c e ( % )
2012 2014Gen Y Others
Agent
Phone
Bank
BrokerInternet-Mobile Internet-Mobile
Internet-Mobile
Internet-Mobile
Agent
Broker
Bank
Phone
Internet-PC
Internet-PC Internet-PC
Internet-PC
Social Media
Agent
Broker
Bank
Phone
Agent
BrokerBank
Phone
Social Media
30%
40%
50%
60%
70%
80%
10% 20% 30% 40% 50%
Source: Capgemini Financial Services Analysis, 2014; Capgemini Insurance Voice of Customer Survey, 2014
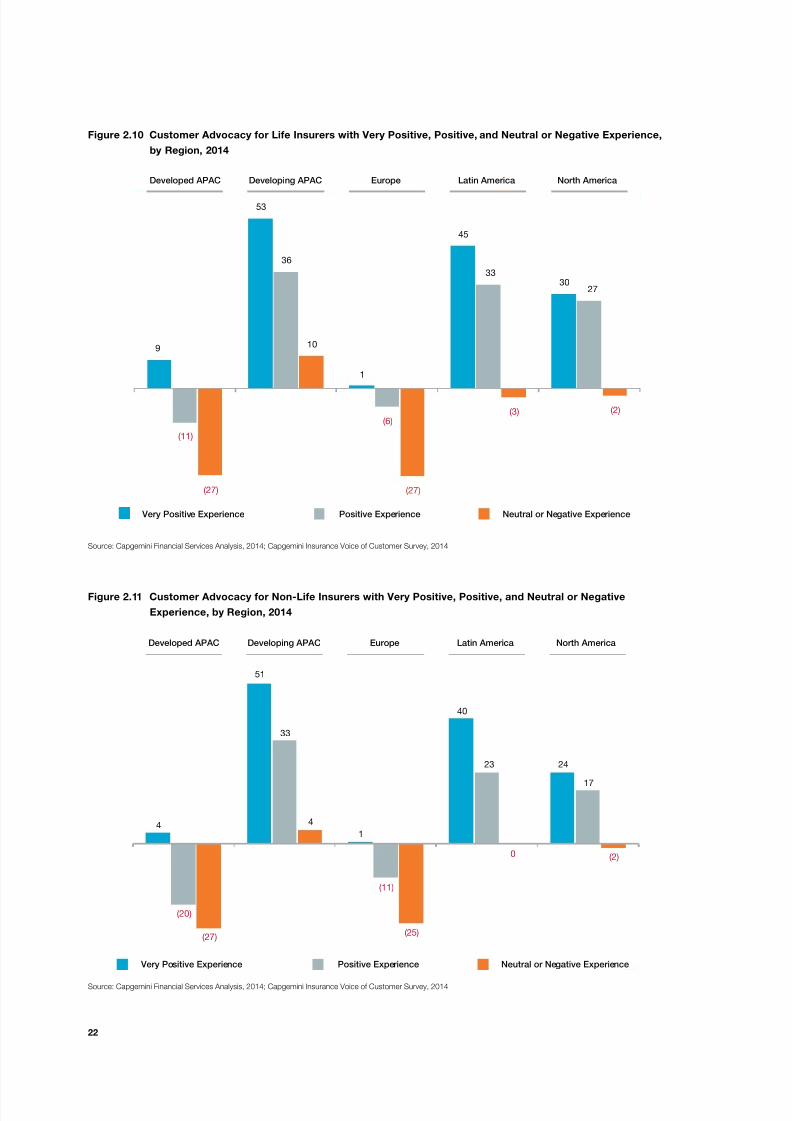
In developing Asia-Pacific, Latin America, and North America, customers with very positive and positiveexperiences displayed much higher advocacy levelsthan customers with neutral or negative experiences.In developing Asia-Pacific and Latin America,customers who had very positive experiencesrecorded the highest advocacy levels-53 and45, respectively, for life customers, and 51 and 40,respectively, for non-life customers
Meanwhile, customer advocacy levels in developed
Asia-Pacific and Europe were much lower than inother regions. Though delighted customers (i.e., thosewith very positive experiences) in developed Asia-Pacific and Europe had higher levels of customeradvocacy, the levels did not reach nearly the sameheights as in other regions. In effect, insurers mustaim very high in providing a delightful experience.
3 “Customer advocacy rates were calculated by asking customers how likely they were to refer a friend, family member, or colleague, and
determining the difference between the percentage of customers likely to refer and those not likely"
8/19/2019 World Insurance Report 2015
http://slidepdf.com/reader/full/world-insurance-report-2015 22/60
22
Figure 2.10 Customer Advocacy for Life Insurers with Very Positive, Positive, and Neutral or Negative Experience,
by Region, 2014
(27)
9
53
1
45
30
(11)
36
(6)
33
27
10
(27)
(3) (2)
Developed APAC Developing APAC Europe Latin America North America
Very Positive Experience Positive Experience Neutral or Negative Experience
Source: Capgemini Financial Services Analysis, 2014; Capgemini Insurance Voice of Customer Survey, 2014
Figure 2.11 Customer Advocacy for Non-Life Insurers with Very Positive, Positive, and Neutral or Negative
Experience, by Region, 2014
(27)
4
51
1
40
24
(20)
33
(11)
23
17
4
(25)
0 (2)
Developed APAC Developing APAC Europe Latin America North America
Very Positive Experience Positive Experience Neutral or Negative Experience
Source: Capgemini Financial Services Analysis, 2014; Capgemini Insurance Voice of Customer Survey, 2014

8/19/2019 World Insurance Report 2015
http://slidepdf.com/reader/full/world-insurance-report-2015 23/60
23
2015 WORLD INSURANCE REPORT CHAPTER 2
Especially for customers in Europe and developed Asia-Pacific, the delivery of a very positive experiencehas become a bare minimum necessity.
An important point to note is that even for thosecustomers who had a positive experience, theadvocacy levels were negative in the regions of Europeand developed Asia-Pacific (-6 and -11, respectively forlife insurance and -11 and -20, respectively, for non-lifecustomers).
CONCLUSION
Expectations are one of many factors that lead topositive customer experiences in the insuranceindustry. As customers have become increasinglyexposed to advanced digital services from a wide
range of providers, their expectations with respectto insurers have become heightened. Insurers havehad a hard time meeting these higher expectations,particularly when it comes to the complicatedmatter of settling claims, or interacting with digitallydemanding Gen Yers.
Insurers can take a number of steps to counteract thenegative impact that heightened expectations havehad on the level of positive customer experiences.Given the strong affinity that customers have toward
traditional channels like agents, and the growingpopularity of alternate channels, insurers shouldstrive to blend the most beneficial qualities of each.
Agents can be empowered with digital tools, whilealternate channels can become more customized andpersonalized.
Hitting upon a winning formula for service deliverycan help insurers move back up the scale in creatingpositive customer experiences. Such experiencesare crucial to building customer advocacy, an all-important measure of customer loyalty, engagement,
and profitability.

8/19/2019 World Insurance Report 2015
http://slidepdf.com/reader/full/world-insurance-report-2015 24/60
24

8/19/2019 World Insurance Report 2015
http://slidepdf.com/reader/full/world-insurance-report-2015 25/60
2015 WORLD INSURANCE REPORT CHAPTER 3
25
C H A P T E
R 1
Disruptive Change
Requires Insurers of theFuture to SharpenStrategic, Analytic Skills
C H A
P T E R 3
2015 WORLD INSURANCE REPORT CHAPTER 3
WIDE VARIETY OF DISRUPTORS LOOM
For decades, even centuries, the classic insurancesale has involved a warm handshake. Agentsselling traditional products focused on deliveringpersonalized service through face-to-face visits, oftenin a customer’s own home or office. The consultativeselling process, which hinged on lengthy relationshipbuilding, could take weeks.
When the internet entered onto the scene in the late1990s, communication that was once dependenton human interaction found a new outlet. Though
agents and brokers continued to be the preferred saleschannel, the internet began to attract greater numbersof users, while the addition of other alternate channelsfragmented distribution even more. Internet-PC hasnow become the second most preferred channel forinsurance customers and is fast catching up with thetraditional channel of agent.
Though the internet’s influence has been significant, itwas only the first of several disruptors impacting theinsurance industry in a significant manner (see Figure3.1). Insurers are going to be impacted significantly
KEY FINDINGS
Big Data analytics is expected to have the biggest impact by far on the insurance industry,with 78% of executives citing it as a key disruptive force. Regulatory change was rankedsecond at 46% and economic uncertainty ranked third at 42%.
These top three disruptive forces represent only a small portion of the many factorsexpected to dramatically affect the insurance landscape. Other disruptive agents includedemographic shifts, extreme weather events, new competition from non-insurers, andadvanced technology.
Insurers globally are falling short of their desired maturity levels in every one of sevencore capabilities identified in our Insurance Capability Maturity Model (see Figure 3.7). Tobetter prepare for the many changes looming ahead, insurers must assess their current strengthsand weaknesses, and develop a strategic plan for moving forward.
Insurers globally are performing at the lowest maturity levels when it comes to capabilitiesrelated to customer interactions. These include connecting elegantly with customers, engagingregularly with them, and having a complete view of customer data and relationships.
Regional differences are exhibited by insurers in their maturity levels related to variouscapabilities. Insurers in North America operated at much higher maturity levels across all corecapabilities when compared to those in other regions.
To move from the current states of mostly basic and median competency to leading-edgeand advanced practices, insurers must adopt a more customer-centric approach. The useof analytics to assimilate customer data, view relationships as a whole, and deliver personalizedproducts through appropriate channels will be essential to succeeding as a customer-oriented
insurer of the future.

8/19/2019 World Insurance Report 2015
http://slidepdf.com/reader/full/world-insurance-report-2015 26/60
26
in the very near future and in some cases they arealready facing the impact. This series of rifts will affectthe industry’s traditional products, processes, andchannels, forcing insurers to innovate or lose out on
new opportunities.
The disruptors on the horizon encompass a widerange of change.
Demographic ShiftsGlobally, the population of people aged 65 years andolder is expected to triple to 1.5 billion by mid-century4, presenting a host of economic and socialburdens. For insurers, the aging population will likelytrigger higher demand for products related to anolder customer base, such as retirement income and
long-term care insurance. Increasing rate of urbanmigration, especially in emerging markets, is alsoleading to change in the demand for different insuranceproducts. The shifting population will also affect theprocesses insurers use to calculate vital rates, as well asassumptions about future ranges of uncertainty, whichwill inf luence product pricing and underwriting.
Aside from an aging population, the number of teendrivers and single-parent families are expected torise in the future. The longevity of the world’s olderpopulation, combined with growing numbers of
younger customers, will put pressure on insurersto offer a full suite of robust delivery channels thatcan meet the broad range of customer distributionpreferences. In effect, from a demographic perspective,insurers have opportunities to offer new products foran aging population, as well as multi-faceted deliverychannels for an increasingly diverse customer set.
Increased Frequency of Extreme Weather EventsGrowing rates of natural calamities, combined withincreasing urbanization of disaster-prone areas,is causing the economic costs of calamities to rise
precipitously. Three times as many natural disastersoccurred from 2000 through 2009, as did from 1980through 1989, with growth in climate-related eventsaccounting for nearly 80% of the increase.5 From 1980to 2011, estimated damages caused by natural disastersrose from about $25 billion to about $350 billion.6
4 “Attitudes about Aging: A Global Perspective”, Pew Research Global Attitudes Project Januar y 30, 2014.
5 “Natural Disasters, Armed Confl ict and Public Health”,The New England Journal of Medicine, Jennifer Leaning, MD and Debarati Guha-Sapir,
PhD, November 13, 2013
6 EM-DAT, The International Disaster Database, www.emdat.be/natural-disasters-trends
Figure 3.1 Key Disruptors for Insurers
Disruptors
Where Are
My New
Customer
Segments?
Why Aren’t
My Investment
Returns
Attractive?
What’s the
Reason for
Rising Claims
Expenses?
Who’sEating
My Pie?
Is Big
Brother’s
Supervision
Increasing?
How Is
It All
Connected?
Demographic Changes
Demographic changesinfluence product pricing,
underwriting as life
expectancy continues to
increase across major
markets along with
increasing urbanization
Financial and Economic
Conditions
Insurance industry
continues to operate in an
uncertain macroeconomic
environment which might
negatively impact
investment returns
Regulatory Intervention
and Scrutiny
Insurers now have to
comply with higher number
of regulations leading to
increased data storage and
reporting; regulators are
pushing insurers toward
improved transparency
Extreme Environmental
Conditions and
CatastrophesRecently recurring
catastrophic events in
places without prior history
such as tsunami, storm,
floods, etc have resulted in
increased costs for insurers
New Entrants (Non-Core
Insurance Players)
New competition has
emerged from non-core
insurance players such as
Walmart and Google, as
they enter the insurance
arena
Technology
Advancements
The connectivity of devices
has led to an age of
Internet of Things making it
necessary to invest in
social media, mobile,
analytics, and cloud
computing
Source: Capgemini Financial Services Analysis, 2014

8/19/2019 World Insurance Report 2015
http://slidepdf.com/reader/full/world-insurance-report-2015 27/60
27
2015 WORLD INSURANCE REPORT CHAPTER 3
The rising cost of claims associated with disasters ischanging the landscape of the insurance business.From a product perspective, insurers need to consideradding riders to their policies, as well as new products,
to address co-insurance needs. In terms of processes,insurers have an immediate need to expand theiruse of advanced modeling tools to better predictcatastrophes and expected losses. From a channelpoint of view, disasters offer insurers the opportunityto move more customers to alternate channels. In anemergency, more customers may be impelled to turnto alternate channels such as mobile and social mediato receive faster turnarounds on claims. Insurerscould also use these channels to warn customersabout impending disasters, as a way of mitigatingrisk. Though extreme weather poses serious threats,
insurers have tools at their disposal, such as analytics,to predict catastrophic events and the incidence ofclaims, which help them better manage the eventand overcome risks, positioning the company with acompetitive advantage.
New Entrants
Many companies with little or no backgroundin insurance see opportunity to bring greatertransparency and simplicity to the processes ofresearching and purchasing insurance. Thesecompanies have inherent advantages that may positionthem as threats to existing insurers. The U.S. discountretailer Walmart, for example, plans to market healthinsurance plans online and through its stores to itsmassive existing loyal customer base7, an effort thatcould fracture existing ties insurers have with theircustomers and distributors. Insurers are also waryof high-tech firms like Google or Amazon, whichcould parlay their expertise in areas such as searchengines and one-click shopping to the insurancearena. Google has in fact made some inroads in thisdirection with the acquisition of an aggregator websiteBeatThatQuote.com in the U.K. region. Other pursuitsof Google such as driverless cars, Google Glass, and
automated home technology are likely to have hugeimplications on the insurance industry.
The threat of competition from new, innovativeentrants should propel insurers to aim higher interms of developing more personalized productsand delivering them through convenient, digitalchannels. Opportunities exist for insurers to take
advantage of in-house customer data to developproducts that reflect improved risk profiling and theimpact of customer life events. Insurers may also wantto consider forming strategic alliances with non-
traditional players to broaden their expertise in areassuch as product distribution and development andgain access to better risk profiling.
Economic UncertaintyFive years on from the financial crisis, the globaleconomy still is not back to its pre-crisis form, raisingthe specter of an ongoing strain on insurance profitmargins. In addition, the persistent global financialpressure may cause consumers to curtail theirpurchases of cars and homes, thus lessening demandfor basic insurance products. Near-zero interest rates
in several developed markets also have a significantimpact on insurers’ investment returns.
Increasing uncertainty about profit margins couldhave a significant impact on product line-ups. Insurersmay want to simplify their existing product lines sothat it becomes easy for customers to understandthese products better and thereby enable sales throughdirect channels or develop niche products for whichthey can charge higher premiums. In addition,consumer demand for various products may shiftbased on prevailing economic conditions, creating the
need for insurers to flexibly respond with both saferfixed-income products and higher-return, equity-linked products. Finally, dampened buying behaviorby consumers may lead insurers to develop newproducts built around evolving consumer models.
An example of one such model is the car-sharingservice, Zipcar.
With rising economic uncertainty, insurers will feelgreater pressure to increase operational efficienciesand reduce the time to market for new products. Theymay also want to optimize their distribution channelsby pushing simpler products toward alternate
channels as a way of reducing costs, while utilizingthe agency network to leverage the potential for cross-selling and up-selling. All in all, financial pressureswill likely encourage insurers to become bolder aboutchoosing and executing upon a particular strategy-beit in product innovation, operational improvement, orchannel distribution-to overcome the profit pressuresof financial instability.
7 “You Can Now Get Health Insurance at WalMart”, Huff Post Business, Anne D’Innocenzio, October 6, 2014

8/19/2019 World Insurance Report 2015
http://slidepdf.com/reader/full/world-insurance-report-2015 28/60
28
Regulatory Change
One outcome of the global financial crisis hasbeen a comprehensive examination of supervisorypractices, accompanied by a raft of new guidelines
and requirements for insurance firms and theirholding companies. New sets of complex regulatoryand reporting standards are affecting all aspects ofthe business, including financial reporting, capitalfinancing, consumer protection, risk management,exposure, transparency, and others. This regulatorychange is occurring at the national, global, andregional levels.
In some cases, the regulatory burden could be onerousenough to cause insurers to alter existing products oreven stop offering certain ones altogether. At the very
least, many insurers expect to introduce changes inproduct design and pricing in response to impendingregulatory requirements. Insurers will need tounderstand how regulatory changes will impactthe business and long-held processes, and ensurethey have the technical knowledge and expertiseto properly implement the new rules, as well as putin place appropriate measures for ongoing control
and governance. They will need to have systems anddistribution channels that are flexible enough toincorporate the regulatory changes and also adapt tofuture ones. For well-prepared insurers, the massive
amount of regulatory change offers an opportunityto assess and upgrade current reporting functionsand enterprise risk management, as well as evaluatewhether new talent is needed.
Internet of Things
The internet, already a source of lasting impact onthe insurance industry, will continue to act as a majordisruptor as it evolves to incorporate the Internet ofThings (IoT). Any type of natural or man-made objectcan become part of the IoT network and have theability to transfer data over it. Under such a scenario,
devices such as heart monitors, car engines, and stressgauges on bridges, will be able to transmit real-timestatus information to data stores where it can beanalyzed.
Access to all this data could fundamentally alter theinsurance business by providing a much more detailedview of an insurer’s exposures and risks. Insurers
Figure 3.2 Disruptors with Maximum Impact on Insurance Industry (%), 2014
1%
1%
4%
2%
7%
8%
18%
14%
25%
20%
5%
6%
7%
7%
10%
7%
7%
7%
16%
27%
3%
3%
4%
12%
5%
8%
10%
21%
5%
31%
9%
10%
15%
21%
22%
23%
35%
42%
46%
78%
0% 20% 40% 60% 80%
New Risk Perceptions
Social Media
Extreme Weather Events
Internet of Things
New Entrants
Mobile Applications
Changing Demographics
& Millennials
Financial / Economic
conditions
Increased Regulatory
Oversight
Big Data Analytics
Rank 1 Rank 2
Disruptors with Maximum Impact on Insurance Industry (%), 2014
Rank 3
“Regulators aim to protect
the consumer, which is
laudable, but there are now
multiple regulators with
sometimes conflicting
agendas. This creates much
difficulty for us.”
- CIO of a Leading
Insurance Firm in Europe.
“Statistics, better risk
profiling and the huge
amount of information
that can be retrieved from
users’ experience or
obtained from the web
and social networks will
enable a change in the
logic of the definition of
pricing: from static
conventional variables todynamic behavioral
variables” - Filippo
Sirotti (CEO, Quixa)
“Changing demographics
change the expectations of
what is required from
insurance cover. Newer
generations and the impactof austerity have created a
different attitude to risk and
what customers may be
happy to cover for them
selves. Customers are more
savvy and more willing to
trade. New generations in
particular have different
values and priorities.
Insurance is not as high a
priority – but once they buy
it then they expect to get
more in return.”
- Matthew Thomas
Director Strategy and
Planning Ageas UK
Source: Capgemini Financial Services Analysis, 2014; Capgemini WIR 2015 Executive Interviews

8/19/2019 World Insurance Report 2015
http://slidepdf.com/reader/full/world-insurance-report-2015 29/60
29
2015 WORLD INSURANCE REPORT CHAPTER 3
could use this data to redesign or re-price products tomake them less risky and more profitable. Further, bydeveloping a robust, multi-channel feedback loop withcustomers, insurers will be able to act upon the data
they receive and potentially reduce losses. The IoT willno doubt tax the ability of insurers to store, model, andanalyze all the data it generates. Privacy issues willalso likely arise, perhaps leading to more burdensomeregulations. But for insurers who embrace thesechallenges, the IoT offers the potential to expand thelevel of detail related to every aspect of the business,from product design and pricing, to underwriting,service, and claims.
Largest Disruptor of All is Analytics A common denominator in all of these forces is the
powerful impact that data analytics can have onilluminating both the risks and opportunities relevantto each disruptor. In every case, analytics based on BigData can be used to identify threats and minimize theincidence of loss. In fact, industry executives identifiedBig Data analytics as having the greatest impact onthe insurance industry, with 78% ranking it as one ofthe top 3 disruptors, well above increased regulatoryoversight, which was ranked by 46% of executives(see Figure 3.2). In North America, insurers believeanalytics will have more impact on the insuranceindustry than any other disruptor. In Europe and Asia-Pacific, insurers ranked it as a close second. Because ofits reach, analytics has the potential to change the verynature of the business. Several insurance executives
expect analytics to enable a change in their pricingmodels that are currently based on static conventionalvariables to more accurate and dynamic behavioralvariables. Given its expected impact on pricing,
underwriting, and the business in general, insurersmust begin sharpening their expertise and skills inanalytics in short order.
QUICKENING TRENDS POINT TO ADDITIONAL VULNERABILITIES
Insurers may be in the business of identifying andminimizing risks, but that does not make themimmune to outside forces. The disruptors outlinedin the previous section make insurers vulnerableto several trends in the near future, all of whichhave the potential to undermine the business, if no
counterbalancing measures are taken.
Rising Consumer Expectations
Consumers have become accustomed to the idea ofinstant gratification through the web, as capabilitieslike one-click shopping, instant downloads, andimmediate access to a person’s full social networkbecome the norm. The rapid-response serviceconsumers receive from other providers hasheightened the expectations they have of theirinsurers, making it only natural that they should startto demand capabilities like personalized insuranceproducts and location-based awareness. Among otherdemands, customers expect simpler procedures forchoosing, paying for, and renewing policies, and
Figure 3.3 Importance of Seamless Channel Experience (%), 2014
2.0% - Not Important at all
4.2% - Somewhat Unimportant
1.3% - Unimportant
22.2%
Important
14.7%
Very Important
26.8%
Neutral
28.8%
Somewhat Important
Source: Capgemini Financial Services Analysis, 2014

8/19/2019 World Insurance Report 2015
http://slidepdf.com/reader/full/world-insurance-report-2015 30/60
30
quicker claims processing through improvementssuch as photo and video estimating, ease of uploadingdocuments and proofs, mobile-based paymentsand receipts, automated assignment of claims to an
adjuster, and straight-through processing.
Meeting the higher expectations of consumers willrequire insurers to place greater value on customerperceptions. Insurers will need to review, andpotentially revamp, every angle of the insuranceprocess from the customer perspective. Better visibilityon pricing, quicker problem resolution, improvedprivacy protections, and greater product choice willbe among the priorities of customers in this newenvironment. To better compete, insurers mustbe prepared to make the necessary investments to
becoming fully customer centric.
Changing Channel Preferences
Non-traditional channels, not only the internet, butalso mobile and social media have already had a largeimpact on insurance sales and distribution. Overtime, growth in these alternate channels is expectedto continue to expand, both organically and at theexpense of traditional channels. And even though in-person agents will remain relevant to the sales process,alternate channels, such as video, e-mail, text, andsocial media, will increasingly be used to supplement
their interactions.
Currently, social media accounts for a small portionof insurer transactions. Most insurers (85%) view itmore as a vehicle for improving and building theirbrand image. But many other value-added focus areasexist, including connecting agents with customers andproviding a feedback loop for customer opinions.
Aside from supporting a wide range of channels,insurers need to ensure customers can moveseamlessly between channels and receive consistentservice across all of them. More than two-thirds of thecustomers noted that it is important for their insurerto offer a seamless channel experience (see Figure3.3). Among the customers who received a seamlesschannel experience from their insurer, 51.3% of themwere satisfied with the level of service being offered.The positive experience levels of customers who weresatisfied with the seamless channel experience offeredby their insurer are quite high at 72%. Offering high-quality, seamless channel service is a highly effectivestrategy that can enhance customer experiencesignificantly.
Entry of Non-core Insurance PlayersConsumer companies that have built up largecustomer bases through their online or digital
platforms have the ability to enter the insurancespace free from the burden of legacy platforms. Suchcompanies could lure away potential new customers,presenting a considerable threat. The Japanese
shopping site, Rakuten, for example, is leveraging itswell-established customer connections and advanceddigital servicing capabilities to offer insurance policiesover the internet at very low premiums. Alternatively,insurers could band with new types of competitors,entering into strategic alliances that would draw uponthe strengths of each firm. Already, such alliances havetaken on multiple forms. American Family Insurancein the United States has teamed with Microsoft tosupport startups that specialize in advancementsleading to safer and smarter homes. Allstate Canadahas teamed with a provider of home monitoring and
security to offer a 25% discount to customers whoinstall the system.
Coles, one of the largest supermarket chains in Australia, which began offering car insurance in2010, has recently entered the life insurance space aswell. While its car insurance is issued by Wesfarmersinsurance, the life insurance partnership is withMetLife. Due to its vast customer reach, Coles hasbeen successful in increasing the number of insurancepolicies sold on a regular basis. As of May 2014, Coleshas signed up more than 330,000 insurance customerswhile its rival supermarket, Woolworths, has close to125,000 insurance customers. Such alliances illustratethe need of insurers to be open to the possibilities ofthe services that outside providers can offer.
Emergence of Niche Insurance Products
New business models and markets are leading to theemergence of unknown risks. The advent of driverlesscars, for example, raises questions around liability. Inthe event of driverless accidents, liability could shiftto manufacturers and software providers, creating theneed for a new type of insurance product. Similarly,growing cyber-security threats are increasing the
need for new types of cyber insurance. Other factors,like rising air pollution and the expanding use ofe-cigarettes, may potentially trigger liability claimsin the future, though the exact level of risk related tothese factors is still unknown. Insurance firms thatcan accurately assess and price these new types ofrisks will have a competitive advantage as these nicheinsurance products emerge.
Risk Mitigation TechnologiesIndustries including automotive, health care, andhome security are exploring the use of various
technologies to help them reduce consumer risks.Over the next several years, carmakers are expectedto develop and make available a wide range of risk-

8/19/2019 World Insurance Report 2015
http://slidepdf.com/reader/full/world-insurance-report-2015 31/60
31
2015 WORLD INSURANCE REPORT CHAPTER 3
mitigating technologies, including telematics aimed atdelivering safety services directly to cars, and collisionavoidance systems aimed at reducing the severity ofaccidents (see Figure 3.4). These technologies have
the multiple benefits of minimizing risks, while alsoproviding insurers with information that can beused to sell more personalized products and increasecustomer intimacy. Our research found that 65% ofcustomers would let insurers monitor their drivingbehavior in exchange for reduced premiums based onpositive risk assessments.
Advancements in health care are similarly makingit possible for insurers to monitor the health of theircustomers. For example, fitness bands and other typesof wearable technology can be used to detect physical
changes or unhealthy behaviors. Despite data privacyconcerns, a majority of customers (56%) are willingto allow insurers to track their health conditions inreturn for reduced premiums in the case of a positive
risk assessment. The Vitality Group, a member ofSouth Africa based Discovery Holdings Limited, isan early innovator in this field, granting customerspremium discounts and other rewards for improving
their health and fitness.
More than 50% of non-life customers are willing toallow insurers to monitor their driving habits in returnfor better risk assessment and personalized advice,while nearly two-thirds of them would allow insurersto do so in return for a reduced premium for a positiverisk assessment (see Figure 3.5). Several insurers havealready begun to leverage telematics for this purposewhile others are likely to follow suit in the near future.
Finally, technology in the form of smart home
systems is also affecting insurers. Such systems detectthe risks of f loods, fires, gas leaks, and burglaries,triggering real-time alerts to customers and insurers.Ideally, such systems will work on a proactive basis to
Figure 3.4 Expected Timelines for Adoption of Risk Mitigation Technologies in Auto Industry
2012 2013–2017
Mandatory a
Telematics
Robot/Driverless
Cars
Robot/Driverless
Cars
Collision Avoidance
Automated TrafficLaw Enforcement
Collision Avoidance
Automated Traffic
Law Enforcement
Preferredb
Voluntary c
Availabled
2018–2020 2023–2027
Telematics
Collision Avoidance
Automated Traffic
Law Enforcement
Robot/Driverless
Cars
Automation of enforcement of traffic laws
(obeying stoplights and stop signs, driving
within posted speed limits or according to
prevailing conditions, etc.) is being done by
technologies such as automatic red light
cameras and stoplight cameras
Automated
Traffic Law
Enforcement
With the introduction of robot or driverless
cars, insurance industry is likely to experience
a major shift in product designing as number
of accidents could come down. This is likely to
have a huge impact on motor insurance
industry
Auto manufacturers have built several different
collision avoidance systems and identified the
ones that have had a significant impact on
reducing the amount, and severity of accidents
Usage based insurance for the wireless
technology that delivers safety services, route
information, and entertainment to motor
vehicles
TelematicsCollision
Avoidance
System
Robot /
Driverless
Cars
Note: a. Government requires new vehicles and retrofitted older vehicles to have telematics and/or various collision avoidance technologies, and installs the environmental
hardware/systems to make automated traffic law enforcement work; b: Positive or negative incentives promote use; c: Decision based on individual vehicle owners; d: The
technology exists
Source: Capgemini Financial Services Analysis, 2014; “A Scenario: The end of Auto Insurance", Donald Light, Celent, May 8, 2012

8/19/2019 World Insurance Report 2015
http://slidepdf.com/reader/full/world-insurance-report-2015 32/60
32
prevent the occurrence of damage in the first place.Insurers should seek out partnerships with smarthome technology providers to support innovativeproducts and more flexible pricing. In the United
States, for example, State Farm has teamed up witha home security provider to offer discounts onhome monitoring systems, as well as homeownersinsurance.
Regulatory Standardization A push for more regulations and greater rulesuniformity across regions will impose a significantburden on insurance firms in the coming years. TheCommon Framework or ComFrame subjects activeinsurers internationally to more stringent capitalrequirements and imposes additional governance
and compliance guidelines related to enterprise riskmanagement. As a result, global insurers can expectincreased costs related to capital adequacy andgreater reporting complexity. Regionally, insurerswill also have to adhere to various directives. InEurope, Solvency II proposes a uniform approach formeasuring assets and liabilities, requiring insurersto demonstrate a greater understanding of the risksinherent in their business operations and products.In North America, solvency, corporate governance,accounting standards, and consumer protection are
all subject to more stringent regulation. In Asia-Pacific, the China Insurance Regulatory Commissionis shifting its focus from rules concerning productsand pricing to solvency and reporting, placing greater
importance on enhanced enterprise risk management.
Big Data AnalyticsExtensive use of analytics has the power to positivelyimpact every aspect of the insurance process. Inthe area of product development, analytics can helpinsurers tap into the wisdom of crowds to createproducts that address genuine and emerging customerneeds and bring in new business. Real-time analyticscombined with sophisticated hypotheses make itpossible to create very narrow but meaningful customersegments, leading to better response rates in marketing
efforts. When it comes to policy administration andunderwriting, analytics can help insurers betterunderstand risks, identify potential losses, and putstrategies in place to avoid them. Effective use ofanalytics can also help reduce claims fraud.
Analytic tools range from the simple use of ad-hocreports and root-cause analysis, to more sophisticatedstatistical analysis, to the advanced techniquesof optimization schemas and network theory. Ashuman capital becomes increasingly scarce and
Figure 3.5 Percentage of Non-Life Insurance Customers Allowing Their Insurer to Monitor Their Driving Habits in
Return for Better Risk Assessment , Personalized Advice, and Lower Premiums (%), 2014
55%52%
48%
57%59% 58%
64%66% 65%
0%
40%
20%
60%
80%
Gen Y % 35-54 55+
Are you willing to allow insurers
to collect information about
driving behavior through a web
interface or an app for better
risk assessment?
Are you willing to receive
personalized advice from
insurers in making your driving
behavior a better risk that can
result in lower premiums?
Are you willing to allow
insurers tomonitor driving
behavior if they promise
reduced premiums for a
positive risk assessment?
Source: Capgemini Financial Services Analysis, 2014; Capgemini Voice of the Customer Survey, 2014

8/19/2019 World Insurance Report 2015
http://slidepdf.com/reader/full/world-insurance-report-2015 33/60
33
2015 WORLD INSURANCE REPORT CHAPTER 3
expensive, insurers will be more inclined to turn toa combination of what-if analytics, visualization, andunstructured data to develop actionable insights aimedat improving performance. The use of analytics does
not come without its challenges, however. Insurers willneed to overcome the problems of data inconsistency,legacy infrastructure, a shortage of analytical skills,and privacy concerns to leverage the full potential ofanalytics.
Channel EvolutionInsurers’ channel strategy is currently in a state of f lux.On one hand, digital channels such as mobile andsocial media are evolving rapidly. While on the otherhand, the age-old traditional agent channel is still themost preferred one—leading to efforts by insurers
to empower agents with digital tools. However, withthe rise of direct distribution channels, customersnow have viable alternatives to the traditional agencychannel, putting additional pressure on agents toincrease their operational efficiencies and expand theircustomer reach. To better compete with the directchannels, agents are incorporating new technologies
into their routines. Some, for example, are using socialmedia platforms, such as Facebook and Twitter, toenhance their visibility. Predictive analytics can beused to arm agents with customer insights, enabling
them to take advantage of cross-selling and up-sellingopportunities. While the use of digital tools could leadto increased acquisition costs in the short run, overtime efficiencies should take hold. More important,digital technologies should enhance customerexperiences, bolstering the agent channel’s status asthe most important one for a majority of customers.
MATURITY MODEL IDENTIFIES GAPS ININSURER CAPABILITIES
With so many pressures bearing down, insurershave no choice but to face the future with a strategic
plan. The first step in doing so is to assess currentstrengths and maturity levels by utilizing a capabilityframework. We have identified seven core capabilities(see Figure 3.6) that insurers need to develop in orderto enhance customer experience and take advantageof opportunities created by the disruptors. OurInsurance Capability Maturity Model (see Figure 3.7)
Figure 3.6 The Capgemini Insurance All Channel Experience (ACE) Business Capability Framework
Transform Effectively
Price Competit ively Connect Elegantly Engage Regularly Deliver Perfectly Measure Relentlessly
Business Operations
Technology
Vision, Roadmap
& Governance
Business Case
Development
Distribution & Cross
Channel ManagementPricing & Rating
Enterprise Performance
Management
Digital Content
Management
Underwriting &
Policy Administration
Personalized Integrated
Closed-Loop Marketing
Cross-Channel Price
Coordination
Customer Performance
Management
Document
Management
Claims & Fraud
Management
Social Media
Leverage
Promotion/Campaign
Management
Customer Performance
ManagementGamification
Investment & Fund
Management
See Completely
Business Proposition
Development
Single View of
the Customer
Insight &
Analytics
Operational &
Decisional CRM
Source: Capgemini Consulting All Channel Experience Capability Framework; Capgemini Financial Services Analysis, 2014

8/19/2019 World Insurance Report 2015
http://slidepdf.com/reader/full/world-insurance-report-2015 34/60
34
Figure 3.7 The Capgemini Insurance All Channel Experience (ACE) Business Capability Maturity Model
The insurer does not
know enough about its
customers’ expectations
to know that it needs to
change. No clear road
map or business case
exists
Know your customers.
Develop the vision, value
proposition, business
model, roadmap and
business case to re-build
your insurance company
around the customers’
needs
The insurer knows
enough about its
customers to realize it
needs to change. Some
value proposition
definition has taken
place, and there is an
emerging case for
transformative change.
High level costs and
benefits have been
identified
The insurer understands
the experiences that
customers value. Options
for change have been
identified and evaluated,
and a transformation
program is about to be
launched
New customer-centric
product and service
propositions have been
designed. The road map,
business case and
resources are all in place,
and the transformation to
a customer-centric
insurer is underway
The insurer has
successfully redesigned
its business around its
customers. It delivers
valuable customer-centric
propositions and is
achieving high levels of
customer satisfaction.
Growth and profits are
both rising healthily
Transform Effectively
Communication is only
via conventional
channels. No use of
social media. No analysis
of customer data when
devising marketing
campaigns
Maintain an informed
personal dialogue with
individual customers,
across communication
and distribution channels,
so as to understand them
better
Emerging use of digital
channels, including
social media. But poor
coordination of cross-
channel messaging and
communications
Applying cross-channel
insights to segment and
personalise communica-
tions, but still providing
different customer
experiences across
channels
Increased consistency,
across channels, for most
interactions. Insight
gathered from social
media is used extensively
to inform the conversation
All channels, including
social media, are fully
integrated real-time for
all interactions – so the
customer always feels the
insurer knows him/her
well
Connect Elegantly
Customer data is
unreliable, out of date or
not readily available. Little
insight is gleaned. Data
governance and
management are poor
Use a single view of data
for all strategic, tactical
and operational Decision
-making to improve
accuracy, avoid duplica-
tion and increase insight
Customer data is more
usable. But more time
and effort is spent on
data gathering and report
preparation than on
subsequent analysis
The insurer captures,
stores and uses data
(both structured and
unstructured) generated
from multiple sources /
channels, to improve both
the customer relationship
and internal operations
A single customer view is
available based on a
centralised data
repository. The insurer
leverages this data to
identify next best actions
and improve the
customer’s experience
The insurer has a
comprehensive single
view of each customer,
and also understands
each customer’s
relationships with others
(eg: family, businesses).
Accurate, real-time data
supports predictive
analytics, planning and
delivery
See Completely
Limited performance and
investment tracking takes
place. Many decisions aremade based on gut feel.
Performance measures
are not aligned
throughout the insurer
Monitor and optimise the
performance of your
business across all
channels to improve
efficiency–enabling
higher profitability and
margins
Performance measures
are primarily financial.
Some understanding ofcustomer and channel
profitability is available
A performance
management framework
exists and incorporatesnon-financial measures.
Customer and channel
analytics are available to
support key decisions
A cascaded balanced
scorecard is in place.
Analytics are widelyavailable to decisionma-
-kers. Non-financial
measures such as Net
Promoter Scores, reten-
tion and share of wallet
are reported on regularly
Customer, channel and
product profitability are all
tracked accurately, andavailable through real-
time dashboards.
Decision-makers have all
the real-time analytics
they need. Business
activities are constantly
refined in response
to analytics
Measure Relentlessly
Primarily manual
capability, drawing
heavily on a dispersed
set of spreadsheets and
other toolsDeliver underwriting,
claims, fraud
management and
investment services
efficiently and effectively,
improving customer
experience
Automated systems are in
place, but are not
integrated end to end,
and/or lack a portal or
web front end for
customers
Real-time straight-
through processing is in
place, enabled by
customer portals or web
front ends integrated into
back end systems
Real-time straight through
processing is further
supported by mobile
capabilities, providing
customers with a choice
of access channels
Full end-to-end
integration and
automation. Seamless
multi-channel access
capabilities are available
to customers and third
parties (eg: loss adjusters)
Deliver Perfectly
Content is minimal and
managed on an ad-hoc
basis. No engagement
strategy is in place, and
there is little or no
gamification
Use high-quality, rich
and inspirational content,
together with sophistica-ted engagement strate-
gies, to drive high
customer engagement
Original content exists,
but publishing is
uncoordinated. Strategies
for gamification are
emerging
Original content is
regularly refreshed. Some
limited customer
segmentation informs
content distribution and
channel selection. Basicgamification strategies
are in place
Sophisticated analytics
support targeted and
personalised marketing
across channels. Content
is managed centrally, and
is template-driven forconsistency. Gamification
is widely applied
New content is
continually being
created and published
to customers to whom it
is relevant, through the
right channels at theright times. Advanced
content management
and gamification
platforms are in place
Engage Regularly
The technical price is
reasonably accurate, but
the sales price is kept the
same across all channels
and customer segmentsManage pricing across
all channels to drive
profitable sales
Same as Minimal, but
with differentiated pricing
across some channels.
Basic customer segment
and channel analysis is
used in developing
promotions
Cross-channel pricing
strategy, such as factory
gate pricing, is in place.
Price elasticity of
demand is understood
and acted upon
Same as for Median,
except that the technical
price is further refined
based on multiple additi-
onal data sources, eg:
external databases, social
media and telematics
As for Advanced, plus
customer lifetime values
are fully understood and
incorporated into sales
pricing, and pricing is
optimised across all
channels
Price Competitively
Capability 1 Minimal 2 Basic 3 Median 4 Advanced 5 Leading
Source: Capgemini Consulting All Channel Experience Capability Framework; Capgemini Financial Services Analysis, 2014

8/19/2019 World Insurance Report 2015
http://slidepdf.com/reader/full/world-insurance-report-2015 35/60
35
2015 WORLD INSURANCE REPORT CHAPTER 3
defines seven core capabilities along with the specificattributes that characterize leading-edge performerswithin each category. Globally, we found insurers arefalling short of their desired levels of maturity in every
category, ratcheting up the need to develop improvedstrategic plans and begin executing against them.
Global insurers exhibited the lowest maturity levelswhen it came to connecting elegantly and engagingregularly with customers, as well as having a completeview of customer data and relationships (see Figure3.8). Leading-edge practitioners of connectingelegantly maintain an informed personal dialoguewith individual customers across all communicationand distribution channels. These channels are fullyintegrated, operate on a real-time basis, and include
social media. Yet most insurers operate at a basiclevel of connection, offering a full range of channels,but supporting only disjointed customer experiencesacross them.
In terms of engaging regularly with customers,leading insurers continually create and publish high-quality, rich, and even inspirational content, makingit available to just the right customers, through theright channels, at the right time. These leaders employadvanced content management and gamificationplatforms to support their ongoing communications
efforts. Most insurers, however, are only beginning toget a handle on content management. They may haveoriginal content, and refresh it on a regular basis, buttheir ability to personalize it for different customersegments is limited to non-existent.
Insurers are also struggling in their ability to viewcustomer relationships completely. Ideally, insurerswould have a singular, comprehensive view of eachcustomer, including their connections to otherhousehold members and/or businesses. These viewswould be updated on a real-time basis to supportpredictive analysis, planning, and service delivery.
In reality, most insurers have become proficient incapturing and storing customer data, but they strugglewith being able to create a single, up-to-date view, andperform effective analysis.
Insurers performed at median maturity level whenit came to four other capabilities: pricing productscompetitively, delivering services perfectly, measuringrelentlessly, and transforming the business effectively.
Leading practitioners of pricing competitivelyunderstand customer lifetime values based on
multiple data sources and incorporate them intodifferentiated pricing for customers. These insurers
are also adept at optimizing pricing across channels.Most insurers, however, are more rudimentary in theirapproach to pricing, offering a minimal amount ofdifferentiated pricing across channels and performing
limited customer segmentation for specific productpromotions.
In terms of delivering services perfectly, leadinginsurers aim to ensure an unparalleled customerexperience. They deliver underwriting, claims, andinvestment services in a fully automated manner,and can guarantee a smoothly integrated experienceno matter how many channels a customer uses.Most insurers, however, still have a long way to go indelivering a perfect experience. They are still workingon seamless integration of their channels, and have yet
to institute real-time straight-through processing inresponse to customer interactions and requests.
Many insurers are still in the early stages of fullymonitoring their businesses. Ideally, measurementsof customer, channel, and product profitability aretracked and available through real-time dashboards,providing decision-makers with up-to-date analyticsthat can be used to continually refine businessactivities. In reality, most performance measures usedby insurers are financial in nature, and there is littletracking of customer and channel data to support
business decisions.
Finally, most insurers are struggling to transform theirbusinesses into customer-centric entities. The onesin the lead have succeeded in redesigning their firmsaround their customers. They are delivering valuepropositions that speak to customers and are achievinghigh rates of customer satisfaction, along with growingprofitability. Most insurers, however, have neither fullydeveloped a road map and business case for becominga thoroughly customer-centric organization, nor havethey allocated the resources to execute such a plan.
The inability of insurers to achieve their desired levelsof maturity was consistent across the board. Thoughinsurers said they would like to improve upon everycapability in the maturity-level matrix, they expressedthe greatest desire to improve their skills withrespect to pricing competitively, delivering servicesperfectly, and transforming into a customer-centricbusiness. Meanwhile, insurers have the most work todo with respect to engaging customers regularly andconnecting with them in an informed manner, as wellas having complete views of customer relationships.The upshot is that insurers must begin to scale
up their strategic planning with respect to all thecapability areas. Only by developing comprehensive

8/19/2019 World Insurance Report 2015
http://slidepdf.com/reader/full/world-insurance-report-2015 36/60
36
Figure 3.8 Gap between Current and Desired Maturity Levels
The insurer does not
know enough about its
customers’ expectations
to know that it needs to
change. No clear road
map or business case
exists
Know your customers.
Develop the vision, value
proposition, business
model, roadmap and
business case to re-build
your insurance company
around the customers’
needs
The insurer knows
enough about its
customers to realize it
needs to change. Some
value proposition
definition has taken
place, and there is an
emerging case for
transformative change.
High level costs and
benefits have been
identified
The insurer understands
the experiences that
customers value. Options
for change have been
identified and evaluated,
and a transformation
program is about to be
launched
New customer-centric
product and service
propositions have been
designed. The road map,
business case and
resources are all in place,
and the transformation to
a customer-centric
insurer is underway
The insurer has
successfully redesigned
its business around its
customers. It delivers
valuable customer-centric
propositions and is
achieving high levels of
customer satisfaction.
Growth and profits are
both rising healthily
Transform Effectively
Communication is only
via conventional
channels. No use of
social media. No analysis
of customer data when
devising marketing
campaigns
Maintain an informed
personal dialogue with
individual customers,
across communication
and distribution channels,
so as to understand them
better
Emerging use of digital
channels, including
social media. But poor
coordination of cross-
channel messaging and
communications
Applying cross-channel
insights to segment and
personalise communica-
tions, but still providing
different customer
experiences across
channels
Increased consistency,
across channels, for most
interactions. Insight
gathered from social
media is used extensively
to inform the conversation
All channels, including
social media, are fully
integrated real-time for
all interactions – so the
customer always feels the
insurer knows him/her
well
Connect Elegantly
Customer data is
unreliable, out of date or
not readily available. Little
insight is gleaned. Data
governance and
management are poor
Use a single view of data
for all strategic, tactical
and operational Decision
-making to improve
accuracy, avoid duplica-
tion and increase insight
Customer data is more
usable. But more time
and effort is spent on
data gathering and report
preparation than on
subsequent analysis
The insurer captures,
stores and uses data
(both structured and
unstructured) generated
from multiple sources /
channels, to improve both
the customer relationship
and internal operations
A single customer view is
available based on a
centralised data
repository. The insurer
leverages this data to
identify next best actions
and improve the
customer’s experience
The insurer has a
comprehensive single
view of each customer,
and also understands
each customer’s
relationships with others
(eg: family, businesses).
Accurate, real-time data
supports predictive
analytics, planning and
delivery
See Completely
Limited performance and
investment tracking takes
place. Many decisions aremade based on gut feel.
Performance measures
are not aligned
throughout the insurer
Monitor and optimise the
performance of your
business across all
channels to improve
efficiency–enabling
higher profitability and
margins
Performance measures
are primarily financial.
Some understanding ofcustomer and channel
profitability is available
A performance
management framework
exists and incorporatesnon-financial measures.
Customer and channel
analytics are available to
support key decisions
A cascaded balanced
scorecard is in place.
Analytics are widelyavailable to decisionma-
-kers. Non-financial
measures such as Net
Promoter Scores, reten-
tion and share of wallet
are reported on regularly
Customer, channel and
product profitability are all
tracked accurately, andavailable through real-
time dashboards.
Decision-makers have all
the real-time analytics
they need. Business
activities are constantly
refined in response
to analytics
Measure Relentlessly
Primarily manual
capability, drawing
heavily on a dispersed
set of spreadsheets and
other toolsDeliver underwriting,
claims, fraud
management and
investment services
efficiently and effectively,
improving customer
experience
Automated systems are in
place, but are not
integrated end to end,
and/or lack a portal or
web front end for
customers
Real-time straight-
through processing is in
place, enabled by
customer portals or web
front ends integrated into
back end systems
Real-time straight through
processing is further
supported by mobile
capabilities, providing
customers with a choice
of access channels
Full end-to-end
integration and
automation. Seamless
multi-channel access
capabilities are available
to customers and third
parties (eg: loss adjusters)
Deliver Perfectly
Content is minimal and
managed on an ad-hoc
basis. No engagement
strategy is in place, and
there is little or no
gamification
Use high-quality, rich
and inspirational content,
together with sophistica-ted engagement strate-
gies, to drive high
customer engagement
Original content exists,
but publishing is
uncoordinated. Strategies
for gamification are
emerging
Original content is
regularly refreshed. Some
limited customer
segmentation informs
content distribution and
channel selection. Basicgamification strategies
are in place
Sophisticated analytics
support targeted and
personalised marketing
across channels. Content
is managed centrally, and
is template-driven forconsistency. Gamification
is widely applied
New content is
continually being
created and published
to customers to whom it
is relevant, through the
right channels at theright times. Advanced
content management
and gamification
platforms are in place
Engage Regularly
The technical price is
reasonably accurate, but
the sales price is kept the
same across all channels
and customer segmentsManage pricing across
all channels to drive
profitable sales
Same as Minimal, but
with differentiated pricing
across some channels.
Basic customer segment
and channel analysis is
used in developing
promotions
Cross-channel pricing
strategy, such as factory
gate pricing, is in place.
Price elasticity of
demand is understood
and acted upon
Same as for Median,
except that the technical
price is further refined
based on multiple additi-
onal data sources, eg:
external databases, social
media and telematics
As for Advanced, plus
customer lifetime values
are fully understood and
incorporated into sales
pricing, and pricing is
optimised across all
channels
Price Competitively
Capability 1 Minimal 2 Basic 3 Median 4 Advanced 5 Leading
Source: Capgemini Financial Services Analysis, 2014; Capgemini WIR 2015 Executive Interviews

8/19/2019 World Insurance Report 2015
http://slidepdf.com/reader/full/world-insurance-report-2015 37/60
37
2015 WORLD INSURANCE REPORT CHAPTER 3
plans for proficiency across the board can insurershope to counteract the waves of disruptive changethat are threatening to undermine the business andprofitability.
Regional Differences in Maturity Levels EmergeInsurers in some regions were ahead of those in othersin terms of their maturity levels for some capabilities.Insurers in North America were operating at higherlevels of maturity across most core capabilities whencompared to those in other regions.
No insurers in any region had reached their desiredlevels of maturity for any single capability, thoughmost aspire to be at advanced and/or leading-edgematurity levels across all the capabilities (see Figure
3.9). While insurers in Asia-Pacific and Europe areequally concerned about their ability to transform thebusiness, they are focused on different capabilities forgetting there, with Europeans particularly focused onpricing products competitively and delivering themperfectly, and those in Asia-Pacific more focused onconnecting to customers.
While insurers in different regions agreed on thegoal of transforming the business, they emphasizeddifferent ways of getting there. For North Americans,
pricing competitively, delivering services perfectly,and measuring constantly were most important.
As insurers strive to achieve their desired levels ofmaturity in the capabilities they deem most important,
they will need to develop detail-oriented action plansthat include regular progress updates.
WAY FORWARD REQUIRES CUSTOMER-ORIENTED APPROACH, ANALYTICS
To move from the current states of mostly basic andmedian competency, to leading-edge and advancedpractices, insurers must adopt a more customer-centricapproach. Higher customer expectations demandthat insurers orient their businesses foremost towardfulfilling customer needs. The use of analytics toassimilate customer data, view relationships as a
whole, and deliver personalized products throughappropriate channels will be essential to succeeding asa customer-oriented insurer of the future.
Within each core competency area, insurers havethe opportunity to adopt leading-edge practices thatcould enable them to upgrade current procedures andembark on a path toward greater profitability.
Figure 3.9 Current and Desired Maturity Levels of Insurers in Different Regions across Seven Major Capabilities
Current Capability Levels for Insurer
Desired Capability Levels for Insurer
Transform
Price
Connect
EngageDeliver
Measure
See
EUROPE APAC AMERICAS
Transform
Price
Connect
EngageDeliver
Measure
See
Transform
Price
Connect
EngageDeliver
Measure
See
Transform
Price
Connect
EngageDeliver
Measure
See
Transform
Price
Connect
EngageDeliver
Measure
See
Transform
Price
Connect
EngageDeliver
Measure
See
Source: Capgemini Financial Services Analysis, 2014; Capgemini WIR 2015 Executive Interviews

8/19/2019 World Insurance Report 2015
http://slidepdf.com/reader/full/world-insurance-report-2015 38/60
38
Price CompetitivelyLeading insurers currently engage in a number ofworthwhile pricing practices, including differentiatedpricing based on usage, risk behaviors, or customer
segmenting (see Figure 3.10). Plus they offer pricingperks such as vanishing deductibles and discounts forearly renewals.
While adequate, every one of these activitiescould be further refined through widely availabletechnology (see Figure 3.11). Predictive analytics,
for example, could be used to determine pricingbased on a customer’s lifetime value, rather than onbasic customer segmentation. Analysis of customerdata could also be used to develop dynamic pricing
strategies based on life-stage changes or individualrisk, representing an upgrade from risk pooling. Byincorporating and analyzing externally gathered data,such as health status, road conditions, or even socialmedia connections, insurers can further personalizepricing, leading to greater customer satisfaction.
Figure 3.10 Price Competitively – Current and Desired Maturity Levels of Insurers in Different Regions (%)
Americas
Manage pricing
across all channels
to drive profitable
sales
The technical price is
reasonably accurate,
but the sales price is
kept the same across
all channels and
customer segments
Same as for Minimal,
but with differentiated
pricing across some
channels. Basic
customer segment
and channel analysis
is used in developing
promotions
Cross-channel pricing
strategy, such as
factory gate pricing, is
in place. Price
elasticity of demand
is understood and
acted upon
Same as for Median,
except that the
technical price is
further refined based
on multiple additional
data sources, e.g.
external databases,
social media and
telematics
Same as for
Advanced, plus
customer lifetime
values are fully
understood and
incorporated into
sales pricing, and
pricing is optimized
across all channels
Europe
APAC
Current 6
6
8 31 15 838
8 8 62 23
11 12 37 49
41 23 426
43 57
29 53 6 6
Future
Current
Future
Current
Future
0 25 50 75 100
Price Competitively
Capability 1 Minimal 2 Basic 3 Median 4 Advanced 5 Leading
Source: Capgemini Financial Services Analysis, 2014; Capgemini WIR 2015 Executive Interviews
Figure 3.11 Price Competitively – Current Leading and Potential Future Practices
Segment-based pricing
Usage-based pricing (Auto)
Rating on actual risk behavior (driving habits, lifestyle habits,
adoption of risk mitigation measures, location, home and
vehicle data)
Proactive renewal retention pricing including claims-free
discounts, vanishing deductibles, early renewal discounts,
renewal rate change capping, and customer profiling for flight risk
Unique products and coverage to tune the products to segment
needs and to reduce the ability for simple price comparisons
Current Practices Potential Future Practices
Lifetime value pricing
Connected Internet of Things or devices
Incorporating new risk determining data sources
(i.e., road conditions, connected vehicles around customer)
Pricing based on individual risk than risk pooling, possible
through availability of data
Dynamic pricing based on changing life stage; ability to select/
deselect risk choice on the go
Incorporate projected individual customer servicing costs based
on behaviors and channel usage
Discounts for expanded personal data access for underwriting
and for claims (car systems, wearable technology, building /
security systems, genetic information)
Expanded customer segmentation based on social media
connections
Source: Capgemini Financial Services Analysis, 2014

8/19/2019 World Insurance Report 2015
http://slidepdf.com/reader/full/world-insurance-report-2015 39/60
39
2015 WORLD INSURANCE REPORT CHAPTER 3
Connect ElegantlyCurrent leading-edge practices include streamlininginteractions across physical and digital channels, aswell as seamlessly incorporating into these channels
communication with various third parties, suchas wealth and property managers or senior citizencaregivers. (see Figure 3.12). Insurers are also gettingbetter at inserting their offerings into other customerinteractions, such as by offering travel insurance on anairline’s site or making use of real estate on social media.
More sophisticated future practices includeincorporating data from wearable technology, personaldigital assistants or smart dashboards in the homeor car that would automatically transmit customer
data related to risk factors (see Figure 3.13). Ideally,insurers would not only collect and analyze the data,but create a feedback loop to customers aimed atencouraging less risky behaviors.
Figure 3.12 Connect Elegantly – Current and Desired Maturity Levels of Insurers in Different Regions (%)
Capability
Americas
Connect Elegantly
1 Minimal 2 Basic 3 Median 4 Advanced 5 Leading
Communication isonly via conventional
channels. No use of
social media. No
analysis of customer
data when devising
marketing campaigns
Maintain an informed
personal dialogue
with individual
customers, across
communication and
distribution channels,
so as to understand
them better
Emerging use of digitalchannels, including
social media. But
poor coordination of
cross-channel
messaging and
communications
Applying cross-chan-nel insights to
segment and
personalize
communications, but
still providing different
customer experiences
across channels
Increased consisten-cy, across channels,
for most interactions.
Insight gathered from
social media is used
extensively to inform
the conversation
All channels, includingsocial media, are fully
integrated real time
for all interactions-so
the customer always
feels the insurer
knows him/her well
Europe
APAC
Current 47 647
Future
Current
Future
Current
Future
14
16 19 9 354
57 29
11 16 57 25
31 31
23 31
23 15
46
0 25 50 75 100
Source: Capgemini Financial Services Analysis, 2014; Capgemini WIR 2015 Executive Interviews
Figure 3.13 Connect Elegantly – Current Leading and Potential Future Practices
Incorporating social media
Personalized campaigns
Integrated interactions across physical and digital channels
Next best action intelligence help drive customer interactions
Understand, support and integrate additional parties to the
communication, e.g., wealth and property managers, local
surrogates for overseas military, senior citizen caregivers,
personal translators, partners, assistants, etc.
Insurance offerings are being integrated into other customer
interactions (e.g. travel insurance at airline and travel websites,
association and affinity group offers, extended warranties in the
checkout line, insurance at bank kiosks and ATMs, credit
insurance or extended warranties as part of auto dealer
purchases)
Current Practices Potential Future Practices
On board (vehicle) and smart home dashboard communication
M2M, telematics (motor, home), assisted living, telemedicine
Not just collecting data but feeding it back to the customer to
prevent risk vs. reacting to risk event
Digital virtual / cognitive networks
More sophisticated interaction approaches as personal digital
agents become parties to the dialogue
Source: Capgemini Financial Services Analysis, 2014

8/19/2019 World Insurance Report 2015
http://slidepdf.com/reader/full/world-insurance-report-2015 40/60
40
Engage RegularlyLeading insurers are taking advantage of numerousmethods of producing high-quality content forcustomers (see Figure 3.14). They use a variety of
mobile and web channels to offer rich, relevantinformation, such as car maintenance and home safetyadvice, discount programs, and risk mitigation tips.
To motivate customers toward better behaviors,insurers are also tapping into gamification conceptslike achievement and goal setting and they support
mobile technologies for payments and photo uploading,simplifying transactions and data capture (see Figure3.15). Insurers of the future can improve engagementby adopting always-on natural-language digital agents
to support 24/7 natural communication. They cantake advantage of data from in-home or wearablemonitoring devices to support real-time risk mitigationcommunication with customers. And gamificationcould be carried to a higher level, to help customersunderstand complex risk.
Figure 3.14 Engage Regularly – Current and Desired Maturity Levels of Insurers in Different Regions (%)
Americas
Engage Regularly Content is minimaland managed on an
ad-hoc basis. No
engagement strategy
is in place, and there
is little or no
gamification
Use high-quality, rich
and inspirational
content, together with
sophisticated
engagement strategies,
to drive high customer
engagement
Original contentexists, but publishing
is uncoordinated.
Strategies for
gamification are
emerging
Original content isregularly refreshed.
Some limited
customer segmenta-
tion informs content
distribution and
channel selection.
Basic gamification
strategies are in place
Sophisticated analyticssupport targeted and
personalized marketing
across channels.
Content is managed
centrally, and is
template driven for
consistency.
Gamification is widely
applied
New content iscontinually being
created and published
to customers to whom it
is relevant, through the
right channels at the
right times. Advanced
content management
and gamification
platforms are in place
Europe
APAC
Current
Future
Current
Future
Current
Future
47 35 126
14 29 21 36
20 25 1243
1 4 24 46 25
8 31 15 838
15 46 38
0 25 50 75 100
Capability 1 Minimal 2 Basic 3 Median 4 Advanced 5 Leading
Source: Capgemini Financial Services Analysis, 2014; Capgemini WIR 2015 Executive Interviews
Figure 3.15 Engage Regularly – Current Leading and Potential Future Practices
Advanced content management and gamification platforms
are in place
Proactive life-event communications
Cross sell third-party value-added services
Provide rich content such as risk mitigation tips (e.g., park near
street lamps)
Interactive live chat, audio or video for quoting or policy servicing
assistance
Use of mobile photos for simplified data capture (e.g. drivers
license, car VIN, auto ID card capture, item bar codes)
Increase mobile app and consumer website value; engagement
with related value-add information and services (e.g., auto:
vehicle purchase discount programs, local gas prices, car
maintenance advice, vehicle usage recording, vehicle type affinity
groups etc.; personal property: home inventory tools, home
moving / packing tools, home safety and maintenance advice,
repair and maintenance links or discounts, etc.)
Support personal communication preferences including
language, visually impaired support, and audio options
Current Practices Potential Future Practices
On board (vehicle) and smart home dashboard communication
Real-time risk mitigation techniques derived from monitoring
Internet of Things devices (i.e., wearables, Telematics, smart
home monitoring)
Real-time risk mitigation techniques derived from accurate
prediction of severe weather events
Digital agent – natural language based digital agent (i.e., Siri)
Cognitive agents – leverages with NLP learning to create
environment of virtual agents that answer questions on coverage
and other non-insurance advice
Gamification to help customers understand complex risk
Seamless movement across devices and channels
Engagement also supported by wearable technologies and
motion / gesture sensing capabilities
Support for a variety of payment options including new mobile
payment and electronic wallet options, as well as electronic
signatures (where allowed)
Source: Capgemini Financial Services Analysis, 2014; Capgemini WIR 2015 Executive Interviews

8/19/2019 World Insurance Report 2015
http://slidepdf.com/reader/full/world-insurance-report-2015 41/60
41
2015 WORLD INSURANCE REPORT CHAPTER 3
Deliver PerfectlyCurrent leading practices in service delivery involvea significant amount of automation and integration.
Wherever possible, electronic channels are used to
support transactions between customers, agents andthird parties, such as confirming policy coverage,processing claims, sharing files with attorneys andreinsurers, and reporting on a claim’s status (see Figure3.16). In the event that personal communication withcustomers is required or requested, those interactionsoccur seamlessly without a need for customers torepeat or resend information.
In the future (see Figure 3.17), 100% straight-throughprocessing via widespread adoption of industry-specific standards will bring all third parties andchannel partners into the insurance ecosystem, further
speeding up transaction times, reducing hassles forcustomers, and contributing to customer satisfactionand profitability.
Figure 3.16 Deliver Perfectly: Current and Desired Maturity Levels of Insurers in Different Regions (%)
Americas
Deliver Perfectly Primarily manual
capability, drawing
heavily on a dispersed
set of spreadsheets
and other tools
Deliver underwriting,
claims, fraud manage-
ment and investment
services efficiently and
effectively, improving
customer experience
Automated systems
are in place, but are
not integrated end to
end, and/or lack a
portal or web front
end for customers
Real-time straight-
through processing is
in place, enabled by
customer portals or
web front ends
integrated into back
end systems
Real-time
straight-through
processing is further
supported by mobile
capabilities, providing
customers with a
choice of access
channels
Full end to end
integration and
automation. Seamless
multi-channel access
capabilities are
available to customers
and third parties (e.g.,
loss adjusters)
0 25 50 75 100
Europe
APAC
Current
Future
Current
Future
Current
Future
3 49 17 130
47 29 24
14 36 50
12 36 52
46 46 8
8 54 38
Capability 1 Minimal 2 Basic 3 Median 4 Advanced 5 Leading
Source: Capgemini Financial Services Analysis, 2014; Capgemini WIR 2015 Executive Interviews
Figure 3.17 Deliver Perfectly – Current Leading and Potential Future Practices
Real-time straight-through processing is further supported by
mobile capabilities, providing customers with a choice of access
channels
Full end-to-end integration and automation. Seamless
multi-channel access capabilities are available to customers,
agents, and third parties. Specific examples include:
a) Electronic policy coverage confirmation and policy notices to
lineholders
b) Electronic policy billing and payment to mortgagees
c) Claim processing vendor portals and integration for visible car
repair status to the claimant
d) Shared claim file access to attorneys and reinsurers
e) Policy change and claim electronic notices to agents
f) Electronic claim submissions from companies
g) Workers compensation payroll updates from payroll system
vendors, etc
h) Cross-organization calendars and workflows
Current Practices Potential Future Practices
100% straight through processing: wide spread adoption of
industry-specific standards will help bring all third party
providers, channel partners etc. to the ecosystem thus making it
truly straight through
Customer services such as telemedicine, assisted living
Leverage underwriter time and expertise
Risk profiling and transaction analysis for underwriting assignment
of policy activities requiring manual review and analytics providing
underwriter pricing and risk retention advisement
Fraud models and monitoring cover all areas including channel
partners, policyholders, claimants, claim vendors, employees, etc
Source: Capgemini Financial Services Analysis, 2014; Capgemini WIR 2015 Executive Interviews

8/19/2019 World Insurance Report 2015
http://slidepdf.com/reader/full/world-insurance-report-2015 42/60
42
Measure RelentlesslyInsurers that excel in monitoring their business donot rely solely on financial measures. They also trackmeasurements related to customer, channel and product
profitability (see Figure 3.18). All of that information ismade available through real-time dashboards and canbe manipulated and analyzed on demand.
Leading insurers devise measurements related to allaspects of the insurance process, including agents,underwriters, call centers, auditors, inspectors, claim
examiners, adjusters, attorneys, and case managers.In the future, increasingly sophisticated analyticswill enable insurers to not only keep constant tabson all aspects of the business (see Figure 3.19), but
also more accurately predict the outcomes of variousevents, even those that occur with less frequency.Increasingly detailed analysis will help lead to betterrisk measurement and in turn, improved profitability.
Figure 3.18 Measure Relentlessly – Current and Desired Maturity Levels of Insurers in Different Regions (%)
Americas
Measure Relentlessly Limited performance
and investment
tracking takes place.
Many decisions are
made based on gut
feel. Performance
measures are not
aligned throughout
the insurer
Monitor and optimize
the performance of
your business
across all channels
to improve efficiency
-enabling higher
profitability and
margins
Performance
measures are
primarily financial.
Some understanding
of customer and
channel profitability
is available
A performance
management frame
work exists and
incorporates non-
financial measures.
Customer and
channel analytics are
available to support
key decisions
A cascaded balanced
scorecard is in place.
Analytics are widely
available to decision-
makers. Non-financial
measures such as Net
Promoter Scores,
retention and share of
wallet are reported on
regularly
Customer, channel and
product profitability are
all tracked accurately,
and available through
real-time dashboards.
Decision-makers have
all the real-time
analytics they need.
Business activities are
constantly refined in
response to analytics
0 25 50 75 100
Europe
APAC
Current
Future
Current
Future
Current
Future
3 34 34 128
6 44 13 631
14 21 64
7 51 42
46 46 8
8 54 38
Capability 1 Minimal 2 Basic 3 Median 4 Advanced 5 Leading
Source: Capgemini Financial Services Analysis, 2014; Capgemini WIR 2015 Executive Interviews
Figure 3.19 Measure Relentlessly – Current Leading and Potential Future Practices
Customer, channel and product profitability are all tracked
accurately, and available through real-time dashboards.
Decision-makers have all the real-time analytics they need.
Business activities are constantly refined in response to analytics
Processing timeliness, efficiency and effectiveness have targets
that are measured, analyzed and improved all across the value
chain, from agents, underwriters, call center servicing, document
production and distribution, premium auditors, inspection
services, claim examiners, adjusters, attorneys, case managers,
bill review services, salvage auctions, subrogation units, etc.
Current Practices Potential Future Practices
Insurers could move to use analytics to predict channel partner
profitability thus improving their sales effectiveness
Integration of similarity analytics to analyze risk and usage of
application quality from high-performing / p rofitable distributors
augmented with analytics to predict propensity to bind.
Movement to analyze the sources of the UWE and optimize
where UWE is incurred
(NOTE: This happening in some leading carriers now)
Also insurers could measure and identify bad risk from good risk
and thus price individually and improve profitability
Source: Capgemini Financial Services Analysis, 2014; Capgemini WIR 2015 Executive Interviews

8/19/2019 World Insurance Report 2015
http://slidepdf.com/reader/full/world-insurance-report-2015 43/60
43
2015 WORLD INSURANCE REPORT CHAPTER 3
See CompletelyLeading insurers have been able to attain a singlecomprehensive view of customers, including each one’slinks to other entities, such as household members or
businesses. The idea of a single comprehensive viewalso applies to all channel partners, claims vendors,and third-party services (see Figure 3.20). Theseinsurers employ a standard process for integratingall external economic, demographic, and competitiveinformation into their data stores.
Insurers of the future will extend their views ofcustomers to include data retrieved from social mediaactivity and wearable technologies (see Figure 3.21).This singular view will also include customer-specific
claims and underwriting information to informdecisions on new business, renewals, and claimshandling processes.
Figure 3.20 See Completely – Current and Desired Maturity Levels of Insurers in Different Regions (%)
Americas
See Completely Customer data is
unreliable, out of
date or not readily
available. Little
insight is gleaned.
Data governance
and management
are poor
Use a single view of
data for all strategic,
tactical and
operational
decision-making to
improve accuracy,
avoid duplication and
increase insight
Customer data is
more usable. But
more time and effort
is spent on data
gathering and report
preparation than on
subsequent analysis
The insurer captures,
stores and uses data
(both structured and
unstructured) genera-
ted from multiple
sources/channels,
to improve both the
customer relationship
& internal operations
A single customer
view is available
based on a
centralized data
repository. Theinsurer
leverages this data to
identify next best
actions and improve
the customer’s
experience
The insurer has a
comprehensive
view of each customer,
and also understands
each customer’s
relationships (eg,
family, businesses).
Accurate, real-time
data supports
predictive analytics,
planning and delivery
0 25 50 75 100
Europe
APAC
Current
Future
Current
Future
Current
Future
13 29 17 338
47 47 6
7 43 50
50 4711
54 38 8
8 69 23
Capability 1 Minimal 2 Basic 3 Median 4 Advanced 5 Leading
Source: Capgemini Financial Services Analysis, 2014; Capgemini WIR 2015 Executive Interviews
Figure 3.21 See Completely – Current Leading and Potential Future Practices
The insurer has a comprehensive single view of each customer,
and also understands each customer’s relationships with others
(e.g., family, businesses). Accurate, real-time data supports
predictive analytics, planning and delivery
MDM capabilities provide unique customers and other analysis
targets across systems and operating entities
Same comprehensive single-view approach for better managing
all channel partners, claims vendors and third-party services
Current Practices Potential Future Practices
Single-view of customer extended to M2M, wearables, social
analytics
Claims and underwriting information is viewed as a network of
related entities and the link analysis influences new business,
renewal, and claims handling processes
Identifying and preventing risk events through analytics
Single standard process for integrating external economic, demographic, industry and competitive information into analysis, models
and reporting
Source: Capgemini Financial Services Analysis, 2014; Capgemini WIR 2015 Executive Interviews

8/19/2019 World Insurance Report 2015
http://slidepdf.com/reader/full/world-insurance-report-2015 44/60
44
Figure 3.22 Transform Effectively – Current and Desired Maturity Levels of Insurers in Different Regions (%)
Americas
The insurer does not
know enough about
its customers’
expectations to know
that it needs to
change. No clear
roadmap or business
case exists
Know your
customers. Develop
the vision, value
proposition, business
model, roadmap and
business case to
re-build company
around the
customers’ needs
The insurer knows
enough about its
customers to realize it
needs to change.
Some value proposi-
tion definition has
taken place, and there
is an emerging case for
transformative change.
High-level costs and
benefits have been
identified
The insurer
understands the
experiences that
customers value.
Options for change
have been identified
and evaluated, and a
transformation
program is about to
be launched
New customer-centric
product and service
propositions have
been designed. The
road map, business
case and resources
are all in place,and
the transformation
to a customer-centric
insurer is underway
The insurer has
successfully redesign-
ed its business
around its customers.
It delivers valuable
customer-centric
propositions and is
achieving high levels
of customer satisfac-
tion. Growth and
profits are both rising
healthily
0 25 50 75 100
Europe
APAC
Current
Future
Current
Future
Current
Future
7 126 43 22
12 24 2441
7 43 50
1 13 30 55
8 31 38 15 8
30 70
Transform Effectively
Capability 1 Minimal 2 Basic 3 Median 4 Advanced 5 Leading
Source: Capgemini Financial Services Analysis, 2014; Capgemini WIR 2015 Executive Interviews
Transform EffectivelyLeading-edge practitioners have removed all historicalorganizational and processing workflows tied to siloedsales and service channels, achieving a fully customer-
centric entity (see Figure 3.22). End-to-end straight-through processing, through a network of electroniccollaboration tools, creates the experience of a virtualinsurance company for customers.
In the future, leading insurers will further exploitstraight-through processing, minimizing gaps anddelays in the insurance sales process (see Figure 3.23).
As virtual insurance companies, these firms will takeadvantage of telematics and location-based services toprovide immediate service to customers during timesof need.
Figure 3.23 Transform Effectively – Current Leading and Potential Future Practices
The insurer has successfully redesigned its business around its
customers. It delivers valuable customer-centric propositions andis achieving high levels of customer satisfaction. Growth and
profits are both rising healthily
Today’s electronic transaction and document workflows, together
with collaboration tools allow virtualized insurance company
processing locations and support outsourcing of selected
individual workflow steps
Removal of historic organizational and processing workflows tied
to individual sales and servicing channels - moving to true
multi-channel support and all channel experience
Current Practices Potential Future Practices
For certain lines of business (personal auto), carriers or new
market entrants are able to offer insurance during the salespurchase. Entry of the Vehicle Identification Number and small
set of information provides ability to receive quote, bind, and
coverage through digital device
Additional usage of telematics and location-based services
provides the ability to service customers at time of need (for
healthcare and other personal lines coverage)
Source: Capgemini Financial Services Analysis, 2014; Capgemini WIR 2015 Executive Interviews

8/19/2019 World Insurance Report 2015
http://slidepdf.com/reader/full/world-insurance-report-2015 45/60
45
2015 WORLD INSURANCE REPORT CHAPTER 3
CONCLUSION
Insurers are being confronted by several waves ofdisruptive changes that threaten to upend long-standing ways of doing business. Factors outside
the insurance industry’s control, such as an agingpopulation, ongoing economic uncertainty, andgrowing frequency of natural disasters, portendgreater difficulty in the ability of insurers toeffectively manage their business. Complicating theissue is the increase of new competition from non-core insurance players against a backdrop of morestringent regulations.
In the face of so much fundamental change, insurersare tasked with putting into motion strategic plansaimed at deepening and enhancing their core
capabilities. Our Insurance Capability MaturityModel highlights the significant gaps betweeninsurers’ current capabilities and their desired levelsproviding a blueprint for the insurers to achieve
these desired maturity levels in order to address theemerging challenges. Along every measure, insurershave ample opportunity to improve their practicesand procedures, and ultimately achieve better
performance. The way forward involves adoptinga more customer-centric approach to every type ofinsurance activity, thus ensuring that heightenedcustomer expectations will be met.
Critical to insurers reaching their full potential willbe the effective use of analytics. Industry executivesare well aware of the power of analytics, with 78%ranking it as a top 3 disruptor.
Used effectively, analytics represents a positive forceof change. Big Data analytics, in collaboration with
effective leverage of the mobile channel and theInternet of Things (IOT) phenomenon, has the powerto help insurers address the growing demands of theirevolving businesses.

8/19/2019 World Insurance Report 2015
http://slidepdf.com/reader/full/world-insurance-report-2015 46/60
46

8/19/2019 World Insurance Report 2015
http://slidepdf.com/reader/full/world-insurance-report-2015 47/60
2015 WORLD INSURANCE REPORT APPENDIX
47
AppendixEfficiency Ratios – Country Analysis
AUSTRALIA
In 2013, Australia stood out for lowering claimsexpenses and improving profit margins more than anyof its global counterparts.
Australia recorded a 17.6 percentage point decline inits claims ratio, the highest of all the countries by awide margin. The decline, mainly attributable to lowerclaims costs related to fewer natural perils, led to aclaims ratio of 65.2%, moving Australia to the middleof the pack globally in claims ratio performance.Favorable discount rate movements, as well aspremium rate increases and portfolio remediation
initiatives, also contributed to the improved claimsratio.
An ongoing decline in the operational ratio to 8.6%contributed to Australia’s status as a top performer interms of operational efficiency. Investments in coretransformation and communications infrastructurehelped bring about operational improvements.However, anticipated investments in enterpriserisk management and consumer protection to meetregulatory requirements may cause operational coststo rise in the future.
Acquisition ratio deteriorated by 1.1 percentagepoints to 13.7%, likely due to increased competitionand initial upfront investments in developing andpromoting the direct channels which are becomingpopular among the Australian customers. And
Australia’s 5.7 percentage point drop in investmentratio to 4.7% was the steepest of all the countries.Lower interest rates, which affected the performanceof fixed income instruments, along with conservativeinvestment strategies, led to Australia’s loweredinvestment income of $4 billion.
Despite these setbacks, Australian non-life insurers
experienced significant improvement in their profitmargins. The resulting 15.7% margin was, along withSweden’s, the largest in the world. The substantialdecrease in claims expenses, combined withimpressive operational performance and the increasein written premiums all contributed to the noteworthyprofits of Australian non-life insurers.
BELGIUM
Modest improvement in the already favorable claimsratio for Belgian non-life insurers led to solid growthin profit margins in 2013.
Fewer catastrophic events helped ease Belgium’s claimsratio to 55%, the lowest of all the countries surveyed.Increased use of advanced predictive analytics, aswell as improved premiums and increased insurance-product sales also aided in lowering the ratio.
The operational ratio held steady at 14.3%, keepingBelgian non-life insurers in the bottom one-thirdglobally in terms of operational performance. Belgiannon-life insurers continued to focus on improvingefficiency and controlling costs through the useof technologies such as telematics, legacy-systemreplacement, and big data aimed at powering advancedpredictive analytic tools.
Belgium’s already high acquisition ratio deterioratedfurther, increasing slightly to 20.8%, the third highestof all the countries surveyed. Non-life insurers reliedheavily on brokers and agents, contributing to theindustry’s high acquisition costs. However, directchannels are expected to increase in importance,especially in auto insurance.

8/19/2019 World Insurance Report 2015
http://slidepdf.com/reader/full/world-insurance-report-2015 48/60
48
MethodologyHigher interest rates and a favorable regulatoryenvironment helped nudge investment income upwardby 0.8 percentage points to 11.1%. Europe’s ongoingrecovery in the housing market may push investment
income up further.
Driven by positive outcomes in the claims ratioand investment income, profit margins expandedsolidly by 2.4 percentage points to 12.5%. With autoinsurance expected to grow by 15.8% by 2017, profitperformance should continue to improve in the yearsahead, underscoring a positive outlook for the Belgiannon-life insurance industry.
BRAZIL
Despite fast growth in the Brazilian non-life insurance
market, efficiency ratios did not change much in 2013from the previous year.
The large consumer market in Brazil remains vastlyuntapped for insurance, helping to explain the morethan 8% expansion in premiums in the countryin 2013, more than almost all other markets. Thecapitalization and reinsurance markets saw the largestyear-on-year growth at 26.4% and 17.5%, respectively,while the property and casualty market increased by11.5% from 2012.
Along with growth in premiums came an increase inclaims in 2013. The 2014 World Cup, held in Brazil,caused summer travel insurance claims to increase bymore than 60% over the previous two years. A highnumber of accidents and robberies also contributedto higher loss rates. Accidents alone account forR$6 to R$7 billion in losses per year. In addition,between January and May 2013, a series of droughtssignificantly impacted industries in the northeastregion, causing an estimated $350 million worth ofinsured losses. Despite the many factors contributingto an increase in claims, strong premium growth led toan improvement in the claims ratio of 1.3 percentagepoints to 59.3%, enough to offset the claims losses.
Reliance on traditional distribution models had anegative impact on acquisition and operational costsin 2013. The acquisition ratio increased marginally to21%, putting it among the highest in the world. Theoperational ratio also deteriorated slightly, rising to17.6%, also among the world’s highest. The industrycontinues to rely heavily on broker sales channels,even though broker fees typically cost 20% to 25%.Currently, less than 1% of car insurance sales aretransacted online with sales mostly being pushed to
traditional channels despite the popularity of onlineprice comparison sites.
Adherence to traditional business models hasprevented Brazil from achieving improvedperformance through innovation. Greater efficiency,for example, could help non-life insurers open up
the market for lower income customers who havetraditionally been underserved due to cost constraints.
CANADA
Record insured losses from catastrophic eventsadversely affected profits for non-life insurers inCanada in 2013, despite a slight improvement in theclaims ratio.
Flooding in Alberta and ice storms in southernOntario and eastern Canada resulted in nearly $3.2billion of weather-related insured losses in 2013, the
highest level in the industry’s history. Despite thisburden, the claims ratio improved by 0.6 percentagepoints to 64.9%, mainly due to a modest increase of3.2% in total premiums, along with higher interestrates and insurance sales.
Following two years of deterioration, Canada’soperational ratio recorded modest improvement of 0.4percentage points to 11.5%, putting it squarely in themiddle of the pack for this measure. The operationalperformance reflects the improvements Canada isstarting to realize following heavy investments made
to upgrade processes and replace legacy systems.
Canada has experienced steady improvement in itsacquisition ratio, and recorded another improvementof 0.6 percentage points to 15.6% in 2013. Theindustry continues to make strides in making cost-efficient direct channels, such as internet and mobile,available to customers.
Despite modest improvement in the investmentratio of 0.3 percentage points to 7.1%, the impact ofCanada’s widespread natural disasters made their
mark on profits. The industry’s profits slid by 5.8percentage points, reaching 5.8%, putting Canadaamong the bottom rung of profit earners in 2013.
FRANCE
The French non-life insurance industry exhibitedstable performance in 2013, with only slight deviationsfrom 2012 results.
The claims ratio changed marginally from the earlieryear. At 75.7%, France’s claims ratio is among thehighest in the world, despite relatively modest insuredlosses in 2013 of around EUR 500 million due to

8/19/2019 World Insurance Report 2015
http://slidepdf.com/reader/full/world-insurance-report-2015 49/60
49
2015 WORLD INSURANCE REPORT APPENDIX
damage from floods, hailstorms, and heavy snow. Arise in gross written premiums due to tariff increaseshelped bolster France’s claims ratio.
Similarly, France’s operational and acquisition ratioswere virtually unchanged. The operational ratioshifted by 0.1 percentage point to 6.7%, markingFrance as still one of the most efficient operators in theglobe. In 2013, France bested the world’s next-most-efficient operator by 1.5 percentage points.
France’s skill in keeping operational costs lowextended to its acquisition capabilities. Withacquisition expenses remaining exactly the sameat 15.4%, France continued as a relatively efficientacquirer, ranking within the top five. France’s ability
to keep acquisition costs low may be challenged by aproposed law aimed at making it easier for customersto terminate policies. The law is expected to increasecustomer churn and generate greater competition.
Investment income experienced a slight decline (0.3percentage points) to 9.4%, marking the second year ina row of lowered results. In response, French non-lifeinsurers are moving to higher-yield investments suchas corporate bonds and attempting to reduce theirexposure to peripheral Eurozone sovereign debt byreducing investments in high-risk member countries.
The modest movements in France’s claims, acquisitionand operational ratios resulted in a small increasein profits to 7.9% from 7.6% in 2012. A rise in grosswritten premiums as a result of tariff increases acrossalmost all product lines helped push profits upward.The highest growth came in the property segment,with motor remaining the largest contributor towritten premiums.
GERMANY
Despite a large leap forward in operational efficiency in
2013, German non-life insurers were among the veryfew to register losses in 2013. Massive flooding andsevere hailstorms inflicted high levels of insured losseson German non-life insurers.
Of all the countries, Germany was the only one toshow improvement in its operational ratio. Its upgradeof 5.2 percentage points gave it an operational ratioof 10.6%, putting it in the top half of operationalperformers globally. The improvement came afteryears of steady increases in operational expenses.Finally in 2013, cost-reduction efforts, combined withproductivity-enhancing investments in IT, appeared to
pay off.
Germany’s claims ratio improved by 2.5 percentagepoints to 66%, marking it as one of the betterperformers in claims, compared to its globalcounterparts.
Germany remained one of the most efficient acquirersin the industry (second only to Sweden in 2013),despite a deterioration of 0.1 percentage points inits acquisition ratio to 10.4%. Increased competitionbetween casualty insurers in the middle market andin the residential and marine markets in particular,appeared to sharpen the acquisition skills of Germannon-life insurers, despite the continued importance ofbrokers and aggregators in selling insurance products.
Following a sizable uptick in 2012, investment income
dipped from 10.0% to 9.2% in 2013 due to low interestrates and conservative investment activity. To improvetheir income from investments, German non-lifeinsurers are adjusting their investment portfolios toinclude corporate bonds, commercial real estate, andinfrastructure-financing projects aimed at generatinghigher yields.
Germany’s operational gains and ongoing acquisitionefficiency were not enough to offset a fairly significant1.3 percentage point decline in profit margin to6.7% in 2013. Damaging floods and hailstorms
accounted for much of the profit deterioration inGermany. In addition, increased competition hasprevented German insurers from making the typesof rate increases required to compensate for lowerprofitability. In commercial lines, for example, risksare underpriced by about 20%. With market saturationand greater competition reducing the feasibility of rateincreases, German insurers need to explore new routesto profitability, including improved underwritingand better protection from claims volatility throughreinsurance.
INDIA
A decline in the claims ratio and low acquisition costshelped Indian non-life insurers post solid profits infiscal year 2013.
A significant increase in gross written premiumscontributed to a 4% improvement in India’s claimsratio. The 19.1% growth in gross written premiumscombined with declines in claims ratios for thefire, marine, and motor insurance segments. Motorinsurance continued to be the largest non-lifeinsurance segment, amounting to almost half of thetotal non-life premiums written in the country.

8/19/2019 World Insurance Report 2015
http://slidepdf.com/reader/full/world-insurance-report-2015 50/60
50
MethodologyFollowing two years of making major strides inimproving the operational ratio, Indian non-lifeinsurers brought down the ratio once again in fiscalyear 2013 to 21.2%. The industry will gain greater
ability to make further operational improvementswhen a proposal to increase the limit on foreign directinvestments in Indian insurance companies to 49.0%gets approved by the Cabinet. The increase is intendedto give insurers greater flexibility in raising capital tomake technology and other investments.
In the still nascent Indian non-life insurance market,acquisition costs remain low. Non-life insurance inIndia features low per-capita premiums and to datehas only penetrated 0.8% of the market. Four publicsector companies collect more than 55% of premiums,
though private sector players are gaining share.De-regulation of pricing has also contributed to thegrowth of premium volumes. In this environment,Indian non-life insurers improved their acquisitionratio to 3.9% in fiscal year 2013.
Investment income, which remained flat from a yearearlier, did not have a significant impact on profitmargins. However, the increase in GWPs, resultingin the decline in the claims ratio, helped boost profitsto 8.8%.
ITALY
An effort to reduce the volume of fraudulent claimspayouts in Italy appeared to have a positive impacton non-life insurers’ claims ratios, as well as profits in2013.
Italy was one of only a handful of countries tosubstantially improve its claims ratio, moving it6.5 percentage points to 66.3%. The claims ratioimprovement was mainly caused by the drop in claimfrequency. For example, in motor third-party liability(MTPL), the frequency dropped from 7.4% in 2010 to5.6% in 2013 mainly due to decrease in car usage andimprovement in road safety. The claims ratio gainsmay also be the result of a 2012 law known as CresciItalia (Grow Italy) that aims to mitigate fraudulentclaims, and likely helped to reduce claims payouts.
Italy’s operational costs have been edging higher inrecent years. In 2013, they expanded 0.6 percentagepoints to 9.1%. Intensifying competition, particularlyin motor lines, along with increased administrationand channel management costs, have been pushing upoperational costs.
Italy has taken steps to drive competition betweeninsurance brokers by passing legislation, knownas the Bersani law, letting agents work with morethan one insurer. Despite the law, distribution
channels continue to be dominated by agents andintermediaries, keeping acquisition costs up. In 2013,Italy’s acquisition ratio deteriorated slightly to 15.9%.
Following an increase in 2012, investment incomedropped slightly to 3.6%, reflecting an increasinglyconservative investment strategy. Even so, Italy’sfavorable claims ratio helped boost profits 1.5percentage points to 10.2%, continuing an upwardswing since 2010.
JAPAN
Aided by significant improvement in its claims ratio, Japan’s non-life insurance industry recorded anincrease in profits in 2013.
The 6 percentage point decline in the claims ratiomarked Japan as the third-best performer globallyalong that measure. The claims ratio of 58.8% was
Japan’s lowest of the last five years, driven by fewerpayouts related to the Tohoku earthquake of 2011and the absence of any major catastrophes since then.Increased premium income due to rate revisions,including in the industry-wide No-Claim Bonus
system also contributed to the improved claims ratio.
Japan’s non-life insurers continued to reap the benefitsof consolidation, helping to bring down operationalcosts for the third year in a row. Although there are47 general insurance companies in Japan, which isthe world’s second-largest non-life insurance marketand Asia’s largest, more than 70% of premiumsare collected by three companies: Tokio MarineHoldings, NKSJ Holdings, and MS&AD InsuranceGroup (see Methodology for more details). Whilethis consolidation has brought about operationalimprovements, Japan’s operational ratio of 16% in2013, an improvement of 0.6 percentage points, kept iton the lower rung in terms of operational performanceglobally.
Acquisition ratios in Japan have barely budged inrecent years, stagnating around 16% and putting
Japan among the bottom half of global performers inacquisition. Agents remain the primary distributionchannel for insurers with more than 90% of theinsurance in Japan collected through agents. For somesegments, such as compulsory automobile liability,insurers are solely dependent on agents.

8/19/2019 World Insurance Report 2015
http://slidepdf.com/reader/full/world-insurance-report-2015 51/60
51
2015 WORLD INSURANCE REPORT APPENDIX
Decline in claims and operational ratios, coupledwith increase in premium income helped Japan’snon-life insurance industry to post a profit margin of4.5% in 2013. Due to the decline in gains from sale
of securities, the investment ratio of non-life insurerswitnessed a decline in 2013. Solvency margin ratio,the indicator of financial soundness increased forinsurance companies in Japan and the investmentportfolios of insurers continued to remain highlyskewed towards fixed return instruments such asgovernment and municipal bonds
NETHERLANDS
Despite very high claims expenses in 2013, Dutchnon-life insurers managed, for the first time in recenthistory, to nudge profits upward.
The tough competition in the Dutch market has longput intense pressure on premium pricing, causingthe claims ratio to remain stubbornly high. The trendcontinued in 2013 with deterioration in the claims ratioof 7.4 percentage points to 76%, the highest of all thecountries. A general decline in premiums, accompaniedby an increase in the amount of property and casualtyclaims exacerbated Netherlands’ claims performance in2013. In addition, the European economic crisis tookits toll in the form of a significant rise in claims forsuretyship (a specialized line of insurance guaranteeing
the obligation of one party to another) over the lastthree years.
Dutch non-life insurers continued to exhibit muchmore success in keeping operational expenses low.Though the operational ratio was unchanged from2012, it remains one of the lowest in the world at8.6%. In such an intensely competitive market,cost efficiencies have become an essential aspectof achieving profitability. With the Dutch non-lifeinsurance market reaching saturation, the industry isexpected to continue to streamline operations in thecoming years.
Dutch non-life insurers continue to make gains inbringing down acquisition costs. An improvementof 0.6 percentage points in the acquisition ratio to13.9%, one of the world’s lowest, reflects the industry’sexpertise in using direct channels to reach customers.The use of direct connections, now a dominant form ofproduct distribution, is in keeping with the high levelof competition that characterizes the Dutch market, aswell as its tech-savvy customer base.
Dutch non-life profits reversed an ongoing decline,
recording an improvement of 0.3 percentage points toreach 4.5%. Even so, the result remained among the
lowest in the world. Given the stiff competition of theDutch market, non-life insurers may need to focus onmore innovative branding strategies to achieve marketshare, rather than aggressive pricing.
SPAIN
In 2013, non-life insurance industry in Spainwitnessed contraction in the volume of premiumswritten. The decrease in the premium volume wasprimarily due to motor insurers slashing their ratesby 10-20% that has reduced the premium volume.General liability insurers also slashed their rates asnumerous insurers are pushing to write business.Driven by the decline in premium volume, the claimsratio of the industry witnessed a deterioration of 2.9percentage points in 2013.
Operational ratio of the industry recorded a nominalincrease. Although the operational costs were wellunder control, the decrease in the premium volumesresulted in the slight push of the ratio. However, itis expected that the train accident that occurred in
July 2013, may lead to increased insured losses of railinfrastructure, death benefits, disability, and medicalcosts.
Agents, tied agents, and brokers enjoy a higher shareamongst the non-life distributions channels in Spain.
Although the insurers' acquisition ratios increasedmarginally in 2013, increased costs associatedwith intermediaries are driving up the insurers'acquisition expenses. Non-life insurance market inSpain is highly competitive with increasing number ofinternational players. The entry of multiple domesticand international insurers is driving up the acquisitionand retention costs of customers. Also, with increasingdemand for aggregator websites, insurers are investingmore for acquiring new customers, especially in themotor segment due to falling premium rates, whichmight hamper the profit margin.
Despite the continuing prolonged economic crisis inthe Eurozone, the Spanish non-life insurance industryhas seen good investment returns. The Spanishnon-life insurance industry witnessed an increaseof 1.2 percentage points in the investment return in2013. Spanish investments in government bonds andinstruments in countries not affected by the Eurozonecrisis helped the firms reap good returns from thesame. Moreover, Spanish non-life insurers have startedto look outside Europe to nullify the Eurozone crisisimpact and to expand internationally as well. Mostof the investments have been routed to countries
including Morocco, Algeria, Mozambique, Angola,Cape Verde, and Equatorial Guinea.

8/19/2019 World Insurance Report 2015
http://slidepdf.com/reader/full/world-insurance-report-2015 52/60
52
MethodologyDue to the decline in premium volumes, the profitmargin of the industry declined in 2013. It has beenobserved that large sized insurers have had higherprofit margins than small sized insurers that will
lead the insurers to invest in tools and technologieslike stochastic modeling for better underwritingefficiencies.
SWEDEN
Very high investment income helped the Swedishnon-life insurance market overcome deterioration inits claims ratio to record the industry’s highest profitmargin in 2013.
Sweden’s claims ratio was adversely affected by falloutfrom storms and fire damage, causing it to rise to
75.0%, one of the world’s highest. Growth in premiumincome from major non-life business segments,combined with various claim prevention measures,helped to at least mitigate the full impact of thedisasters on claim payments.
The mature Swedish non-life insurance market-theindustry is dominated by four firms that hold around80% of market share-has an acquisition ratio of 10.1%which is among the world’s best. The operational ratiowas however high at 13.4%.
The industry benefited greatly from the high yieldsof the Swedish equity market in 2013. Propelled bya 20.5% increase in Sweden’s OMX 30 equity marketindex, Swedish non-life insurers expanded theirinvestment ratio by 2.2 percentage points to reach18.0%, the highest in the world by a wide margin. Theindustry allocated about 30% of investment portfoliosto equities. An increase in the fair value of fixedincome instruments due to declining interest ratesalso contributed to higher investment income for theindustry.
Though the increase in claims caused profits tonarrow by 0.8 percentage points from a year earlier,Sweden’s profit margin of 15.7% was still among thehighest in the world. Sustaining high profit marginswill be dependent on the industry’s ability to maintainhigh investment income, as well as achieve greateroperating efficiencies.
SWITZERLAND
Despite deterioration in the claims ratio, Swiss non-life insurers managed to record double-digit profit
margins in 2013.
Although Switzerland witnessed a lower number ofcatastrophic events in 2013, the industry’s claims ratioshifted adversely by 1.0 percentage points to 69.8%,landing Swiss non-life insurers in the bottom one thirdof global performers for this measure.
Switzerland was one of the few markets to experiencesignificant degradation in operating ratio, likely dueto sizable investments being made to replace legacysystems. Despite the deterioration of 1.3 percentagepoints, Swiss non-life insurers still were among thehigh-performing handful that achieved an operatingratio of less than 10.0%. While ongoing technologyinvestments may cause operating ratios to edge up inthe near term, over time they should bring additionalbenefits to Switzerland’s already efficient system.
Switzerland has been making measured gains inimproving its acquisition ratio. In 2013, it broke16.0%, reaching a ratio of 15.8%. The slow but steadyimprovement reflects the increasing penetrationof direct channels into the delivery mix, alongsidecontinued reliance on agents and brokers to distribute
products.
Investment income improved marginally by 0.4percentage points, reflecting the Eurozone’s lowinterest rates and challenging economic environment.The gradual recovery of the global financial marketis likely to have a positive impact on the Swissinvestment ratio, which reached a healthy 6.8% in2013.
The investment income provided a boost to profitmargins, which reached a respectable 12.0%,
reflecting an increase from 2012 of 1.4 percentagepoints. Higher premium income was also a factor inthe profitability of Swiss non-life insurers. Premiumincome expanded by 1.6%, driven by fire and motorinsurance, as well as health and accident insurance.Gradual economic growth in the Eurozone, combinedwith stabilization of interest rates, is expected tofurther propel results in the future.
7 “OMX Stockholm Index”, Bloomberg, www.bloomberg.com/quote/OMX

8/19/2019 World Insurance Report 2015
http://slidepdf.com/reader/full/world-insurance-report-2015 53/60
53
2015 WORLD INSURANCE REPORT APPENDIX
UNITED KINGDOM
A modestly improved claims ratio led to a healthybump in profits for non-life insurers in 2013 in the
United Kingdom.
Despite large-scale flooding in 2013, the U.K. claimsratio improved marginally to 63.1%, keeping it inthe top half of performers along this measure. Anuptick in premium prices aimed at recouping lossesfrom floods in 2012 resulted in a slight decrease inthe number of claims incurred. Looking forward, theclaims ratio is expected to further improve, as U.K.non-life insurers continue to explore ways to reduceclaims costs, including flood insurance subsidies andinflation control measures for bodily injury claimspaid by motor insurers.
Following a significant drop in 2012, the operationalratio rose slightly to 11.7%, marking U.K. non-lifeinsurers as average performers compared to theirglobal peers in managing operational costs. Thesecosts should continue to come down, now that severalinsurers have upgraded their claims administrationsystems and others have outsourced claimsmanagement.
Attracting new customers has long been tough in theU.K.’s highly competitive, mature non-life insurance
market. The property and casualty segment, forexample, has grown new customers by only about2%, a situation that results in bigger spending toattract customers, including higher commissions toaggregators. The reality of the U.K.’s stiffly competitivemarket has been reflected in consistently highacquisition costs, with 2013 being no exception. TheU.K.’s acquisition ratio deteriorated the most of anyother country in 2013 (by 1.5 percentage points) and,as in 2012, its acquisition costs were the highest of allthe countries. Increased use of alternate distributionchannels is expected to reduce acquisition costs over
time.
U.K. investment income experienced a marginaldecline due to an increase in government bond yieldsand the impact on longer maturity fixed interest rateinvestment instruments.
Despite deterioration in its operational, acquisition andinvestment ratios, and only a modest improvementin the claims ratio, U.K. non-life insurers managedto post a solid, double-digit profit, on the strength ofa 2.5 percentage point increase in profit margin, the
world’s third-largest increase. In the future, improvedunderwriting capabilities should set the stage forcontinued growth.
UNITED STATES
Compared to 2012, when nine of the top ten costliestinsured catastrophes occurred in the United States,
2013 was a mild year, resulting in better claimsperformance by U.S. non-life insurers.
Insured losses due to natural disasters totaled $12.8billion in 2013, far below the average annual loss of$29.4 billion recorded from 2000 to 2012. The lackof major disasters helped reduce the industry’s claimsratio by 3.0 percentage points to 66.6%. Claims costsand loss ratios also came down due to increasing useof telematics data to send crash notification alerts andsupport immediate assistance of clients.
In 2013, the operational ratio deteriorated anadditional 1.2 percentage points to 22.1%, making itthe highest of all the countries examined. Continuedheavy investment in complex initiatives, such ascustomer-centric business models and integratedtechnology, explain the industry’s high costs. Inaddition, non-life insurers are investing on advancedand improved security solutions as they strive to keepup with the stringent regulations aimed at improvingcustomer protection and fraud prevention.
U.S. non-life insurers were more accomplished whenit came to acquiring customers. The acquisition
ratio continued a steady decline from 2010, reaching15.9%. Nearly 63% of consumers already use onlinechannels to compare rates and get quotes. By 2015,online purchases of auto and home insurance policiesin the United States are expected to grow to nearlyto $14 billion. As direct channels continue to gainmomentum, U.S. non-life insurers will likely continueto pare down acquisition costs, while also improvingthe customer experience.
For the third consecutive year, U.S. non-life insurersexperienced a slight decline in investment income,
though the resulting investment ratio of 10.8% wasstill a healthy amount. Income from stocks anddividends decreased by 1.4% to $47.4 billion.
Despite the decline in investment income, U.S. non-lifeinsurers posted the second-largest increase in profitmargins of all the countries examined, boosting it by4.0 percentage points to 13.1%. Lower insured lossesstemming from fewer natural disasters, improvedunderwriting results, and an increase in premiumgrowth all contributed to the industry’s profitability,which was the third-largest of all the countries
examined. In 2013, net income after taxes increasedby $28.7 billion to $63.8 billion.

8/19/2019 World Insurance Report 2015
http://slidepdf.com/reader/full/world-insurance-report-2015 54/60
54
MethodologyFigure A1 Customer Experience Index, by Country, 2013–2014
0% 20% 40% 60% 80% 100%
CEI (On a Scale of 100) % Point Change
2013–14
67.8 69.42014Regional CEI Leader 2013
73.478.1
(4.7)%
72.674.0
71.574.5
71.171.7
71.173.7
70.970.1
70.570.0
69.873.4
69.3
68.969.2
71.0
68.772.0
68.573.4
68.070.9
67.870.9
67.767.1
67.164.6
67.068.7
67.074.2
67.068.3
66.170.6
66.159.4
65.965.4
65.068.5
64.665.5
63.962.8
63.765.2
63.664.8
63.665.8
63.563.2
63.065.6
(1.4)%
(2.9)%
(0.5)%
(2.6)%
(3.6)%
(1.8)%
(3.3)%
(4.9)%
(2.9)%
(3.0)%
(1.7)%
(7.3)%
(1.4)%
(4.5)%
(3.6)%
(1.5)%
(1.2)%
(2.2)%
(0.9)%
0.7%
0.5%
0.4%
0.6%
2.5%
6.6%
0.5%
1.0%
(2.6)%
0.3%
U.S.
Austria
South Africa
Belgium
Canada
Switzerland
Portugal
Germany
Mexico
Ireland
France
Australia
Argentina
U.K.
Brazil
China
India
Netherlands
Italy
Spain
Hong Kong
Taiwan
Poland
Sweden
South Korea
Denmark
Singapore
Japan
Russia
Norway
Global Average
Source: Capgemini Financial Services Analysis 2014; Capgemini Voice of Customer Survey, 2014

8/19/2019 World Insurance Report 2015
http://slidepdf.com/reader/full/world-insurance-report-2015 55/60
55
2015 WORLD INSURANCE REPORT APPENDIX
Figure A2 Insurance Customers with a Positive/Negative Experience, by Country (%), 2014
South Korea
China
Japan
Hong Kong
Singapore
Taiwan
Russia
Sweden
Poland
India
Norway
Spain
Denmark
Italy
Argentina
France
Brazil
Mexico
U.K.
Ireland
Netherlands
Germany
Australia
Switzerland
South Africa
Portugal
Belgium
Canada
U.S.
Austria
Neutral ExperienceNegative Experience Positive Experience
(0.6%)
(10.5%)
(3.9%)
(3.1%)
(7.5%)
(3.4%)
(7.3%)
(6.6%)
(12.4%)
(1.8%)
(0.6%)
(2.7%)
(2.5%)
(9.0%)
(10.8%)
(2.9%)
(1.2%)
(5.7%)
(2.7%)
(7.6%)
(6.2%)
(3.1%)
(0.6%)
(2.5%)
0.2%
0.2%
2.2%
3.1%
0.2%
4.8%
% Point Change for
Positive Experience
(2013–14)
15%
20%
20%
20%
20%
21%
21%
23%
24%
25%
25%
25%
27%
27%
28%
28%
29%
29%
31%
32%
32%
33%
33%
35%
36%
36%
37%
37%
41%
43%
79%
75%
71%
74%
70%
74%
70%
68%
66%
69%
61%
65%
59%
65%
65%
65%
63%
65%
60%
63%
58%
61%
59%
60%
60%
57%
59%
57%
56%
49%
6%
5%
10%
6%
10%
5%
9%
10%
10%
7%
15%
10%
14%
8%
8%
7%
8%
6%
8%
5%
10%
6%
7%
4%
4%
7%
4%
5%
3%
8%
Source: Capgemini Financial Services Analysis, 2014; Capgemini Voice of the Customer Survey, 2014

8/19/2019 World Insurance Report 2015
http://slidepdf.com/reader/full/world-insurance-report-2015 56/60
56
Methodology
SCOPE AND RESEARCH SOURCES
The 2015 World Insurance Report (WIR) covers both life and non-life segments (with a focus on non-life inChapter 1). This year's report draws on research insights from 30 markets: Argentina, Australia, Austria, Belgium,Brazil, Canada, China, Denmark, France, Germany, Hong Kong, India, Ireland, Italy, Japan, Mexico, Netherlands,Norway, Poland, Portugal, Russia, Singapore, South Africa, South Korea, Spain, Sweden, Switzerland, Taiwan,the United Kingdom, and the United States. We estimate these countries together account for approximately 94%of the global insurance market, based on data from the “World Insurance in 2013” Swiss Re sigma Report. Thesample of countries covers 30 of the world’s top 32 insurance markets in terms of premiums.
The 2015 WIR is based on a comprehensive body of research that includes 165 interviews with senior insuranceexecutives of 100+ leading insurance firms. Of the total firms interviewed, 48% sell both life and non-lifeinsurance, 20% focus solely on life, and 32% are dedicated to non-life.
EFFICIENCY RATIO ANALYSIS
For each of the 15 studied countries, we analyzed a sufficient number of country-level financials from companiesto ensure coverage of more than 50% of each market's total non-life premiums. For each of the analyzedcompanies, we obtained the country-level breakdown of financials (Gross written premiums (GWPs), Claims,Commission and Expenses, Operational Expenses, Investment Income, Profit before Tax) through extensivesecondary research sources and from local Capgemini insurance subject matter experts.
Where no country-level breakdown was available, we took the premium income of the parent company and
estimated the cost data for the analyzed country, using the percentage of individual country premiums to globalpremiums. The few companies that did not provide verifiable data on either a country or global level were omittedfrom the analysis.
Our Efficiency Model, valid only for non-life insurance companies, indicates the cost and financial-performanceratios of each country based on core and non-core insurance business. The efficiency ratios are calculated usingvarious expense and profit metrics against GWP. The ratios are consistent with industry-defined ratios forindividual insurers, but provide a better comparison for industry performance in different regions.
Our model specifications:
Underwriting ratio – Like the combined ratio industry benchmark, this ratio measures the percentage of gross
written premiums (GWPs) an insurer pays out in claims and expenses. The lower the ratio, the less premiumrevenues are being eroded by expenses.
Claims ratio – (total claims and benefits disbursed) / (GWP)-offers a proxy for underwriting efficiency.In general, a lower claims ratio produces higher returns.
Acquisition ratio – (total commission and fees paid) / (GWP)-reflects the effectiveness with which distributionnetworks are being managed. While it is beneficial to financial results to keep the acquisition ratio low, thesecosts are inherently higher in some business models, so it may be more relevant for a firm to focus on the trendsin its own acquisition ratios than to benchmark directly against other businesses or regions.
Operational ratio – (total operating expenses) / (GWP)-helps to explain the maturity with which insurers aremanaging routine expenses. In general, the lower the operational ratio the better.
Investment ratio – (net investment income + capital gains (losses) / (GWP)-shows returns on insurers’investment portfolios. In general, the higher the investment ratio the better.
Profit margin – (profit before tax) / (GWP)-measures profits from the overall insurance business.

8/19/2019 World Insurance Report 2015
http://slidepdf.com/reader/full/world-insurance-report-2015 57/60
57
In all cases, ratios depend on a variety of external factors, including general economic conditions, governmentregulations, business type, consumer preferences, etc. As a result, it is rarely relevant to compare ratios directlyacross regions or markets. It is typically more germane to compare trends over time within regions or markets,and perhaps within business types or insurance segments.
2014 GLOBAL INSURANCE VOICE OF THE CUSTOMER SURVEY
A global survey of customer attitudes toward insurance forms the basis of the eighth annual World InsuranceReport. Our comprehensive Voice of the Customer survey polled more than 15,500 insurance (personal lines)customers in 30 countries. The survey sought to gain deep insight into customer preferences, expectations
and behaviors with respect to specific types of insurance transactions. The survey questioned customers ontheir general satisfaction with their insurer, the importance of specific channels for executing different typesof transactions, and their satisfaction with those transactions, among other factors. The survey also questionedcustomers on the importance they ascribe to digital channels (Internet and mobile) and their satisfaction levelsfor services offered via these digital channels. Participants were also asked questions around factors that influencetheir decision to choose, stay, or leave their insurer, how likely they are to refer a friend, buy additional products,or leave their current insurer, how they view the utility value provided by insurance products, how they wouldlike to use newer channels such as social media, and other issues. We supplemented these detailed findingsthrough in-depth interviews with senior insurance executives around the world.
CAPGEMINI’S CUSTOMER EXPERIENCE INDEX
The responses from the global Voice of the Customer survey, which analyzed customer experiences across 112
data points, provide the underlying input for our Customer Experience Index (CEI). The CEI calculates a customerexperience score that can be analyzed across a number of variables. The scores provide insight on how customersperceive the quality of their insurance interactions. These interactions are dissected by product, channel andlifecycle stage, as well as by demographic variables, such as country, gender, age, and investable assets. Theresult is an unparalleled view of how customers regard their insurers, and the specific levers insurers can push toincrease the number of positive experiences for customers. The CEI provides a foundation for insurers to developan overall retail delivery strategy that will increase satisfaction in ways that are most meaningful to customers.
2015 WORLD INSURANCE REPORT METHODOLOGY

8/19/2019 World Insurance Report 2015
http://slidepdf.com/reader/full/world-insurance-report-2015 58/60
58
Methodology
© 2015 Capgemini
All Rights Reser ved. Capgemini and Efma, the ir services mentioned herein as well as their logos, are trademarks or registered trademarks of thei r respective
companies. All other company, product and service names mentioned are the trademarks of their respective owners and are used herein with no intention of
trademark infringement. No part of this document may be reproduced or copied in any form or by any means without written permission from Capgemini.
Disclaimer
The information contained herein is general in nature and is not intended, and should not be construed, as professional adv ice or opinion provided to
the user. This document does not purport to be a complete statement of the approaches or steps, which may vary accordingly to individual factors and
circumstances, necessary for a business to accomplish any particular business goal. This document is provided for informational purposes only; it is
meant solely to provide helpful information to the user. This document is not a recommendation of any particular approach and should not be relied upon
to address or solve any particular matter. The text of this document was originally written in English. Translation to languages other than English is providedas a convenience to our users. Capgemini and Efma disclaim any responsibility for translation inaccuracies. The information provided herein is on an
‘as-is’ basis. Capgemini and Efma disclaim any and all representations and warranties of any kind concerning any information provided in this report and
will not be liable for any direct, indirect, special, incidental, consequential loss or loss of profits arising in any way from the information contained herein.
With more than 140,000 people in over 40 countries,Capgemini is one of the world’s foremost providersof consulting, technology and outsourcing services.The Group reported 2013 global revenues of EUR10.1 billion.
Together with its clients, Capgemini creates anddelivers business and technology solutions thatfit their needs and drive the results they want. A
deeply multicultural organization, Capgemini hasdeveloped its own way of working, the CollaborativeBusiness ExperienceTM, and draws on Rightshore®,its worldwide delivery model.
Capgemini’s Financial Services Global BusinessUnit brings deep industry experience, innovativeservice offerings and next generation global deliveryto serve the financial services industry. With anetwork of 24,000 professionals — 11,000+ in Indiadedicated to Financial Services — and more than900 clients worldwide, Capgemini collaborateswith leading banks, insurers, and capital marketcompanies to deliver business and IT solutions andthought leadership which create tangible value.
Visit www.capgemini.com/financialservices
Rightshore® is a trademark belonging to Capgemini
As a global not-for-profit organisation, Efmabrings together more than 3,300 retail financialservices companies from over 130 countries. Witha membership base consisting of almost a third ofall large retail banks worldwide, Efma has provento be a valuable resource for the global industry,offering members exclusive access to a multitude ofresources, databases, studies, articles, news feedsand publications. Efma also provides numerous
networking opportunities through working groups.
Visit www.efma.com
About Us

8/19/2019 World Insurance Report 2015
http://slidepdf.com/reader/full/world-insurance-report-2015 59/60
59
2015 WORLD INSURANCE REPORT APPENDIX
We would like to extend a special thanks to all of the Insurance companies and
individuals who participated in our Insurance Executive Interviews.
The following companies are among the part icipants who agreed to be publicly named:
ANSVAR INSURANCE AUSTRALIA, Achmea, AEGON UK, Aflac Japan, AG Insurance, AgeasHong Kong, Ageas UK, Ageas UK Limited, AIG, Allianz BeNeLux N.V., Allianz Global AssistanceFrance, Allianz Polska , Allianz SE, Allianz Suisse, Allianz UK, Argenta Assurantiën, AX ABelgium, AXA Commercial Lines and Personal Intermediary UK, AX A Direct and PartnershipsUK, AXA France, AXA Polska, AX A Seguros Generales., AXA Winterthur (Switzerland), BaloiseBelgium n.v., Baloise Insurance, Barclays Insurance, BCI Seguros S.A., Belfius Insurance, BNPParibas Cardif, BNPPARIBAS , Broker : MDS Auto S.A., Caser Seguros, Cat lin, CBL INSURANCEGROUP, CNA , CNA Insurance, CNP Assurances, Combined Insurance, a division of ACE., ConTe.it - Admiral Group Plc., CREDIT UNION INSURANCE LTD NZ, Delta Lloyd Life, Direct Line Group,DKV Seguros, ERGO Insurance, Ergo Italia, Ethias NV/SA, Etiqa, FARMERS MUTUAL GROUPINSURANCE LTD, Federale Insurance Group, Fidea N.V., Fluo, Folksam, Friends Life, Friends Life/Zurich, Generali Belgium, Generali Deutschland Holding AG, Generali Poland, Generali Seguros,
Genworth Financial, Groupama Garancia, Grupa PZU, Gruppo Assimoco, Gruppo Aviva in Italia,Gruppo Helvetia Italia, GUILD INSURANCE, HDI SEGUROS, IF…, ING Life & Non-Life Belgium,José Alvarez Quintero (Fidelidade - Companhia de Seguros, S.A.), KBC Bank & Verzekeringen,Länsförsäkringar, Legal & General, Lloyds Banking Group Insurance, MAIF , Mapfre, MKBÁltalános Biztosító Zrt , Monuta, Mutua Madrileña Aseguradora, NFU Mutual, Nordea Liv &Pension, Old Mutual, ONVZ, Open Life Towarzystwo Ubezpieczeń Zycie S.A., P&V Group, PelayoMutua de Seguros, Pelayo Seguros, Poste Assicura S.p.A., QBE European Operations, Quixa,R + V Versicherung, R+V Versicherung AG, Reliance Life Insurance Company, Royal London,RSA Sun Insurance Office , santalucia, SARA Assicurazioni S.p.A., SBI Life Insurance, SCOR,Securex, Skandia, SulAmérica , Swedbank Life Insurance SE, TAL, The Hartford, The TokyoMarine Research Institute, The TT Club, Towarzystwo Ubezpieczen Europa S.A. ; TowarzystwoUbezpieczeń na Życie Europa S.A., UNIQA Insurance Group AG, WESFARMERS INSURANCE,
Yarden, Zilveren Kruis Achmea, Zurich Brasil Seguros, Zurich Insurance Group - Zurich NorthAmerica, Zurich Insurance Plc, Zurich Insurance Services
We would also like to thank the following teams and individuals for helping to compile
this report:
William Sullivan and Sivakanth Dandamudi for their overall leadership for this year’s report;Chris Costanzo, Priyadarsani Das, Srividya Manchiraju, Varun Rawat, Shradha Verma,Balakumar B, and Krithika Venkataraman for researching, compiling and writing the findings,as well as providing in-depth market analysis.
Capgemini Global Insurance network for providing their insights, industry expertise and overallguidance: Keith Aylwin, Fernando Simoes do Carmo, Sirlene Cavaliere, Apparao Chathurvedula,
Chun Hing Cheung, Martijn van den Corput, Carlalberto Crippa, Enrique Diez Ordas De Cadenas,Ramesh Darbha, Luuk van Deel, Keith Gage, Andrew Hood, Filip Goldman, Manuela Gomes,Raffaele Guerra, Sridhar Kalyanam, Yuka K itagami, Uwe Korte, Peter Kuijvenhoven, LaurentLeport, Cindy Maike, Darek Mazurek, Thomas Meyer, Masamitsu Murata, Ravi Nadimpalli,Joel Augusto Carvalho de Oliveira, Anthony Pavia, Seth Rachlin, Marien van Riessen, KristerRydmark, Dipak Sahoo, Paula Simurro, Christopher Stevens Diez, Yamada Takehito, Lloyd Unger,Jan Verlinden, Alan Walker, Nigel Walsh, Nadine Yang, and Shuji Yoshida.
Karen Schneider and Marion Lecorbeiller for their overall marketing leadership for the reportand the Global Product Marketing and Programs, Corporate Communications and Field MarketingTeams for producing and launching the report: Vanessa Baille, Stacy Prassas, Suresh Chedarada,Alison Coombe, Kanaka Donkina, Mary-Ellen Harn, Shankar Janyavula, Sathish Kumar Kalidasan,Ed Johnson, Vinod Krishnan, Gabriella Lucocq, Martine Maître, Sourav Mookherjee, Partha
Karmakar, Erin Riemer and Omkarnadh Sanka.
Alain Enault and the Efma Team for their collaborative sponsorship, marketing and continuedsupport.

8/19/2019 World Insurance Report 2015
http://slidepdf.com/reader/full/world-insurance-report-2015 60/60
www.worldinsurancereport.com
For more information, please contact:
Capgemini
Efma
For press inquiries, please contact:
Cortney Lusignan (EMEA) at [email protected] or +44 20 7067 0764
Courtney Finn (North America and Rest of the World) at [email protected] or +1 952 346 6206
Mary-Ellen Harn (Capgemini) at [email protected] or +1 704 490 4146
Karine Coutinho (Efma) at [email protected] or +33 1 47 42 69 82