world agricultural outlook board - usda · world agricultural outlook board interagency commodity...
TRANSCRIPT
World Agricultural Outlook BoardInteragency Commodity Estimates Committee Forecasts
Lockup BriefingJanuary 12, 2015
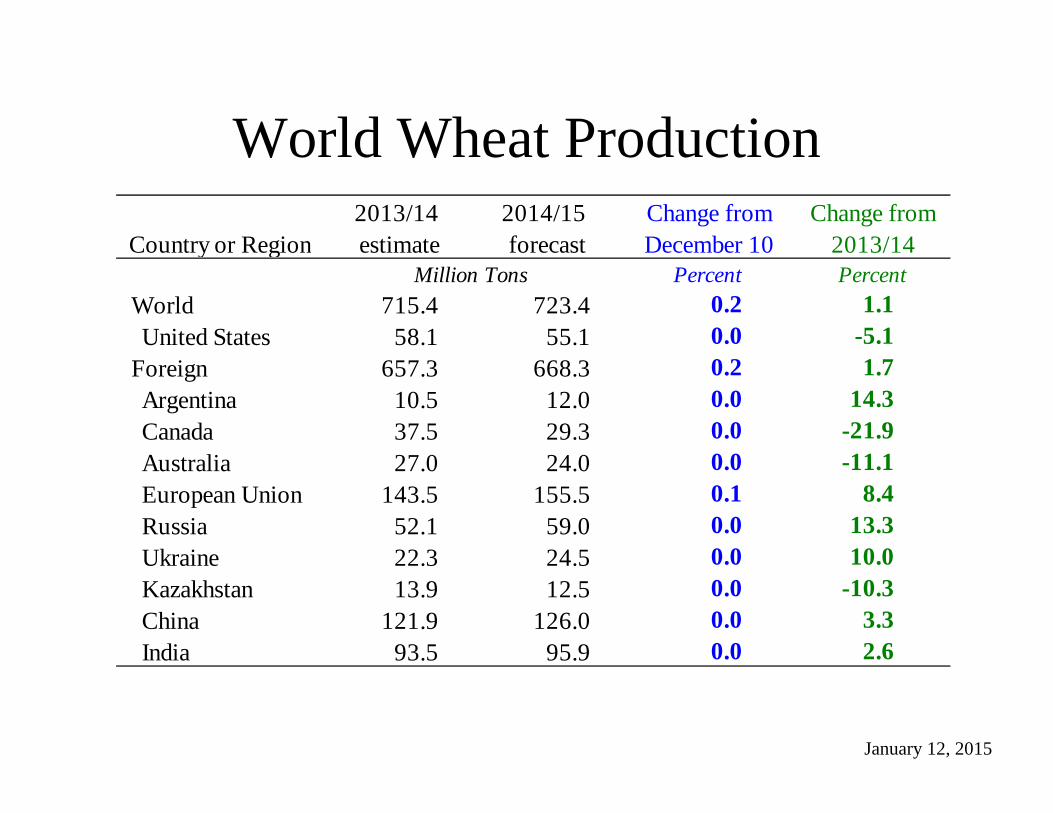
World Wheat Production
January 12, 2015
Country or Region2013/14estimate
2014/15forecast
Change from December 10
Change from 2013/14
Million Tons Percent PercentWorld 715.4 723.4 0.2 1.1United States 58.1 55.1 0.0 -5.1
Foreign 657.3 668.3 0.2 1.7Argentina 10.5 12.0 0.0 14.3Canada 37.5 29.3 0.0 -21.9Australia 27.0 24.0 0.0 -11.1European Union 143.5 155.5 0.1 8.4Russia 52.1 59.0 0.0 13.3Ukraine 22.3 24.5 0.0 10.0Kazakhstan 13.9 12.5 0.0 -10.3China 121.9 126.0 0.0 3.3India 93.5 95.9 0.0 2.6
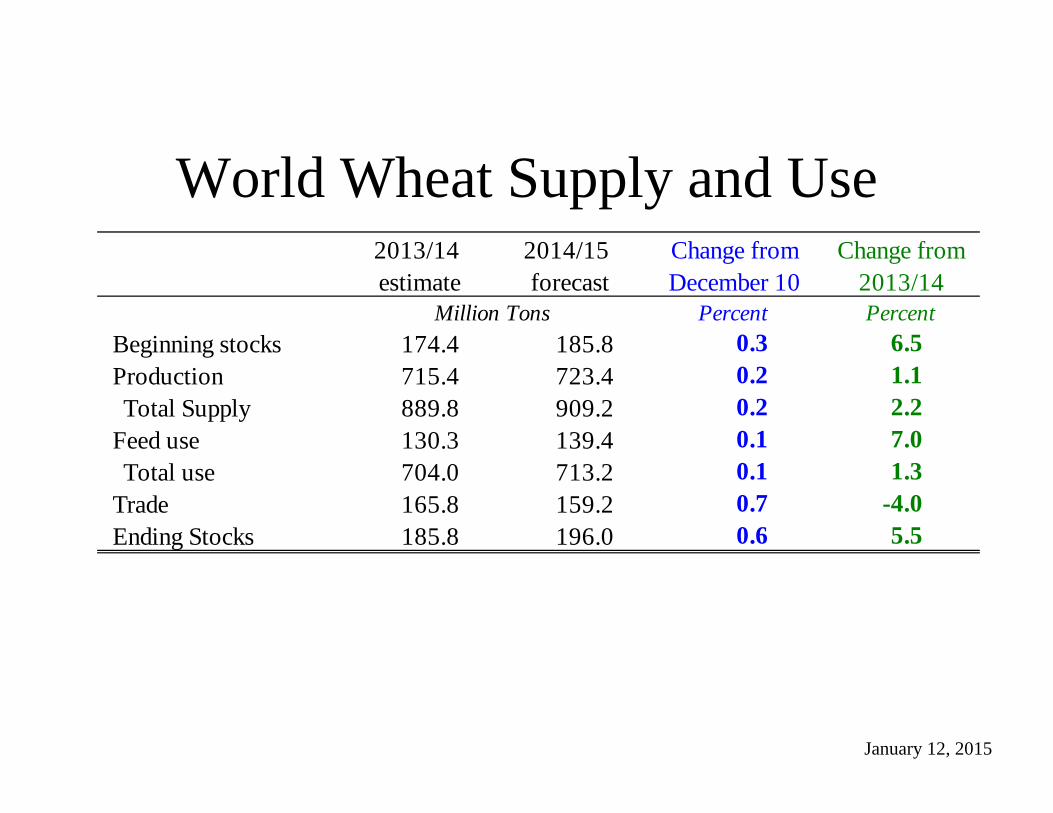
World Wheat Supply and Use
January 12, 2015
2013/14estimate
2014/15forecast
Change from December 10
Change from 2013/14
Million Tons Percent PercentBeginning stocks 174.4 185.8 0.3 6.5Production 715.4 723.4 0.2 1.1Total Supply 889.8 909.2 0.2 2.2
Feed use 130.3 139.4 0.1 7.0Total use 704.0 713.2 0.1 1.3
Trade 165.8 159.2 0.7 -4.0Ending Stocks 185.8 196.0 0.6 5.5
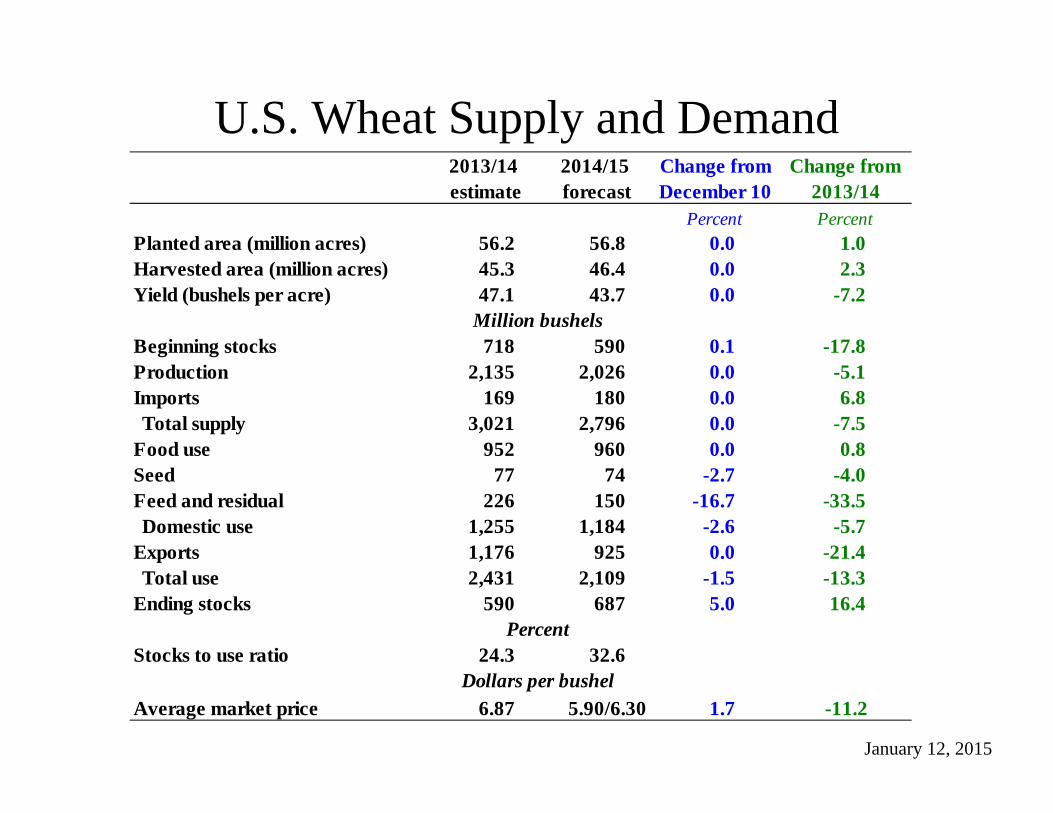
U.S. Wheat Supply and Demand
January 12, 2015
2013/14 estimate
2014/15 forecast
Change from December 10
Change from 2013/14
Percent PercentPlanted area (million acres) 56.2 56.8 0.0 1.0Harvested area (million acres) 45.3 46.4 0.0 2.3Yield (bushels per acre) 47.1 43.7 0.0 -7.2
Million bushelsBeginning stocks 718 590 0.1 -17.8Production 2,135 2,026 0.0 -5.1Imports 169 180 0.0 6.8Total supply 3,021 2,796 0.0 -7.5
Food use 952 960 0.0 0.8Seed 77 74 -2.7 -4.0Feed and residual 226 150 -16.7 -33.5Domestic use 1,255 1,184 -2.6 -5.7
Exports 1,176 925 0.0 -21.4Total use 2,431 2,109 -1.5 -13.3
Ending stocks 590 687 5.0 16.4Percent
Stocks to use ratio 24.3 32.6Dollars per bushel
Average market price 6.87 5.90/6.30 1.7 -11.2
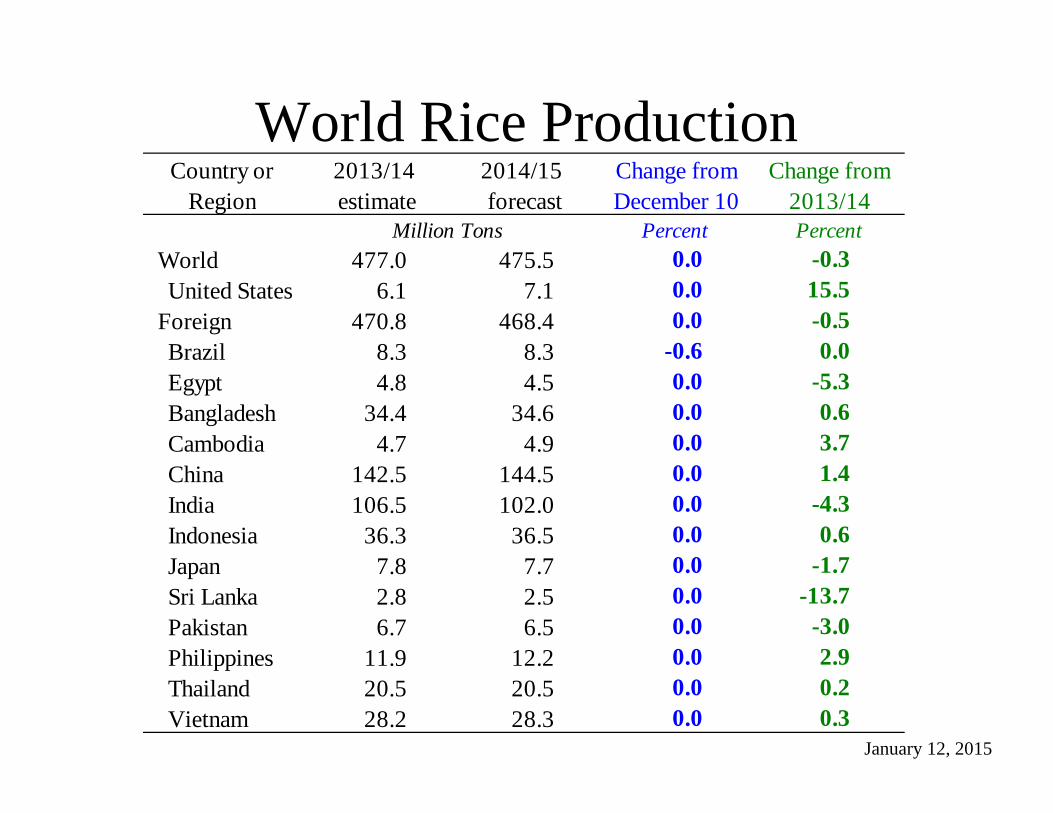
World Rice Production
January 12, 2015
Country or Region
2013/14estimate
2014/15forecast
Change from December 10
Change from 2013/14
Million Tons Percent PercentWorld 477.0 475.5 0.0 -0.3United States 6.1 7.1 0.0 15.5
Foreign 470.8 468.4 0.0 -0.5Brazil 8.3 8.3 -0.6 0.0Egypt 4.8 4.5 0.0 -5.3Bangladesh 34.4 34.6 0.0 0.6Cambodia 4.7 4.9 0.0 3.7China 142.5 144.5 0.0 1.4India 106.5 102.0 0.0 -4.3Indonesia 36.3 36.5 0.0 0.6Japan 7.8 7.7 0.0 -1.7Sri Lanka 2.8 2.5 0.0 -13.7Pakistan 6.7 6.5 0.0 -3.0Philippines 11.9 12.2 0.0 2.9Thailand 20.5 20.5 0.0 0.2Vietnam 28.2 28.3 0.0 0.3
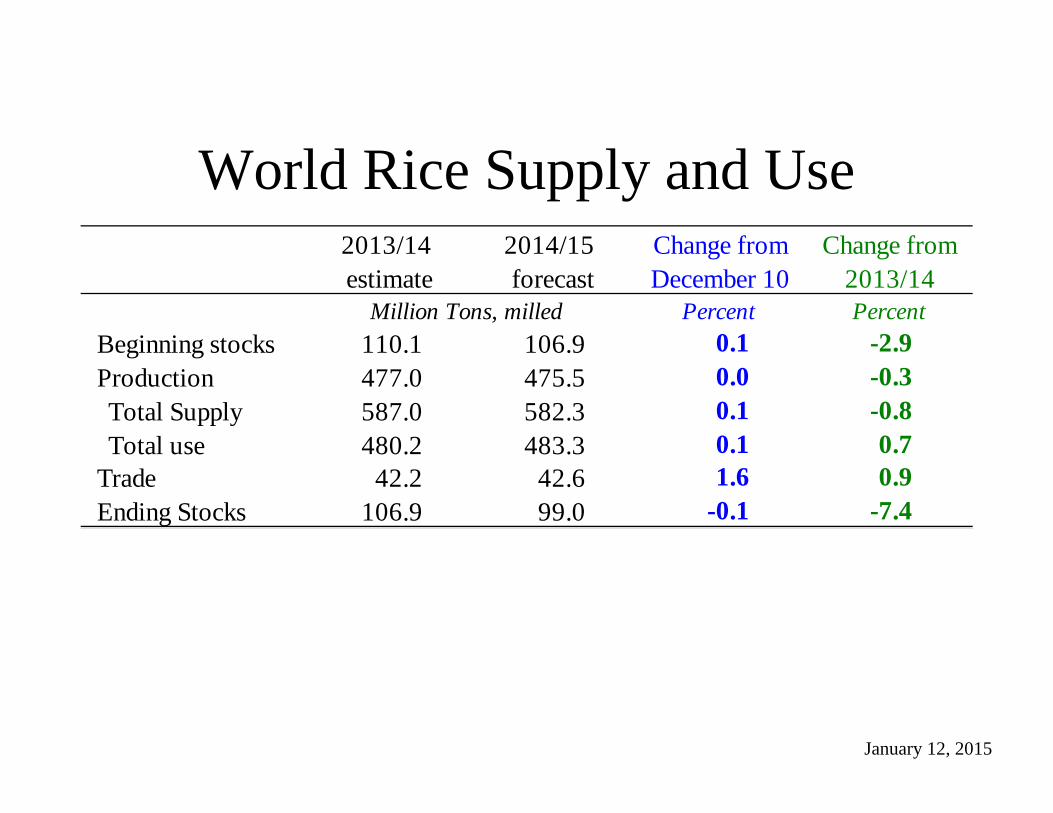
World Rice Supply and Use
January 12, 2015
2013/14estimate
2014/15forecast
Change from December 10
Change from 2013/14
Million Tons, milled Percent PercentBeginning stocks 110.1 106.9 0.1 -2.9Production 477.0 475.5 0.0 -0.3Total Supply 587.0 582.3 0.1 -0.8Total use 480.2 483.3 0.1 0.7
Trade 42.2 42.6 1.6 0.9Ending Stocks 106.9 99.0 -0.1 -7.4
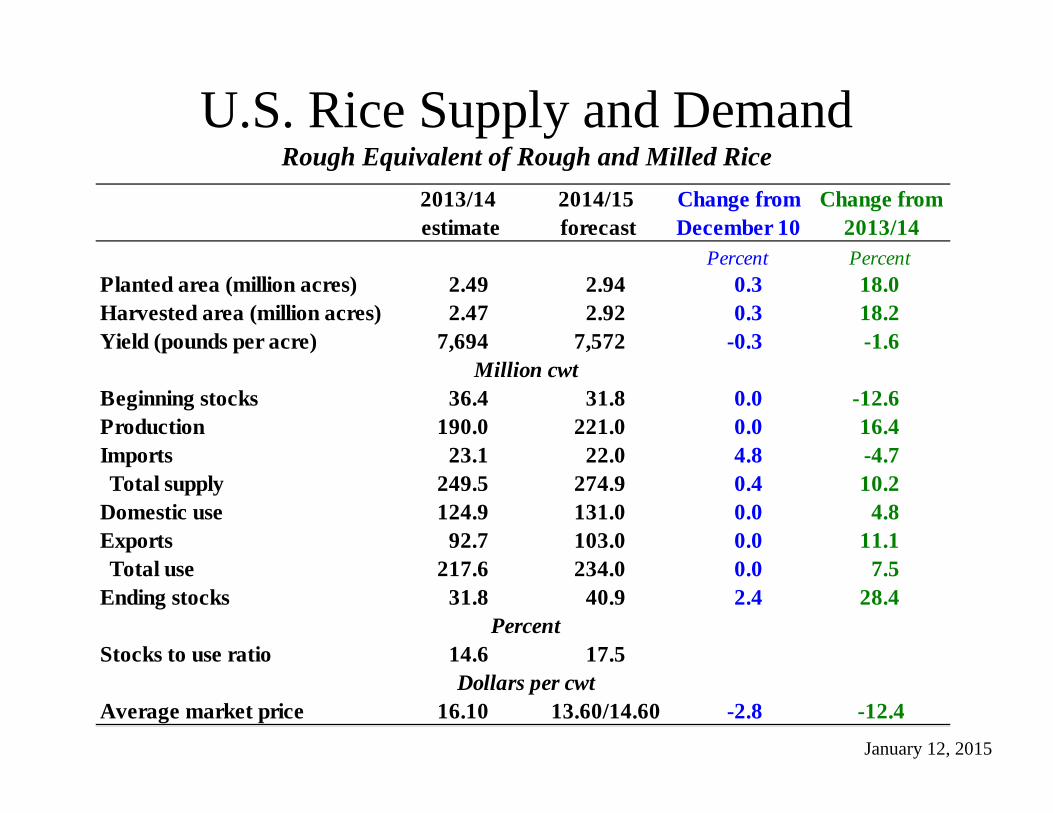
U.S. Rice Supply and DemandRough Equivalent of Rough and Milled Rice
January 12, 2015
2013/14 estimate
2014/15 forecast
Change from December 10
Change from 2013/14
Percent PercentPlanted area (million acres) 2.49 2.94 0.3 18.0Harvested area (million acres) 2.47 2.92 0.3 18.2Yield (pounds per acre) 7,694 7,572 -0.3 -1.6
Million cwtBeginning stocks 36.4 31.8 0.0 -12.6Production 190.0 221.0 0.0 16.4Imports 23.1 22.0 4.8 -4.7Total supply 249.5 274.9 0.4 10.2
Domestic use 124.9 131.0 0.0 4.8Exports 92.7 103.0 0.0 11.1Total use 217.6 234.0 0.0 7.5
Ending stocks 31.8 40.9 2.4 28.4Percent
Stocks to use ratio 14.6 17.5Dollars per cwt
Average market price 16.10 13.60/14.60 -2.8 -12.4
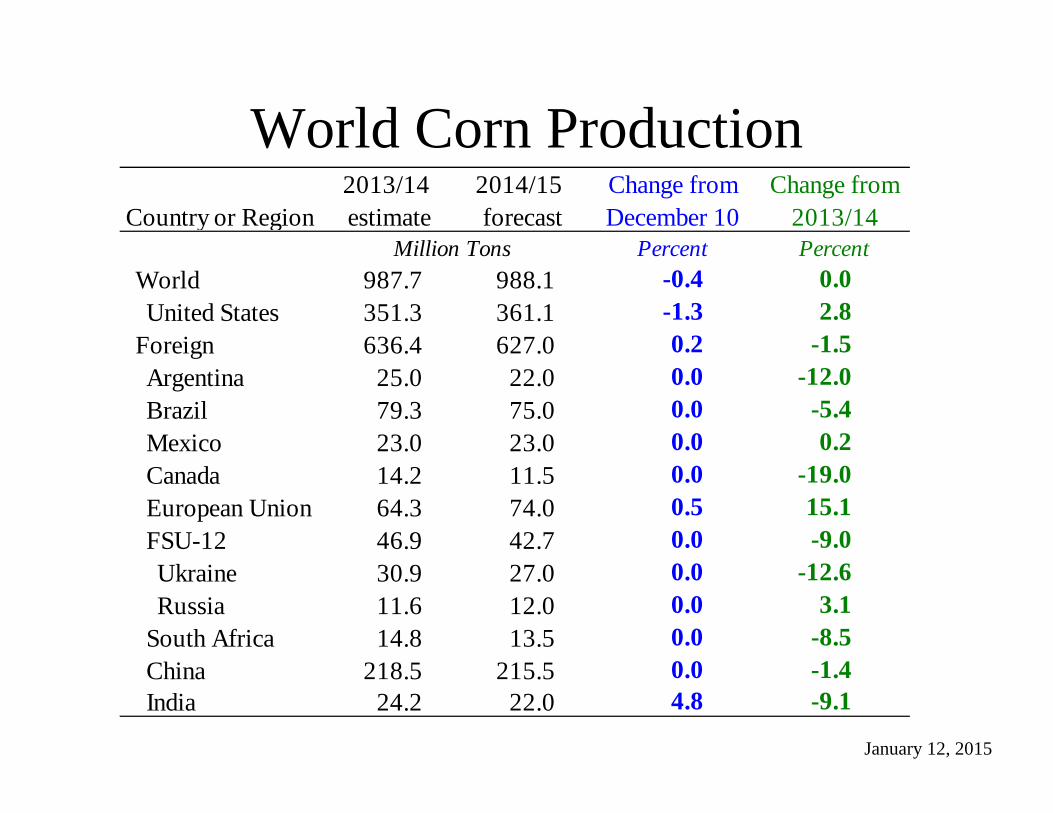
World Corn Production
January 12, 2015
Country or Region2013/14estimate
2014/15forecast
Change from December 10
Change from 2013/14
Million Tons Percent PercentWorld 987.7 988.1 -0.4 0.0United States 351.3 361.1 -1.3 2.8
Foreign 636.4 627.0 0.2 -1.5Argentina 25.0 22.0 0.0 -12.0Brazil 79.3 75.0 0.0 -5.4Mexico 23.0 23.0 0.0 0.2Canada 14.2 11.5 0.0 -19.0European Union 64.3 74.0 0.5 15.1FSU-12 46.9 42.7 0.0 -9.0Ukraine 30.9 27.0 0.0 -12.6Russia 11.6 12.0 0.0 3.1
South Africa 14.8 13.5 0.0 -8.5China 218.5 215.5 0.0 -1.4India 24.2 22.0 4.8 -9.1
January 12, 2015
0
5
10
15
20
25
30
35
40
45
50
1980
/198
119
82/1
983
1984
/198
519
86/1
987
1988
/198
919
90/1
991
1992
/199
319
94/1
995
1996
/199
719
98/1
999
2000
/200
120
02/2
003
2004
/200
520
06/2
007
2008
/200
920
10/2
011
2012
/201
320
14/1
5 F
Mill
ion
tons
1st Season 2nd Season
Source: 1980/81 to 2012/13 CONAB-Series Historica; 2013/14 & 2014/15F USDA
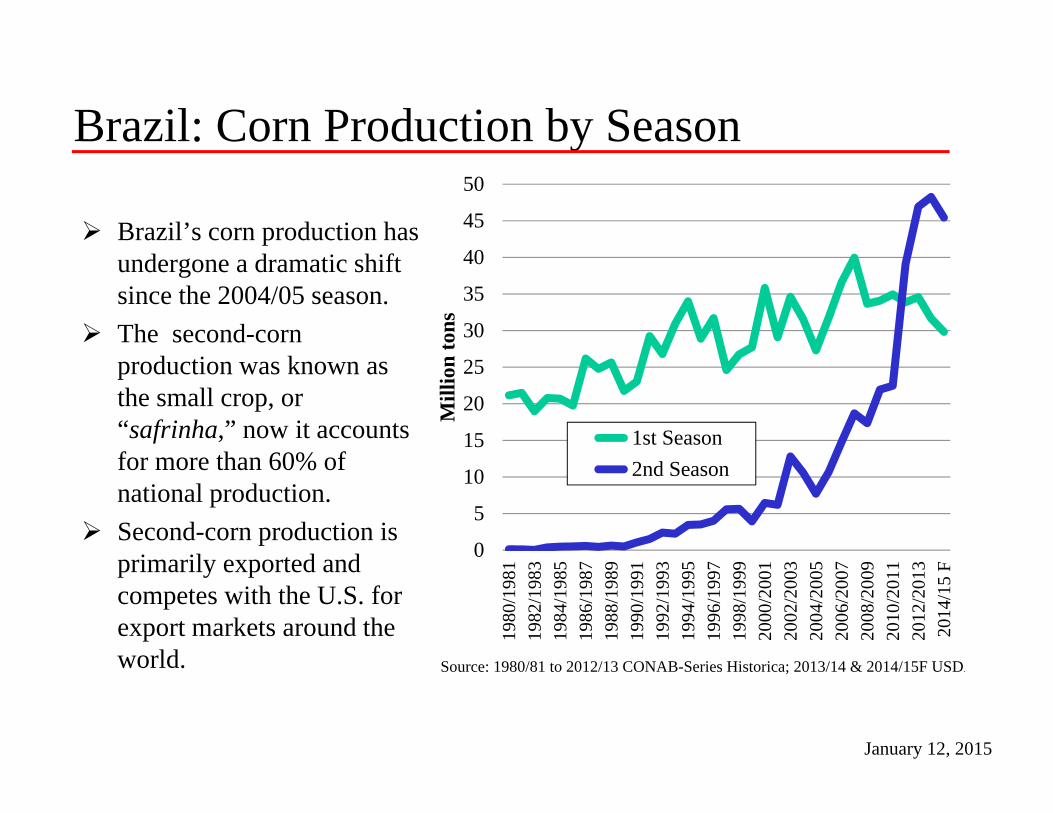
Brazil’s corn production has undergone a dramatic shift since the 2004/05 season.
The second-corn production was known as the small crop, or “safrinha,” now it accounts for more than 60% of national production.
Second-corn production is primarily exported and competes with the U.S. for export markets around the world.
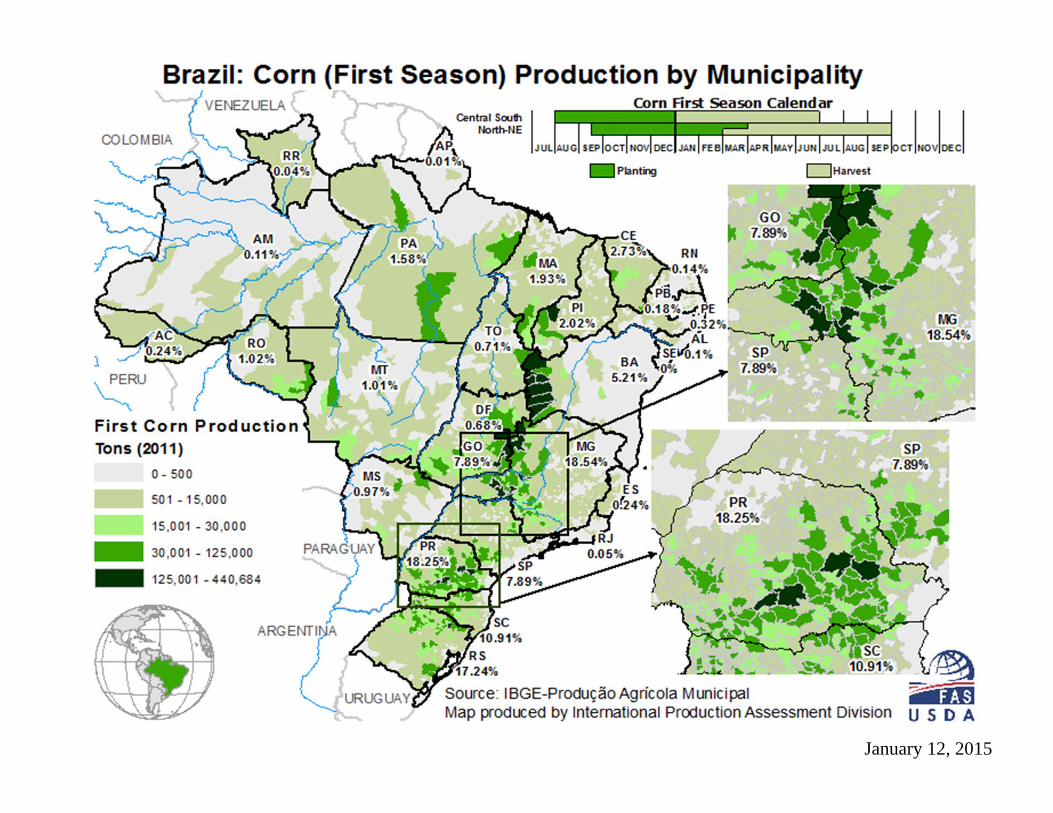
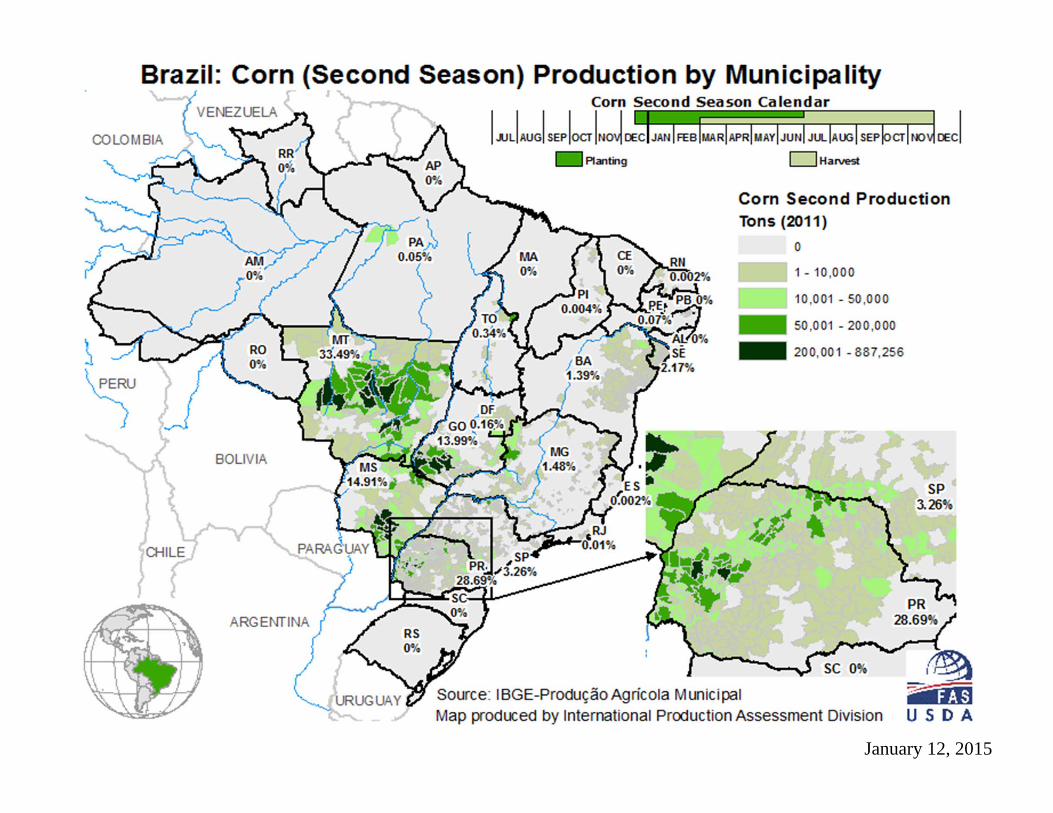
Brazil: Corn Production by Season
January 12, 2015
January 12, 2015
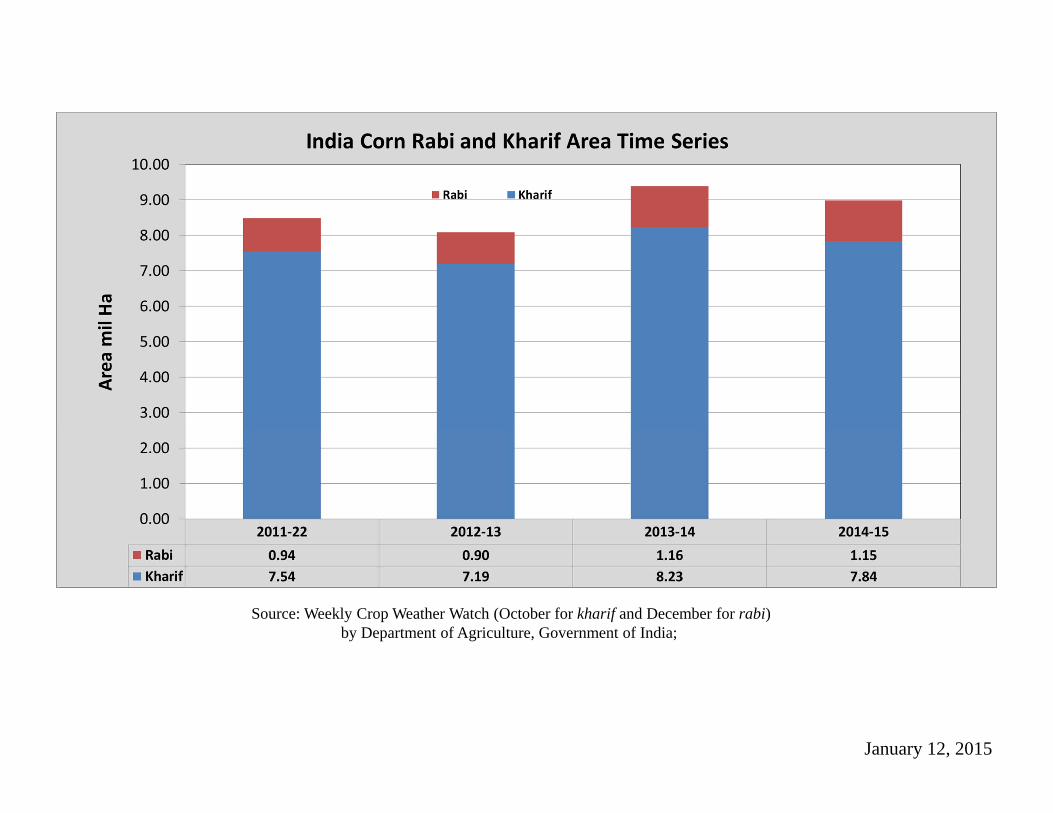
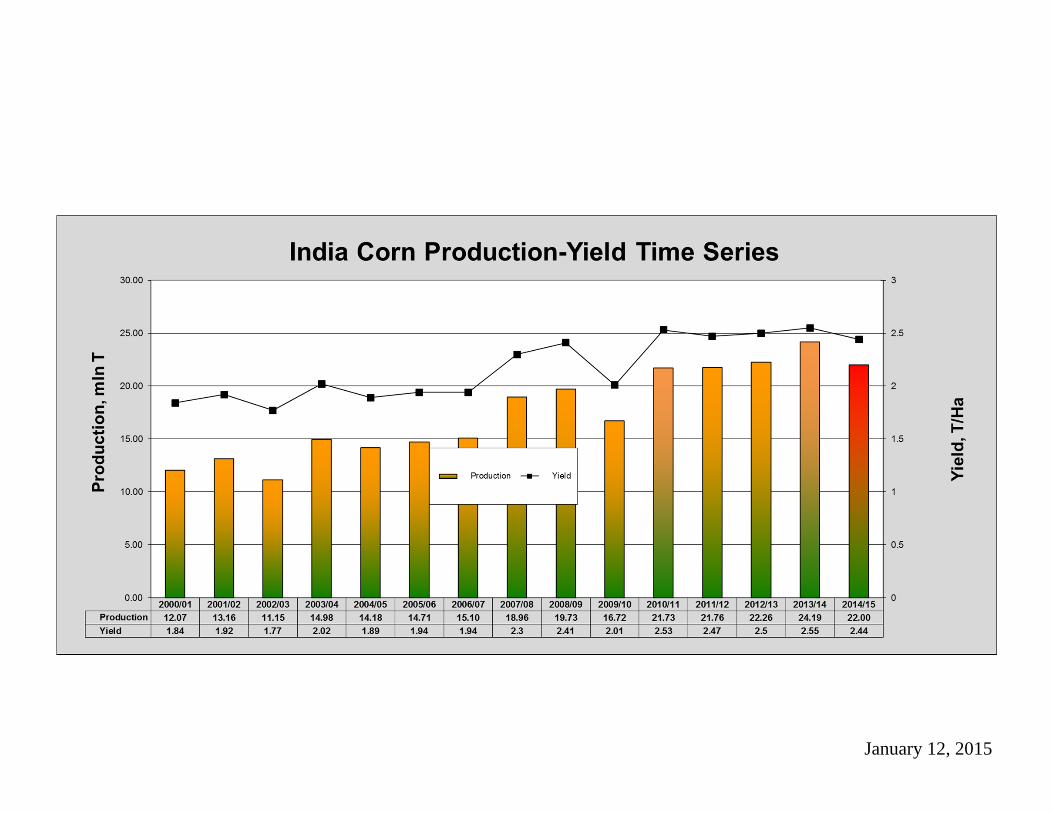
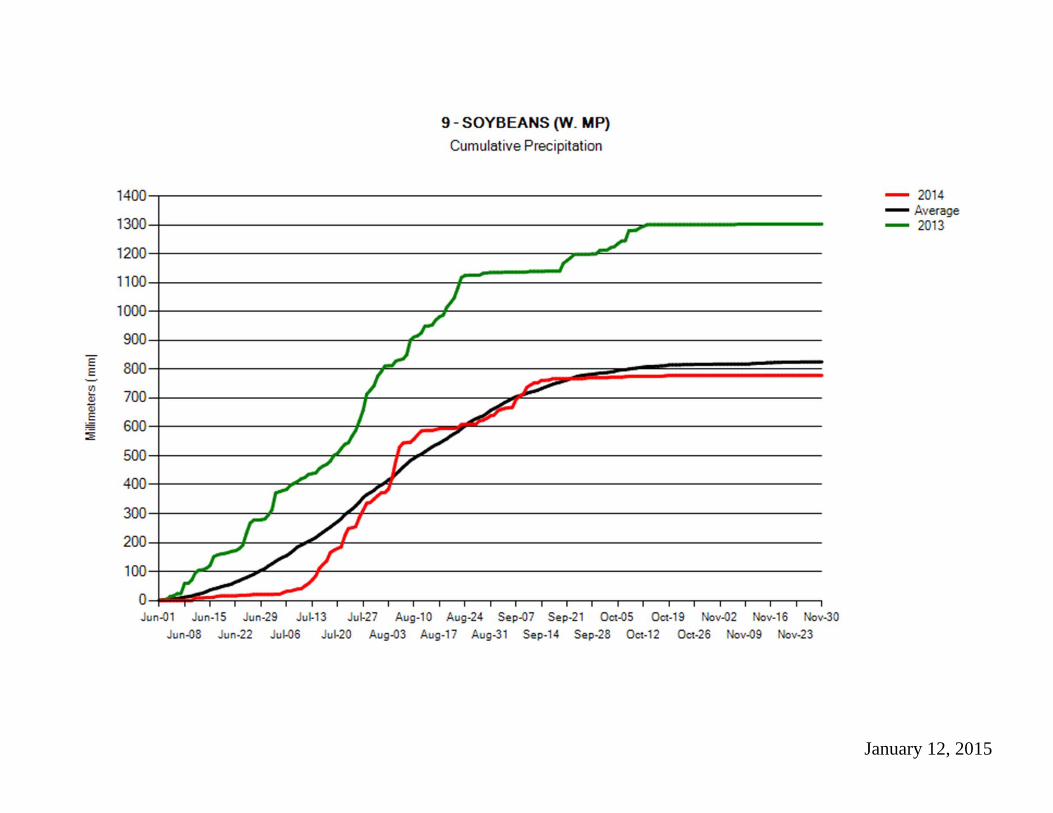
Source: Weekly Crop Weather Watch (October for kharif and December for rabi)by Department of Agriculture, Government of India;
January 12, 2015
January 12, 2015
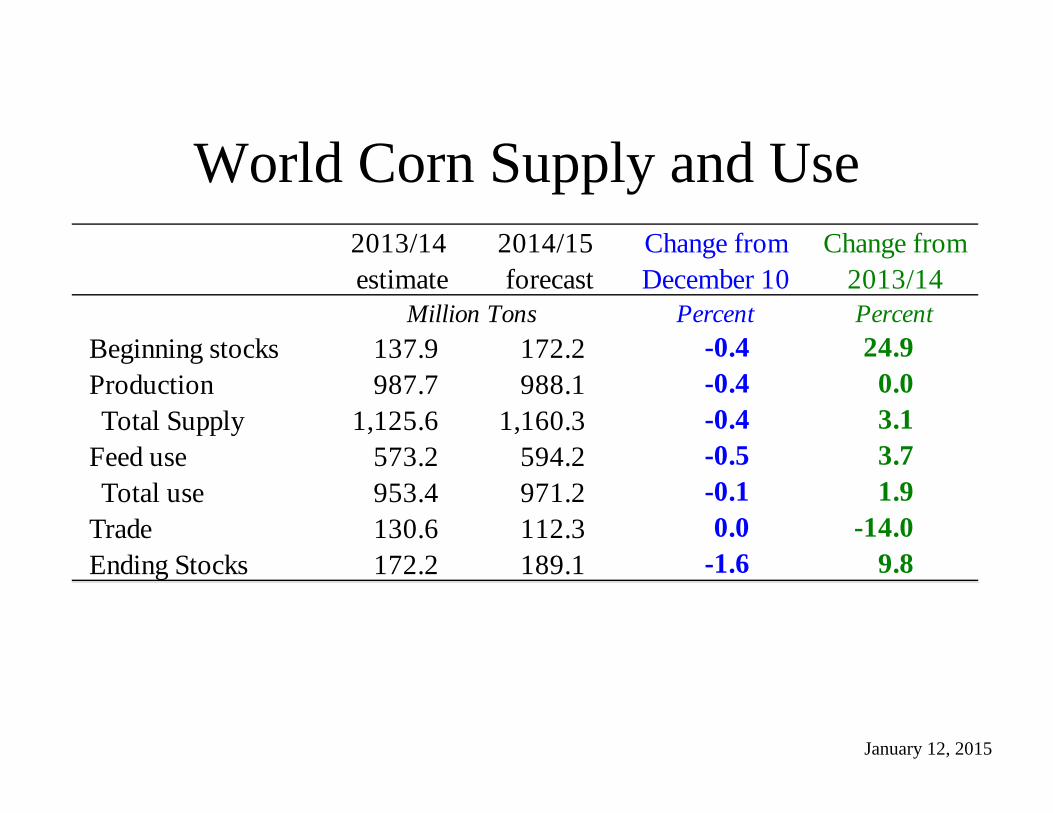
World Corn Supply and Use
January 12, 2015
2013/14estimate
2014/15forecast
Change from December 10
Change from 2013/14
Million Tons Percent PercentBeginning stocks 137.9 172.2 -0.4 24.9Production 987.7 988.1 -0.4 0.0Total Supply 1,125.6 1,160.3 -0.4 3.1
Feed use 573.2 594.2 -0.5 3.7Total use 953.4 971.2 -0.1 1.9
Trade 130.6 112.3 0.0 -14.0Ending Stocks 172.2 189.1 -1.6 9.8
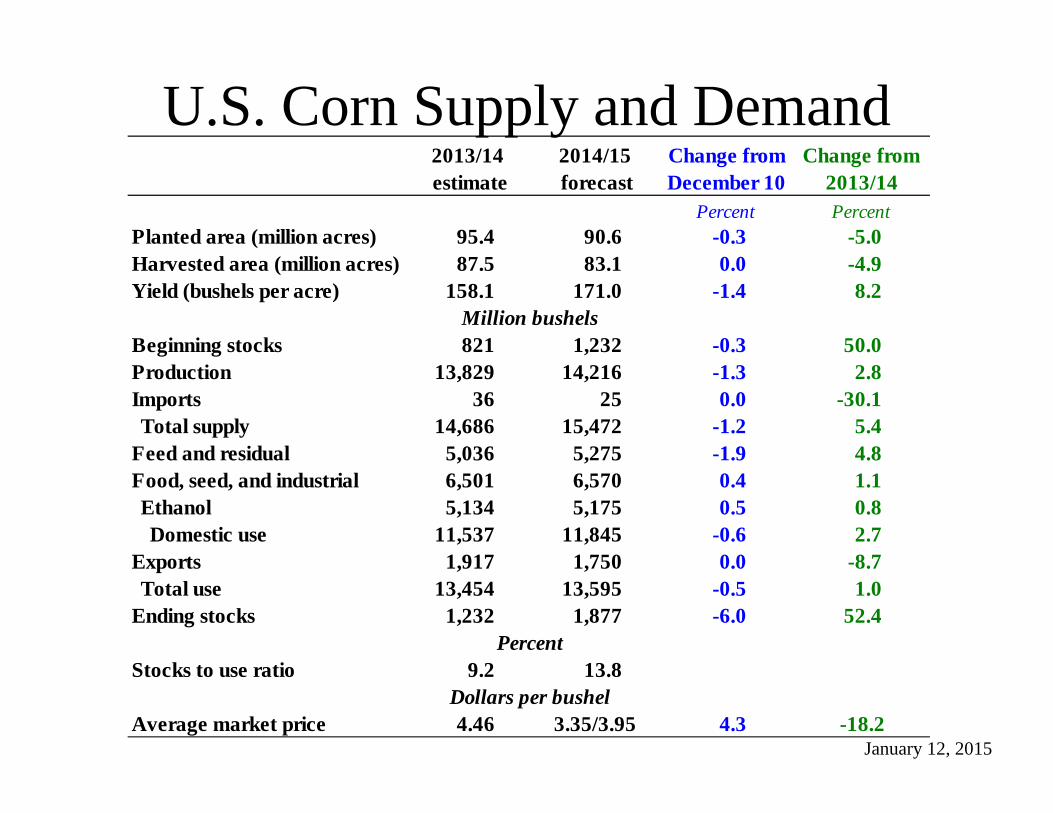
U.S. Corn Supply and Demand
January 12, 2015
2013/14 estimate
2014/15 forecast
Change from December 10
Change from 2013/14
Percent PercentPlanted area (million acres) 95.4 90.6 -0.3 -5.0Harvested area (million acres) 87.5 83.1 0.0 -4.9Yield (bushels per acre) 158.1 171.0 -1.4 8.2
Million bushelsBeginning stocks 821 1,232 -0.3 50.0Production 13,829 14,216 -1.3 2.8Imports 36 25 0.0 -30.1Total supply 14,686 15,472 -1.2 5.4
Feed and residual 5,036 5,275 -1.9 4.8Food, seed, and industrial 6,501 6,570 0.4 1.1Ethanol 5,134 5,175 0.5 0.8Domestic use 11,537 11,845 -0.6 2.7
Exports 1,917 1,750 0.0 -8.7Total use 13,454 13,595 -0.5 1.0
Ending stocks 1,232 1,877 -6.0 52.4Percent
Stocks to use ratio 9.2 13.8Dollars per bushel
Average market price 4.46 3.35/3.95 4.3 -18.2
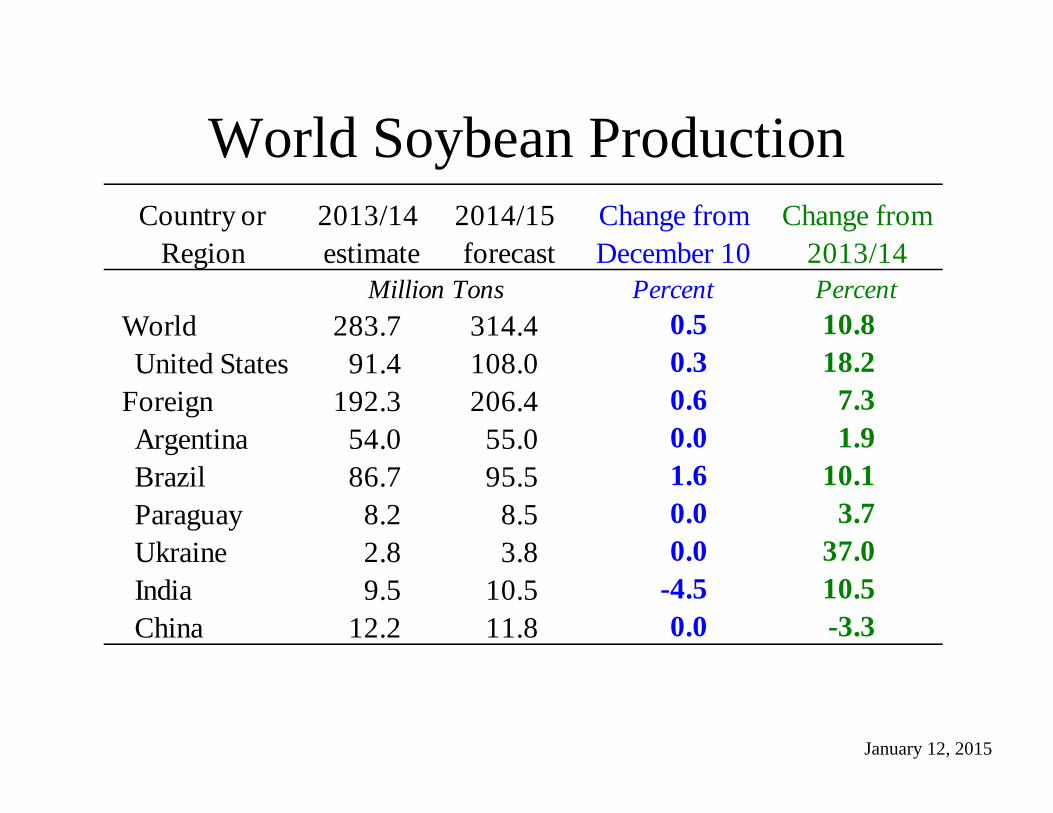
World Soybean Production
January 12, 2015
Country or Region
2013/14 estimate
2014/15forecast
Change from December 10
Change from 2013/14
Million Tons Percent PercentWorld 283.7 314.4 0.5 10.8United States 91.4 108.0 0.3 18.2
Foreign 192.3 206.4 0.6 7.3Argentina 54.0 55.0 0.0 1.9Brazil 86.7 95.5 1.6 10.1Paraguay 8.2 8.5 0.0 3.7Ukraine 2.8 3.8 0.0 37.0India 9.5 10.5 -4.5 10.5China 12.2 11.8 0.0 -3.3
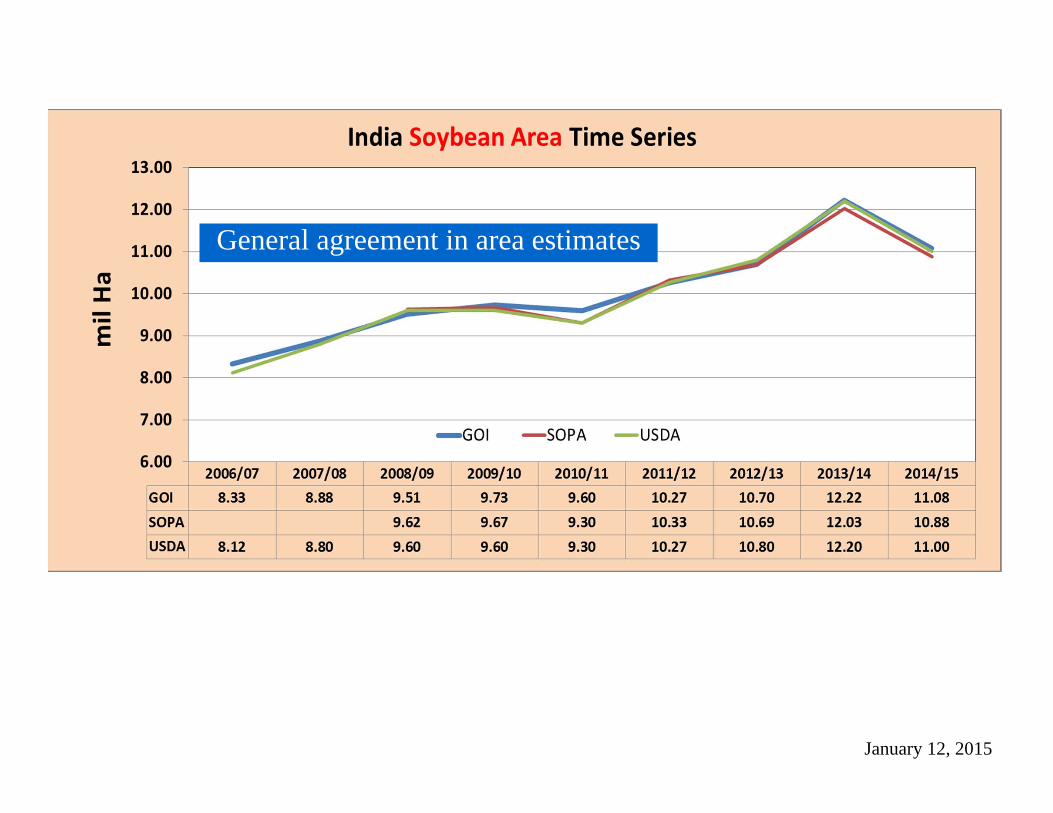
India Soybean Area Estimates Comparative Time Series:United States Department of Agriculture [USDA]
Government of India [GOI]Soybean Processors Association of India [SOPA]
General agreement in area estimates
January 12, 2015
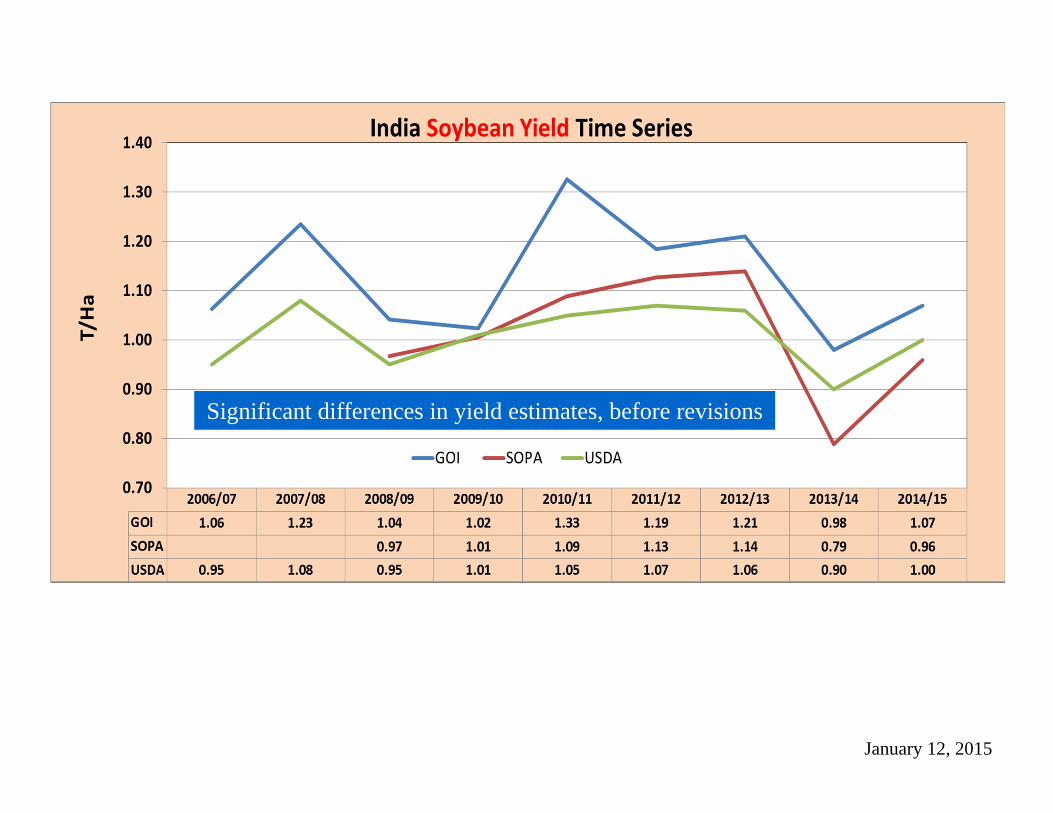
India Soybean Yield Estimates Comparative Time Series:
United States Department of Agriculture [USDA]Government of India [GOI]
Soybean Processors Association of India [SOPA]
Significant differences in yield estimates, before revisions
January 12, 2015
January 12, 2015
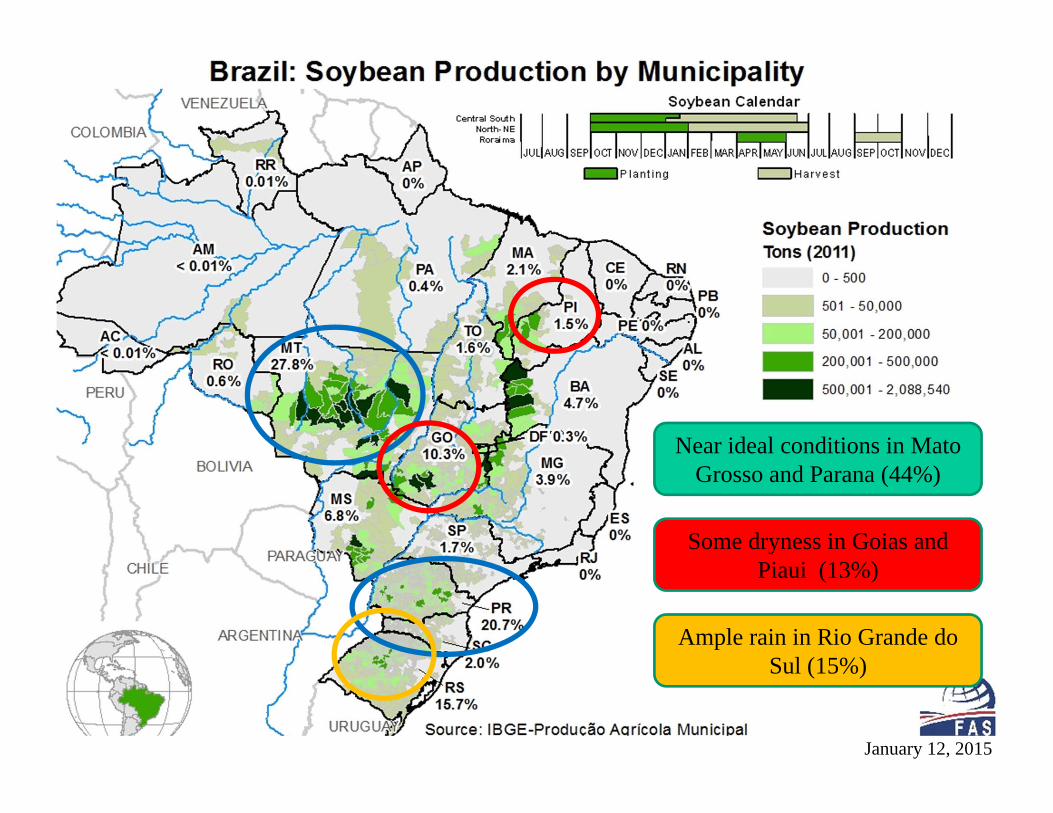
Near ideal conditions in Mato Grosso and Parana (44%)
Some dryness in Goias and Piaui (13%)
Ample rain in Rio Grande do Sul (15%)
January 12, 2015
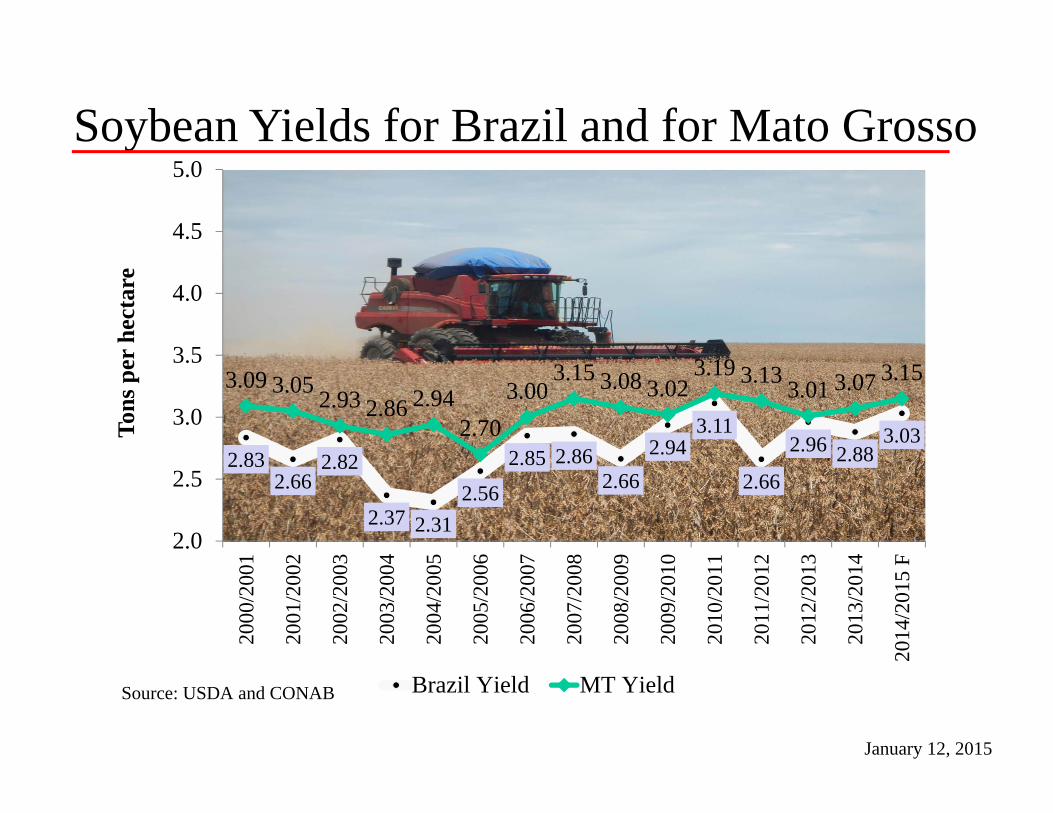
Soybean Yields for Brazil and for Mato Grosso
2.832.66
2.82
2.37 2.312.56
2.85 2.862.66
2.943.11
2.66
2.96 2.883.03
3.09 3.05 2.93 2.86 2.942.70
3.003.15 3.08 3.02
3.19 3.13 3.01 3.07 3.15
2.0
2.5
3.0
3.5
4.0
4.5
5.0
2000
/200
1
2001
/200
2
2002
/200
3
2003
/200
4
2004
/200
5
2005
/200
6
2006
/200
7
2007
/200
8
2008
/200
9
2009
/201
0
2010
/201
1
2011
/201
2
2012
/201
3
2013
/201
4
2014
/201
5 F
Tons
per
hec
tare
Brazil Yield MT YieldSource: USDA and CONAB
January 12, 2015
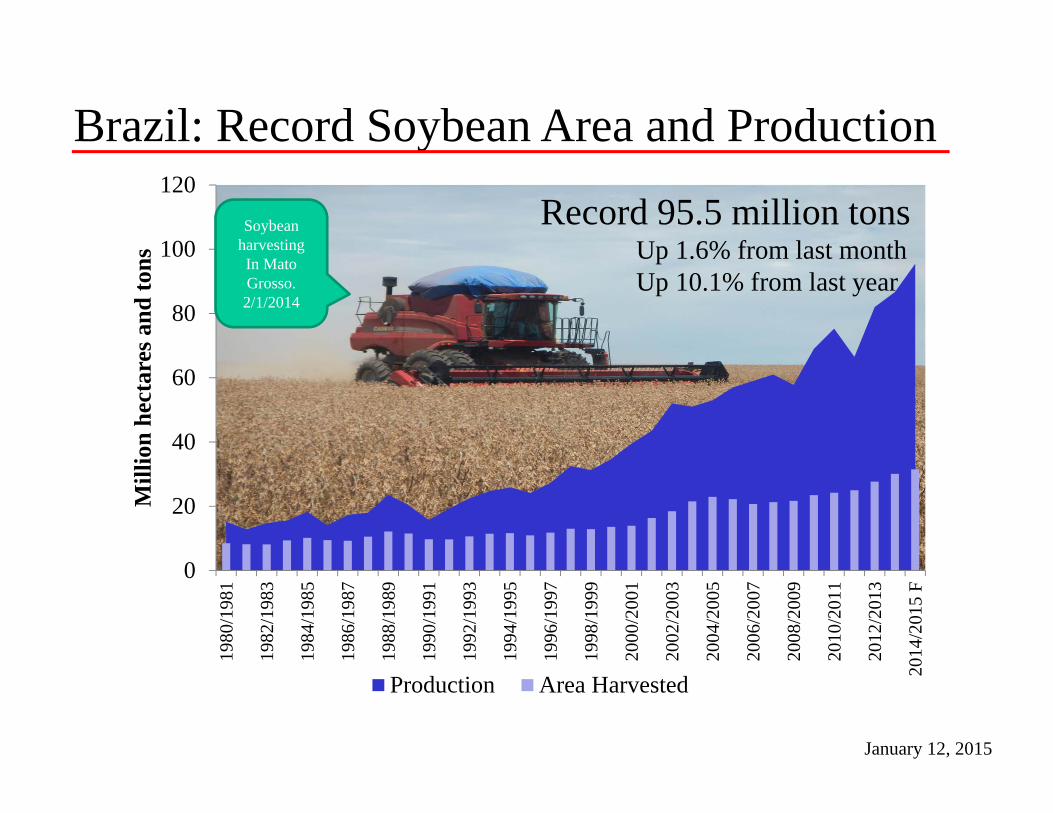
Brazil: Record Soybean Area and Production
0
20
40
60
80
100
120
1980
/198
1
1982
/198
3
1984
/198
5
1986
/198
7
1988
/198
9
1990
/199
1
1992
/199
3
1994
/199
5
1996
/199
7
1998
/199
9
2000
/200
1
2002
/200
3
2004
/200
5
2006
/200
7
2008
/200
9
2010
/201
1
2012
/201
3
2014
/201
5 F
Mill
ion
hect
ares
and
tons
Production Area Harvested
Record 95.5 million tonsUp 1.6% from last monthUp 10.1% from last year
Soybean harvestingIn Mato Grosso. 2/1/2014
January 12, 2015
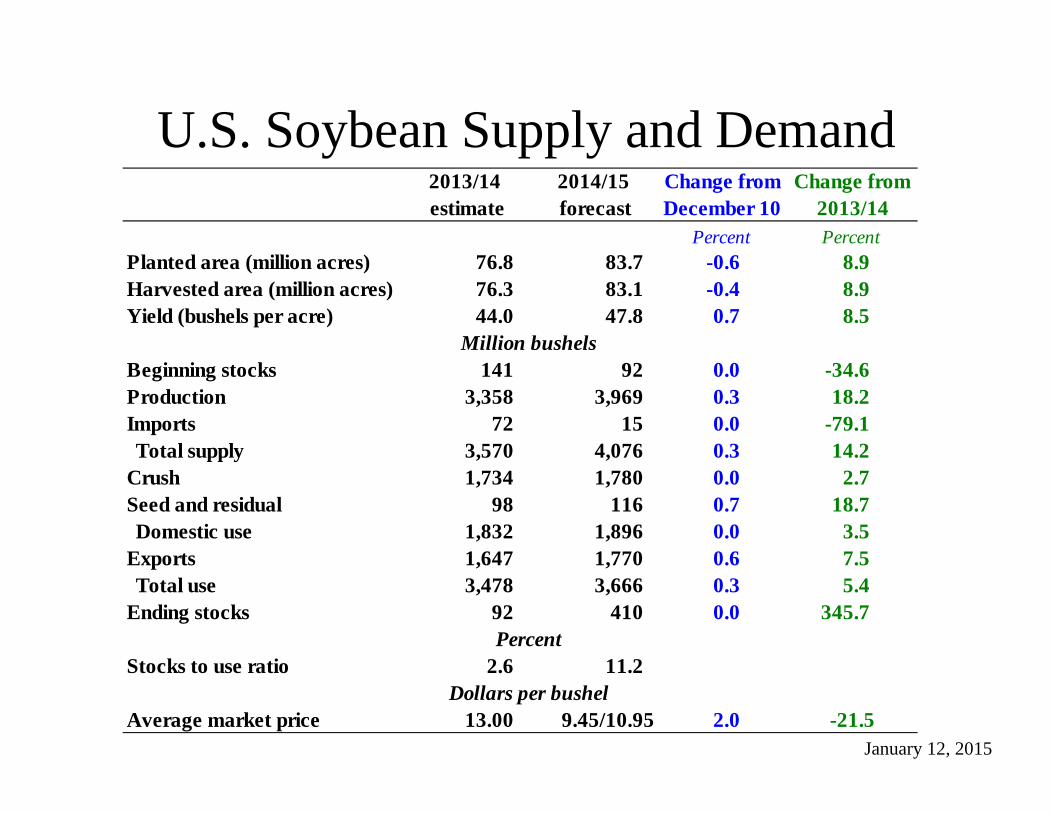
U.S. Soybean Supply and Demand
January 12, 2015
2013/14 estimate
2014/15 forecast
Change from December 10
Change from 2013/14
Percent PercentPlanted area (million acres) 76.8 83.7 -0.6 8.9Harvested area (million acres) 76.3 83.1 -0.4 8.9Yield (bushels per acre) 44.0 47.8 0.7 8.5
Million bushelsBeginning stocks 141 92 0.0 -34.6Production 3,358 3,969 0.3 18.2Imports 72 15 0.0 -79.1Total supply 3,570 4,076 0.3 14.2
Crush 1,734 1,780 0.0 2.7Seed and residual 98 116 0.7 18.7Domestic use 1,832 1,896 0.0 3.5
Exports 1,647 1,770 0.6 7.5Total use 3,478 3,666 0.3 5.4
Ending stocks 92 410 0.0 345.7Percent
Stocks to use ratio 2.6 11.2Dollars per bushel
Average market price 13.00 9.45/10.95 2.0 -21.5
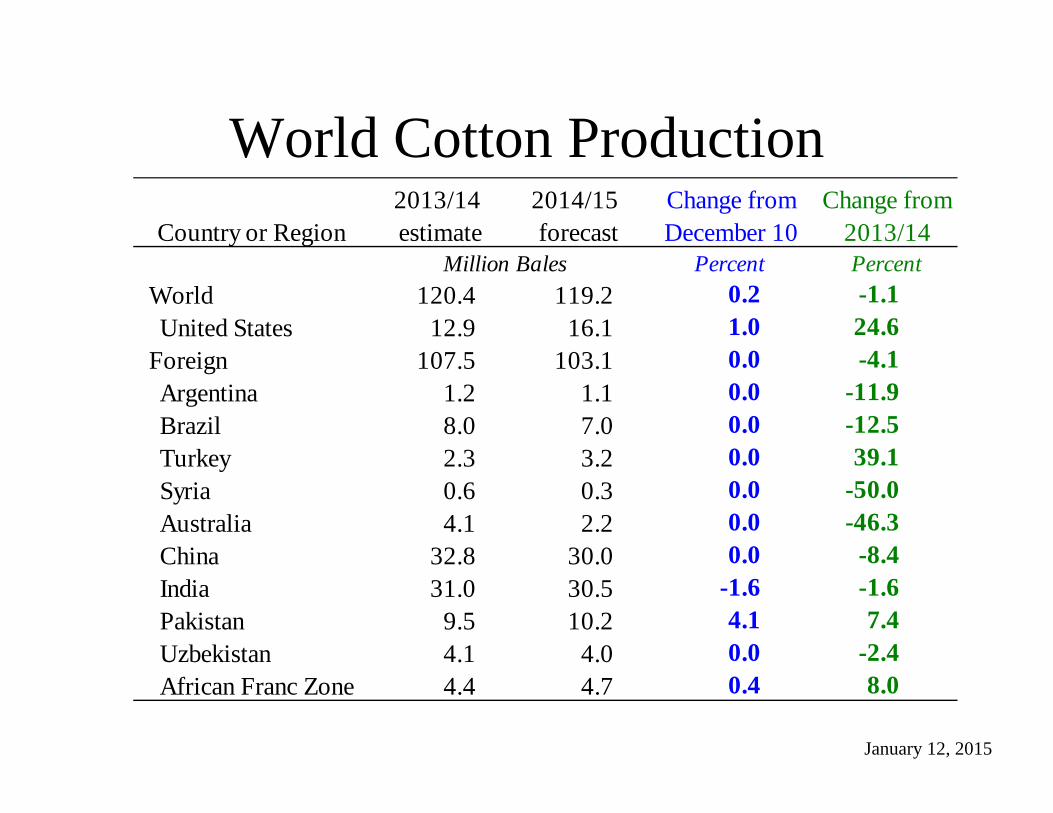
World Cotton Production
January 12, 2015
Country or Region2013/14estimate
2014/15forecast
Change from December 10
Change from 2013/14
Million Bales Percent PercentWorld 120.4 119.2 0.2 -1.1United States 12.9 16.1 1.0 24.6
Foreign 107.5 103.1 0.0 -4.1Argentina 1.2 1.1 0.0 -11.9Brazil 8.0 7.0 0.0 -12.5Turkey 2.3 3.2 0.0 39.1Syria 0.6 0.3 0.0 -50.0Australia 4.1 2.2 0.0 -46.3China 32.8 30.0 0.0 -8.4India 31.0 30.5 -1.6 -1.6Pakistan 9.5 10.2 4.1 7.4Uzbekistan 4.1 4.0 0.0 -2.4African Franc Zone 4.4 4.7 0.4 8.0
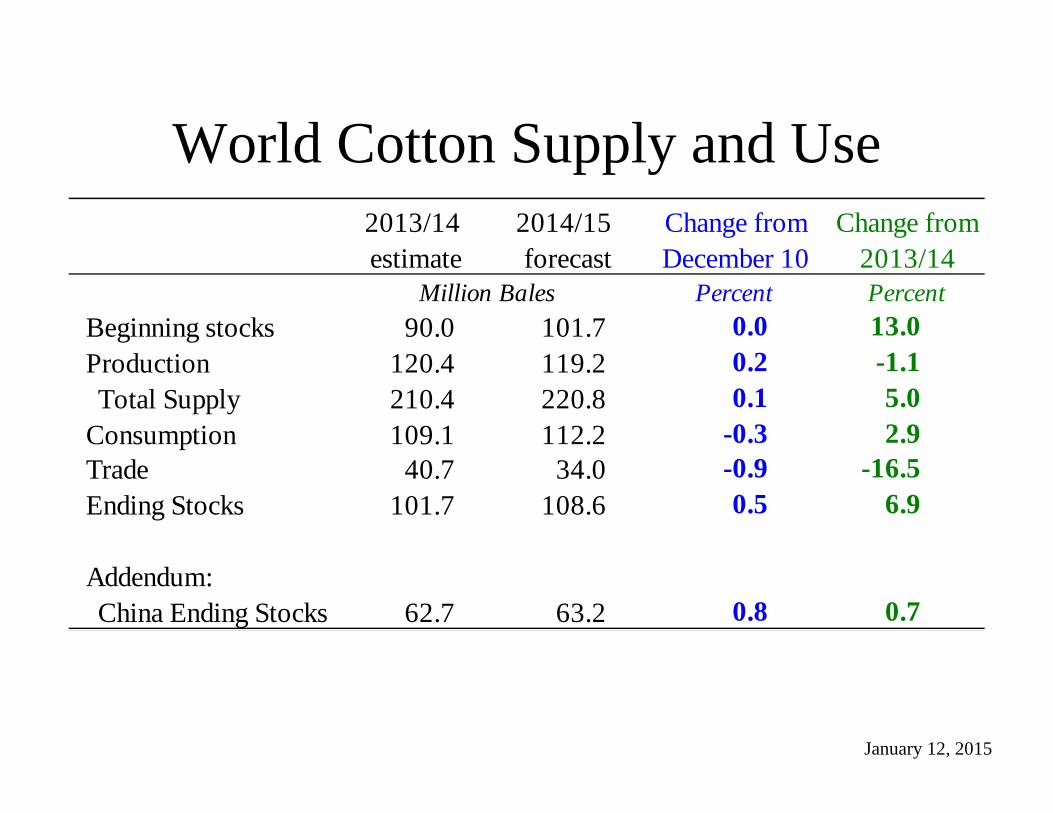
World Cotton Supply and Use
January 12, 2015
2013/14estimate
2014/15forecast
Change from December 10
Change from 2013/14
Million Bales Percent PercentBeginning stocks 90.0 101.7 0.0 13.0Production 120.4 119.2 0.2 -1.1Total Supply 210.4 220.8 0.1 5.0
Consumption 109.1 112.2 -0.3 2.9Trade 40.7 34.0 -0.9 -16.5Ending Stocks 101.7 108.6 0.5 6.9
Addendum:China Ending Stocks 62.7 63.2 0.8 0.7
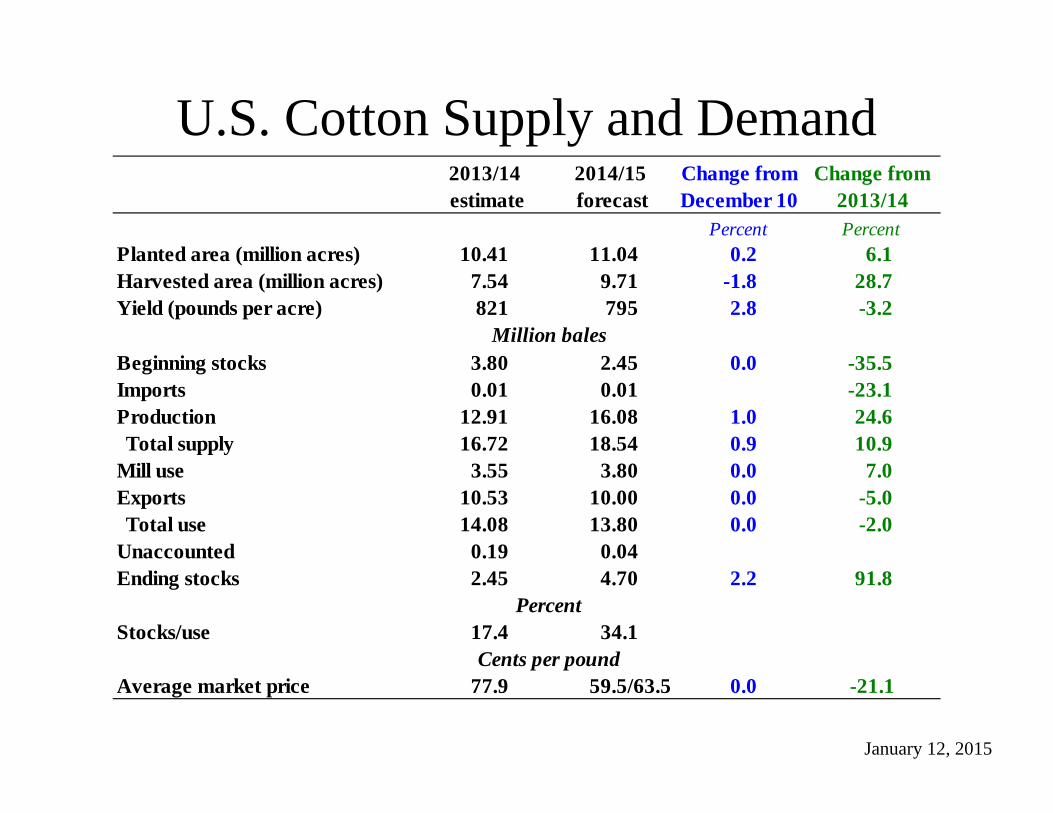
U.S. Cotton Supply and Demand
January 12, 2015
2013/14 estimate
2014/15 forecast
Change from December 10
Change from 2013/14
Percent PercentPlanted area (million acres) 10.41 11.04 0.2 6.1Harvested area (million acres) 7.54 9.71 -1.8 28.7Yield (pounds per acre) 821 795 2.8 -3.2
Million balesBeginning stocks 3.80 2.45 0.0 -35.5Imports 0.01 0.01 0.0 -23.1Production 12.91 16.08 1.0 24.6Total supply 16.72 18.54 0.9 10.9
Mill use 3.55 3.80 0.0 7.0Exports 10.53 10.00 0.0 -5.0Total use 14.08 13.80 0.0 -2.0
Unaccounted 0.19 0.04Ending stocks 2.45 4.70 2.2 91.8
PercentStocks/use 17.4 34.1
Cents per poundAverage market price 77.9 59.5/63.5 0.0 -21.1
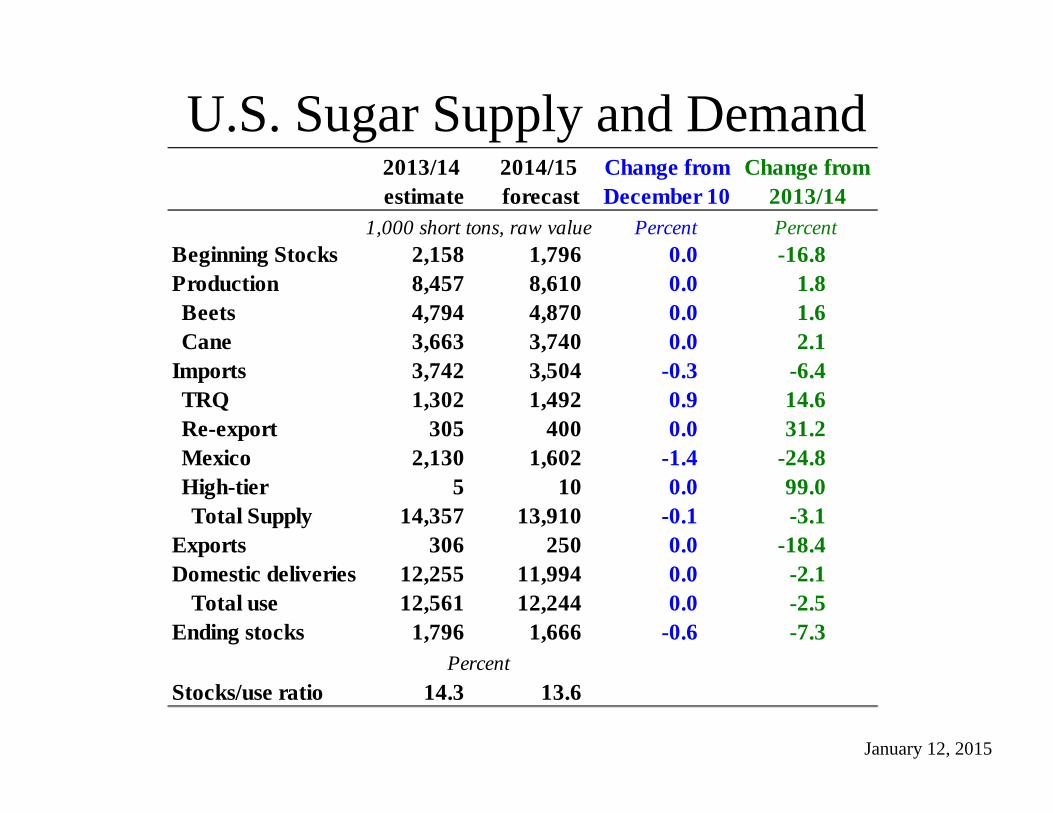
U.S. Sugar Supply and Demand
January 12, 2015
2013/14 estimate
2014/15 forecast
Change from December 10
Change from 2013/14
1,000 short tons, raw value Percent PercentBeginning Stocks 2,158 1,796 0.0 -16.8Production 8,457 8,610 0.0 1.8Beets 4,794 4,870 0.0 1.6Cane 3,663 3,740 0.0 2.1
Imports 3,742 3,504 -0.3 -6.4TRQ 1,302 1,492 0.9 14.6Re-export 305 400 0.0 31.2Mexico 2,130 1,602 -1.4 -24.8High-tier 5 10 0.0 99.0Total Supply 14,357 13,910 -0.1 -3.1
Exports 306 250 0.0 -18.4Domestic deliveries 12,255 11,994 0.0 -2.1
Total use 12,561 12,244 0.0 -2.5Ending stocks 1,796 1,666 -0.6 -7.3
PercentStocks/use ratio 14.3 13.6
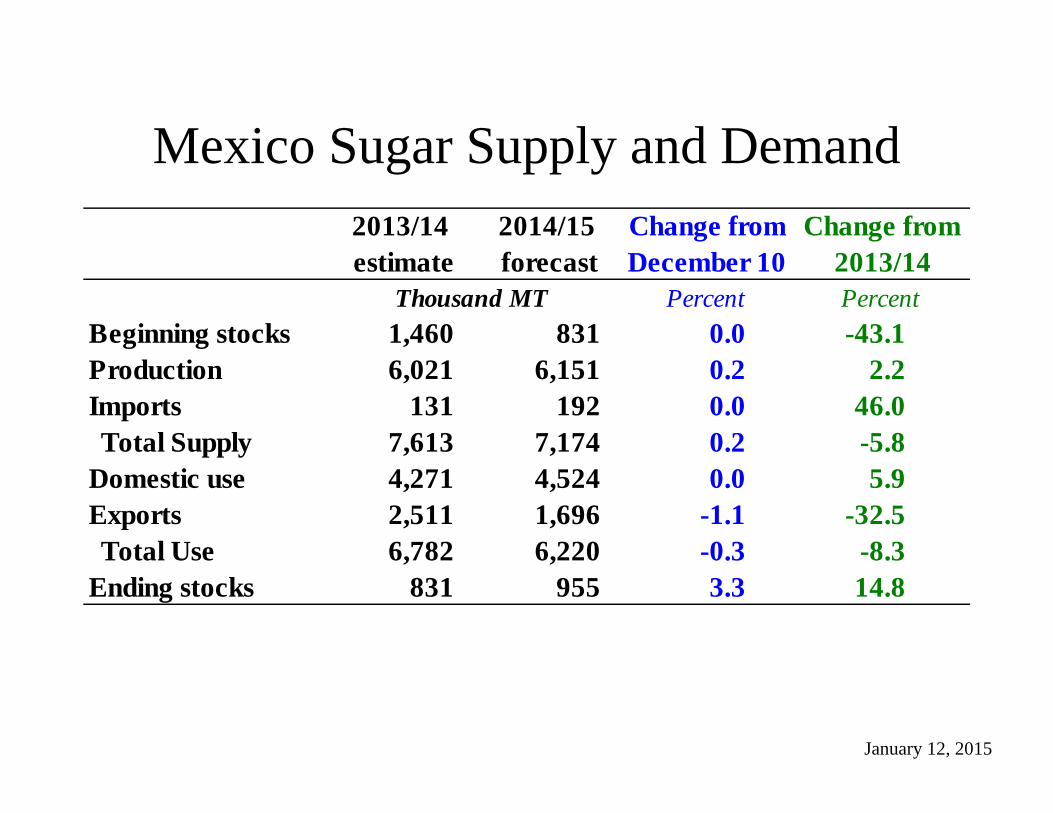
Mexico Sugar Supply and Demand
January 12, 2015
2013/14 estimate
2014/15 forecast
Change from December 10
Change from 2013/14
Thousand MT Percent PercentBeginning stocks 1,460 831 0.0 -43.1Production 6,021 6,151 0.2 2.2Imports 131 192 0.0 46.0Total Supply 7,613 7,174 0.2 -5.8
Domestic use 4,271 4,524 0.0 5.9Exports 2,511 1,696 -1.1 -32.5Total Use 6,782 6,220 -0.3 -8.3
Ending stocks 831 955 3.3 14.8
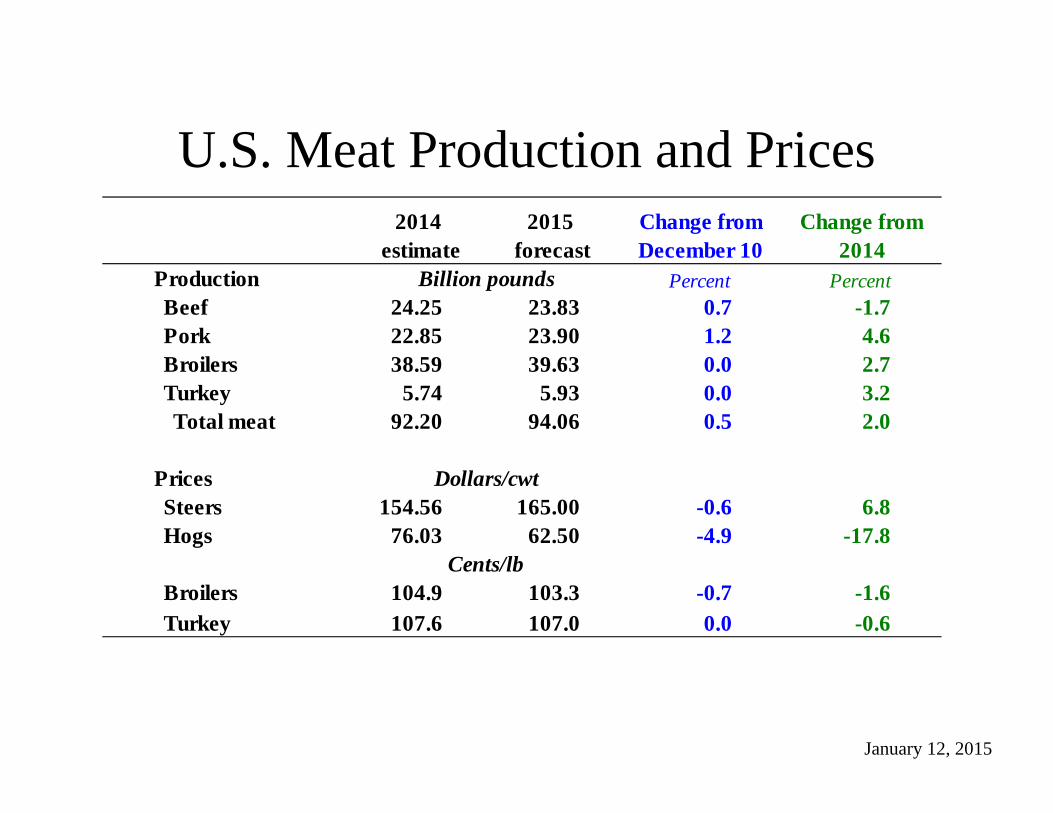
U.S. Meat Production and Prices
January 12, 2015
2014 estimate
2015 forecast
Change from December 10
Change from 2014
Production Billion pounds Percent PercentBeef 24.25 23.83 0.7 -1.7Pork 22.85 23.90 1.2 4.6Broilers 38.59 39.63 0.0 2.7Turkey 5.74 5.93 0.0 3.2Total meat 92.20 94.06 0.5 2.0
Prices Dollars/cwtSteers 154.56 165.00 -0.6 6.8Hogs 76.03 62.50 -4.9 -17.8
Cents/lbBroilers 104.9 103.3 -0.7 -1.6Turkey 107.6 107.0 0.0 -0.6
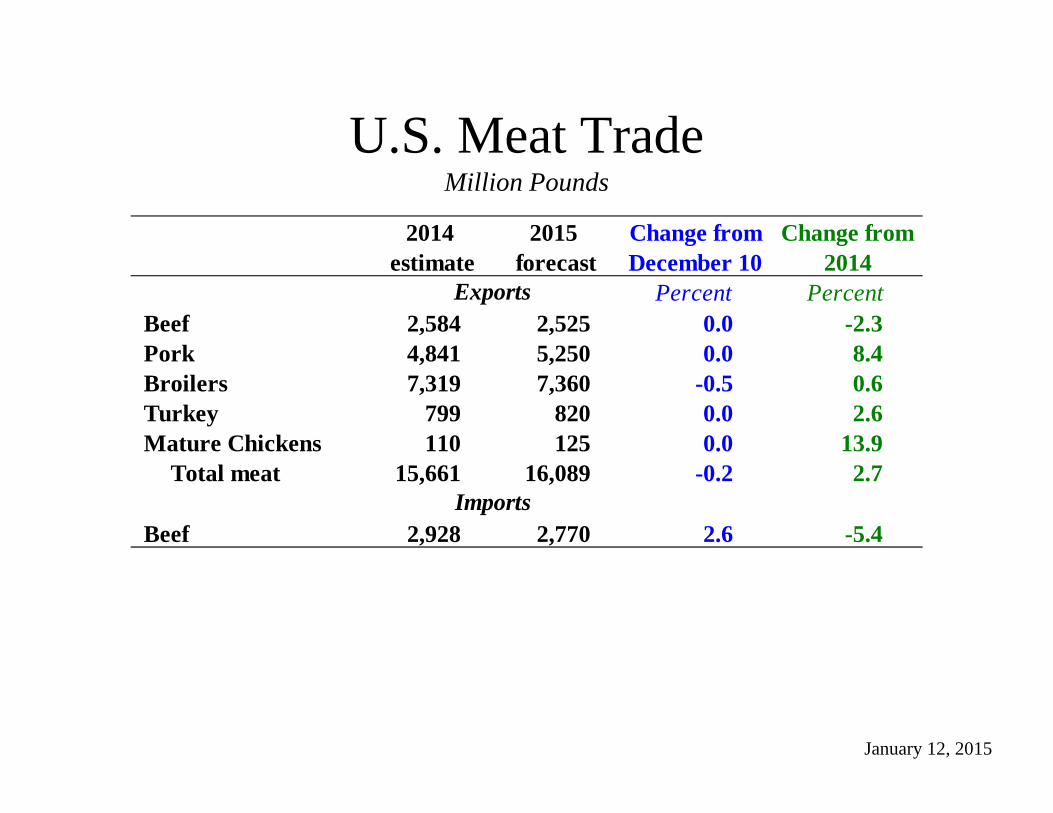
U.S. Meat TradeMillion Pounds
January 12, 2015
2014estimate
2015forecast
Change from December 10
Change from 2014
Exports Percent PercentBeef 2,584 2,525 0.0 -2.3Pork 4,841 5,250 0.0 8.4Broilers 7,319 7,360 -0.5 0.6Turkey 799 820 0.0 2.6Mature Chickens 110 125 0.0 13.9
Total meat 15,661 16,089 -0.2 2.7Imports
Beef 2,928 2,770 2.6 -5.4
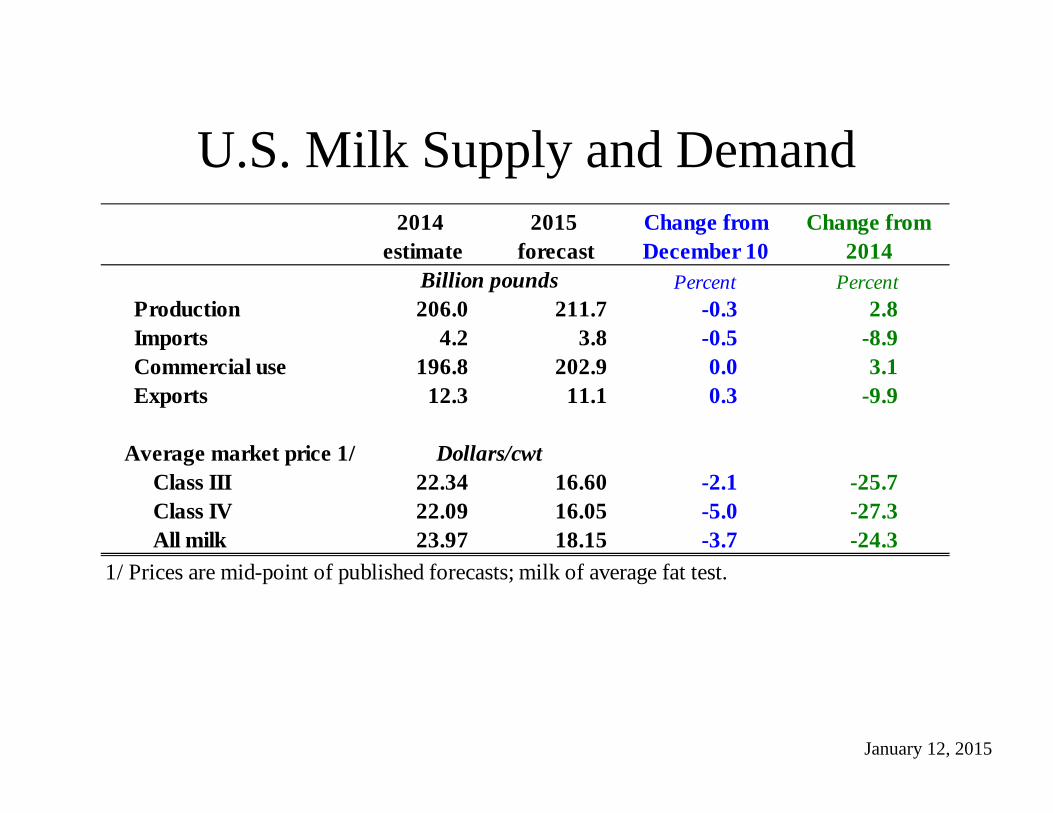
U.S. Milk Supply and Demand
January 12, 2015
2014 estimate
2015 forecast
Change from December 10
Change from 2014
Billion pounds Percent PercentProduction 206.0 211.7 -0.3 2.8Imports 4.2 3.8 -0.5 -8.9Commercial use 196.8 202.9 0.0 3.1Exports 12.3 11.1 0.3 -9.9
Average market price 1/ Dollars/cwtClass III 22.34 16.60 -2.1 -25.7Class IV 22.09 16.05 -5.0 -27.3All milk 23.97 18.15 -3.7 -24.3
1/ Prices are mid-point of published forecasts; milk of average fat test.
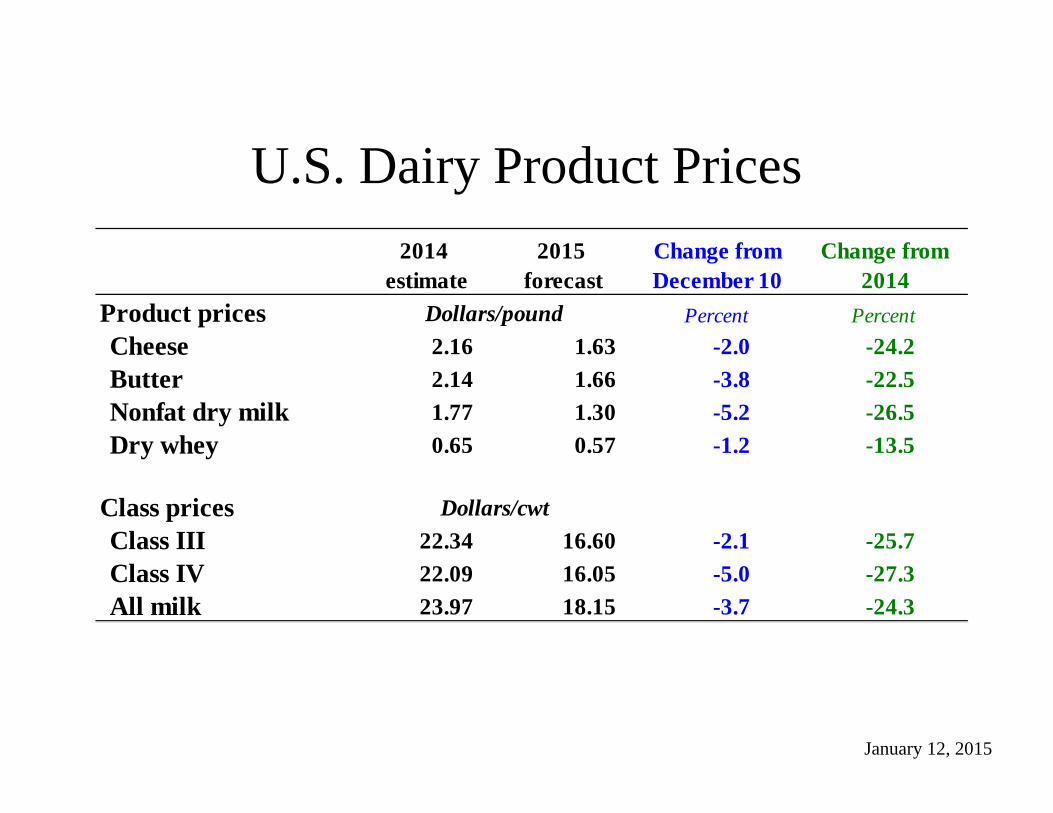
U.S. Dairy Product Prices
January 12, 2015
2014 estimate
2015 forecast
Change from December 10
Change from 2014
Product prices Dollars/pound Percent PercentCheese 2.16 1.63 -2.0 -24.2Butter 2.14 1.66 -3.8 -22.5Nonfat dry milk 1.77 1.30 -5.2 -26.5Dry whey 0.65 0.57 -1.2 -13.5
Class prices Dollars/cwtClass III 22.34 16.60 -2.1 -25.7Class IV 22.09 16.05 -5.0 -27.3All milk 23.97 18.15 -3.7 -24.3
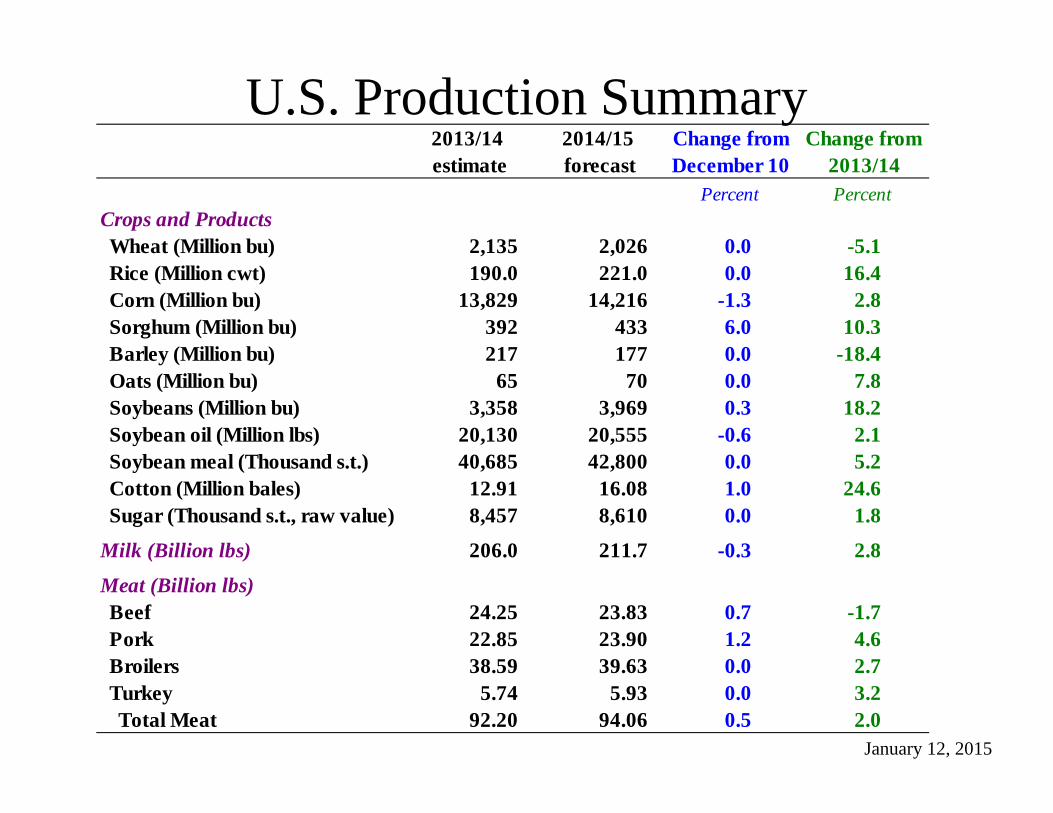
U.S. Production Summary
January 12, 2015
2013/14 estimate
2014/15 forecast
Change from December 10
Change from 2013/14
Percent PercentCrops and ProductsWheat (Million bu) 2,135 2,026 0.0 -5.1Rice (Million cwt) 190.0 221.0 0.0 16.4Corn (Million bu) 13,829 14,216 -1.3 2.8Sorghum (Million bu) 392 433 6.0 10.3Barley (Million bu) 217 177 0.0 -18.4Oats (Million bu) 65 70 0.0 7.8Soybeans (Million bu) 3,358 3,969 0.3 18.2Soybean oil (Million lbs) 20,130 20,555 -0.6 2.1Soybean meal (Thousand s.t.) 40,685 42,800 0.0 5.2Cotton (Million bales) 12.91 16.08 1.0 24.6Sugar (Thousand s.t., raw value) 8,457 8,610 0.0 1.8
Milk (Billion lbs) 206.0 211.7 -0.3 2.8
Meat (Billion lbs)Beef 24.25 23.83 0.7 -1.7Pork 22.85 23.90 1.2 4.6Broilers 38.59 39.63 0.0 2.7Turkey 5.74 5.93 0.0 3.2Total Meat 92.20 94.06 0.5 2.0
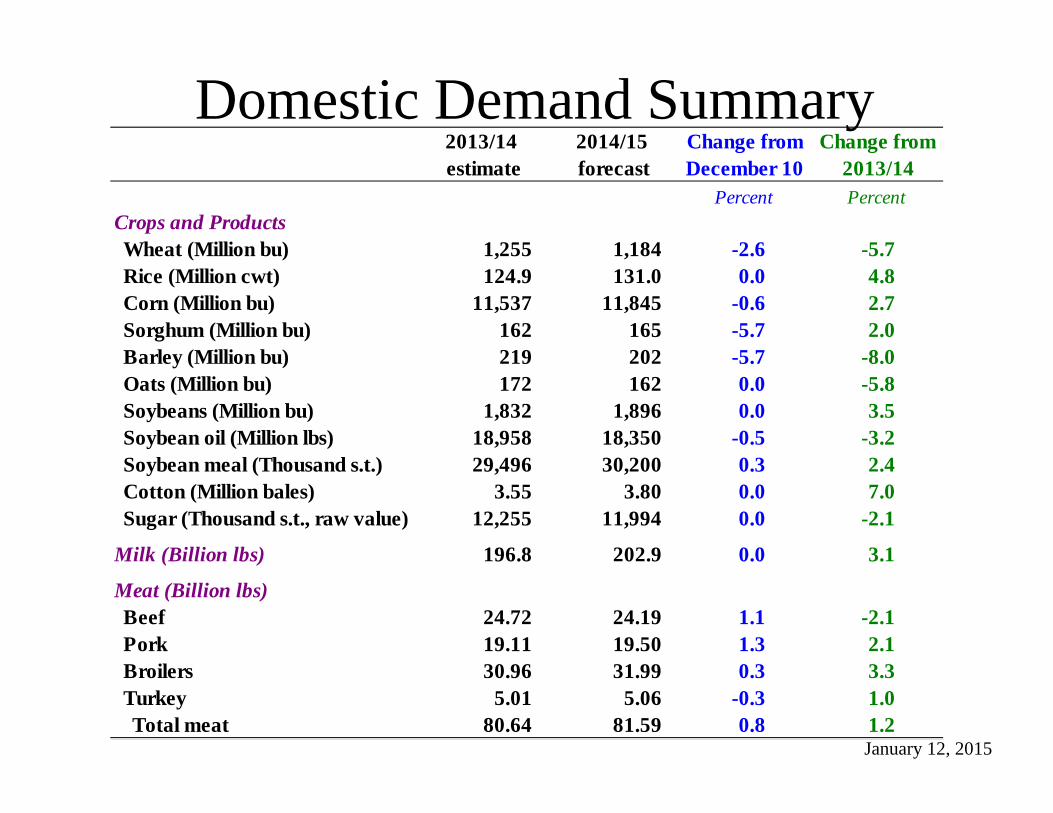
Domestic Demand Summary
January 12, 2015
2013/14 estimate
2014/15 forecast
Change from December 10
Change from 2013/14
Percent PercentCrops and ProductsWheat (Million bu) 1,255 1,184 -2.6 -5.7Rice (Million cwt) 124.9 131.0 0.0 4.8Corn (Million bu) 11,537 11,845 -0.6 2.7Sorghum (Million bu) 162 165 -5.7 2.0Barley (Million bu) 219 202 -5.7 -8.0Oats (Million bu) 172 162 0.0 -5.8Soybeans (Million bu) 1,832 1,896 0.0 3.5Soybean oil (Million lbs) 18,958 18,350 -0.5 -3.2Soybean meal (Thousand s.t.) 29,496 30,200 0.3 2.4Cotton (Million bales) 3.55 3.80 0.0 7.0Sugar (Thousand s.t., raw value) 12,255 11,994 0.0 -2.1
Milk (Billion lbs) 196.8 202.9 0.0 3.1
Meat (Billion lbs)Beef 24.72 24.19 1.1 -2.1Pork 19.11 19.50 1.3 2.1Broilers 30.96 31.99 0.3 3.3Turkey 5.01 5.06 -0.3 1.0Total meat 80.64 81.59 0.8 1.2
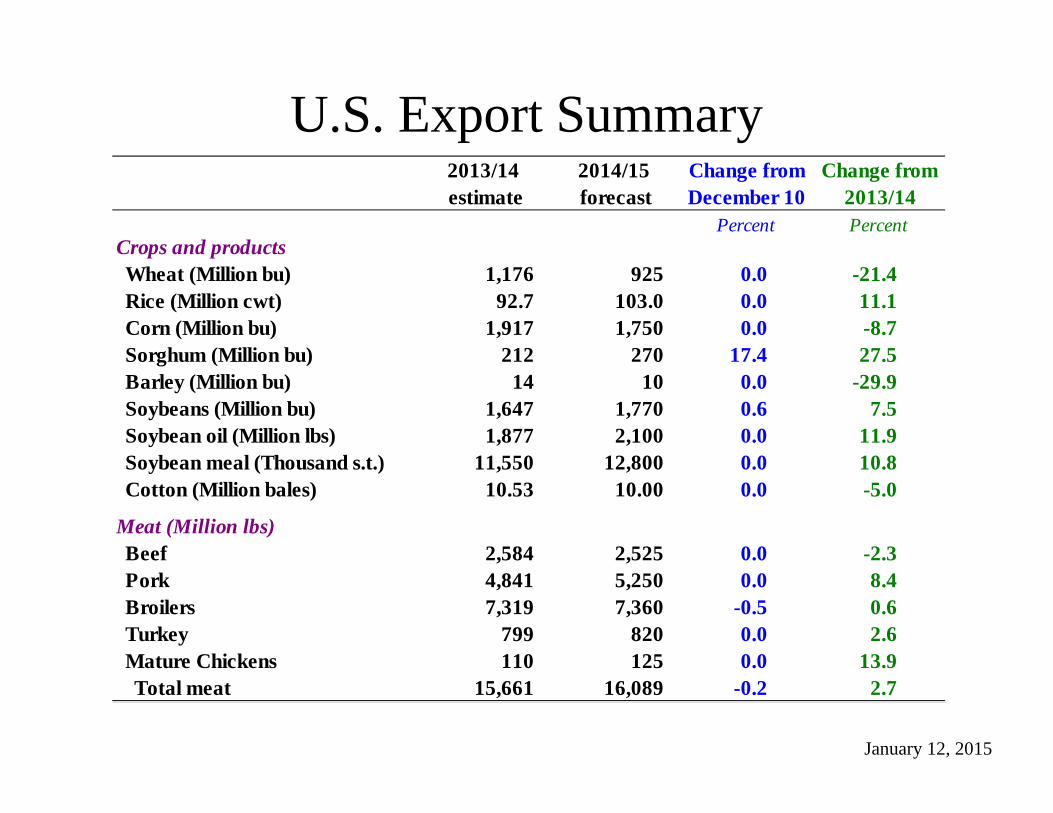
U.S. Export Summary
January 12, 2015
2013/14 estimate
2014/15 forecast
Change from December 10
Change from 2013/14
Percent PercentCrops and productsWheat (Million bu) 1,176 925 0.0 -21.4Rice (Million cwt) 92.7 103.0 0.0 11.1Corn (Million bu) 1,917 1,750 0.0 -8.7Sorghum (Million bu) 212 270 17.4 27.5Barley (Million bu) 14 10 0.0 -29.9Soybeans (Million bu) 1,647 1,770 0.6 7.5Soybean oil (Million lbs) 1,877 2,100 0.0 11.9Soybean meal (Thousand s.t.) 11,550 12,800 0.0 10.8Cotton (Million bales) 10.53 10.00 0.0 -5.0
Meat (Million lbs)Beef 2,584 2,525 0.0 -2.3Pork 4,841 5,250 0.0 8.4Broilers 7,319 7,360 -0.5 0.6Turkey 799 820 0.0 2.6Mature Chickens 110 125 0.0 13.9Total meat 15,661 16,089 -0.2 2.7
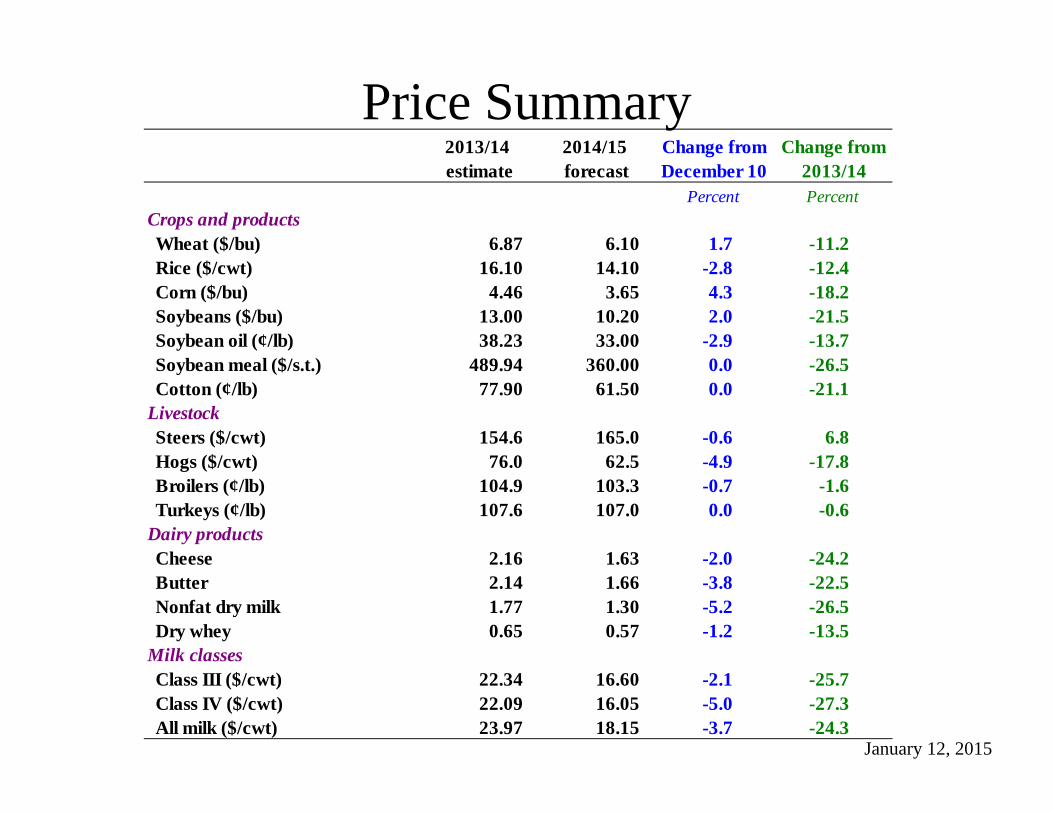
Price Summary
January 12, 2015
2013/14 estimate
2014/15 forecast
Change from December 10
Change from 2013/14
Percent PercentCrops and productsWheat ($/bu) 6.87 6.10 1.7 -11.2Rice ($/cwt) 16.10 14.10 -2.8 -12.4Corn ($/bu) 4.46 3.65 4.3 -18.2Soybeans ($/bu) 13.00 10.20 2.0 -21.5Soybean oil (¢/lb) 38.23 33.00 -2.9 -13.7Soybean meal ($/s.t.) 489.94 360.00 0.0 -26.5Cotton (¢/lb) 77.90 61.50 0.0 -21.1
LivestockSteers ($/cwt) 154.6 165.0 -0.6 6.8Hogs ($/cwt) 76.0 62.5 -4.9 -17.8Broilers (¢/lb) 104.9 103.3 -0.7 -1.6Turkeys (¢/lb) 107.6 107.0 0.0 -0.6
Dairy productsCheese 2.16 1.63 -2.0 -24.2Butter 2.14 1.66 -3.8 -22.5Nonfat dry milk 1.77 1.30 -5.2 -26.5Dry whey 0.65 0.57 -1.2 -13.5
Milk classesClass III ($/cwt) 22.34 16.60 -2.1 -25.7Class IV ($/cwt) 22.09 16.05 -5.0 -27.3All milk ($/cwt) 23.97 18.15 -3.7 -24.3