workshop report: considerations for developing leaching test
TRANSCRIPT
WORKSHOP REPORTConsiderations for Developing
Leaching Test Methods for Semi- and Non-Volatile Organic Compounds
United States Office of Research EPA 600-R-16-057 Environmental Protection and Development (E343-02) April 2016 Agency Office of Land and www.epa.gov/superfund
Emergency Management (5102G)
THIS PAGE INTENTIONALLY LEFT BLANK
EPA/600/R-16/057 April 2016
WORKSHOP REPORT CONSIDERATIONS FOR DEVELOPING LEACHING TEST METHODS FOR SEMI- AND NON-VOLATILE ORGANIC COMPOUNDS
THIS PAGE INTENTIONALLY LEFT BLANK
Workshop Report Table of Contents
TABLE OF CONTENTS
NOTICE/DISCLAIMER.......................................................................................................................................................... III
ACKNOWLEDGEMENTS ....................................................................................................................................................... IV
ABBREVIATIONS AND ACRONYMS ................................................................................................................................. IV
1. INTRODUCTION ....................................................................................................................................................... 1
2. PRESENTATIONS AND RELATED DISCUSSIONS ........................................................................................ 32.1 Presentation: Key parameters or drivers that govern the source term at the
unit boundary for subsurface leaching of semi- (SVOC) and non-volatile (NVOC) organic chemicals .................................................................................................................... 3 Discussion ................................................................................................................................................... 4
2.2 What is our field test experience related to organics leaching? ........................................... 5 Discussion ................................................................................................................................................... 6
2.3 Estimation of Source Term Concentration for Organics Contained on Superfund Sites ......................................................................................................................................... 6 Discussion ................................................................................................................................................... 7
2.4 European and international standards on leaching of organic contaminants, available tools and recent developments for assessment of organic contaminants ............................................................................................................................................. 7
2.5 What is LEAF for inorganics? What lead to its development? What was the process and timeline for developing and validating the methods?................................... 10
2.6 Existing Tools and Limitations to Address Leaching of Organic Species ........................ 12
3. WORKSHOP DISCUSSION ................................................................................................................................... 163.1 Key Parameters that Drive Organics Leaching .......................................................................... 16 3.2 Important Considerations for Methods Development ........................................................... 17 3.3 Considerations Related to Source Materials and Constituents of Concern .................... 18 3.4 Applicability of LEAF Methods ......................................................................................................... 20
Appendix A: Workshop Agenda Appendix B: Workshop Participants Appendix C: Workshop Presentations
i
Workshop Report Lists of Tables and Figures
LIST OF TABLES
Table 2-1. LEAF Methods Overview ............................................................................................................................... 13
LIST OF FIGURES
Figure 2-1. Association of First Order Expressions to LEAF Leaching Tests ................................................ 15
ii
Workshop Report Notice/Disclaimer
NOTICE/DISCLAIMER
The U.S. Environmental Protection Agency (EPA), through its Office of Research and Development, funded the preparation of this report under EPA Contract No. EP-D-11-006. The Office of Resource Conservation and Recovery also provided funding for the workshop. This report was subjected to the Agency’s peer administrative review and is approved for publication as an EPA document. Statements captured in the discussion and summaries are those of the participants, not necessarily reflective of the EPA. Presentations are the responsibility of their authors and may represent opinions or personal points of view in some cases. Mention of trade names or commercial products does not constitute endorsement or recommendation for use.
iii
Workshop Report Acknowledgements
ACKNOWLEDGEMENTS
Many people contributed their expertise to the development and implementation of this workshop, and the preparation and review of this publication. This effort would not have been possible without the efforts of the USEPA and academic experts who participated in the workshop and assisted in the preparation of this report. The document was prepared for Susan Thorneloe of the Air Pollution Prevention and Control Division of the National Risk Management Research Laboratory of the USEPA Office of Research and Development under EPA Contract No. EP-D-11-006, Work Assignment No. 5-10. Co-authors and reviewers of the report include Susan Thorneloe, ORD; Linda Fiedler and Robin Anderson; Office of Superfund Remediation and Technology Innovation; and Greg Helms, Office of Resource Conservation and Recovery.
iv
Workshop Report Acknowledgements
FOREWORD
The U.S. Environmental Protection Agency (EPA) is charged by Congress with protecting the Nation’s land, air, and water resources. Under a mandate of national environmental laws, the Agency strives to formulate and implement actions leading to a compatible balance between human activities and the ability of natural systems to support and nurture life. To meet this mandate, EPA’s research program is providing data and technical support for solving environmental problems today and building a science knowledge base necessary to manage our ecological resources wisely, understand how pollutants affect our health, and prevent or reduce environmental risks in the future.
The National Risk Management Research Laboratory (NRMRL) is the Agency’s center for investigation of technological and management approaches for preventing and reducing risks from pollution that threaten human health and the environment. The focus of the Laboratory’s research program is on methods (and their cost-effectiveness) for the prevention and control of pollution to air, land, water, and subsurface resources; protection of water quality in public water systems; remediation of contaminated sites, sediments and ground water; prevention and control of indoor air pollution; and restoration of ecosystems. NRMRL collaborates with both public and private sector partners to foster technologies that reduce the cost of compliance and in order to identify/anticipate emerging problems. NRMRL’s research provides solutions to environmental problems by: developing and promoting technologies that protect and improve the environment; advancing scientific and engineering information to support regulatory and policy decisions; and providing the technical support and information transfer to ensure implementation of environmental regulations and strategies at the national, state, and community levels.
This publication has been produced as part of the Laboratory’s strategic long-term research plan. It is published and made available by EPA’s Office of Research and Development (ORD) to assist the user community and to link researchers with their clients.
Cynthia Sonich-Mullin, Director National Risk Management Research Laboratory
Office of Research and Development U.S. Environmental Protection Agency
v
Workshop Report Abbreviations and Acronyms
ABBREVIATIONS AND ACRONYMS
COC DNAPL DOC DOM EPA ERG EU ISO ISS LEAF L/S LSP MCL MGP MSW NAPL NRMRL NVOC ORCR ORD OSRTI PAH PCB PTFE RCRA SPLP SVOC TCLP UVA VOC
Contaminants of Concern Dense Non-Aqueous Phase Liquid Dissolved Organic Carbon Dissolved Organic Matter Environmental Protection Agency Eastern Research Group European Union International Organization for Standardization In Situ Solidification/Stabilization Leaching Environmental Assessment Framework Liquid/Solid Liquid Solid Partitioning Maximum Contaminant Level Manufactured Gas Plant Municipal Solid Waste Non-Aqueous Phase Liquid National Risk Management Research Laboratory Non-Volatile Organic Chemical Office of Resource Conservation and Recovery Office of Research and Development Office of Superfund Remediation and Technology Innovation Polycyclic Aromatic Hydrocarbon Polychlorinated Biphenyl Polytetrafluoroethylene Resource Conservation and Recovery Act Synthetic Precipitation Leaching Procedure (EPA Method 1312) Semi-Volatile Organic Chemical Toxicity Characteristic Leaching Procedure (EPA Method 1311) University of Virginia Volatile Organic Chemical
vi
Workshop Report Introduction
1. INTRODUCTION
The workshop was hosted by the US Environmental Protection Agency (EPA) on September 16 and 17, 2015 in Arlington, VA to discuss developing leaching test methods for semi- and non-volatile organic compounds. The purpose of the workshop was to exchange information concerning how to evaluate the potential for release of semi- or non-volatile organic constituents at contaminated sites where sub-surface treatment approaches have been applied to control migration, and from waste that is disposed or re-used. The workshop also considered how to predict sub-surface leaching potential at the outer edge of the treated media, or in disposal or material re-use situations, at the unit or use boundary. Representatives from EPA and academia participated in the workshop. Workshop discussions focused on identifying technical issues for further consideration to support the development of tools that could be used to make determinations of protectiveness and regulatory compliance.
Representatives from the Office of Resource Conservation and Recovery (ORCR) and the Office of Superfund Remediation and Technology Innovation (OSRTI) identified several workshop objectives, including:
• Identify key parameters expected to govern leaching potential of semi- and/or non-volatileorganic constituents from sub-surface treated media (e.g., soils) or disposed waste. Thekeys parameters will need to be considered in the development of leaching tests to providemore accurate source-term data that inform treatment and waste disposal decisions;
• Understand how to account for these parameters when evaluating release potential both atinitial treatment and over time (in general, 50-100 years);
• Identify methodologies currently used to evaluate organic constituent leaching and theirstrengths and weaknesses;
• Understand whether the Leaching Environmental Assessment Framework (LEAF)established for inorganics can be adapted to evaluate leaching of organic constituents; and
• Explore how to leverage the best science available to facilitate decision-making.
During the workshop, the following key points related to Superfund site remediation were discussed to help frame workshop discussions:
• Treatment effectiveness is measured at the waste management area boundary;
• Clean-up levels are assumed to be known;
• Superfund generally deals with site-specific data and information rather than generic ornational distributions of modeled fate and transport scenarios; and
• In situ treatment technologies most often used to treat organic contaminants in soil includesoil vapor extraction for volatile organic chemicals (VOCs) and in situsolidification/stabilization (ISS) for semi-volatile organic chemicals (SVOCs) and non-volatile organic chemicals (NVOCs).
After the introductory remarks, there were a series of technical presentations followed by related technical discussions. The information from each presentation is summarized in the remainder of this report. The report also includes the three appendices listed below.
1
Workshop Report Introduction
• Appendix C – Contains the presentations.
2
• Appendix A – Presents the workshop agenda,• Appendix B – Provides a list of the meeting participants, and
Workshop Report Presentations and Related Discussions
2. PRESENTATIONS AND RELATED DISCUSSIONS
As described in the agenda found in Appendix A, the workshop included a series of presentations. The key points from each presentation are below including summary points from the group discussion that followed each presentation.
2.1 Presentation: Key parameters or drivers that govern the source term at the unit boundary for subsurface leaching of semi- (SVOC) and non-volatile (NVOC) organic chemicals
Key points from Dr. Charles Werth’s (University of Texas – Austin) presentation:
• Factors that either retard or enhance leaching of semi- and non-volatile organics caninclude:
— Adsorption/desorption;— Multi-phase partitioning; and— Equilibrium vs. diffusion controlled release.
• Complex matrices that influence leaching include natural components of soils, sorptionamendments to sequester pollutants, and precipitates that encapsulate pollutants..
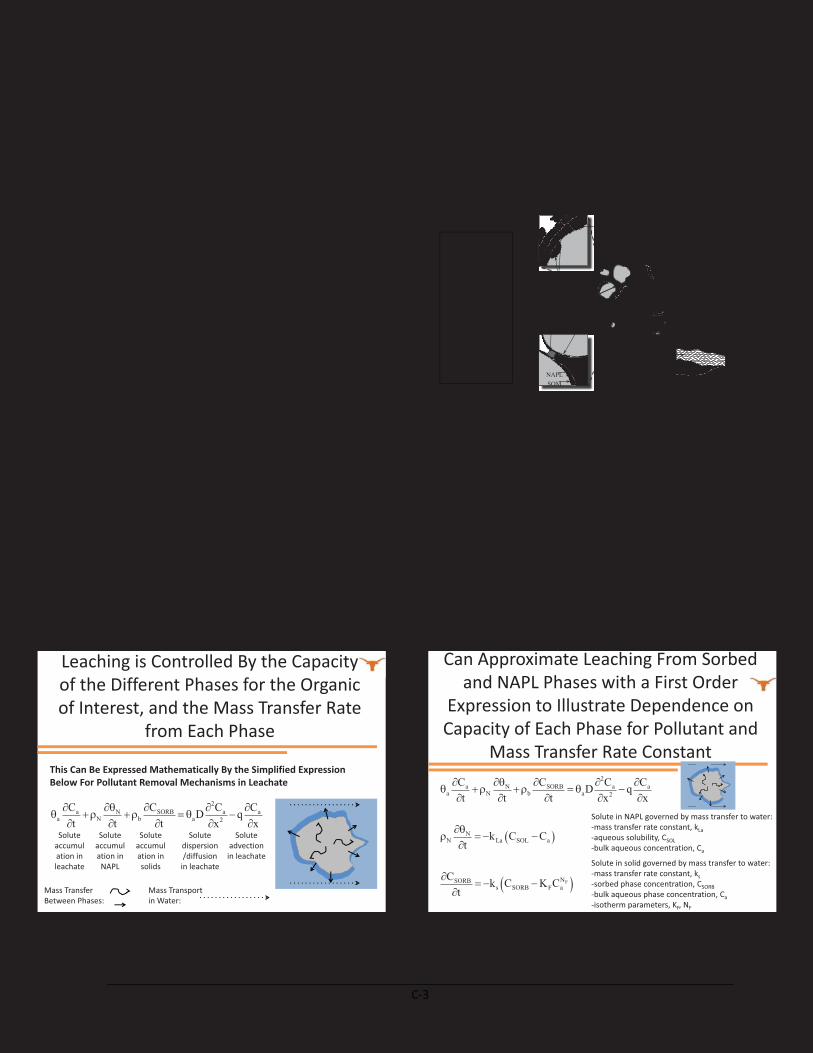
• Leaching is controlled by the capacity of the different phases for the organic chemical(s) ofinterest, and the mass transfer rate from each phase. As water moves through a phase, thesolute goes through advection and dispersion; each phase holds some of the solute (water,non-aqueous phase liquids (NAPL) – organic or a mixture, and solid), which accumulate inthe phases.
• It is possible to approximate leaching from sorbed and NAPL phases with a first orderexpression to illustrate dependence on the capacity of each phase for pollutant and masstransfer rate constant.
• The air phase holds little volatile organic chemicals (VOCs), semi-volatile organic chemicals(SVOCs) or non-volatile organic chemicals (NVOCs) relative to solid and NAPL phases andcontributes little to leaching.
• As is it replenished, the water phase represents leachate and serves as a pollutant sink forother phase. The by presence of salts, co-solvents, dissolved organic matter (DOM), andcolloids affects the capacity of the water phase.
— Increasing ionic strength decreases the aqueous solubility; Altered solubility is related to concentration of the salt As the salt concentration increases, solubility decreases (lowers the capacity of the
water)— Increasing co-solvent concentration increases the aqueous solubility (e.g., methanol –
changes the structure of the water and increases the capacity of water to hold a solute); and
— Increasing DOM concentration increases the apparent aqueous solubility (or associationwith macromolecules).
• Leaching capacity of soils and sediments depends on soil/sediment properties andchemical properties. Soils, sediments, and geosorbent amendments (e.g., char) can sorblarge amounts of VOCs, SVOCs and NVOCs, and slowly release them.
3
Workshop Report Presentations and Related Discussions
— Equilibrium capacity of these solids is determined by composition;— There are both absorption (or partitioning) and adsorption environments; and The capacity of the soil partitioning environment for contaminants in absorption
environments can be estimated and is often linear Adsorption environments are more challenging to characterize, and it is impossible
to predict adsorption; therefore, empirical models are often used The capacity of adsorption environments for contaminants must be measured; the
relationship between water and soil concentrations is typically nonlinear — Both partitioning and adsorption environments are often present in solids, and the
contribution of partitioning and adsorption environments varies widely depending on the sorbent.
• Mass transfer processes can be complex and occur in parallel or in series.
• A simplified model that focuses on multi-phase partitioning and adsorption is needed topredict mass transfer rates.
Discussion
• Consider each phase and identify the capacity and subsequent mass transfer rate.
— Capacity is relative to the solubility in water (high capacity = 1000x or more soluble inwater); and
— Mass transfer rate measured as velocity of leaching in a column (cm/min). Fast = equilibrium Medium = minutes to hour to days Slow = many days to weeks/months Very slow = years
• Cement amendments can be in block or granular form and the format can affect thediffusion length scale (a measure of how far the concentration has propagated over time).
— Diffusion coefficient affects the time scale and can be challenging to predict (e.g., if acontaminant is trapped throughout the cement, the length scale is unknown);
— For ISS with equal distribution of NAPL, expect fairly short length scales; and— For ISS with macro-encapsulation (boundary has no NAPL), expect very long length
scales.
• The manufactured gas plant (MGP) industry is adding activated carbon to reduce leaching,and there are questions regarding whether the added components are improvingperformance.
• An important consideration related to mass transfer is the degree of mixing and conformityfor laboratory prepared mixes compared to the long-term effects of actual treated materialsobserved in the field.
• Unmixed regions may dominate field results.
• The age of NAPL and its duration of contact to soil can influence the rate of leaching oforganic constituents.
4
Workshop Report Presentations and Related Discussions
• Adding adsorption materials to dilute the concentration of contaminated particles cancreate another environment whereby new added capacity delays or slows leaching(increasing the length scale slows overall mass transfer rate).
• Participants discussed ISS conditions that are below the water table. As the water table risesand falls, pore spaces are occupied and emptied thereby changing the connectivity of spacein the different phases.
— VOC transport through gas phase can be fast (i.e., would have a large impact on the rateat which VOC would leave); and
— Mass transfer of SVOCs in NAPLs would slow when water table goes down and increaseagain when water table re-rises back.
• Participants identified the following key considerations and questions for future work:
— The capacity and mass transfer rate constants for each phase determine the relativecontributions to leaching;
— Consider and evaluate competing mechanisms when developing a framework to assessleaching;
— Consider the conditions and integrity of materials over time (e.g., carbonation of weakcementitious material can influence product stability over time);
— Simulation of the age of material can be an important factor;— Account for time scales – test at various states (initial, six months, accelerated aging); Relate time scales of mass release to controlling process to design an experiment
and interpret release/risk— Conduct background research to better understand mixing issues and how to account
for differences between laboratory and field conditions (i.e., represent the potential for incomplete mixing and lack of mixing in the field);
— Identify uncertainties that exist between laboratory and field conditions; and— Consider external factors (environmental conditions) that influence the integrity of
materials (e.g., organoclays).
2.2 What is our field test experience related to organics leaching?
Key points from Dr. Craig Benson’s (University of Virginia) presentation:
• Dr. Benson discussed his experiences relating barrier experiments in the laboratory to thefield.
• He underscored the importance of understanding how the subtleties of experimental designcomponents can dramatically influence results and predictive outcomes.
• Several key issues to consider when designing experimental protocols include:
— Account for biological processes and activity of a system when designing experiments;— When running long-term experiments with small amounts of mass, pay significant
attention to experimental design and apparatus – measure and conduct experiments on design components;
— When dealing with small amounts of mass, exercise caution in the quantity of liquid toextract when sampling to avoid impact on mass transport processes;
5
Workshop Report Presentations and Related Discussions
— Experimental apparatus can have a significant effect on outcome of transportexperiments with hydrophobic organic contaminants at low concentrations;
— Evaluate materials beforehand as sinks for organic contaminants, even in the mostobscure components, to avoid false negatives;
— Evaluate apparatus for unintended sinks for organic contaminants (e.g., O-ring);— Develop expectations for outcomes of experiments to provide a reality check on data;— Accurately model the breakthrough time using simple analytical methods to bracket
expected boundaries; — Recognize the importance of quality control (positive and negative) and method blanks;
and — Understand what you expect to see and measure why you do not.
Discussion
• Dr. Benson reiterated the potential importance of the relationship and influence ofdissolved organic carbon (DOC) in experimental design following the discussion of DOMbinding in Dr. Werth’s talk.
— Specifically, how DOC impacts binding and whether the mobility of contaminants wouldincrease when using real groundwater with DOC over deionized water often used in the laboratory.
2.3 Estimation of Source Term Concentration for Organics Contained on Superfund Sites
Key points from Dr. Ed Barth’s (EPA/ORD/NRMRL) presentation:
• Dr. Barth discussed some of the challenges EPA Regions face in providing a quick answer forevaluating “the source term at the waste management area” for remedies involving ISS oforganic materials (including dense non-aqueous phase liquid [DNAPLs]).
• Dr. Barth discussed a variety of methods for pre-placement and post-placement evaluations.He indicated that EPA and other organizations have guidance for the evaluation of ISS fororganics, but questioned whether there is too much emphasis on physical properties (UCS,hydraulic conductivity) and not enough emphasis on chemical bonding strength andleaching mechanisms, especially if free product is present on the site and if colloids arepresent in the site around water.
• He described one approach to evaluate barrier improvements with an emphasis onorganoclays or activated carbon. Specifically, the focus would be to: (1) evaluate thebonding strength of activated carbon and organoclay, and (2) determine whether colloidsinterfere with bonding strength.
• Additional experimental design considerations specific to polycyclic aromatic hydrocarbons(PAHs), analytical techniques, and data interpretation techniques should include:
— Reduction of PAHs in laboratory samples due to photochemical oxidation exposure;— Headspace volatilization;— Dilution;— Sorption onto glassware; and— Oil sheens on sample surface.
6
Workshop Report Presentations and Related Discussions
• Historical and current laboratory approaches (evaluated by EPA and being proposed byEPA regional contractors) that EPA Regions use to assess adequacy oftreatment/containment processes include:
— Application of a modification to the LEAF Method 1315;— Use of site groundwater;— Use of coated glassware;— Partitioning/NAPL saturation; and— Use of pore water models based upon partitioning.
Discussion
• Summary points discussed:
— Some EPA Regional Offices have used leaching methods, beyond the toxicitycharacteristic leaching procedure (TCLP), to ascertain whether a treatment/containment process is either adequate to protect the public health and environment or as a comparison to other treatment technologies;
— An array of challenge fluids is available to cover the range of extraction recovery; and— While bonding-strength indicator methods are available, they are rarely used in
treatment evaluations.
• More guidance is required if EPA Regions are beginning to use a modification to LEAFMethod 1315 to determine organic leaching.
• TCLP remains the regulatory standard for RCRA hazardous waste determinations and landdisposal restrictions requirements and is widely used for ISS effectiveness determination.
2.4 European and international standards on leaching of organic contaminants, available tools and recent developments for assessment of organic contaminants
Key points from Hans van der Sloot’s (Consultant – retired from the Energy Research Center of the Netherlands) presentation:
• Dr. van der Sloot provided an understanding of leaching methods currently in use and thestatus of standardization and validation in Europe.
• European standardization is split into different fields (soil, waste, mining waste, andconstruction products) and methods that may be field-specific. Many fields have boundariesthat are interrelated and therefore, regulators are questioning whether methods need to beharmonized across fields to promote standardization.
• Dr. van der Sloot described parameter differences and adaptations among methods fororganics and inorganics and noted many similarities.
• In response to earlier discussions on important parameters, Dr. van der Sloot noted:
— Bioactivity/biodegradation is not addressed during the test itself, rather it is dealt withduring sample preparation and storage; and
— Address aging by testing at various states (initial, six months, accelerated aging), ratherthan designing for aging within the leaching test method itself.
7
Workshop Report Presentations and Related Discussions
• Important considerations identified through observations from European Union (EU)standardization activities for leaching standards for organics include:
— The fundamental processes that characterize release behavior are not different, and inmany cases information on both organic and inorganic substances is needed; and
— Material requirements for the equipment and other parts contacting the eluate areadapted to meet requirements for both types of substances. Glass column and stainless steel connections In the column, quartz sand or glass beads are used instead of filters It was noted that filtration commonly used for inorganic substances is unsuitable for
organic substances – if needed, centrifugation is recommended
• Dr. van der Sloot also noted the importance of the relationship of organics leaching to DOCand complexation with DOC. He has observed an apparent correlation of PAH with DOC,hence, indirect pH dependence of PAH leaching. This observation further underscores theneed to understand differing field conditions with the influence of DOC, where increasedDOC can increase leaching potential.
• Dr. van der Sloot summarized important take-away messages from the EU experiencedeveloping methods for organics:
— Adsorption to Material Surfaces Match contacting surfaces to organic substances of interest
○ Do not use plastics (including Viton), rubber, polytetrafluoroethylene (PTFE)(PAHs adsorb to Teflon)
○ Glass, stainless steel preferable
— Volatilization VOCs are not considered; only semi- and non-volatile organic substances are
considered
— Colloid Formation Because there is more colloid formation in a batch test compared to a column test,
centrifuge eluate rather than use filtration, if at all needed
— Eluate Analysis Always measure pH and DOC; DOC varies as a function of pH and hence water
insoluble organics associated with DOC have increased leachability as pH increases
— Demonstrated Higher Release Values from Batch vs. Column Tests Observations made during the development of International Organization for
Standardization (ISO) standards for soil show batch tests resulted in higher release values in almost all cases due to higher turbidity and thus higher DOC levels in batch compared to column
— Filtration and/or Centrifugation In the German test, filtration and centrifugation are not used when the turbidity of
the solution is below a certain value
8
Workshop Report Presentations and Related Discussions
• Additional key concepts that should be considered include:
— Liquid-solid partitioning; pH – indirectly relevant due to dependence of DOC on pH Liquid-solid ratio Redox – not directly relevant Dissolution/sorption Particulate and DOM interaction Eluate Chemistry
— Mass transport; and Diffusivity Surface area Surface interactions (local equilibrium)
— Limitations. Degradation of organic substances (after results are available, happens in the
analysis) Degradation of organic matter and associated DOC formation (time-lapsed issue) Sorption on many surfaces Volatilization
• Important observations were shared, including:
— Use of a common leaching conceptual framework and related standardized test methodswill allow for comparability of results across contaminants, sources of contaminated materials, scenarios and regulatory jurisdictions.
— Standardized tests show systematic release patterns for organic contaminants tofurther understanding of release mechanisms;
— Methods are aimed to simultaneously address both inorganic and organic substances tofacilitate ecotoxicity testing of eluates;
— Dissolved organic matter plays an important role in release of semi- and non-volatileorganic substances due to their association with DOC;
— Transport properties are controlled by the substance itself and by the transportproperties of DOC;
— The pH dependence of DOC release is important because the association of organicswith DOC impacts organics partitioning and transport;
— Release of organic substances from monolithic products (e.g., stabilized waste andtreated wood) is, primarily controlled by the release of DOC-bound organic substances and thus controlled by DOC release. DOC release from porous monolithic materials is about a factor 10 – 15 times slower than the release of soluble salts (e.g. Na+, K+, Cl-);
— DOC-associated organic substances are not bioavailable for a range of organismscurrently applied in ecotoxicity testing and thus have no toxic response;
— Partitioning of DOM in sub-fractions (fulvic and humic substances) may proveimportant, in view of their different binding characteristics for organic contaminants; and
— The use of soil adsorption coefficient (Koc) parameters allows the partitioning oforganic contaminants to be estimated between particulate and DOM.
9
Workshop Report Presentations and Related Discussions
• There were no tests have addressed specifications for leaching water (i.e., specifications forpH and DOC) and therefore underscores the importance of a pH dependence test tounderstand the impacts.
2.5 What is LEAF for inorganics? What lead to its development? What was the process andtimeline for developing and validating the methods?
Key points from Greg Helms’ (EPA/ORCR) and Susan Thorneloe’s (EPA/ORD/NRMRL) presentations:
• Greg Helms provided an overview of LEAF for inorganics, what led to its development andthe process and timeline for developing and validating the methods.
• The TCLP is a generic leaching test representing an eluant pH = 4.98 (that of active decayphase in a municipal solid waste [MSW] landfill); TCLP is broadly used and in many casesinappropriately applied (e.g., at conditions not representative of the pH).
• Given the deficiencies and challenges of TCLP, EPA was urged to evaluate other morerepresentative methods to estimate and predict leaching that provide a betterrepresentation of what is likely to occur.
• LEAF methods have broad applicability across materials and enable one to compare:
— pH;— Liquid-to-solid (L/S) ratio; and— Particle size.
• LEAF results can be very useful when you gain economies of scale when analyzing wastemanagement and re-use options for large quantities of waste.
Susan Thorneloe provided background on the importance of establishing methods that provided a more accurate depiction of leaching based on a range of environmental conditions. There was a need to have a more holistic understanding of the impact of air pollution control technologies at coal-fired power plants to ensure pollutant transfers were not delayed or shifted from one media into another. Acros the U.S., coal-fired power plants were implementing wider spread use of air pollution control technology such as the use of selective catalytic reduction for post-combustion NOx removal, electrostatic precipitators or fabric filters for particulate capture, sorbent injection for increasing mercury control, and flue gas desulfurization or other scrubber technologies to reduce acidic gases in the stack emissions. When these pollutants are transferred from the air stack at coal-fired power plants to the fly ash and other air pollution control residues, the concern is whether the pollutants may be later released when the air pollution control residues are utilized for beneficial use or land disposed. [Thorneloe S.A., D.S. Kosson, F. Sanchez, A.C. Garrabrants and G. Helms (2010) “Evaluating the fate of metals in air pollution control residues from coal-fired power plants,” Environmental Science and Technology, 44, 7351-7356.]
•
• LEAF is a collection of:
— Four leaching methods;— Data management tools;— Geochemical speciation and mass transfer modeling;— Quality assurance/quality control; and
10
Workshop Report Presentations and Related Discussions
— Integrated leaching assessment approaches.
• LEAF is designed to identify characteristic leaching behaviors for a wide range of materialsand associated use and disposal scenarios to generate material- and site-specific sourceterms.
• LEAF is not a replacement for TCLP but instead is used when TCLP is not consideredapplicable or appropriate. Uses include:
— Assess materials for beneficial use;— Evaluate treatment effectiveness (equivalent treatment determination);— Characterize potential release from high-volume materials; and— Corrective action (remediation decisions).
• LEAF provides a source term for future modeling and facilitates comparing data acrossmaterials when using a common framework.
• LEAF includes data management tools to facilitate implementation, including:
— Spreadsheets to help manage data and pre-calculate required values (e.g., titration);— Form upload to the materials database; and— Software for processing and results visualization.
• Susan shared important lessons learned through the LEAF development, including:
— Modifications to Methods 1313 and 1316; Tolerance for contact time was added Requirement that pH values be measured within one hour after separation of solids
and liquids due to lack of buffering in aqueous samples
— Modifications to Data Templates; and Mandatory information is highlighted Instructions more closely follow method text
— Other Considerations. Calibration of pH meters should cover entire pH range to extent possible Reagents should be freshly prepared, stored in vessels of compatible materials (e.g.,
strong alkalis not be stored in borosilicate glass) Laboratories should establish a QC regimen to check the quality of reagent water
(method blanks are important)
• Susan discussed lessons learned from the validation effort and suggested the following:
— Engage laboratories and ensure they follow the instructions;— Brief participating laboratories through interactive webinars;— Walk participating laboratories step-by-step through the process;— Conduct methods training;— Conduct QA/QC; and— Ensure conformance to the method.
11
Workshop Report Presentations and Related Discussions
2.6 Existing Tools and Limitations to Address Leaching of Organic Species
Key points from Dr. David Kosson’s (Vanderbilt University) presentation:
• Dr. Kosson described the capabilities of existing leach test methods to measure factors thatimpact organic leaching.
• Dr. Kosson provided an overview of leaching control factors, including chemical factors andphysical factors, coupled with release mechanisms of wash off, dissolution and diffusion.
• The distinction between simulation-based and characterization-based leaching approacheswas discussed:
— Simulation-based Leaching Approaches: Designed to provide representative leachate under specified conditions, simulating
a specific field scenario Eluate concentration assumed to be leachate (source term) concentration Simple implementation (e.g., single-batch methods like TCLP or Synthetic
Precipitation Leaching Procedure [SPLP]) and interpretation (e.g., acceptancecriteria)
Limitations○ Lack of Representativeness of testing to actual disposal or use conditions○ Results cannot be extended to scenarios that differ from simulated conditions○ Basis for comparison of results from different materials is often unclear
— Characterization-based Leaching Approach: Evaluate intrinsic leaching parameters under broad range of conditions More complex; sometimes requiring multiple leaching tests Results can be used to conduct “what if” analyses of disposal or use scenarios Provides a common basis for comparison across materials and scenarios Materials testing databases allow for initial screening
• Dr. Kosson provided an overview of existing methods in practice and identified limitationsfor organic contaminants.
• LEAF methods were discussed, including the rationale and limitations for use with organics:
12
Workshop Report Presentations and Related Discussions
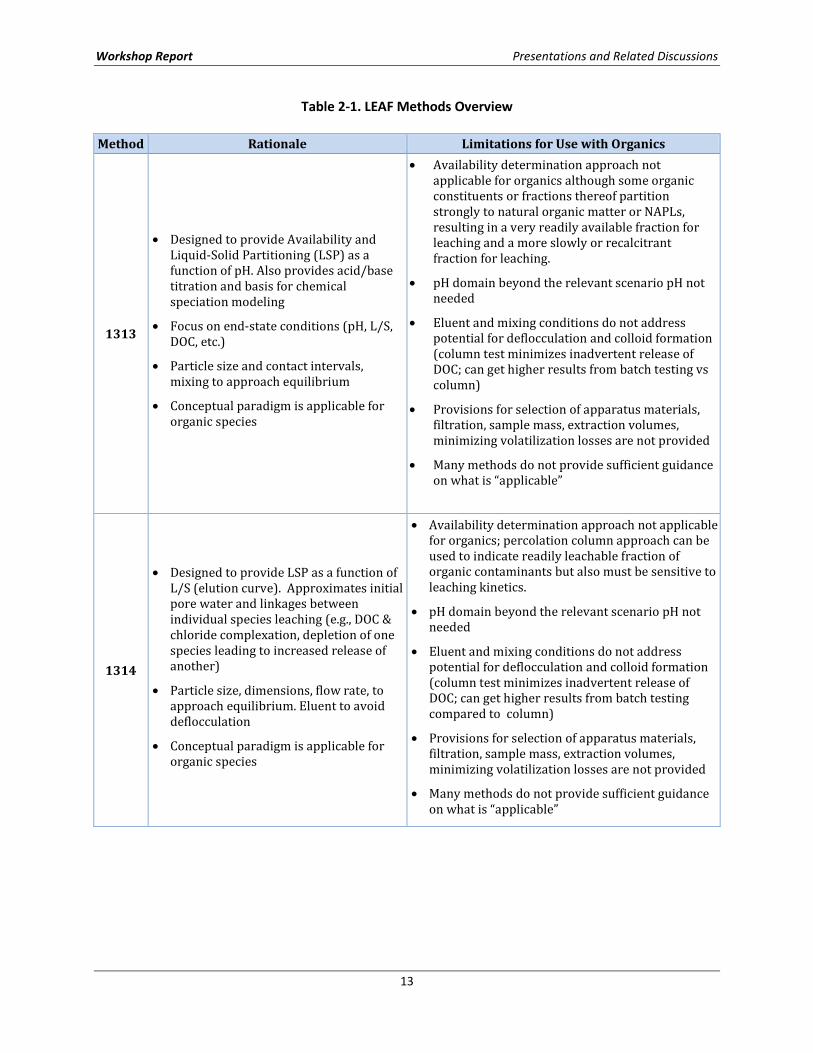
Table 2-1. LEAF Methods Overview
Method Rationale Limitations for Use with Organics
1313
• Designed to provide Availability andLiquid-Solid Partitioning (LSP) as afunction of pH. Also provides acid/basetitration and basis for chemicalspeciation modeling
• Focus on end-state conditions (pH, L/S,DOC, etc.)
• Particle size and contact intervals,mixing to approach equilibrium
• Conceptual paradigm is applicable fororganic species
• Availability determination approach notapplicable for organics although some organicconstituents or fractions thereof partitionstrongly to natural organic matter or NAPLs,resulting in a very readily available fraction forleaching and a more slowly or recalcitrantfraction for leaching.
• pH domain beyond the relevant scenario pH notneeded
• Eluent and mixing conditions do not addresspotential for deflocculation and colloid formation(column test minimizes inadvertent release ofDOC; can get higher results from batch testing vscolumn)
• Provisions for selection of apparatus materials,filtration, sample mass, extraction volumes,minimizing volatilization losses are not provided
• Many methods do not provide sufficient guidanceon what is “applicable”
1314
• Designed to provide LSP as a function ofL/S (elution curve). Approximates initialpore water and linkages betweenindividual species leaching (e.g., DOC &chloride complexation, depletion of onespecies leading to increased release ofanother)
• Particle size, dimensions, flow rate, toapproach equilibrium. Eluent to avoiddeflocculation
• Conceptual paradigm is applicable fororganic species
• Availability determination approach not applicable for organics; percolation column approach can beused to indicate readily leachable fraction oforganic contaminants but also must be sensitive toleaching kinetics.
• pH domain beyond the relevant scenario pH notneeded
• Eluent and mixing conditions do not addresspotential for deflocculation and colloid formation(column test minimizes inadvertent release ofDOC; can get higher results from batch testingcompared to column)
• Provisions for selection of apparatus materials,filtration, sample mass, extraction volumes,minimizing volatilization losses are not provided
• Many methods do not provide sufficient guidanceon what is “applicable”
13
Workshop Report Presentations and Related Discussions
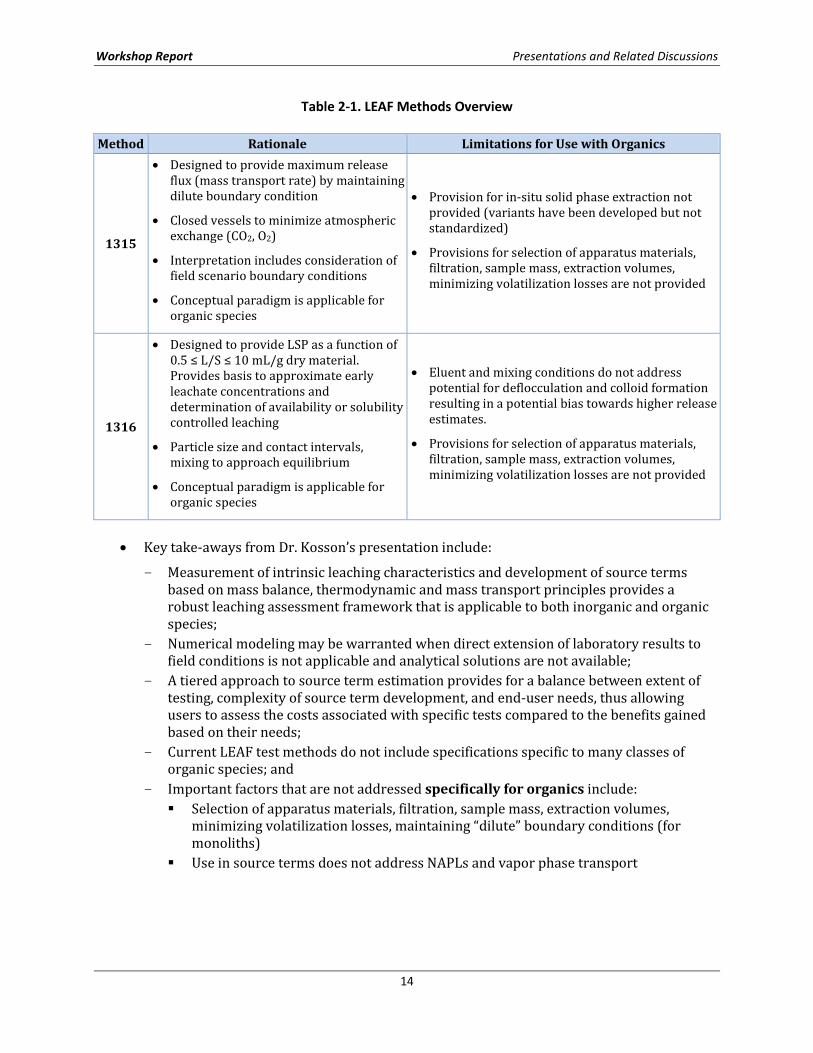
Table 2-1. LEAF Methods Overview
Method Rationale Limitations for Use with Organics
1315
• Designed to provide maximum releaseflux (mass transport rate) by maintainingdilute boundary condition
• Closed vessels to minimize atmosphericexchange (CO2, O2)
• Interpretation includes consideration offield scenario boundary conditions
• Conceptual paradigm is applicable fororganic species
• Provision for in-situ solid phase extraction notprovided (variants have been developed but notstandardized)
• Provisions for selection of apparatus materials,filtration, sample mass, extraction volumes,minimizing volatilization losses are not provided
1316
• Designed to provide LSP as a function of0.5 ≤ L/S ≤ 10 mL/g dry material.Provides basis to approximate earlyleachate concentrations anddetermination of availability or solubilitycontrolled leaching
• Particle size and contact intervals,mixing to approach equilibrium
• Conceptual paradigm is applicable fororganic species
• Eluent and mixing conditions do not addresspotential for deflocculation and colloid formationresulting in a potential bias towards higher releaseestimates.
• Provisions for selection of apparatus materials,filtration, sample mass, extraction volumes,minimizing volatilization losses are not provided
• Key take-aways from Dr. Kosson’s presentation include:
— Measurement of intrinsic leaching characteristics and development of source termsbased on mass balance, thermodynamic and mass transport principles provides a robust leaching assessment framework that is applicable to both inorganic and organic species;
— Numerical modeling may be warranted when direct extension of laboratory results tofield conditions is not applicable and analytical solutions are not available;
— A tiered approach to source term estimation provides for a balance between extent oftesting, complexity of source term development, and end-user needs, thus allowing users to assess the costs associated with specific tests compared to the benefits gained based on their needs;
— Current LEAF test methods do not include specifications specific to many classes oforganic species; and
— Important factors that are not addressed specifically for organics include: Selection of apparatus materials, filtration, sample mass, extraction volumes,
minimizing volatilization losses, maintaining “dilute” boundary conditions (for monoliths)
Use in source terms does not address NAPLs and vapor phase transport
14
Workshop Report Presentations and Related Discussions
Discussion
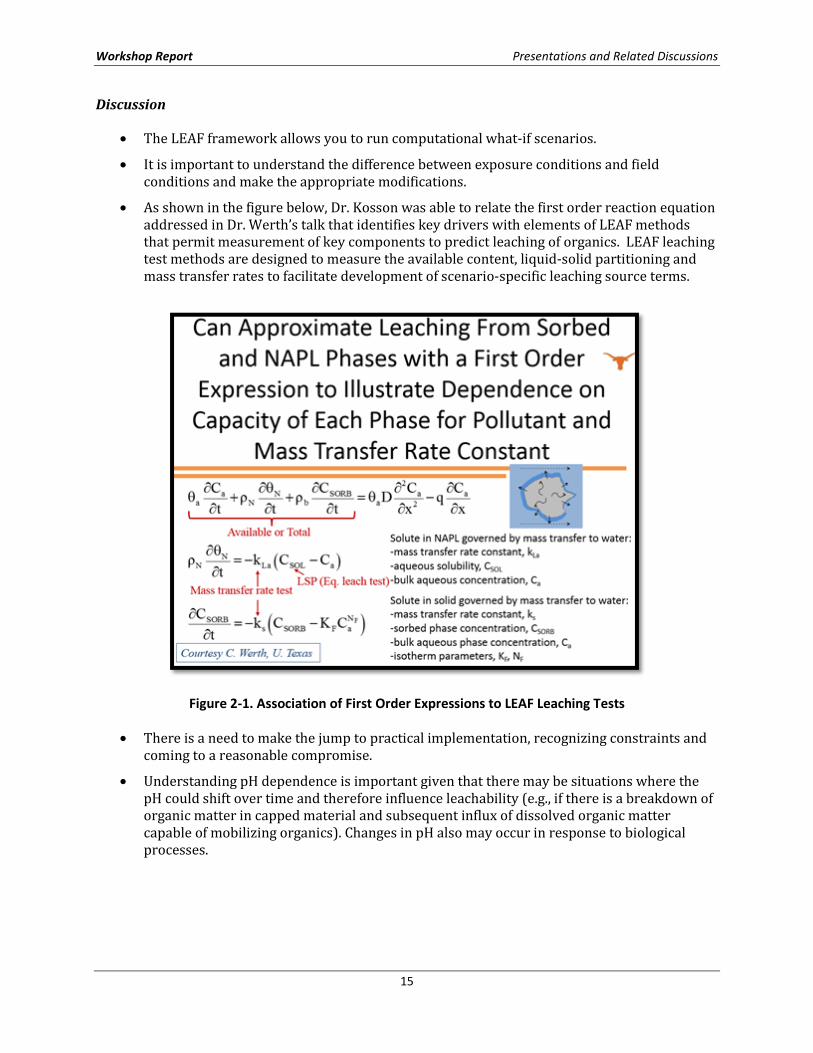
• The LEAF framework allows you to run computational what-if scenarios.
• It is important to understand the difference between exposure conditions and fieldconditions and make the appropriate modifications.
• As shown in the figure below, Dr. Kosson was able to relate the first order reaction equationaddressed in Dr. Werth’s talk that identifies key drivers with elements of LEAF methodsthat permit measurement of key components to predict leaching of organics. LEAF leachingtest methods are designed to measure the available content, liquid-solid partitioning andmass transfer rates to facilitate development of scenario-specific leaching source terms.
Figure 2-1. Association of First Order Expressions to LEAF Leaching Tests
• There is a need to make the jump to practical implementation, recognizing constraints andcoming to a reasonable compromise.
• Understanding pH dependence is important given that there may be situations where thepH could shift over time and therefore influence leachability (e.g., if there is a breakdown oforganic matter in capped material and subsequent influx of dissolved organic mattercapable of mobilizing organics). Changes in pH also may occur in response to biologicalprocesses.
15
Workshop Report Workshop Discussion
3. WORKSHOP DISCUSSION
Additional discussion followed the conclusion of presentations and continued through the morning of Day 2. Discussion topics are summarized below and are organized by related topics.
3.1 Key Parameters that Drive Organics Leaching
• In measuring organic leaching, two systems are in effect: 1) a percolation system and 2) adiffusion system.
• There are many factors to consider, not all of which are always a concern; therefore, there isa need to identify the most important factors.
• Participants described external field considerations to consider when designing an organicsleaching test:
— Presence of a discrete organic phase;— Presence of SVOCs and VOCs;— Physical form of the material;— Groundwater velocity;— Water quality/composition; DOC, which may vary seasonally Ionic strength pH
— Bioavailability of study material;— Depth to groundwater;— Temperature; Reasonably translating temperature fluctuations (laboratory vs. field) Controlled conditions
— Weathering may be a factor depending geographic location and whether waste islocated above freeze-thaw line; Diffusion Extent of mixing/homogeneity Durability testing Diffusion changes based on degradation in material Climate change factors, for example, seawater intrusion
— Sampling to control microbial variables; Representative and compositing sample collection; and Consider whether remediation treatment itself could affect other areas of site (e.g.,
by changing the pH or adding DOC).
• Participants described analytical parameters that impact leaching of organic constituents:
— pH;— Temperature;— Physical size and form of the material (granular or monolithic), which affects mass
transport distances; — L/S or water contact time, velocity, and volume;
16
Workshop Report Workshop Discussion
— Composition of water used in testing; Ionic strength DOC
— Test type: batch, column, or monolith;— Laboratory equipment compatibility and degradation (steel, coated glass, maybe
Teflon); Scale of apparatus Preservation to prevent degradation
— Local equilibrium;— Eluate composition;— Age of sample; 90 day maximum age
— Scale of apparatus;— Laboratory equipment suitable for testing organics;— Testing over time, to capture constituents that increase in solubility over time; Design the leaching test to inform the decision maker about whether
solidification/stabilization is an appropriate treatment — Location of material relative to boundary; and— Comparability of leaching test result with the analogous analytical test method (solid
extraction).
• Other potentially problematic or confounding leaching factors include:
— Reducing conditions cause chlorinated compounds to leach first;— Treatment may change diffusion behavior; and— Oily wastes present a challenge to evaluate because of physical constraints of the testing
equipment and difficulties in interpreting the results.
3.2 Important Considerations for Methods Development
• Through the presentations, participants gained a better understanding about thefundamental mechanisms that affect the release of organics. The challenge now is to identifykey drivers, balancing practicality and costs, while remaining scientifically defensible. Aframework considering a phased or tiered approach may be appropriate to handle a broadrange of waste materials.
• Participants expressed a desire to simplify the system, identify key parameters, andtranslate components into a first order reaction.
• The following questions are important to consider related to implementing an evaluation-based approach using both modeling and testing:
— How much modeling?— How much leach testing?— Are we addressing materials evaluation?— Can modeling to isolate variability be developed?
• A participant noted that if a batch equilibrium test was conducted, one could run the testwhere the concentration in water was close to zero to permit the calculation of maximumflux out when the driving force concentration is known. One can relate max flux out to
17
Workshop Report Workshop Discussion
calculate water out (percolation rate) to compare against a maximum contaminant level (MCL) (by transforming the first order rate equation to solve for MCL).
— Only the bulk measurement is needed to understand the percolation rate
• A step function could be an input for comparative assessment (i.e., current state, remediatedstate or measure of treatment effectiveness).
• The difference of results between batch and flow-through systems was discussed and whento use each.
— Column tests provide a practical dilution curve— Batch tests provide an indication for bounding modeling conditions and provide a worst
case scenario where if concentrations are below regulatory thresholds there is no need to test further
• The following issues are related to organic leaching and leach testing:
— Mobility of NAPL— Impact of mixing— Durability of treatment technology— Effective compliance monitoring at sites to assess treatment effectiveness— Quality assurance and quality control protocols to measure whether what was built was
as designed — Performance specifications for ISS— Uniformity of solidification/stabilization amendment mixing)
• Other considerations related to test specifications:
— An opportunity exists to modify existing methods to address material and head spacerequirements to meet the needs for both inorganic and organic substances whereby a single method could exist that addresses any required protocol deviations that may be substance-specific
— Requirements for leaching tests and analytical techniques can be collectively addressedif a larger system is designed or a wider column is used
— Cleanup levels with very low detection levels will require large volumes of wastematerial to adequately assess
— In partitioning testing, it may be necessary to measure DOC in solid and aqueous phaseas DOC will vary in different environments
— If material contains a high levels of DOC (e.g., from natural organic matter), testingresults will likely result in increases in mobility of organic compounds.
3.3 Considerations Related to Source Materials and Constituents of Concern
• Participants discussed how NAPLs will initially dominate phases, followed by partitioningenvironments, and then adsorption environments.
— It is possible to flush the system or conduct an extraction to isolate NAPL and thenseparate from what is sorbed to understand the capacity of the fraction; otherwise, another approach is to use the total mass
18
Workshop Report Workshop Discussion
— If the fraction capacity is known, how fast the NAPL is flushed would indicate the masstransfer rate
— The mass transfer rate could then be parameterized for a leaching test— MCL could be used with known volume of water to back calculate representative
velocity – Representative velocity is the ratio of mass that comes out in a certain volume of water to predict retention time
• With regards to NAPL leaching:
— A batch equilibrium test would evaluate mass transfer, and provide an upper limit(worst case)
— A column test with pulverized material would estimate flux from stabilized material
• EPA presented preliminary data for organic contaminant groups found at Superfund sites tointroduce the discussion of disposal scenarios and wastes that may require leaching testingfor organics. Based on an analysis of Superfund decision documents (e.g., Records ofDecision, Amended Records of Decision), both volatile and semi-volatile organiccontaminants are common at Superfund sites. For example:
— Halogenated volatile organic compounds (primarily chlorinated VOCs) arecontaminants of concern (COCs) at approximately 70 percent of these sites
— PAHs are COCs at half of the sites, and other semi-volatile organic (e.g.,pesticides/herbicides, polychlorinated biphenyl (PCBs) are also common
— Based on four recent years (Fiscal Years 2009-2012), 18 decision documents include asolidification/stabilization remedy for organic contaminants. Of these, about half have or may have NAPLs, and about half are using solidification/stabilization as a pretreatment prior to offsite disposal
— Common contaminant distinguishing characteristics include: Polarity Hydrophobicity Non-Ionic Ionic (not likely a problem but pH can become an issue)
— Priority organics of concern include: Organo-metallic compounds Combined contaminants Mercury
• The 40 constituents regulated in the 1990 Toxicity Characteristic (TC) Rule may be a goodstarting point for organic constituents for which to consider testing. Note that the TC Rulewas developed at a time when MSW landfills did not have liners and many industries oftoday did not exist; therefore, some of the underlying assumptions are dated.
— Could initially consider the basic parameters that govern the release of the majority oforganic contaminants and situations, recognizing there will be exceptions, and then design a flexible system that can accommodate most constituents and matrices
• Some organic contaminants are recalcitrant, transform in the environment, and are toxic atlow levels; the potential occurrence and toxicity of daughter products is also a concern, aswell as preventing them from mobilizing into groundwater.
19
Workshop Report Workshop Discussion
• Participants briefly discussed scenarios where leaching of organics may be of concern:
— Leaching related to industrial waste is the focus EPA’s Resource Conservation andRecovery Act (RCRA) program
— Waste pharmaceuticals (expired products) management was mentioned, but workshopparticipants noted direct exposure is also a concern in addition to leaching
— The need to identify specific examples of scenarios that may be most problematic forleaching was discussed
— From an EU perspective, a lesson learned was to develop methods based on the materialrather than the application to reduce the number of duplicative test methods
• Participants discussed scenarios where leach tests would be needed:
— For Superfund, EPA is managing old contaminated sites— For RCRA, EPA is dealing with newly generated waste. Focus is primarily on the existing
list of approximately 40 constituents listed in the regulation, but also dealing with industries that did not exist at the time of regulation. The primary focus is on industrial waste
• Could consider worst case scenarios (e.g., weathering scenario that includes degraded[crumbled] source material) from a chemical and physical stability perspective whendesigning leaching tests to account for a wide range of external conditions to ensure testresults reflect worst case conditions.
• Concrete is another example of a material that often cracks under external conditions andmay be best represented by a monolithic sample in the laboratory, rather than a pulverizedsample. The movement of constituents through concrete depends on the movement ofwater by gravity and interconnectedness of cracks.
• Regarding representative site samples, Dr. van der Sloot indicated that research from aheterogeneous MSW landfill site showed that the composition of the leachate was ratherhomogeneous and consistent throughout the face of excavation.
• Testing a composite sample by the full tests in conjunction with single step tests (own pHbatch) on spatially distributed samples can be used to place site-wide variability inperspective to the more detailed information provided by the full testing of a compositesample. This approach provides for detailed information at reasonable cost.
• Laboratory quality assurance and quality control procedures, including sample preparationtechniques and separation procedures, are important.
• Conducting training and outreach (e.g., through webinars) for both policymakers, regulatorsand laboratories could improve stakeholders’ understanding of the factors that affectorganics leaching and important nuances related to conducting leaching tests.
3.4 Applicability of LEAF Methods
• Participants reiterated that a leaching framework is a scientific evaluative tool that providesmore accurate characterization of leaching that can be considered within a regulatorydecision framework.
20
Workshop Report Workshop Discussion
• It is important to consider the purpose of the leaching test (define how the data will beused), desired testing output, and define a decision pathway such as an elution curve, L/Sequilibrium, mass transfer, or NAPL concentration.
• The LEAF How-to Guide that is currently being developed for inorganic constituentsdescribes the suite of tests, the use of simplified screening level testing, as well as moredetailed characterization to compare results to known thresholds. The document offersguidance on how to select the appropriate test for the material of interest. LEAF methodscan be useful for evaluating multiple inorganic contaminants with unknown releasepotential.
• Suggested applications of a leaching test framework at waste cleanup sites included:
— To estimate contribution of a source material to mass flux and transport, givenheterogeneous distribution of contaminants often seen at contaminated sites;
— To support treatability studies and provide insight on the best combination of remedialtechnology to use; and
— To support performance monitoring.
• A leaching test framework could be useful to make a “go” or “no go” decision for whether toapply stabilization treatment.
— Leaching test methods may be used to estimate release rate at the physical boundary ofthe treated/stabilized waste as an indicator of performance
• Participants were reminded that leaching test methods evaluate the leaching potential ofthe source material; leach test results are then used in fate and transport modeling topredict future groundwater concentrations.
• The LEAF testing methods are basic scientific tools that offer results that can then beevaluated within the context of a specific scenario. The existing LEAF frameworkestablished for inorganic contaminants is flexible enough that the specific context of thewaste material can be considered after generating test results. This logic is in contrast toTCLP where the context of the waste material is considered prior to testing.
• Participants discussed how to evaluate whether methods adequately predict leaching. Dr.van der Sloot noted that the EU does not currently have data on organics to compare whatwas predicted through testing and modeling to what was observed in the field, but throughthe sustainable landfill project such data should be available in 2016.
— It would be best to integrate laboratory testing, modeling, and field results to assess theaccuracy of predictions based on laboratory data (analogous to the approaches taken for inorganic contaminants, e.g., Lab-to-Field study). No or very limited data is available today.
21

Workshop Report Workshop Discussion
22
Workshop Report Workshop Agenda
Appendix A
Workshop Agenda
A-1

Workshop Report Workshop Participants
A-2
Workshop Report Workshop Participants
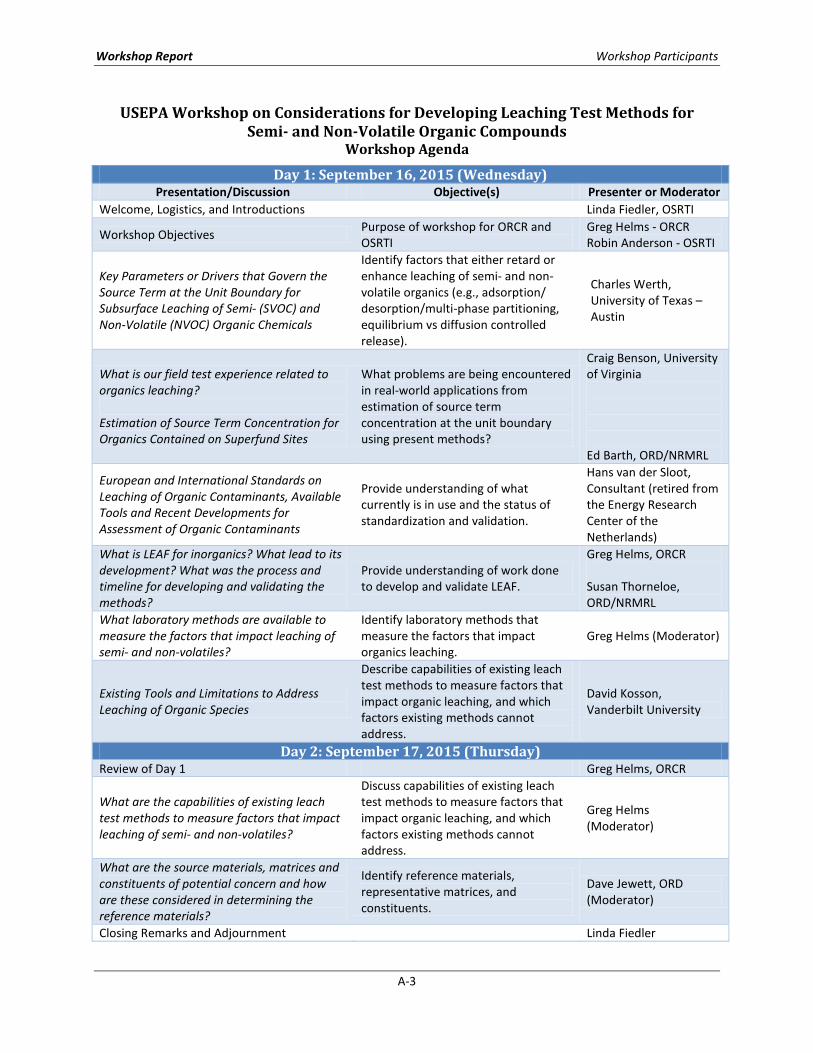
USEPA Workshop on Considerations for Developing Leaching Test Methods for Semi- and Non-Volatile Organic Compounds
Workshop Agenda
Day 1: September 16, 2015 (Wednesday) Presentation/Discussion Objective(s) Presenter or Moderator
Welcome, Logistics, and Introductions Linda Fiedler, OSRTI
Workshop Objectives Purpose of workshop for ORCR and OSRTI
Greg Helms - ORCR Robin Anderson - OSRTI
Key Parameters or Drivers that Govern the Source Term at the Unit Boundary for Subsurface Leaching of Semi- (SVOC) and Non-Volatile (NVOC) Organic Chemicals
Identify factors that either retard or enhance leaching of semi- and non-volatile organics (e.g., adsorption/ desorption/multi-phase partitioning, equilibrium vs diffusion controlled release).
Charles Werth, University of Texas – Austin
What is our field test experience related to organics leaching?
Estimation of Source Term Concentration for Organics Contained on Superfund Sites
What problems are being encountered in real-world applications from estimation of source term concentration at the unit boundary using present methods?
Craig Benson, University of Virginia
Ed Barth, ORD/NRMRL
European and International Standards on Leaching of Organic Contaminants, Available Tools and Recent Developments for Assessment of Organic Contaminants
Provide understanding of what currently is in use and the status of standardization and validation.
Hans van der Sloot, Consultant (retired from the Energy Research Center of the Netherlands)
What is LEAF for inorganics? What lead to its development? What was the process and timeline for developing and validating the methods?
Provide understanding of work done to develop and validate LEAF.
Greg Helms, ORCR
Susan Thorneloe, ORD/NRMRL
What laboratory methods are available to measure the factors that impact leaching of semi- and non-volatiles?
Identify laboratory methods that measure the factors that impact organics leaching.
Greg Helms (Moderator)
Existing Tools and Limitations to Address Leaching of Organic Species
Describe capabilities of existing leach test methods to measure factors that impact organic leaching, and which factors existing methods cannot address.
David Kosson, Vanderbilt University
Day 2: September 17, 2015 (Thursday) Review of Day 1 Greg Helms, ORCR
What are the capabilities of existing leach test methods to measure factors that impact leaching of semi- and non-volatiles?
Discuss capabilities of existing leach test methods to measure factors that impact organic leaching, and which factors existing methods cannot address.
Greg Helms (Moderator)
What are the source materials, matrices and constituents of potential concern and how are these considered in determining the reference materials?
Identify reference materials, representative matrices, and constituents.
Dave Jewett, ORD (Moderator)
Closing Remarks and Adjournment Linda Fiedler
A-3
Workshop Report Workshop Participants
A-4
Workshop Report Workshop Participants
Appendix B
Workshop Participants
B-1

Workshop Report Workshop Participants
B-2
Workshop Report Workshop Participants
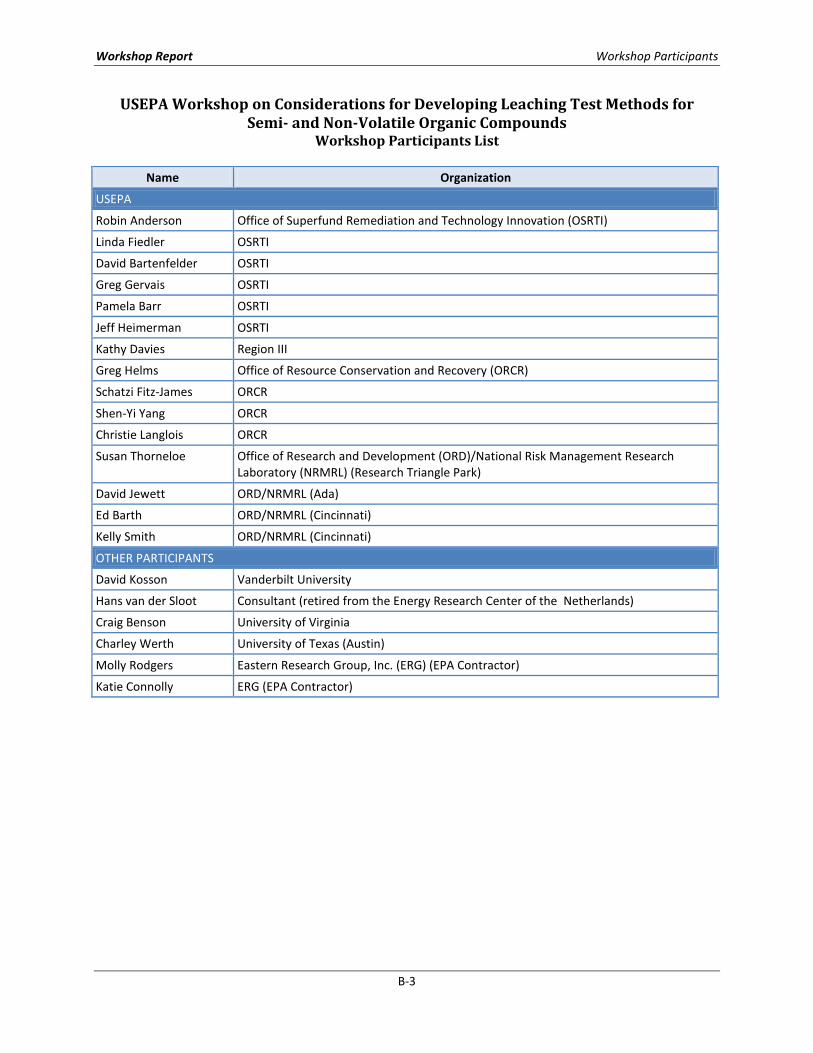
USEPA Workshop on Considerations for Developing Leaching Test Methods for Semi- and Non-Volatile Organic Compounds
Workshop Participants List
Name Organization
USEPA
Robin Anderson Office of Superfund Remediation and Technology Innovation (OSRTI)
Linda Fiedler OSRTI
David Bartenfelder OSRTI
Greg Gervais OSRTI
Pamela Barr OSRTI
Jeff Heimerman OSRTI
Kathy Davies Region III
Greg Helms Office of Resource Conservation and Recovery (ORCR)
Schatzi Fitz-James ORCR
Shen-Yi Yang ORCR
Christie Langlois ORCR
Susan Thorneloe Office of Research and Development (ORD)/National Risk Management Research Laboratory (NRMRL) (Research Triangle Park)
David Jewett ORD/NRMRL (Ada)
Ed Barth ORD/NRMRL (Cincinnati)
Kelly Smith ORD/NRMRL (Cincinnati)
OTHER PARTICIPANTS
David Kosson Vanderbilt University
Hans van der Sloot Consultant (retired from the Energy Research Center of the Netherlands)
Craig Benson University of Virginia
Charley Werth University of Texas (Austin)
Molly Rodgers Eastern Research Group, Inc. (ERG) (EPA Contractor)
Katie Connolly ERG (EPA Contractor)
B-3

Workshop Report Workshop Presentations
B-4
Workshop Report Workshop Presentations
Appendix C
Workshop Presentations
C-1

Workshop Report Workshop Presentations
C-2
Key�parameters�or�drivers�that�govern�the�source�term�at�the�unit�boundary�for�subsurface�leaching�of�semi� (SVOC)�and�non�volatile�(NVOC)�organic�
chemicals
Charles Werth
Civil, Architectural, and Environmental
Engineering
UT Austin
VOCs,�SVOCs�and�NVOCs�Are�in�Air,�Water,�Solid,�&�NonAqueous Liquid�
Phases
GEOSORBENT
WATER OR GAS IN MACROPORES
SOOT
Micropores
Mesopores
Mineral Phase
Water Film
Aged or Weathered NAPL
Clay Particles and/or Oxide Coatings
Dense SOM
Amorphous SOM
SOM
NAPL
Encapsulated Amorphous SOM
NAPL
Luthy et�al.,�ES&T,�1992
Solid�Phases�Include:1) Natural�
Components�of�Soils�and�Sediments
2) Sorption�Amendments�to�Sequester�Pollutants
3) Precipitates�that�Encapsulate�Pollutants
Leaching�is�Controlled�By�the�Capacity�of�the�Different�Phases�for�the�Organic�of�Interest,�and�the�Mass�Transfer�Rate�
from�Each�Phase
�a
�Ca
�t��N
��N
�t��b
�CSORB
�t� �aD
�2Ca
�x2�q
�Ca
�xSolute�
advection�in�leachate
Solute�dispersion/diffusion�in�leachate
Solute�accumulation�in�solids
Solute�accumulation�in�NAPL
Solute�accumulation�in�leachate
This�Can�Be�Expressed�Mathematically�By�the�Simplified�Expression�Below�For�Pollutant�Removal�Mechanisms�in�Leachate
Mass�Transfer�Between�Phases:
Mass�Transport�in�Water:
Can�Approximate�Leaching�From�Sorbedand�NAPL�Phases�with�a�First�Order�
Expression�to�Illustrate�Dependence�on�Capacity�of�Each�Phase�for�Pollutant�and�
Mass�Transfer�Rate�Constant
�a
�Ca
�t��N
��N
�t��b
�CSORB
�t� �aD
�2Ca
�x2� q
�Ca
�x
�N
��N
�t� �kLa CSOL �Ca�
�CSORB
�t� �ks CSORB �KFCa
NF�
Solute�in�NAPL�governed�by�mass�transfer�to�water:�mass�transfer�rate�constant,�kLa�aqueous�solubility,�CSOL�bulk�aqueous�concentration,�CaSolute�in�solid�governed�by�mass�transfer�to�water:�mass�transfer�rate�constant,�ks�sorbed phase�concentration,�CSORB�bulk�aqueous�phase�concentration,�Ca�isotherm�parameters,�KF,�NF
C-3
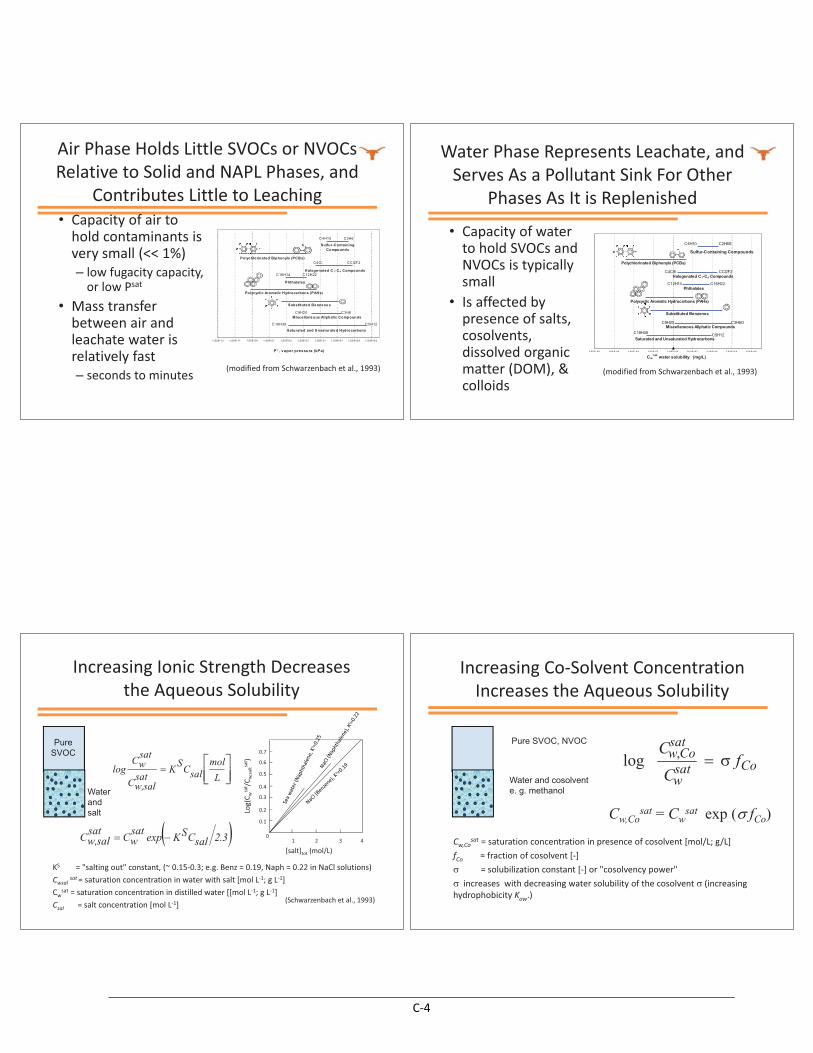
Air�Phase�Holds�Little�SVOCs�or�NVOCs�Relative�to�Solid�and�NAPL�Phases,�and�
Contributes�Little�to�Leaching• Capacity�of�air�to�hold�contaminants�is�very�small�(<<�1%)– low�fugacity�capacity,�or�low�Psat
• Mass�transfer�between�air�and�leachate�water�is�relatively�fast�– seconds�to�minutes�
1 ,00E-13 1,00E-11 1,00E-09 1,00E-07 1,00 E-0 5 1,00E-03 1,00E-01 1,00E+01 1,00 E+03 1,00E+0 5
P° , vapor pressure (kPa)
Saturated and Unsaturate d Hydrocarbons
Misce llane ous Aliphatic Compounds
Substituted Benzene s
Polycyclic Aromatic Hydrocarbons (PAHs)
Phthalates
Halogenated C 1-C4 Compounds
Polychlorinated Biphenyls (PCBs)
Sulfur-Containing Compounds
C18H38 C5H12
C9H20 C3H6
C4H10 C2H6
C4Cl CCl2F2
C16H14 C12H22
(modified�from�Schwarzenbach et�al.,�1993)
Water�Phase�Represents�Leachate,�and�Serves�As�a�Pollutant�Sink�For�Other�
Phases�As�It�is�Replenished
• Capacity�of�water�to�hold�SVOCs�and�NVOCs�is�typically�small�
• Is�affected�by�presence�of�salts,�cosolvents,�dissolved�organic�matter�(DOM),�&�colloids
1.0 0 E- 0 8 1. 0 0 E- 0 6 1.0 0 E- 0 4 1. 0 0 E- 0 2 1. 0 0 E+0 0 1.0 0 E+0 2 1. 0 0 E+0 4 1. 0 0 E+0 6 1. 0 0 E+0 8
Cwsat water solubility (mg/L)
Saturated and Unsaturated Hydrocarbons
Miscellaneous Aliphatic Compounds
Substituted Benzenes
Polycyclic Aromatic Hydrocarbons (PAHs)
Phthalates
Halogenated C1-C4 Compounds
Polychlorinated Biphenyls (PCBs)
Sulfur-Containing Compounds
C18H38 C5H12
C9H20O
C3H6O
C4H10 C2H6S
C4Cl6 CCl2F2
C12H14 C16H22
(modified�from�Schwarzenbach et�al.,�1993)
Increasing�Ionic�Strength�Decreases�the�Aqueous�Solubility
KS������������=�"salting�out"�constant, (~�0.15�0.3;�e.g.�Benz�=�0.19,�Naph =�0.22�in�NaCl solutions)Cwsal sat=�saturation�concentration�in�water�with�salt�[mol L�1;�g�L�1]Cwsat =�saturation�concentration�in�distilled�water�[[mol L�1;�g�L�1]Csal =�salt�concentration�[mol L�1]
��
���
L
molsalC
SK
satsal,wC
satwC
log
� 3.2salCSKexpsatwC
satsal,wC �� 1 2 3 4
0.1
0.2
0.3
0.4
0.5
0.6
0.7
0
[salt]tot (mol/L)
Log(C w
sat /C
w,saltsa
t )
(Schwarzenbach�et�al.,�1993)
PureSVOC
Waterandsalt
log ,C
Cfw Co
sat
wsat Co� �
Cw,Cosat =�saturation�concentration�in�presence�of�cosolvent�[mol/L;�g/L]fCo������������=�fraction�of�cosolvent�[�]� =�solubilization�constant�[�]�or�"cosolvency�power"� increases with�decreasing�water�solubility�of�the�cosolvent�� (increasing�hydrophobicity�Kow.)�
Pure SVOC, NVOC
Water and cosolvent e. g. methanol
Increasing�Co�Solvent�Concentration�Increases�the�Aqueous�Solubility
Cw,Cosat = Cw
sat exp (� fCo)
C-4

C
Cf K
w DOCsat
wsat DOC DOC
, � �1
Cw,DOCsat =�saturation�concentration�in�presence�of�DOC�[mol�L�1;�g�L�1]fDOC =�fraction�of�dissolved�organic�carbon�[kg�L�1]�(e.g.:�Humic�,�fulvic�acids,�surfactants)KDOC =�partitioning�coefficient�organic�carbon�/�water�(L�kg�1).�KDOC increases�with�decreasing�water�solubility�(increasing�Kow )�of�the�solute�and�increasing�hydrophobicity�or�molecular�weight�the�DOC�(KDOC � Kow )
Pure SVOC, NVOC
Water with DOC
Increasing�Dissolved�Organic�Matter�Concentration�Increases�the�Apparent�
Aqueous�Solubility
Cw,DOCsat = Cw
sat + Cwsat fDOCKDOC
• Leaching�capacity�of�soils�and�sediments�depends�on�soil/sediment�properties�and�chemical�properties
• Leaching�rate�depends�on�concentration�gradient�between�sorbed phase�and�water,�and�mass transfer�rate�constant �CSORB
�t� �ks CSORB �KFCa
NF�
Soils,��Sediments,�and�GeosorbentAmendments�Can�Sorb�Large�Amounts�of�VOCs,�SVOCs�and�NVOCs,�and�Slowly�
Release�Them
Equilibrium�Capacity�of�These�Solids�is�Determined�by�Composition
• There�are�both�absorption�(or�partitioning)�and�adsorption�environments�– Partitioning�environments
• Relatively�unweathered and/or�recent�soil�organic�matter
• Capacity�to�hold�contaminants�can�be�large,�and�depends�on�amount�of�this�organic�matter�
• Mass�transfer�from�this�soil�organic�matter�is�relatively�fast�(hours�to�days)�compared�to�soil�adsorption�environments
– Can�assume�equilibrium�partitioning�at�low�water�flow�rates– At�higher�water�flow�rates�can�approximate�as�first�order�
Capacity�of�Soil�Partitioning�Environment�for�Contaminants�Can�be�Estimated
• Relationship�between�concentrations�in�water�and�recent�soil�organic�matter�is�often�~linear– Kd =�Csorbed /�Cwater
• Kd can�be�directly�related�to�amount�of�organic�matter�and�hydrophobicity�of�chemical– Kd =�Koc *�foc– Where
• Koc ~�Kow
C-5
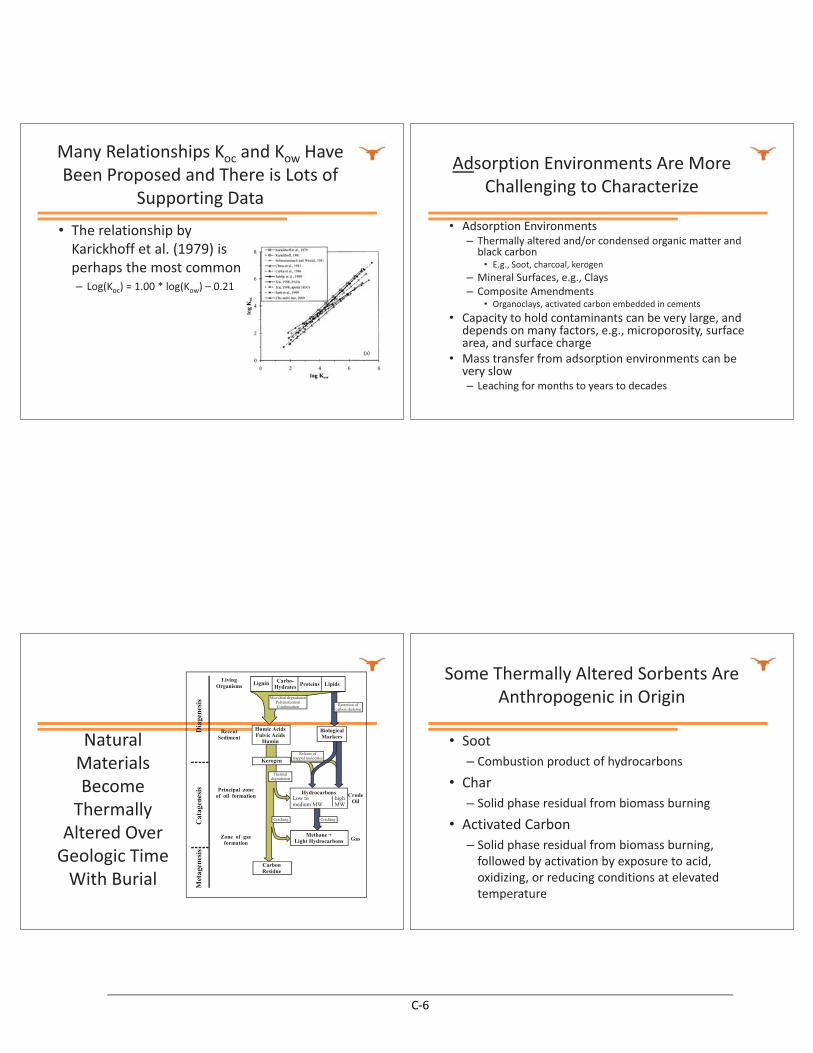
Many�Relationships�Koc and�Kow Have�Been�Proposed�and�There�is�Lots�of�
Supporting�Data
• The�relationship�by�Karickhoff et�al.�(1979)�is�perhaps�the�most�common– Log(Koc)�=�1.00�*�log(Kow)�– 0.21
Adsorption�Environments�Are�More�Challenging�to�Characterize
• Adsorption�Environments– Thermally�altered�and/or�condensed�organic�matter�and�black�carbon
• E.g.,�Soot,�charcoal,�kerogen– Mineral�Surfaces,�e.g.,�Clays– Composite�Amendments
• Organoclays,�activated�carbon�embedded�in�cements• Capacity�to�hold�contaminants�can�be�very�large,�and�depends�on�many�factors,�e.g.,�microporosity,�surface�area,�and�surface�charge
• Mass�transfer�from�adsorption�environments�can�be�very�slow– Leaching�for�months�to�years�to�decades
Natural�Materials�Become�Thermally�
Altered�Over�Geologic�Time�With�Burial
LivingOrganisms Lignin Carbo-
Hydrates Proteins Lipids
RecentSediment
Principal zoneof oil formation
Zone of gasformation
Humic AcidsFulvic Acids
Humin
BiologicalMarkers
Kerogen
CarbonResidue
Methane +Light Hydrocarbons Gas
CrudeOil
HydrocarbonsLow tomedium MW
highMW
Cracking Cracking
Thermaldegradation
Release oftrapped molecules
Retention ofcarbon skeleton
Microbial degradationPolymerizationCondensation
Dia
gene
sis
Cat
agen
esis
Met
agen
esis
Some�Thermally�Altered�Sorbents�Are�Anthropogenic�in�Origin
• Soot– Combustion�product�of�hydrocarbons
• Char– Solid�phase�residual�from�biomass�burning
• Activated�Carbon– Solid�phase�residual�from�biomass�burning,�followed�by�activation�by�exposure�to�acid,�oxidizing,�or�reducing�conditions�at�elevated�temperature
C-6
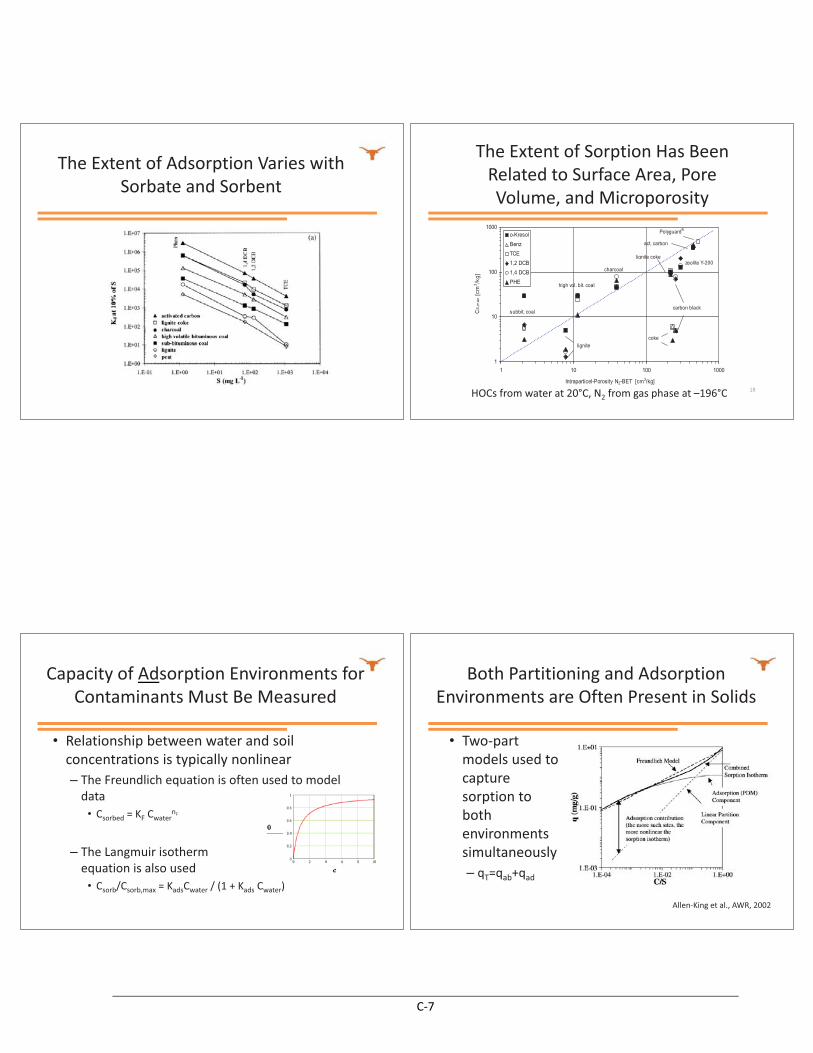
The�Extent�of�Adsorption�Varies�with�Sorbate and�Sorbent
18
The�Extent�of�Sorption�Has�Been�Related�to�Surface�Area,�Pore�Volume,�and�Microporosity
1
10
100
1000
1 10 100 1000
Intraparticel-Porosity N2-BET [cm3/kg]
CS
,max
[cm
3 /kg]
o-Kresol
Benz
TCE
1,2 DCB
1,4 DCB
PHE
subbit. coal
lignite
high vol. bit. coal
charcoal
lignite cokezeolite Y-200
act. carbon
PolyguardR
coke
carbon black
HOCs�from�water�at�20°C,�N2 from�gas�phase�at�–196°C
Capacity�of�Adsorption�Environments�for�Contaminants�Must�Be�Measured
• Relationship�between�water�and�soil�concentrations�is�typically�nonlinear– The�Freundlich equation�is�often�used�to�model�data
• Csorbed =�KF CwaternF
– The�Langmuir�isotherm�equation�is�also�used used
• Csorb/Csorb,max =�KadsCwater /�(1�+�Kads Cwater)
Both�Partitioning�and�Adsorption�Environments�are�Often�Present�in�Solids
• Two�part�models�used�to�capture�sorption�to�both�environments�simultaneously– qT=qab+qad
Allen�King�et�al.,�AWR,�2002
C-7
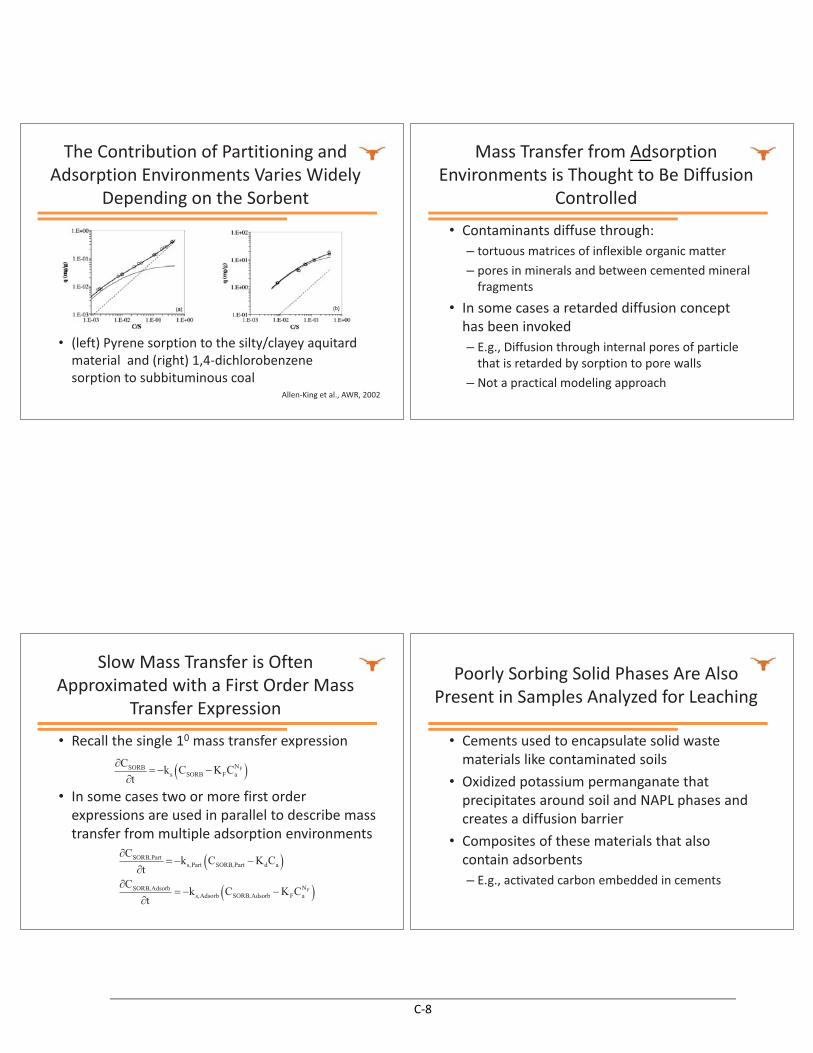
The�Contribution�of�Partitioning�and�Adsorption�Environments�Varies�Widely�
Depending�on�the�Sorbent
• (left)�Pyrene sorption�to�the�silty/clayey�aquitardmaterial��and�(right)�1,4�dichlorobenzene�sorption�to�subbituminous�coal
Allen�King�et�al.,�AWR,�2002
Mass�Transfer�from�Adsorption�Environments�is�Thought�to�Be�Diffusion�
Controlled
• Contaminants�diffuse�through:– tortuous�matrices�of�inflexible�organic�matter– pores�in�minerals�and�between�cemented�mineral�fragments
• In�some�cases�a�retarded�diffusion�concept�has�been�invoked– E.g.,�Diffusion�through�internal�pores�of�particle�that�is�retarded�by�sorption�to�pore�walls
– Not�a�practical�modeling�approach
Slow�Mass�Transfer�is�Often�Approximated�with�a�First�Order�Mass�
Transfer�Expression
• Recall�the�single�10 mass�transfer�expression
• In�some�cases�two�or�more�first�order�expressions�are�used�in�parallel�to�describe�mass�transfer�from�multiple�adsorption�environments
�CSORB
�t� �ks CSORB �KFCa
NF�
�CSORB,Part
�t� �ks,Part CSORB,Part �KdCa�
�CSORB,Adsorb
�t� �ks,Adsorb CSORB,Adsorb �KFCa
NF�
Poorly�Sorbing Solid�Phases�Are�Also�Present�in�Samples�Analyzed�for�Leaching
• Cements�used�to�encapsulate�solid�waste�materials�like�contaminated�soils
• Oxidized�potassium�permanganate�that�precipitates�around�soil�and�NAPL�phases�and�creates�a�diffusion�barrier
• Composites�of�these�materials�that�also�contain�adsorbents– E.g.,�activated�carbon�embedded�in�cements
C-8
Precipitates�Create�Serial�Barriers�to�Leaching
• Reduces�permeability�so�increases�diffusion�length�scale�in�stagnant�water
• Create�a�solid�barrier�that�only�allows�contaminant�release�through�hindered�diffusion– If�precipitates�contain�adsorbents,�then�have�retarded�diffusion
Contribution�of�Contaminants�Originally�in�Trapped�NAPL�to�Leachate�Can�Be�Large
• Can�be�a�pure�NAPL,�or�a�NAPL�mixture• Mass�transfer�is�typically�described�by�first�order�process
• Mass�transfer�from�NAPL�is�relatively�fast�compared�to�adsorption�environments– Can�be�limiting�if�diffusion�length�scales�through�low�permeability�zones�are�large�and�at�high�water�velocities
�N
��N
�t� �kLa CSOL �Ca�
�N
��N,i
�t� �kLa,i xiCSOL,i �Ca,i�
Pure�NAPL
NAPL�mixture,�xi=mole�fraction
Recall�the�Different�Phases�That�Contribute�to�Leaching
GEOSORBENT
WATER OR GAS IN MACROPORES
SOOT
Micropores
Mesopores
Mineral Phase
Water Film
Aged or Weathered NAPL
Clay Particles and/or Oxide Coatings
Dense SOM
Amorphous SOM
SOM
NAPL
Encapsulated Amorphous SOM
NAPL
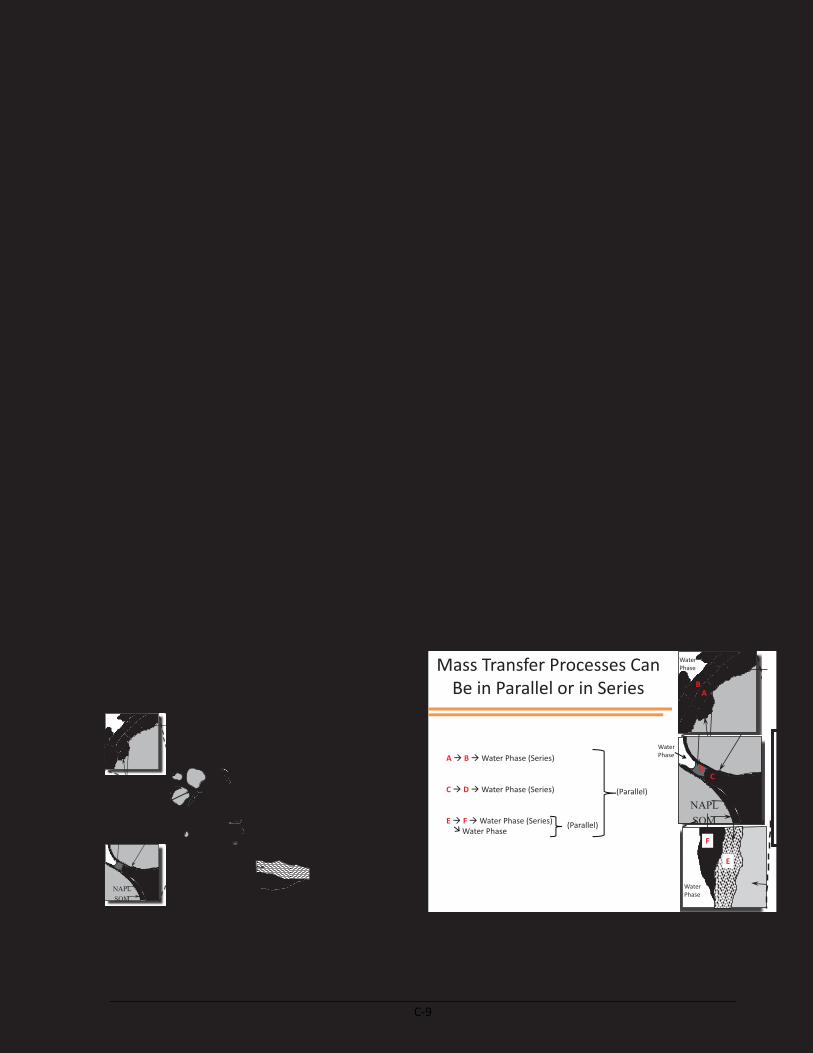
Mass�Transfer�Processes�Can�Be�in�Parallel�or�in�Series
SOM
NAPL
BA
D
F
E
A� B�Water�Phase�(Series)
C� D�Water�Phase�(Series)
E� F�Water�Phase�(Series)Water�Phase�
C
WaterPhase
WaterPhase
WaterPhase
(Parallel)
(Parallel)
C-2 C-2
C-9
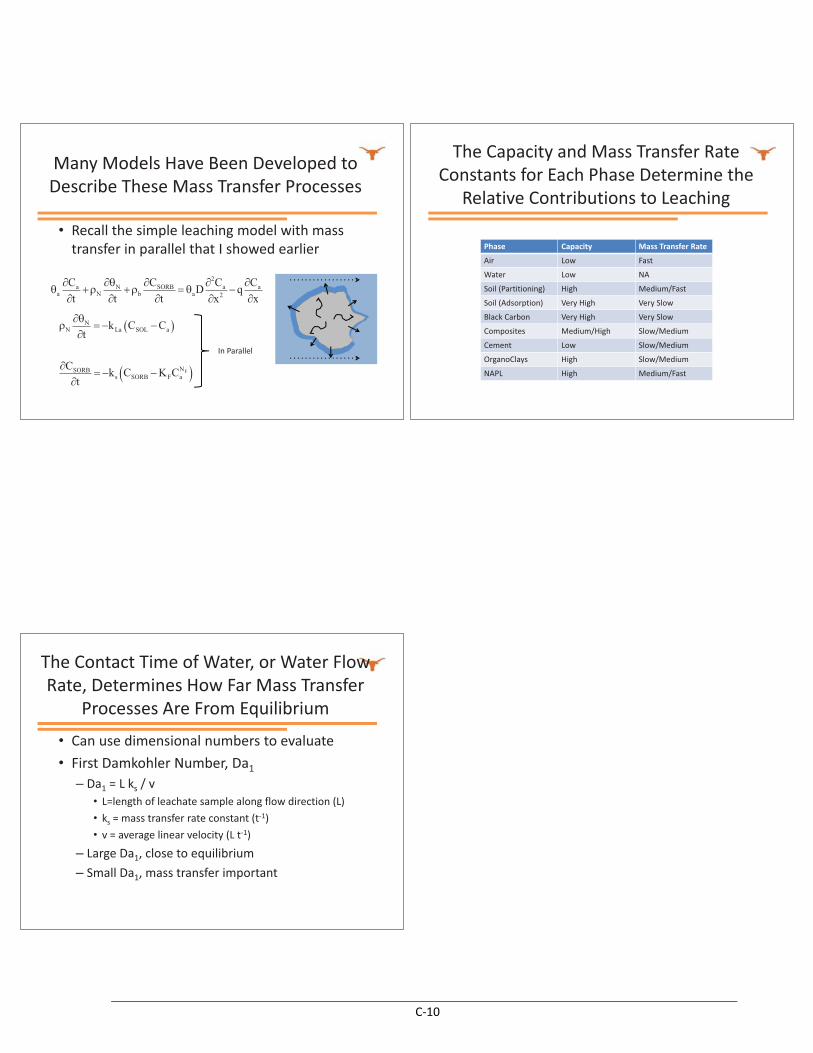
Many�Models�Have�Been�Developed�to�Describe�These�Mass�Transfer�Processes
• Recall�the�simple�leaching�model�with�mass�transfer�in�parallel�that�I�showed�earlier
�a
�Ca
�t��N
��N
�t��b
�CSORB
�t� �aD
�2Ca
�x2�q
�Ca
�x
�N
��N
�t� �kLa CSOL �Ca�
�CSORB
�t� �ks CSORB �KFCa
NF� In�Parallel
The�Capacity�and�Mass�Transfer�Rate�Constants�for�Each�Phase�Determine�the�
Relative�Contributions�to�Leaching
Phase Capacity Mass�Transfer�Rate
Air Low Fast
Water Low NA
Soil�(Partitioning) High Medium/Fast
Soil (Adsorption) Very�High Very�Slow
Black�Carbon Very�High Very�Slow
Composites Medium/High Slow/Medium
Cement Low Slow/Medium
OrganoClays High Slow/Medium
NAPL High Medium/Fast
The�Contact�Time�of�Water,�or�Water�Flow�Rate,�Determines�How�Far�Mass�Transfer�
Processes�Are�From�Equilibrium
• Can�use�dimensional�numbers�to�evaluate• First�Damkohler Number,�Da1
– Da1 =�L�ks /�v• L=length�of�leachate�sample�along�flow�direction�(L)• ks =�mass�transfer�rate�constant�(t�1)• v�=�average�linear�velocity�(L�t�1)
– Large�Da1,�close�to�equilibrium– Small�Da1,�mass�transfer�important�
C-10
Issues�with�Organic�Transport�in�Physical�Models�of�Barrier�Systems���
Craig�H.�Benson,�PhD,�PE,�NAESchool�of�Engineering�and�Applied�Science
University�of�[email protected]
Modern�Waste�Containment�Systems
1.
2. 3.
Highly�engineered�systems�that�are�protective�of�the�environment
Single Composite Liner Systems
• Synthetic�geomembrane�and�natural�clay�based�layer�work�synergistically�and�have�very�low�leakage�rates.
• Exceptionally�strong�track�record�for�wide�range�of�waste�streams�world�wide.
• Very�long�lifetimes�expected,�1000+�yr
C-11
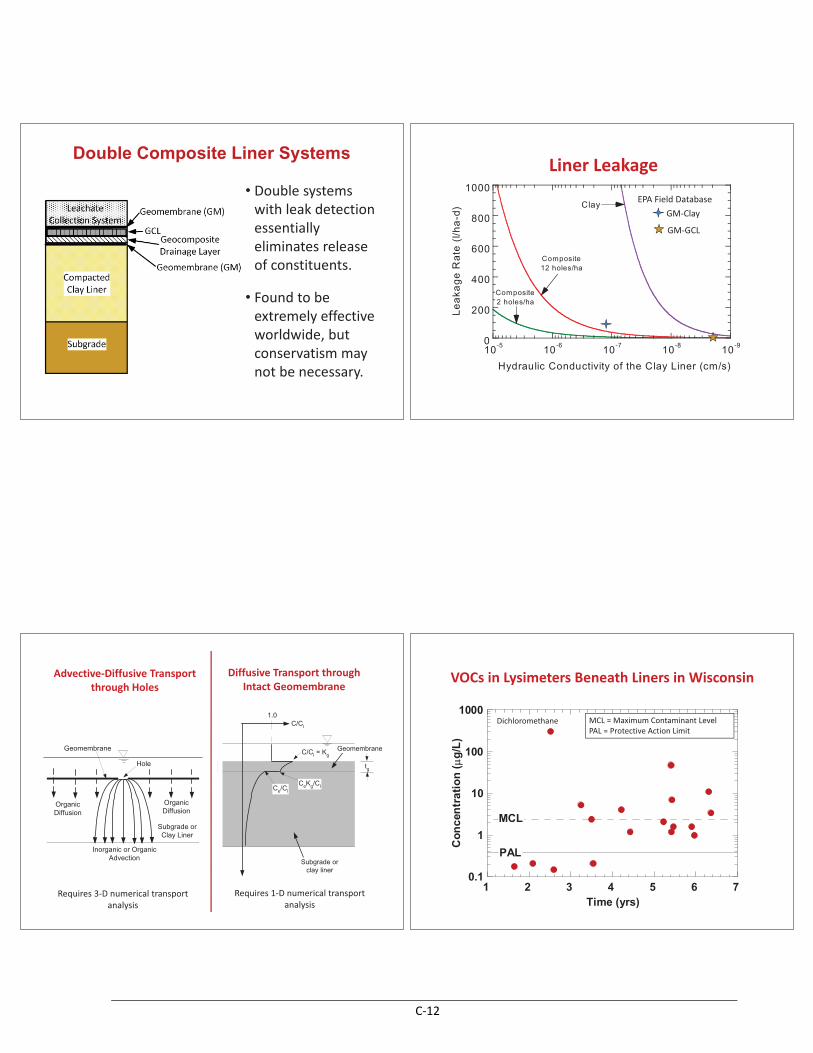
Double Composite Liner Systems
• Double�systems�with�leak�detection�essentially�eliminates�release�of�constituents.
• Found�to�be�extremely�effective�worldwide,�but�conservatism�may�not�be�necessary.
Liner�Leakage
0
200
400
600
800
1000
10-910-810-710-610-5
Le
aka
ge
Ra
te (
l/ha
-d)
Hydraulic Conductivity of the Clay Liner (cm/s)
Clay
Composite12 holes/ha
Composite2 holes/ha
EPA�Field�DatabaseGM�Clay
GM�GCL
Geomembrane
OrganicDiffusion
Inorganic or OrganicAdvection
Subgrade orClay Liner
OrganicDiffusion
Hole
C/Cl
1.0
C/Cl = Kg
Ce/Cl
CeKg/Cl
tg
Subgrade orclay liner
Geomembrane
Advective�Diffusive�Transport�through�Holes
Diffusive�Transport�through�Intact�Geomembrane
Requires�3�D�numerical�transport�analysis
Requires�1�D�numerical�transport�analysis
VOCs�in�Lysimeters�Beneath�Liners�in�Wisconsin
0.1
1
10
100
1000
1 2 3 4 5 6 7
(data from Benson and Edil 2005)
Con
cen
trat
ion
(�g
/L)
Time (yrs)
PAL
MCL
MCL�=�Maximum�Contaminant�LevelPAL�=�Protective�Action�Limit
Dichloromethane
C-12
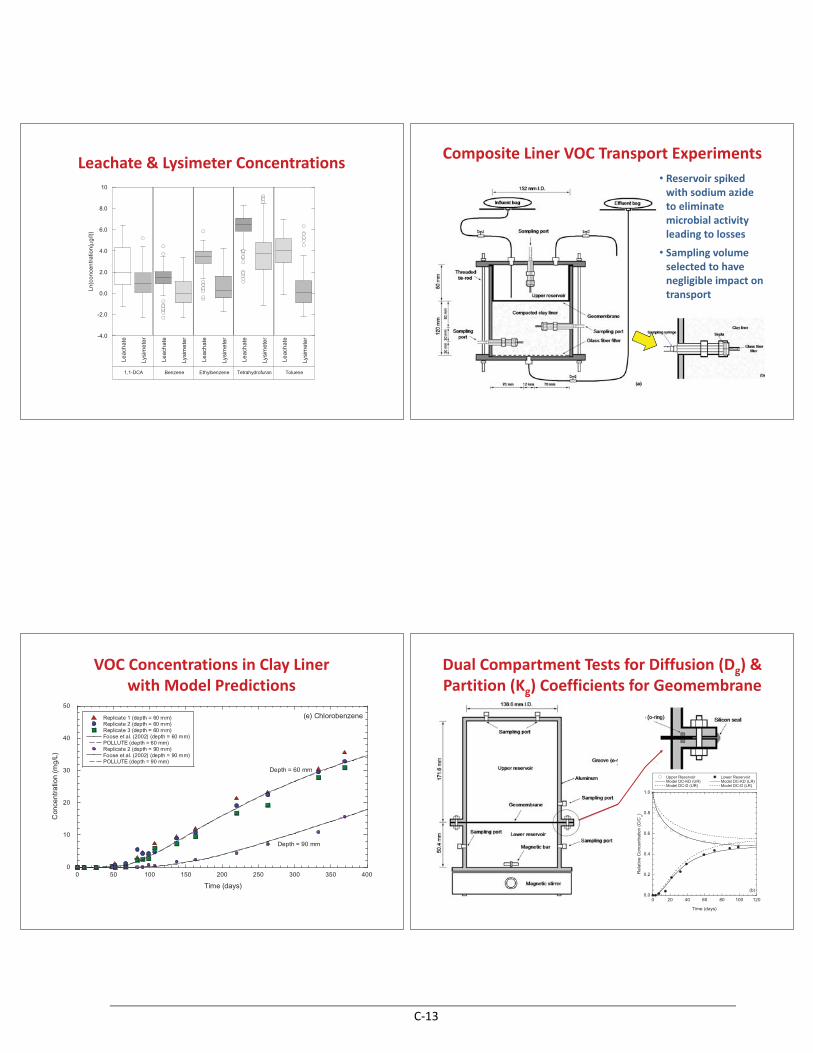
Leachate�&�Lysimeter�Concentrations
-4.0
-2.0
0.0
2.0
4.0
6.0
8.0
10
Leac
hate
Lysi
met
er
Leac
hat
e
Lysi
met
er
Leac
hat
e
Lysi
met
er
Leac
hat
e
Lysi
met
er
Leac
hate
Lysi
met
er
Ln(c
once
ntr
atio
n(�
g/l))
1,1-DCA Benzene Ethylbenzene Tetrahydrofuran Toluene
Composite�Liner�VOC�Transport�Experiments• Reservoir�spiked�with�sodium�azideto�eliminate�microbial�activity�leading�to�losses
• Sampling�volume�selected�to�have�negligible�impact�on�transport
0
10
20
30
40
50
0 50 100 150 200 250 300 350 400
Replicate 1 (depth = 60 mm)Replicate 2 (depth = 60 mm)Replicate 3 (depth = 60 mm)Foose et al. (2002) (depth = 60 mm)POLLUTE (depth = 60 mm)Replicate 2 (depth = 90 mm)Foose et al. (2002) (depth = 90 mm)POLLUTE (depth = 90 mm)
Time (days)
Con
cent
ratio
n (m
g/L)
(e) Chlorobenzene
Depth = 60 mm
Depth = 90 mm
VOC�Concentrations�in�Clay�Linerwith�Model�Predictions
Dual�Compartment�Tests�for�Diffusion�(Dg)�&�Partition�(Kg)�Coefficients�for�Geomembrane
0.0
0.2
0.4
0.6
0.8
1.0
0 20 40 60 80 100 120
Upper ReservoirModel DC-KD (UR)Model DC-D (UR)
Lower ReservoirModel DC-KD (LR)Model DC-D (LR)
Rel
ativ
e C
once
ntra
tion
(C/C
o)
Time (days)
(b)
C-13
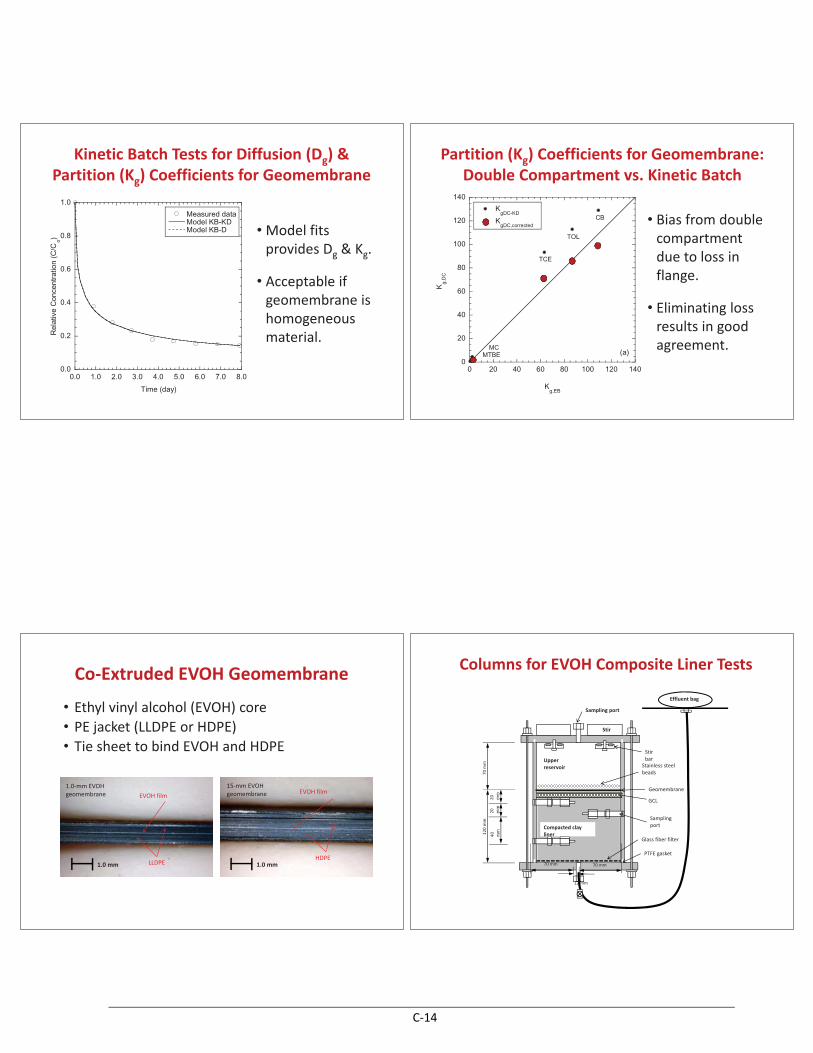
0.0
0.2
0.4
0.6
0.8
1.0
0.0 1.0 2.0 3.0 4.0 5.0 6.0 7.0 8.0
Measured dataModel KB-KDModel KB-D
Rel
ativ
e C
once
ntra
tion
(C/C
o)
Time (day)
Kinetic�Batch�Tests�for�Diffusion�(Dg)�&�Partition�(Kg)�Coefficients�for�Geomembrane
• Model�fits�provides�Dg &�Kg.
• Acceptable�if�geomembrane�is�homogeneous�material.
0
20
40
60
80
100
120
140
0 20 40 60 80 100 120 140
KgDC-KD
KgDC,corrected
Kg,EB
Kg,
DC
TCE
TOL
CB
MTBEMC
(a)
• Bias�from�double�compartment�due�to�loss�in�flange.
• Eliminating�loss�results�in�good�agreement.
Partition�(Kg)�Coefficients�for�Geomembrane:�Double�Compartment�vs.�Kinetic�Batch
• Ethyl�vinyl�alcohol�(EVOH)�core• PE�jacket�(LLDPE�or�HDPE)• Tie�sheet�to�bind�EVOH�and�HDPE
1.0�mm�EVOH�geomembrane EVOH�film�
1.0�mm� LLDPE
15�mm�EVOH�geomembrane EVOH�film�
1.0�mm�HDPE
Co�Extruded�EVOH�Geomembrane Columns�for�EVOH�Composite�Liner�Tests
Compacted�clay�liner�
Upper�reservoir
Sampling�port
Stir�bar
Stir
Stainless�steel������������beads
Geomembrane
Effluent�bag
70�m
m12
0�mm
40�
mm
20�
mm
20�
mm
Glass�fiber�filter
Sampling�port
PTFE�gasket
GCL
12�mm
70�mm 70�mm
C-14
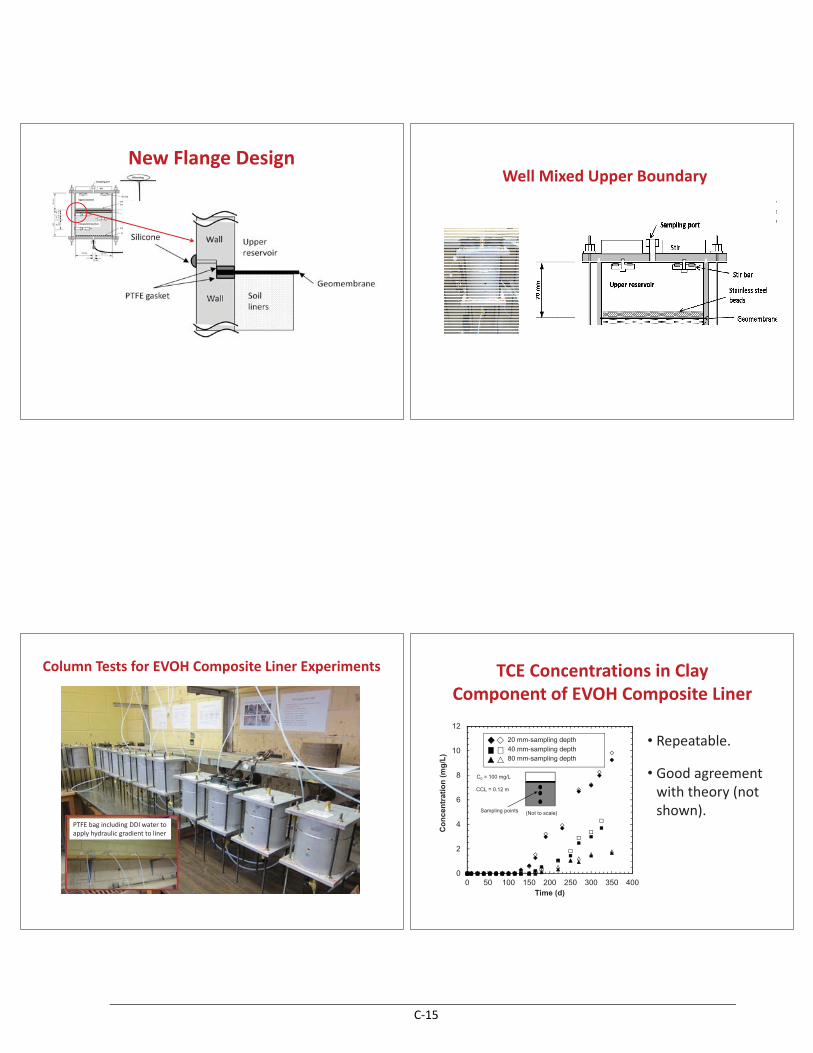
New�Flange�DesignWell�Mixed�Upper�Boundary
Column�Tests�for�EVOH�Composite�Liner�Experiments
PTFE�bag�including�DDI�water�to�apply�hydraulic�gradient�to�liner�
TCE�Concentrations�in�Clay�Component�of�EVOH�Composite�Liner�
0
2
4
6
8
10
12
0 50 100 150 200 250 300 350 400
Co
nce
ntr
atio
n (
mg
/L)
Time (d)
20 mm-sampling depth40 mm-sampling depth80 mm-sampling depth
C0 = 100 mg/L
CCL = 0.12 m
Sampling points (Not to scale)
• Repeatable.
• Good�agreement�with�theory�(not�shown).
C-15
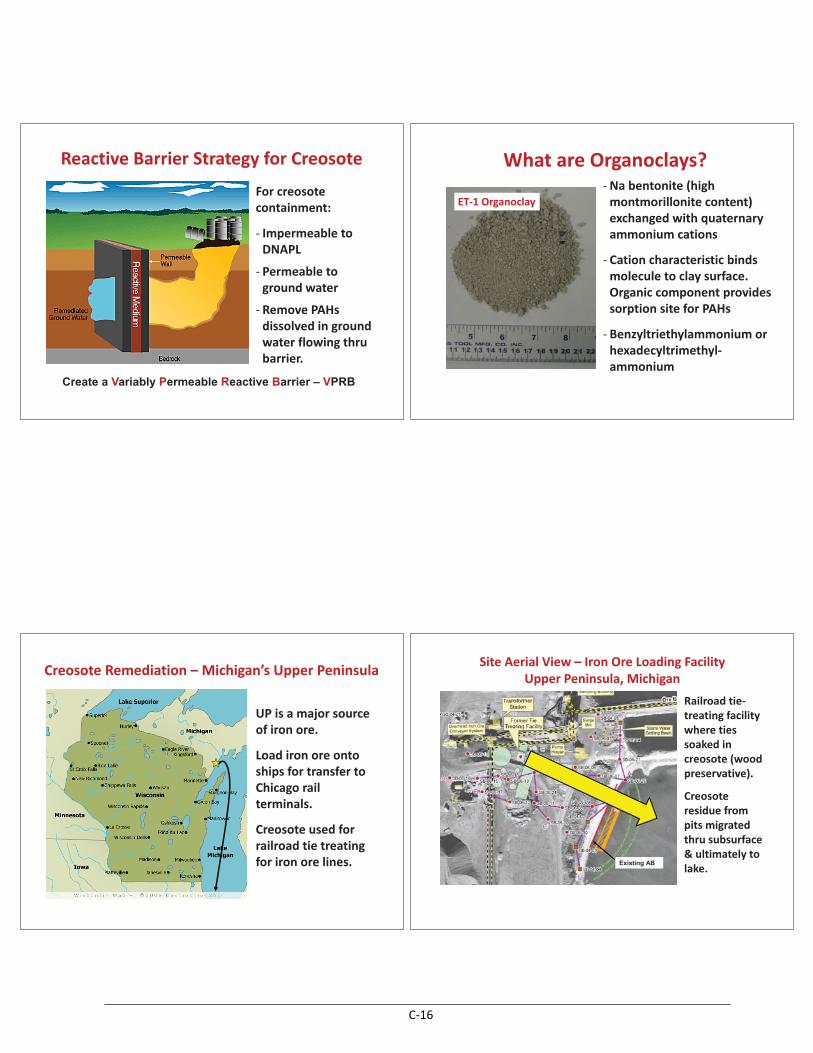
Reactive�Barrier�Strategy�for�Creosote
For�creosote�containment:
� Impermeable�to�DNAPL
� Permeable�to�ground�water
� Remove�PAHs�dissolved�in�ground�water�flowing�thru�barrier.
Create a Variably Permeable Reactive Barrier – VPRB
What�are�Organoclays?�Na�bentonite�(high�montmorillonite�content)�exchanged�with�quaternary�ammonium�cations
� Cation�characteristic�binds�molecule�to�clay�surface.��Organic�component�provides�sorption�site�for�PAHs
� Benzyltriethylammonium�or�hexadecyltrimethyl�ammonium
ET�1�Organoclay
Creosote�Remediation�– Michigan’s�Upper�Peninsula
UP�is�a�major�source�of�iron�ore.
Load�iron�ore�onto�ships�for�transfer�to�Chicago�rail�terminals.
Creosote�used�for�railroad�tie�treating�for�iron�ore�lines.
Site�Aerial�View�– Iron�Ore�Loading�FacilityUpper�Peninsula,�Michigan
Existing ABExisting AB
Railroad�tie�treating�facility�where�ties�soaked�in�creosote�(wood�preservative).
Creosote�residue�from�pits�migrated�thru�subsurface�&�ultimately�to�lake.
C-16
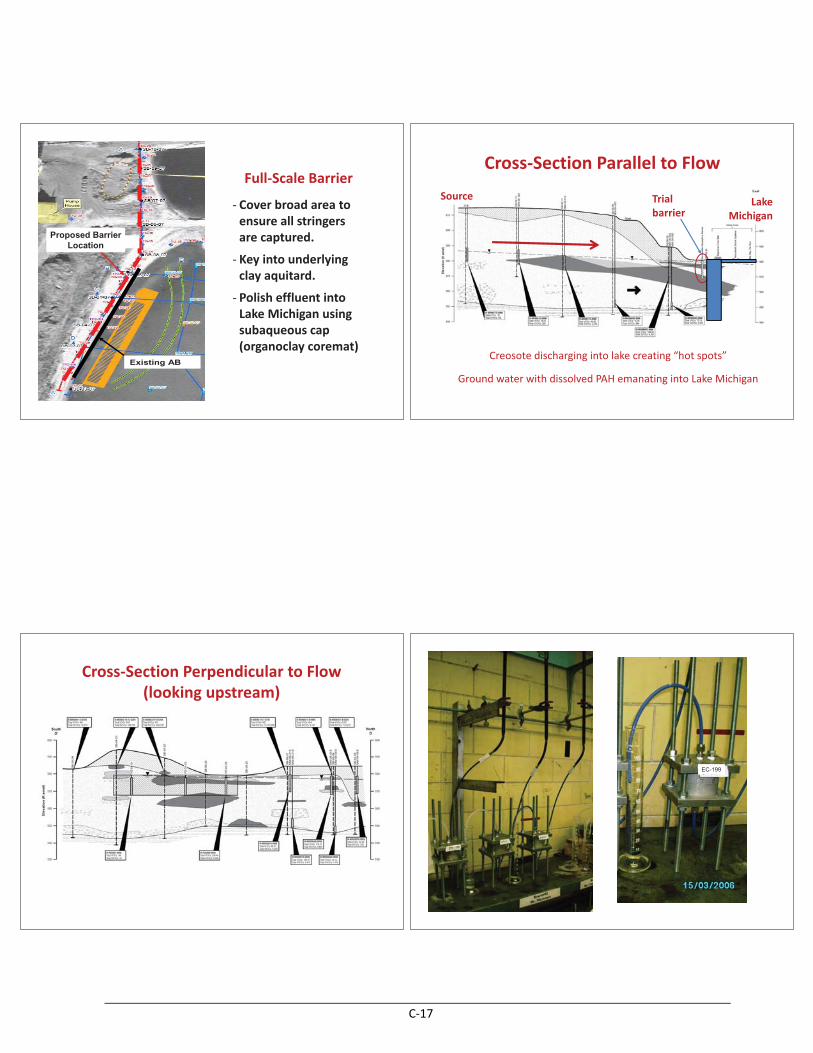
Existing AB
Hypothetical AB
Existing AB
Hypothetical AB
Existing AB
Hypothetical AB
Full�Scale�Barrier
� Cover�broad�area�to�ensure�all�stringers�are�captured.
� Key�into�underlying�clay�aquitard.
� Polish�effluent�into�Lake�Michigan�using�subaqueous�cap�(organoclay�coremat)
Proposed BarrierLocation
Cross�Section�Parallel�to�Flow
Source Lake�Michigan
Creosote�discharging�into�lake�creating�“hot�spots”
Ground�water�with�dissolved�PAH�emanating�into�Lake�Michigan
Trial�barrier
Cross�Section�Perpendicular�to�Flow�(looking�upstream)
EC-199
C-17
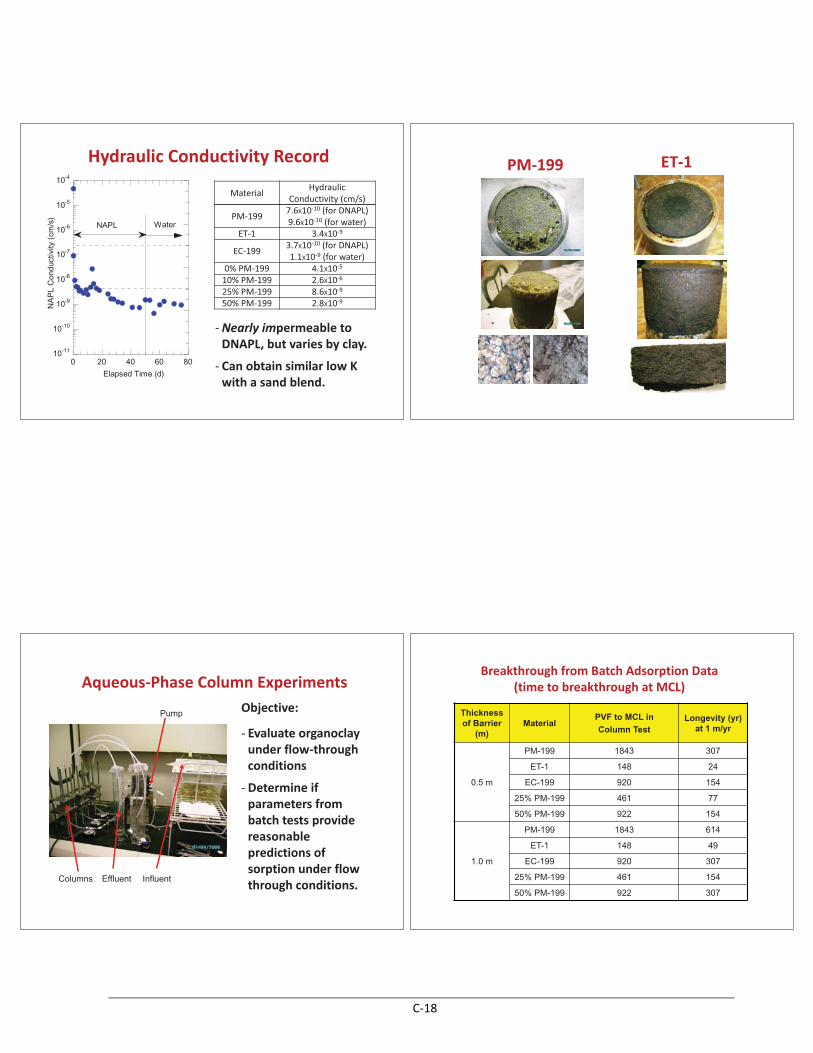
Hydraulic�Conductivity�Record
10-11
10-10
10-9
10-8
10-7
10-6
10-5
10-4
0 20 40 60 80
NA
PL
Con
duct
ivity
(cm
/s)
Elapsed Time (d)
WaterNAPL
Material HydraulicConductivity�(cm/s)
PM�199 7.6X10�10 (for�DNAPL)9.6X10�10 (for�water)
ET�1 3.4X10�9
EC�199 3.7X10�10 (for�DNAPL)1.1X10�9 (for�water)
0%�PM�199 4.1X10�510%�PM�199 2.6X10�625%�PM�199 8.6X10�950%�PM�199 2.8X10�9
�Nearly�impermeable�to�DNAPL,�but�varies�by�clay.
� Can�obtain�similar�low�K�with�a�sand�blend.
ET�1PM�199
Aqueous�Phase�Column�Experiments
Columns InfluentEffluent
Pump Objective:��
� Evaluate�organoclay�under�flow�through�conditions�
�Determine�if�parameters�from�batch�tests�provide�reasonable�predictions�of�sorption�under�flow�through�conditions.
Thicknessof Barrier
(m)Material
PVF to MCL in Column Test
Longevity (yr) at 1 m/yr
0.5 m
PM-199 1843 307
ET-1 148 24
EC-199 920 154
25% PM-199 461 77
50% PM-199 922 154
1.0 m
PM-199 1843 614
ET-1 148 49
EC-199 920 307
25% PM-199 461 154
50% PM-199 922 307
Breakthrough�from�Batch�Adsorption�Data(time�to�breakthrough�at�MCL)
C-18
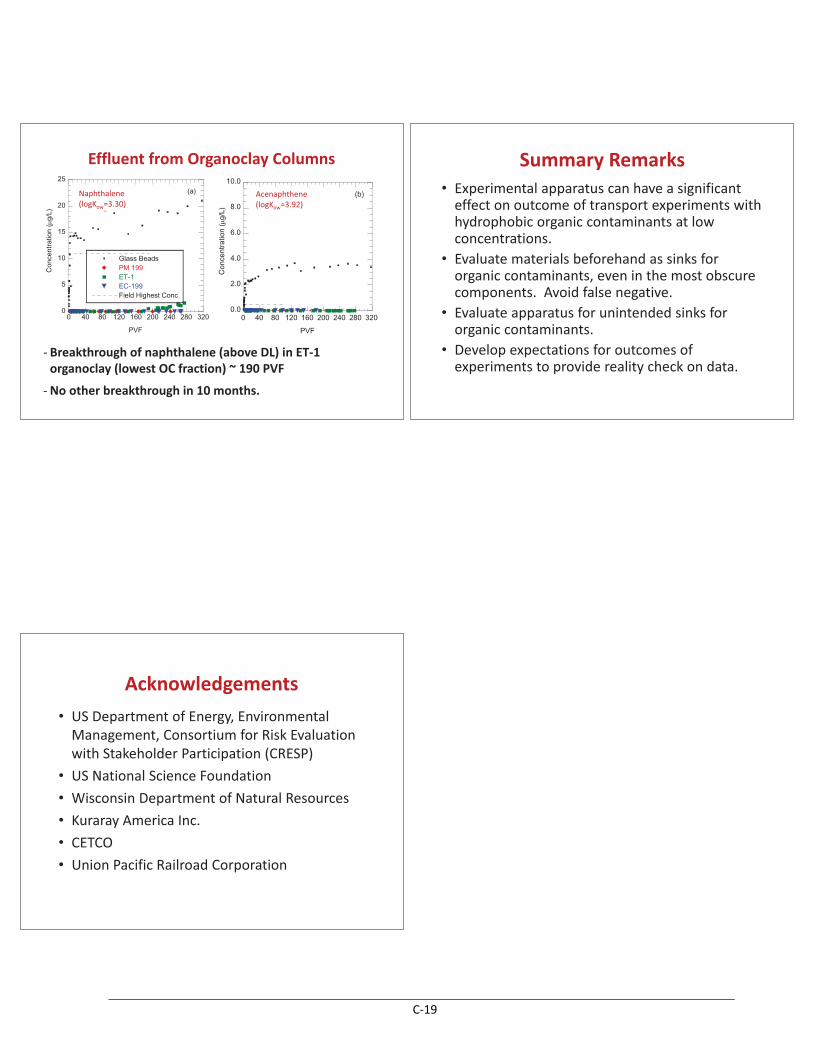
0
5
10
15
20
25
0 40 80 120 160 200 240 280 320
(a)
Glass BeadsPM 199ET-1EC-199Field Highest Conc.
Con
cent
ratio
n (�
g/L)
PVF
0.0
2.0
4.0
6.0
8.0
10.0
0 40 80 120 160 200 240 280 320
(b)
Con
cent
ratio
n (�
g/L)
PVF
Effluent�from�Organoclay�Columns
� Breakthrough�of�naphthalene�(above�DL)�in�ET�1�organoclay�(lowest�OC�fraction)�~�190�PVF
�No�other�breakthrough�in�10�months.
Naphthalene�(logKow=3.30)
Acenaphthene�(logKow=3.92)
• Experimental�apparatus�can�have�a�significant�effect�on�outcome�of�transport�experiments�with�hydrophobic�organic�contaminants�at�low�concentrations.
• Evaluate�materials�beforehand�as�sinks�for�organic�contaminants,�even�in�the�most�obscure�components.��Avoid�false�negative.
• Evaluate�apparatus�for�unintended�sinks�for�organic�contaminants.
• Develop�expectations�for�outcomes�of�experiments�to�provide�reality�check�on�data.
Summary�Remarks
Acknowledgements• US�Department�of�Energy,�Environmental�Management,�Consortium�for�Risk�Evaluation�with�Stakeholder�Participation�(CRESP)
• US�National�Science�Foundation• Wisconsin�Department�of�Natural�Resources• Kuraray�America�Inc.• CETCO• Union�Pacific�Railroad�Corporation
C-19
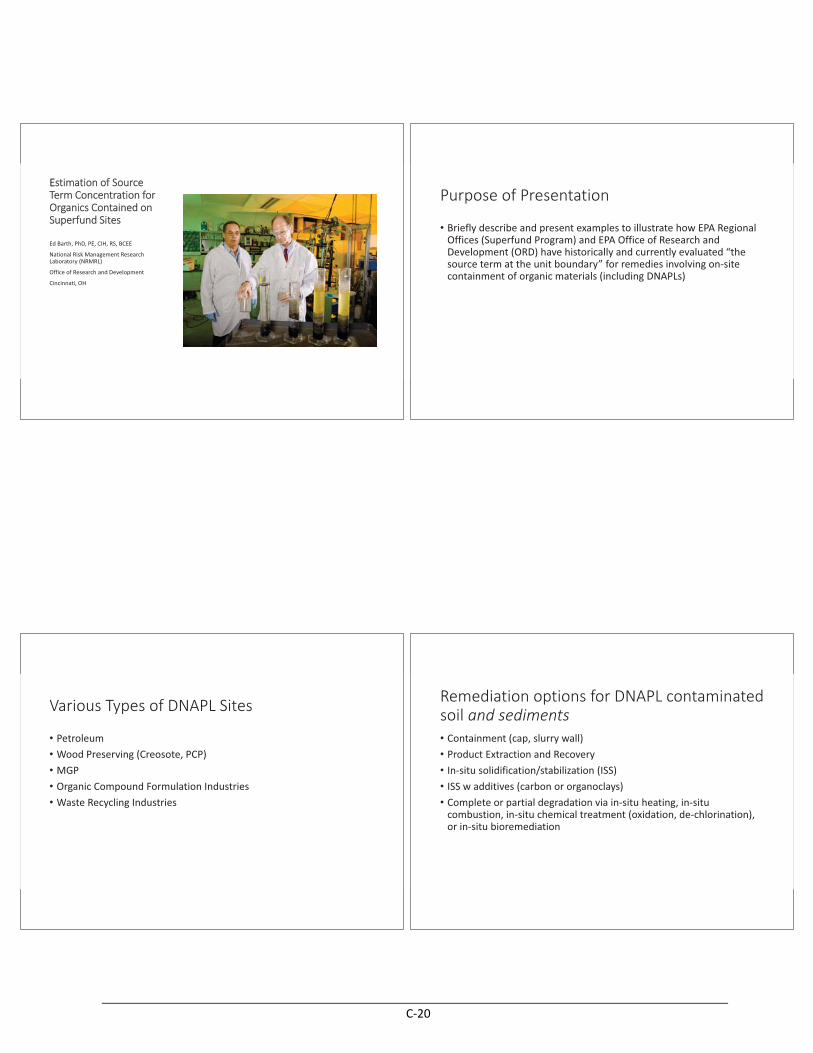
EEstimation�of�Source�Term�Concentration�for�Organics�Contained�on�Superfund�Sites
Ed�Barth,�PhD,�PE,�CIH,�RS,�BCEE
National�Risk�Management�Research�Laboratory�(NRMRL)
Office�of�Research�and�Development
Cincinnati,�OH
Purpose�of�Presentation
• Briefly�describe�and�present�examples�to�illustrate�how�EPA�Regional�Offices�(Superfund�Program)�and�EPA�Office�of�Research�and�Development�(ORD)�have�historically�and�currently�evaluated�“the�source�term�at�the�unit�boundary”�for�remedies�involving�on�site�containment�of�organic�materials�(including�DNAPLs)
Various�Types�of�DNAPL�Sites
• Petroleum• Wood�Preserving�(Creosote,�PCP)• MGP• Organic�Compound�Formulation�Industries• Waste�Recycling�Industries
Remediation�options�for�DNAPL�contaminated�soil������������• Containment�(cap,�slurry�wall)• Product�Extraction�and�Recovery• In�situ�solidification/stabilization�(ISS)• ISS�w�additives�(carbon�or�organoclays)• Complete�or�partial�degradation�via�in�situ�heating,�in�situ�combustion,�in�situ�chemical�treatment�(oxidation,�de�chlorination),�or�in�situ�bioremediation
C-20
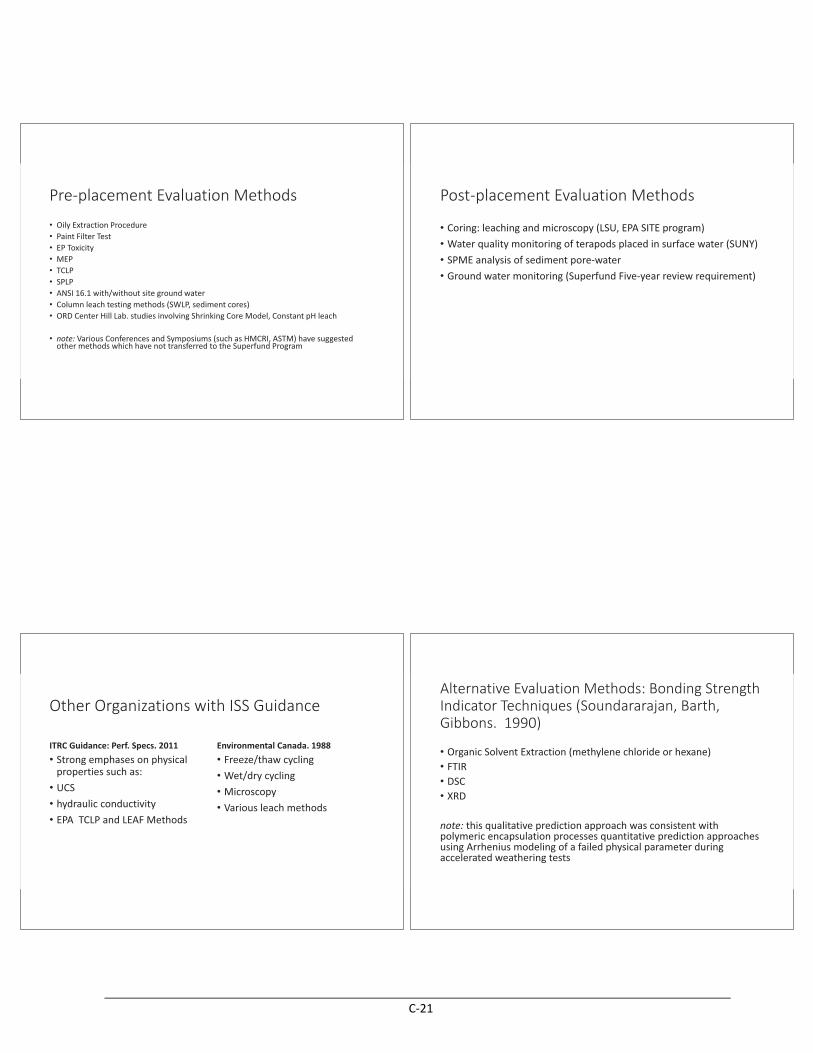
Pre�placement�Evaluation�Methods
• Oily�Extraction�Procedure• Paint�Filter�Test• EP�Toxicity• MEP• TCLP�• SPLP• ANSI�16.1�with/without�site�ground�water• Column�leach�testing�methods�(SWLP,�sediment�cores)• ORD�Center�Hill�Lab.�studies�involving�Shrinking�Core�Model,�Constant�pH�leach
• note:�Various�Conferences�and�Symposiums�(such�as�HMCRI,�ASTM)�have�suggested�other�methods�which�have�not�transferred�to�the�Superfund�Program�
Post�placement�Evaluation�Methods�
• Coring:�leaching�and�microscopy�(LSU,�EPA�SITE�program)• Water�quality�monitoring�of�terapods placed�in�surface�water�(SUNY)• SPME�analysis�of�sediment�pore�water• Ground�water�monitoring�(Superfund�Five�year�review�requirement)
Other�Organizations�with�ISS�Guidance
ITRC�Guidance:�Perf.�Specs.�2011• Strong�emphases�on�physical�properties�such�as:
• UCS�• hydraulic�conductivity• EPA��TCLP�and�LEAF�Methods
Environmental�Canada.�1988• Freeze/thaw�cycling• Wet/dry�cycling• Microscopy• Various�leach�methods
Alternative�Evaluation�Methods:�Bonding�Strength�Indicator�Techniques�(Soundararajan,�Barth,�Gibbons.��1990)
• Organic�Solvent�Extraction�(methylene�chloride�or�hexane)• FTIR• DSC• XRD
note:�this�qualitative�prediction�approach�was�consistent�with�polymeric�encapsulation�processes�quantitative�prediction�approaches�using�Arrhenius�modeling�of�a�failed�physical�parameter�during�accelerated�weathering�tests��
C-21
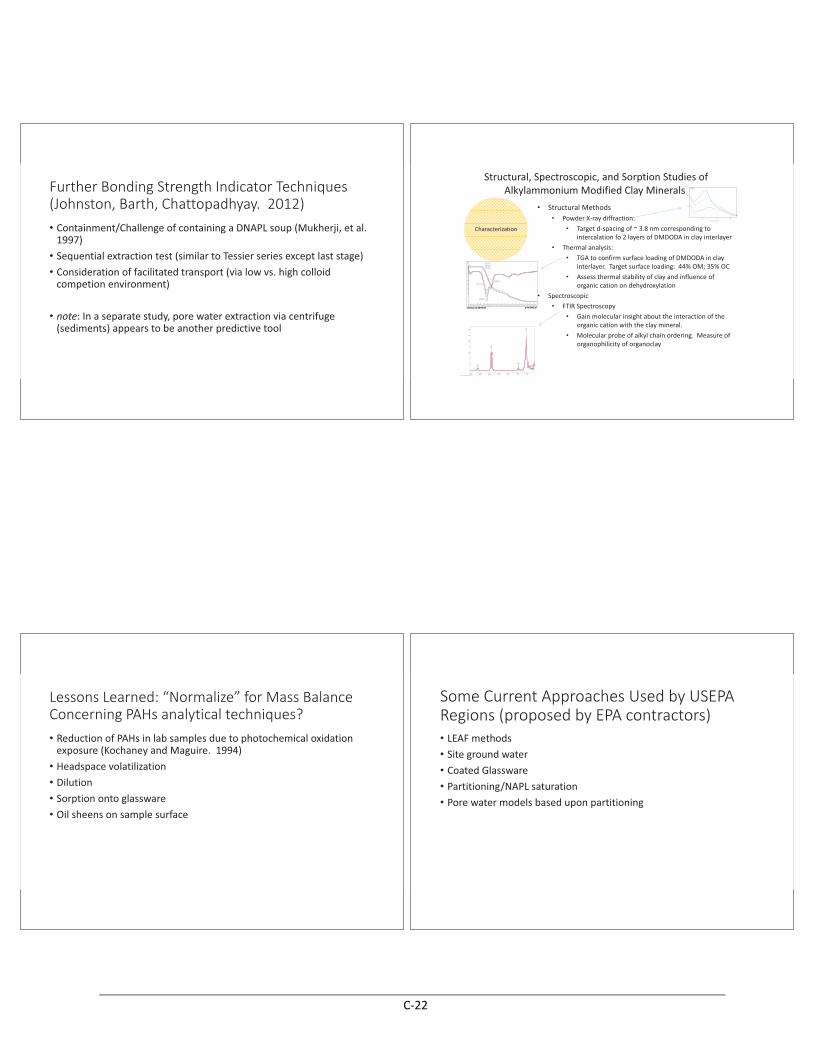
Further�Bonding�Strength�Indicator�Techniques�(Johnston,�Barth,�Chattopadhyay.��2012)• Containment/Challenge�of�containing�a�DNAPL�soup�(Mukherji,�et�al.�1997)�
• Sequential�extraction�test�(similar�to�Tessier series�except�last�stage)• Consideration�of�facilitated�transport�(via�low�vs.�high�colloid�competion environment)
• note:�In�a�separate�study,�pore�water�extraction�via�centrifuge�(sediments)�appears�to�be�another�predictive�tool
Structural,�Spectroscopic,�and�Sorption�Studies�of�Alkylammonium�Modified�Clay�Minerals��
Characterization
• Structural�Methods• Powder�X�ray�diffraction:��
• Target�d�spacing�of�~�3.8�nm�corresponding�to�intercalation�fo�2�layers�of�DMDODA�in�clay�interlayer
• Thermal�analysis:�• TGA�to�confirm�surface�loading�of�DMDODA�in�clay�
interlayer.��Target�surface�loading:��44%�OM;�35%�OC• Assess�thermal�stability�of�clay�and�influence�of�
organic�cation�on�dehydroxylation• Spectroscopic
• FTIR�Spectroscopy�• Gain�molecular�insight�about�the�interaction�of�the�
organic�cation�with�the�clay�mineral.�• Molecular�probe�of�alkyl�chain�ordering.��Measure�of�
organophilicity�of�organoclay
3627
2918
2849
1469
1043
919
801
722 62
5
0
.5
1
1.5
2
2.5
3
3.5
4000 3500 3000 2500 2000 1500 1000 3% mix of organo-clay Batch 1 in KBr
1/(0.55)*9pr66l9pr66l, 18.3971 mg
1/(0.57)*9pr66k9pr66k, 18.1338 mg
1/(0.57)*9pr66j9pr66j, 17.8947 mg
mg
10
11
12
13
14
15
16
17
18
19
min
°C50 100 150 200 250 300 350 400 450 500 550 600 650 700 750 800 850 900 950
0 2 4 6 8 10 12 14 16 18 20 22 24 26 28 30 32 34 36 38 40 42 44 46
\1/(0.57)*9pr66j9pr66j, 17.8947 mg
\1/(0.57)*9pr66k9pr66k, 18.1338 mg
\1/(0.55)*9pr66l9pr66l, 18.3971 mg
-̂11
min0 2 4 6 8 10 12 14 16 18 20 22 24 26 28 30 32 34 36 38 40 42 44 46
STARe SW 9.01Johnston Lab: METTLER
0
500000
1000000
Counts
Position [°2Theta] (Cobalt (Co))
2.50 3 3.50
9pr66n 9pr66o 9pr66m
Lessons�Learned:�“Normalize”�for�Mass�Balance�Concerning�PAHs�analytical�techniques?• Reduction�of�PAHs�in�lab�samples�due�to�photochemical�oxidation��exposure�(Kochaney�and�Maguire.��1994)
• Headspace�volatilization• Dilution• Sorption�onto�glassware• Oil�sheens�on�sample�surface
Some�Current�Approaches�Used�by�USEPA�Regions�(proposed�by�EPA�contractors)• LEAF�methods• Site�ground�water• Coated�Glassware• Partitioning/NAPL�saturation�• Pore�water�models�based�upon�partitioning
C-22

Case�Study:��Atlantic�Wood�Industry,�VA:�Use�of�OC�for�in�situ�application�at�Atlantic�Wood�Site Atlantic�Wood�Industry�Site
• Region�3�contacted�ORD�because�TCLP�criteria�for�PCP�(0.001�mg/l)�could�not�be�met�with�cement�based�process
• Based�upon�previous�ORD�work�with�Dr.�Stephen�Boyd�of�MSU,�ORD�suggested�the�use�of�OC�
• Addition�of�organoclay greatly�reduced�the�TCLP�value�of�PCP,�but�not�below�criteria�established�for�the�site
Case�Study:��Gowanus�Canal,�NY:�ISS�of�NAPL�Contaminated�Sediments
Gowanus�Canal�Treatability�Study�(Niemet,�et�al.��2015�and�Gentry�et�al.,�2015)• SPLP�• EPA�Method�1315M:�modified�for�organics:�methanol�extraction,�PDMS�lined�leaching�vessel��
• Dean�Stark�fluid�pore�saturation�to�indicate�NAPL�mobility
C-23
Summary�PointsSome�EPA�Regional�Offices�have�used�leaching�methods,�beyond�the�TCLP,�to�ascertain�whether�a�treatment/containment�process�is�adequate
An�array�of�challenge�fluids�are�available�to�cover�the�range�of�extraction�recovery
While�bonding�strength�indicator�methods�are�available,�they�are�rarely�used�in�treatment�evaluations
C-24
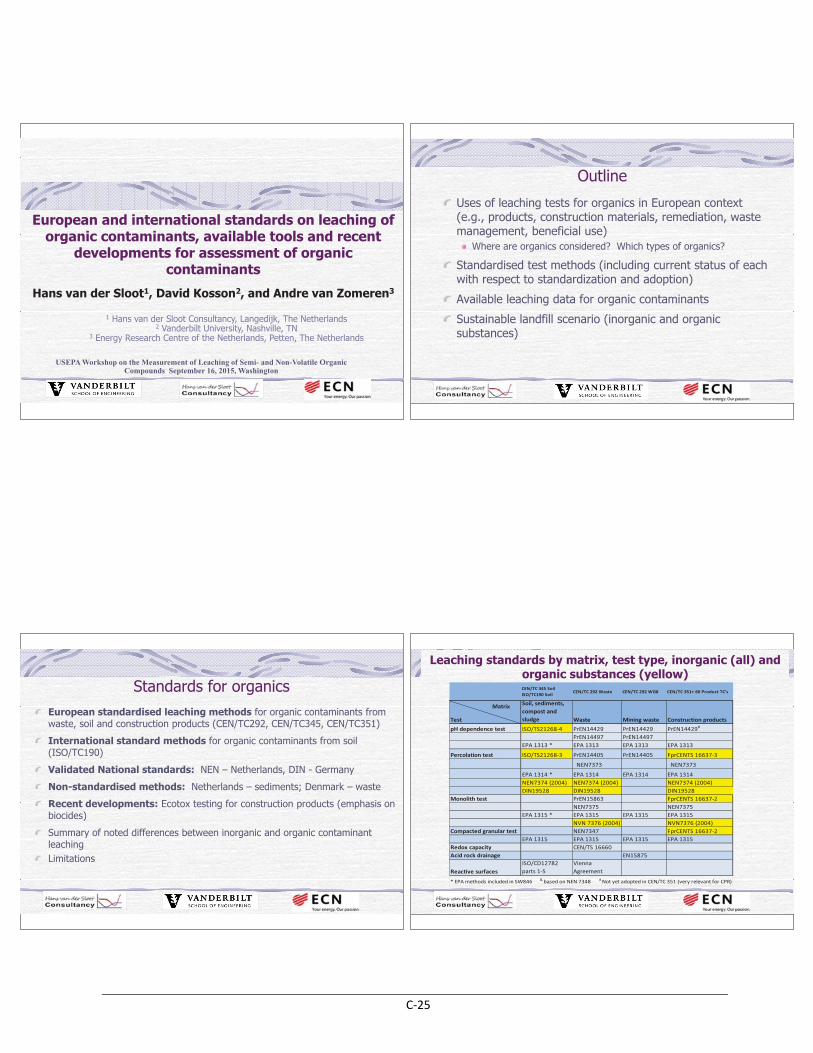
Hans van der Sloot1, David Kosson2, and Andre van Zomeren3
1 Hans van der Sloot Consultancy, Langedijk, The Netherlands2 Vanderbilt University, Nashville, TN
3 Energy Research Centre of the Netherlands, Petten, The Netherlands
European and international standards on leaching of organic contaminants, available tools and recent
developments for assessment of organic contaminants
USEPA Workshop on the Measurement of Leaching of Semi- and Non-Volatile Organic Compounds September 16, 2015, Washington
Outline
Uses of leaching tests for organics in European context (e.g., products, construction materials, remediation, waste management, beneficial use)
Where are organics considered? Which types of organics?
Standardised test methods (including current status of each with respect to standardization and adoption)
Available leaching data for organic contaminants
Sustainable landfill scenario (inorganic and organic substances)
Standards for organicsEuropean standardised leaching methods for organic contaminants from waste, soil and construction products (CEN/TC292, CEN/TC345, CEN/TC351)
International standard methods for organic contaminants from soil (ISO/TC190)
Validated National standards: NEN – Netherlands, DIN - Germany
Non-standardised methods: Netherlands – sediments; Denmark – waste
Recent developments: Ecotox testing for construction products (emphasis on biocides)
Summary of noted differences between inorganic and organic contaminant leaching Limitations
CEN/TC�345�Soil��ISO/TC190�Soil CEN/TC�292�Waste CEN/TC�292�WG8 CEN/TC�351+�60�Product�TC's
Test
Soil,�sediments,�compost�and�sludge Waste Mining�waste Construction�products
pH�dependence�test ISO/TS21268�4 PrEN14429 PrEN14429 PrEN14429#
PrEN14497 PrEN14497EPA�1313�* EPA�1313 EPA�1313 EPA�1313
Percolation�test ISO/TS21268�3 PrEN14405 PrEN14405 FprCENTS�16637�3
��NEN7373 ��NEN7373
EPA�1314�* EPA�1314 EPA�1314 EPA�1314NEN7374�(2004) NEN7374�(2004) NEN7374�(2004)DIN19528 DIN19528 DIN19528
Monolith�test PrEN15863 FprCENTS�16637�2NEN7375 NEN7375
EPA�1315�* EPA�1315 EPA�1315 EPA�1315NVN�7376�(2004) NVN7376�(2004)
Compacted�granular�test NEN7347 FprCENTS�16637�2EPA�1315 EPA�1315 EPA�1315 EPA�1315
Redox�capacity CEN/TS�16660Acid�rock�drainage EN15875
Reactive�surfacesISO/CD12782�parts�1�5
Vienna�Agreement
*�EPA�methods�included�in�SW846������&�based�on�NEN�7348����������#�Not�yet�adopted�in�CEN/TC�351�(very�relevant�for�CPR)
Matrix
Leaching standards by matrix, test type, inorganic (all) and organic substances (yellow)
C-25
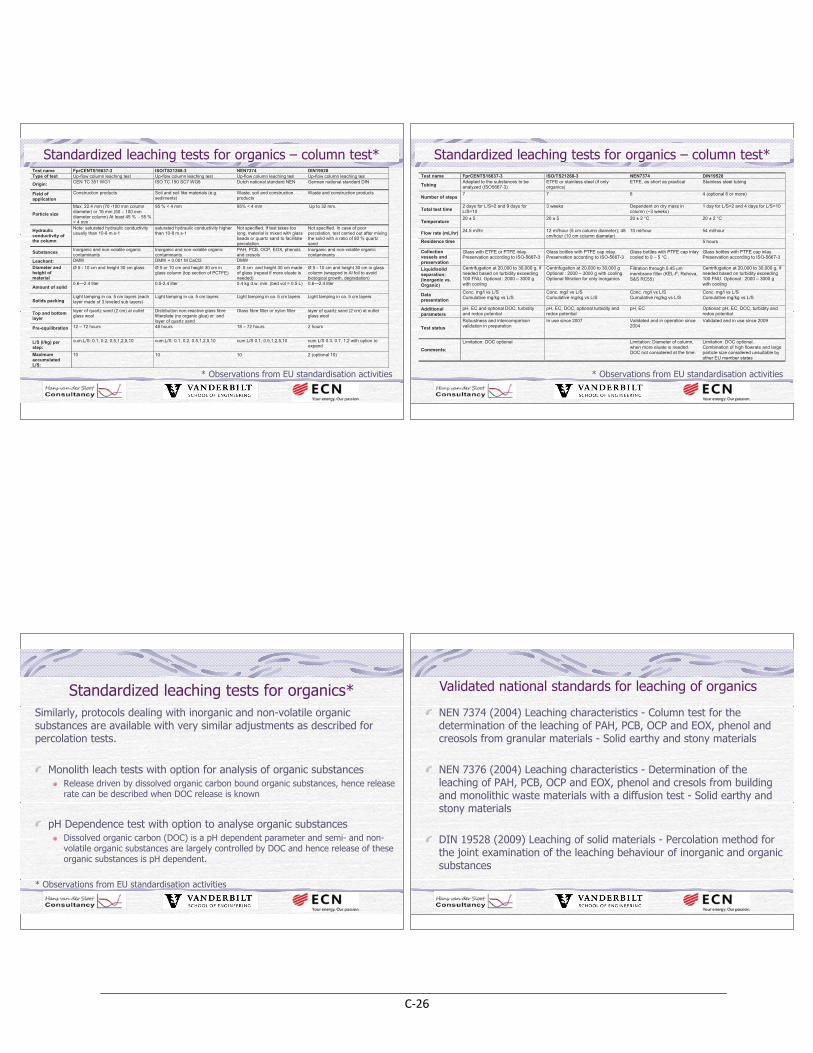
Standardized leaching tests for organics – column test*
* Observations from EU standardisation activities
Test name FprCENTS16637-3 ISO/TS21268-3 NEN7374 DIN19528Type of test Up-flow column leaching test Up-flow column leaching test Up-flow column leaching test Up-flow column leaching test
Origin: CEN TC 351 WG1 ISO TC 190 SC7 WG6 Dutch national standard NEN German national standard DIN
Field of application
Construction products Soil and soil like materials (e.g. sediments)
Waste, soil and construction products
Waste and construction products
Particle size
Max. 22.4 mm (70 -100 mm column diameter) or 16 mm (50 – 100 mm diameter column) At least 45 % - 55 % < 4 mm
95 % < 4 mm 95% < 4 mm Up to 32 mm.
Hydraulic conductivity of the column
Note: saturated hydraulic conductivity usually than 10-8 m.s-1
saturated hydraulic conductivity higher than 10-8 m.s-1
Not specified. If test takes too long, material is mixed with glass beads or quartz sand to facilitate percolation
Not specified. In case of poor percolation, test carried out after mixing the solid with a ratio of 80 % quartz sand
Substances Inorganic and non-volatile organic contaminants
Inorganic and non-volatile organic contaminants
PAH, PCB, OCP, EOX, phenols and cresols
Inorganic and non-volatile organic contaminants
Leachant: DMW DMW + 0.001 M CaCl2 DMW Diameter and height of material
Ø 5 - 10 cm and height 30 cm glass Ø 5 or 10 cm and height 30 cm in glass column (top section of PCTFE)
Ø 5 cm and height 30 cm made of glass (repeat if more eluate is needed)
Ø 5 - 10 cm and height 30 cm in glass column (wrapped in Al foil to avoid biological growth, degradation)
Amount of solid 0.6—2.4 liter 0.5-2.4 liter 0.4 kg d.w. min. (bed vol = 0.5 L) 0.6—2.4 liter
Solids packing Light tamping in ca. 5 cm layers (each layer made of 3 leveled sub layers)
Light tamping in ca. 5 cm layers Light tamping in ca. 5 cm layers Light tamping in ca. 5 cm layers
Top and bottom layer
layer of quartz sand (2 cm) at outlet glass wool
Distribution non-reactive glass fibre filterplate (no organic glue) or and layer of quartz sand
Glass fibre filter or nylon filter layer of quartz sand (2 cm) at outlet glass wool
Pre-equilibration 12 – 72 hours 48 hours 18 – 72 hours 2 hours
L/S (l/kg) per step:
cum.L/S: 0.1, 0.2, 0.5,1,2,5,10 cum.L/S: 0.1, 0.2, 0.5,1,2,5,10 cum L/S 0.1, 0.5,1,2,5,10 cum L/S 0.3, 0.7, 1,2 with option to expand
Maximum accumulated L/S:
10 10 10 2 (optional 10)
Standardized leaching tests for organics – column test*
* Observations from EU standardisation activities
Test name FprCENTS16637-3 ISO/TS21268-3 NEN7374 DIN19528
Tubing Adapted to the substances to be analyzed (ISO5667-3)
ETFE or stainless steel (if only organics)
ETFE, as short as practical Stainless steel tubing
Number of steps 7 7 6 4 (optional 6 or more)
Total test time 2 days for L/S=2 and 9 days for L/S=10
3 weeks Dependent on dry mass in column (~3 weeks)
1 day for L/S=2 and 4 days for L/S=10
Temperature 20 ± 5 20 ± 5 20 ± 2 °C 20 ± 2 °C
Flow rate (mL/hr) 24.5 ml/hr 12 ml/hour (5 cm column diameter); 48 cm/hour (10 cm column diameter)
10 ml/hour 54 ml/hour
Residence time 5 hours
Collection vessels and preservation
Glass with ETFE or PTFE inlay. Preservation according to ISO-5667-3
Glass bottles with PTFE cap inlay. Preservation according to ISO-5667-3
Glass bottles with PTFE cap inlay cooled to 0 – 5 °C .
Glass bottles with PTFE cap inlay. Preservation according to ISO-5667-3
Liquid/solid separation: (inorganic vs. Organic)
Centrifugation at 20,000 to 30,000 g, if needed based on turbidity exceeding 100 FNU. Optional : 2000 – 3000 g with cooling
Centrifugation at 20,000 to 30,000 g Optional : 2000 – 3000 g with cooling. Optional filtration for only inorganics
Filtration through 0.45 �m membrane filter (KEL-F, Rehova, S&S RC55)
Centrifugation at 20,000 to 30,000 g, if needed based on turbidity exceeding 100 FNU. Optional : 2000 – 3000 g with cooling
Data presentation
Conc. mg/l vs L/S Cumulative mg/kg vs L/S
Conc. mg/l vs L/S Cumulative mg/kg vs L/S
Conc. mg/l vs L/S Cumulative mg/kg vs L/S
Conc. mg/l vs L/S Cumulative mg/kg vs L/S
Additional parameters
pH, EC and optional DOC, turbidity and redox potential
pH, EC, DOC, optional turbidity and redox potential
pH, EC Optional: pH, EC, DOC, turbidity and redox potential
Test status
Robustness and intercomparison validation in preparation
In use since 2007 Validated and in operation since 2004
Validated and in use since 2009
Comments:
Limitation: DOC optional Limitation: Diameter of column, when more eluate is needed. DOC not considered at the time.
Limitation: DOC optional. Combination of high flowrate and large particle size considered unsuitable by other EU member states
Standardized leaching tests for organics*Similarly, protocols dealing with inorganic and non-volatile organicsubstances are available with very similar adjustments as described forpercolation tests.
Monolith leach tests with option for analysis of organic substancesRelease driven by dissolved organic carbon bound organic substances, hence release rate can be described when DOC release is known
pH Dependence test with option to analyse organic substancesDissolved organic carbon (DOC) is a pH dependent parameter and semi- and non-volatile organic substances are largely controlled by DOC and hence release of these organic substances is pH dependent.
* Observations from EU standardisation activities
Validated national standards for leaching of organics
NEN 7374 (2004) Leaching characteristics - Column test for the determination of the leaching of PAH, PCB, OCP and EOX, phenol and creosols from granular materials - Solid earthy and stony materials
NEN 7376 (2004) Leaching characteristics - Determination of the leaching of PAH, PCB, OCP and EOX, phenol and cresols from building and monolithic waste materials with a diffusion test - Solid earthy and stony materials
DIN 19528 (2009) Leaching of solid materials - Percolation method for the joint examination of the leaching behaviour of inorganic and organic substances
C-26
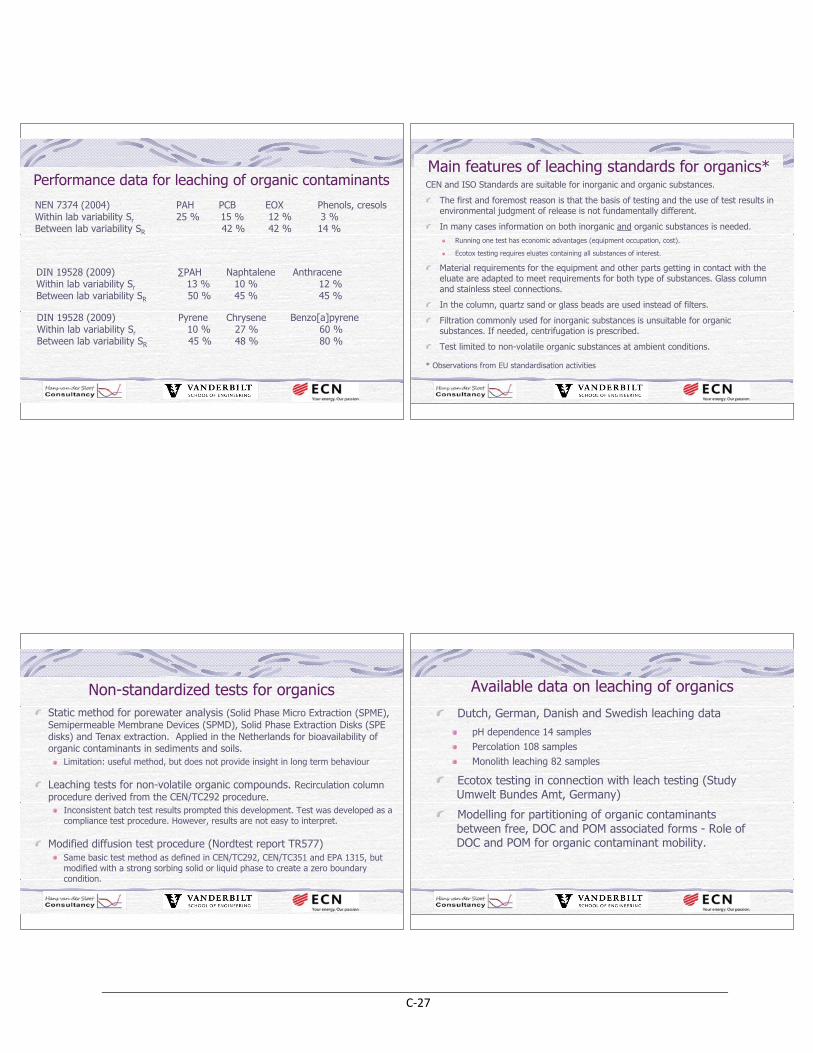
Performance data for leaching of organic contaminants
NEN 7374 (2004) PAH PCB EOX Phenols, cresolsWithin lab variability Sr 25 % 15 % 12 % 3 %Between lab variability SR 42 % 42 % 14 %
DIN 19528 (2009) �PAH Naphtalene Anthracene Within lab variability Sr 13 % 10 % 12 %Between lab variability SR 50 % 45 % 45 %
DIN 19528 (2009) Pyrene Chrysene Benzo[a]pyrene Within lab variability Sr 10 % 27 % 60 %Between lab variability SR 45 % 48 % 80 %
Main features of leaching standards for organics*CEN and ISO Standards are suitable for inorganic and organic substances.
The first and foremost reason is that the basis of testing and the use of test results in environmental judgment of release is not fundamentally different.
In many cases information on both inorganic and organic substances is needed. Running one test has economic advantages (equipment occupation, cost).
Ecotox testing requires eluates containing all substances of interest.
Material requirements for the equipment and other parts getting in contact with the eluate are adapted to meet requirements for both type of substances. Glass column and stainless steel connections.
In the column, quartz sand or glass beads are used instead of filters.
Filtration commonly used for inorganic substances is unsuitable for organic substances. If needed, centrifugation is prescribed.
Test limited to non-volatile organic substances at ambient conditions.
* Observations from EU standardisation activities
Non-standardized tests for organicsStatic method for porewater analysis (Solid Phase Micro Extraction (SPME), Semipermeable Membrane Devices (SPMD), Solid Phase Extraction Disks (SPE disks) and Tenax extraction. Applied in the Netherlands for bioavailability of organic contaminants in sediments and soils.
Limitation: useful method, but does not provide insight in long term behaviour
Leaching tests for non-volatile organic compounds. Recirculation column procedure derived from the CEN/TC292 procedure.
Inconsistent batch test results prompted this development. Test was developed as a compliance test procedure. However, results are not easy to interpret.
Modified diffusion test procedure (Nordtest report TR577)Same basic test method as defined in CEN/TC292, CEN/TC351 and EPA 1315, but modified with a strong sorbing solid or liquid phase to create a zero boundary condition.
Available data on leaching of organics
Dutch, German, Danish and Swedish leaching datapH dependence 14 samplesPercolation 108 samplesMonolith leaching 82 samples
Ecotox testing in connection with leach testing (Study Umwelt Bundes Amt, Germany)
Modelling for partitioning of organic contaminants between free, DOC and POM associated forms - Role of DOC and POM for organic contaminant mobility.
C-27
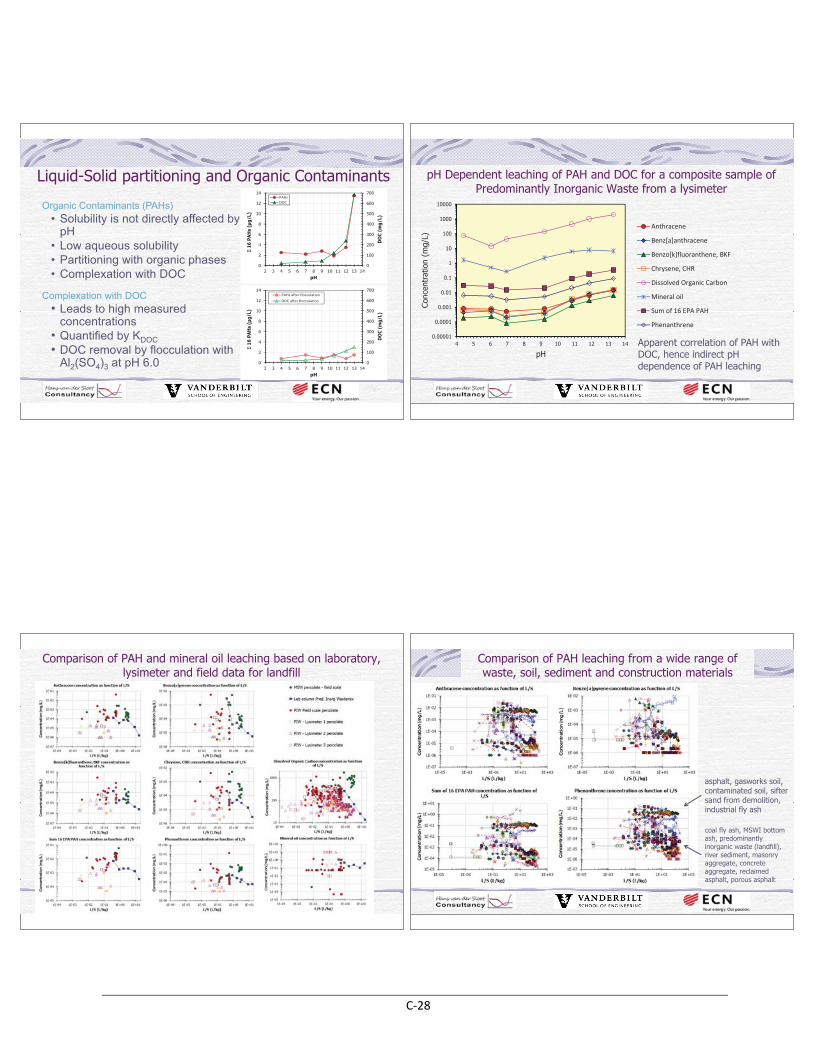
Liquid-Solid partitioning and Organic Contaminants
Organic Contaminants (PAHs)• Solubility is not directly affected by
pH• Low aqueous solubility• Partitioning with organic phases• Complexation with DOC
Complexation with DOC• Leads to high measured
concentrations• Quantified by KDOC• DOC removal by flocculation with
Al2(SO4)3 at pH 6.0
0
100
200
300
400
500
600
700
0
2
4
6
8
10
12
14
2 3 4 5 6 7 8 9 10 11 12 13 14
DO
C (m
g/L)
�16
PAH
s (µ
g/L)
pH
PAHsDOC
0
100
200
300
400
500
600
700
0
2
4
6
8
10
12
14
2 3 4 5 6 7 8 9 10 11 12 13 14
DO
C (m
g/L)
�16
PAH
s (µ
g/L)
pH
PAHs�after�flocculation
DOC�after�flocculation
0.00001
0.0001
0.001
0.01
0.1
1
10
100
1000
10000
4 5 6 7 8 9 10 11 12 13 14
Conc
entr
atio
n (m
g/L)
pH
Anthracene
Benz[a]anthracene
Benzo[k]fluoranthene,�BKF
Chrysene,�CHR
Dissolved�Organic�Carbon
Mineral�oil
Sum�of�16�EPA�PAH
Phenanthrene
pH Dependent leaching of PAH and DOC for a composite sample of Predominantly Inorganic Waste from a lysimeter
Apparent correlation of PAH withDOC, hence indirect pH dependence of PAH leaching
Comparison of PAH and mineral oil leaching based on laboratory, lysimeter and field data for landfill
Comparison of PAH leaching from a wide range of waste, soil, sediment and construction materials
asphalt, gasworks soil, contaminated soil, sifter sand from demolition, industrial fly ash
coal fly ash, MSWI bottom ash, predominantly inorganic waste (landfill), river sediment, masonry aggregate, concrete aggregate, reclaimed asphalt, porous asphalt
C-28
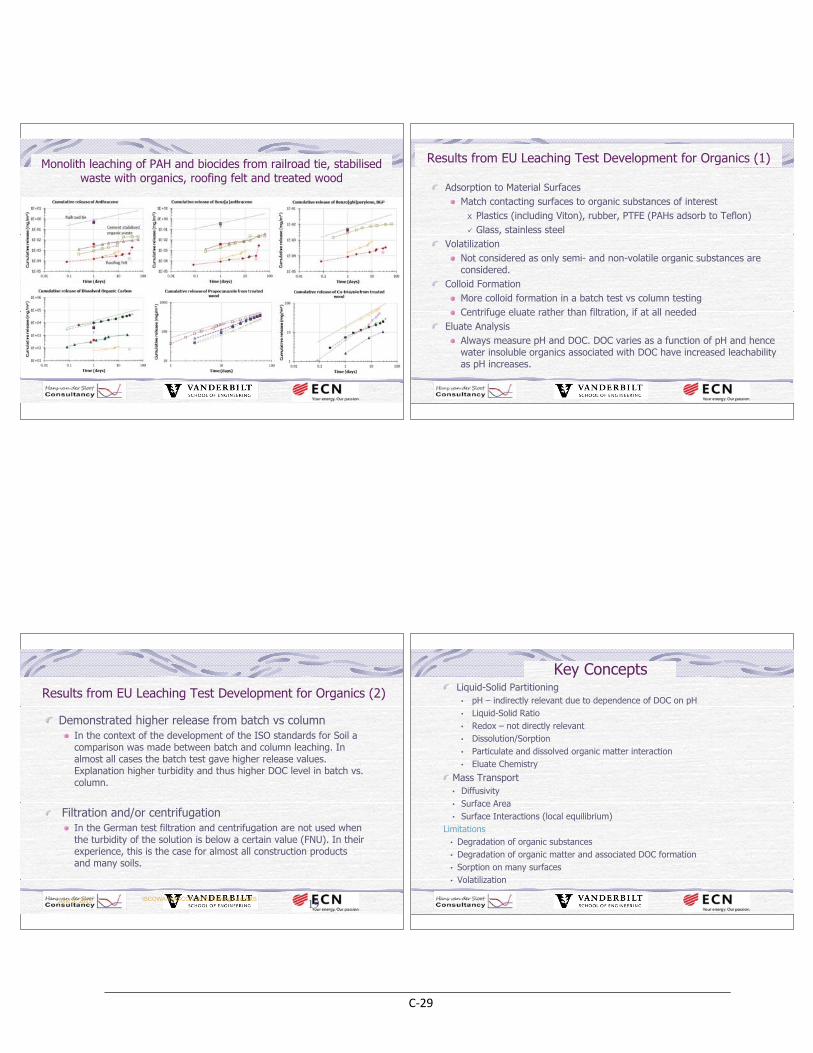
Monolith leaching of PAH and biocides from railroad tie, stabilisedwaste with organics, roofing felt and treated wood
Results from EU Leaching Test Development for Organics (1)
Adsorption to Material SurfacesMatch contacting surfaces to organic substances of interest
� Plastics (including Viton), rubber, PTFE (PAHs adsorb to Teflon)� Glass, stainless steel
VolatilizationNot considered as only semi- and non-volatile organic substances are considered.
Colloid FormationMore colloid formation in a batch test vs column testingCentrifuge eluate rather than filtration, if at all needed
Eluate AnalysisAlways measure pH and DOC. DOC varies as a function of pH and hence water insoluble organics associated with DOC have increased leachability as pH increases.
Demonstrated higher release from batch vs columnIn the context of the development of the ISO standards for Soil a comparison was made between batch and column leaching. In almost all cases the batch test gave higher release values. Explanation higher turbidity and thus higher DOC level in batch vs. column.
Filtration and/or centrifugationIn the German test filtration and centrifugation are not used when the turbidity of the solution is below a certain value (FNU). In their experience, this is the case for almost all construction products and many soils.
19June 9, 2015 ISCOWA-WASCON 2015 Training LeachXS
Results from EU Leaching Test Development for Organics (2)
Key ConceptsLiquid-Solid Partitioning
• pH – indirectly relevant due to dependence of DOC on pH• Liquid-Solid Ratio• Redox – not directly relevant• Dissolution/Sorption• Particulate and dissolved organic matter interaction• Eluate Chemistry
Mass Transport• Diffusivity• Surface Area• Surface Interactions (local equilibrium)
Limitations• Degradation of organic substances• Degradation of organic matter and associated DOC formation• Sorption on many surfaces• Volatilization
C-29
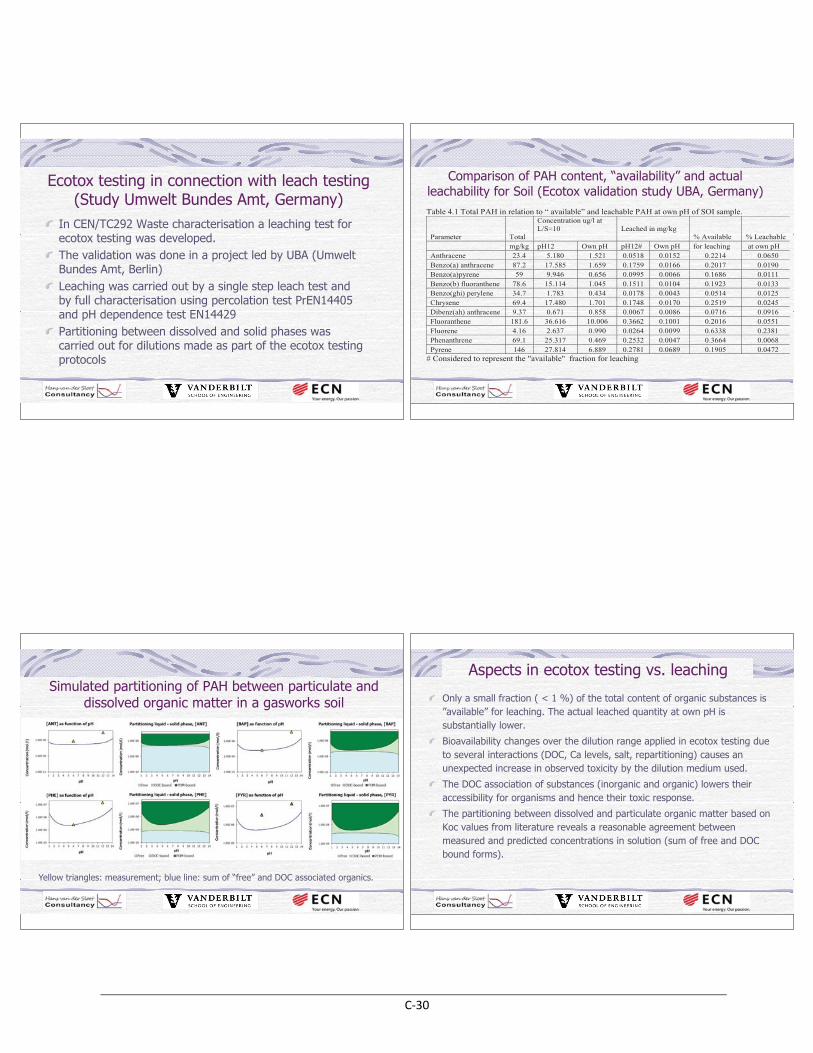
Ecotox testing in connection with leach testing(Study Umwelt Bundes Amt, Germany)
In CEN/TC292 Waste characterisation a leaching test for ecotox testing was developed.The validation was done in a project led by UBA (Umwelt Bundes Amt, Berlin)Leaching was carried out by a single step leach test and by full characterisation using percolation test PrEN14405 and pH dependence test EN14429Partitioning between dissolved and solid phases was carried out for dilutions made as part of the ecotox testing protocols
Comparison of PAH content, “availability” and actual leachability for Soil (Ecotox validation study UBA, Germany)Table 4.1 Total PAH in relation to “ available” and leachable PAH at own pH of SOI sample.
Parameter Total
Concentration ug/l at L/S=10 Leached in mg/kg
% Available % Leachable mg/kg pH12 Own pH pH12# Own pH for leaching at own pH
Anthracene 23.4 5.180 1.521 0.0518 0.0152 0.2214 0.0650Benzo(a) anthracene 87.2 17.585 1.659 0.1759 0.0166 0.2017 0.0190 Benzo(a)pyrene 59 9.946 0.656 0.0995 0.0066 0.1686 0.0111Benzo(b) fluoranthene 78.6 15.114 1.045 0.1511 0.0104 0.1923 0.0133 Benzo(ghi) perylene 34.7 1.783 0.434 0.0178 0.0043 0.0514 0.0125 Chrysene 69.4 17.480 1.701 0.1748 0.0170 0.2519 0.0245Dibenz(ah) anthracene 9.37 0.671 0.858 0.0067 0.0086 0.0716 0.0916 Fluoranthene 181.6 36.616 10.006 0.3662 0.1001 0.2016 0.0551Fluorene 4.16 2.637 0.990 0.0264 0.0099 0.6338 0.2381Phenanthrene 69.1 25.317 0.469 0.2532 0.0047 0.3664 0.0068Pyrene 146 27.814 6.889 0.2781 0.0689 0.1905 0.0472
# Considered to represent the "available" fraction for leaching
Simulated partitioning of PAH between particulate and dissolved organic matter in a gasworks soil
Yellow triangles: measurement; blue line: sum of “free” and DOC associated organics.
Aspects in ecotox testing vs. leaching
Only a small fraction ( < 1 %) of the total content of organic substances is ”available” for leaching. The actual leached quantity at own pH is substantially lower.
Bioavailability changes over the dilution range applied in ecotox testing due to several interactions (DOC, Ca levels, salt, repartitioning) causes an unexpected increase in observed toxicity by the dilution medium used.
The DOC association of substances (inorganic and organic) lowers their accessibility for organisms and hence their toxic response.
The partitioning between dissolved and particulate organic matter based on Koc values from literature reveals a reasonable agreement between measured and predicted concentrations in solution (sum of free and DOC bound forms).
C-30
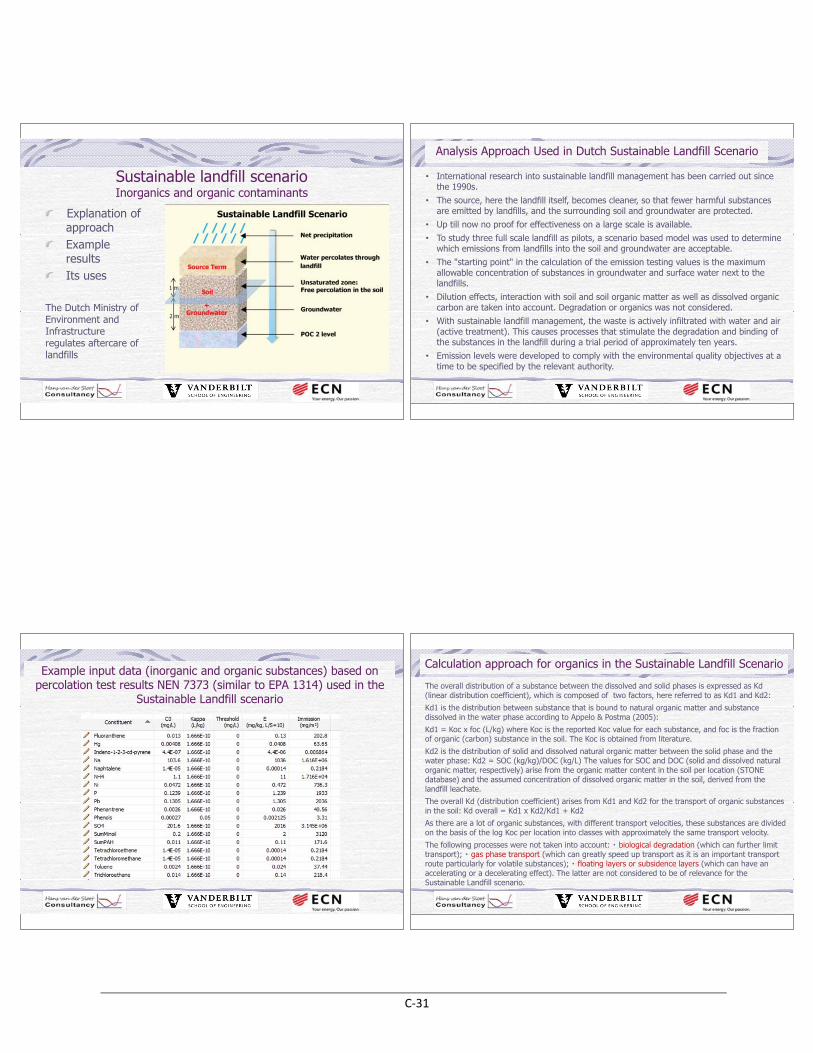
Sustainable landfill scenarioInorganics and organic contaminants
Explanation of approachExample results Its uses
The Dutch Ministry of Environment and Infrastructureregulates aftercare of landfills
• International research into sustainable landfill management has been carried out sincethe 1990s.
• The source, here the landfill itself, becomes cleaner, so that fewer harmful substancesare emitted by landfills, and the surrounding soil and groundwater are protected.
• Up till now no proof for effectiveness on a large scale is available.• To study three full scale landfill as pilots, a scenario based model was used to determine
which emissions from landfills into the soil and groundwater are acceptable.• The "starting point" in the calculation of the emission testing values is the maximum
allowable concentration of substances in groundwater and surface water next to thelandfills.
• Dilution effects, interaction with soil and soil organic matter as well as dissolved organiccarbon are taken into account. Degradation or organics was not considered.
• With sustainable landfill management, the waste is actively infiltrated with water and air(active treatment). This causes processes that stimulate the degradation and binding ofthe substances in the landfill during a trial period of approximately ten years.
• Emission levels were developed to comply with the environmental quality objectives at atime to be specified by the relevant authority.
Analysis Approach Used in Dutch Sustainable Landfill Scenario
Example input data (inorganic and organic substances) based on percolation test results NEN 7373 (similar to EPA 1314) used in the
Sustainable Landfill scenarioThe overall distribution of a substance between the dissolved and solid phases is expressed as Kd(linear distribution coefficient), which is composed of two factors, here referred to as Kd1 and Kd2:
Kd1 is the distribution between substance that is bound to natural organic matter and substance dissolved in the water phase according to Appelo & Postma (2005):
Kd1 = Koc x foc (L/kg) where Koc is the reported Koc value for each substance, and foc is the fraction of organic (carbon) substance in the soil. The Koc is obtained from literature.
Kd2 is the distribution of solid and dissolved natural organic matter between the solid phase and the water phase: Kd2 = SOC (kg/kg)/DOC (kg/L) The values for SOC and DOC (solid and dissolved natural organic matter, respectively) arise from the organic matter content in the soil per location (STONE database) and the assumed concentration of dissolved organic matter in the soil, derived from the landfill leachate.
The overall Kd (distribution coefficient) arises from Kd1 and Kd2 for the transport of organic substances in the soil: Kd overall = Kd1 x Kd2/Kd1 + Kd2
As there are a lot of organic substances, with different transport velocities, these substances are divided on the basis of the log Koc per location into classes with approximately the same transport velocity.
The following processes were not taken into account: biological degradation (which can further limit transport); gas phase transport (which can greatly speed up transport as it is an important transport route particularly for volatile substances); floating layers or subsidence layers (which can have an accelerating or a decelerating effect). The latter are not considered to be of relevance for the Sustainable Landfill scenario.
Calculation approach for organics in the Sustainable Landfill Scenario
C-31
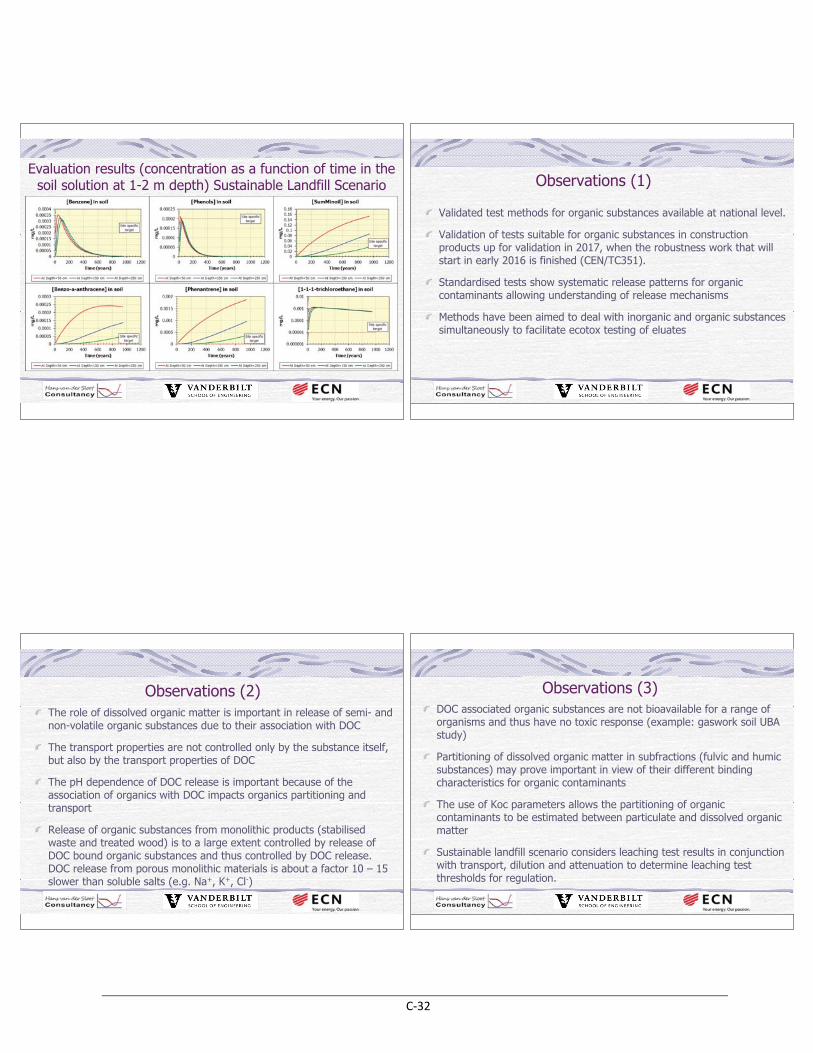
Evaluation results (concentration as a function of time in the soil solution at 1-2 m depth) Sustainable Landfill Scenario Observations (1)
Validated test methods for organic substances available at national level.
Validation of tests suitable for organic substances in construction products up for validation in 2017, when the robustness work that will start in early 2016 is finished (CEN/TC351).
Standardised tests show systematic release patterns for organic contaminants allowing understanding of release mechanisms
Methods have been aimed to deal with inorganic and organic substances simultaneously to facilitate ecotox testing of eluates
Observations (2)The role of dissolved organic matter is important in release of semi- and non-volatile organic substances due to their association with DOC
The transport properties are not controlled only by the substance itself, but also by the transport properties of DOC
The pH dependence of DOC release is important because of the association of organics with DOC impacts organics partitioning and transport
Release of organic substances from monolithic products (stabilisedwaste and treated wood) is to a large extent controlled by release of DOC bound organic substances and thus controlled by DOC release. DOC release from porous monolithic materials is about a factor 10 – 15 slower than soluble salts (e.g. Na+, K+, Cl-)
Observations (3)DOC associated organic substances are not bioavailable for a range of organisms and thus have no toxic response (example: gaswork soil UBA study)
Partitioning of dissolved organic matter in subfractions (fulvic and humicsubstances) may prove important in view of their different binding characteristics for organic contaminants
The use of Koc parameters allows the partitioning of organiccontaminants to be estimated between particulate and dissolved organicmatter
Sustainable landfill scenario considers leaching test results in conjunctionwith transport, dilution and attenuation to determine leaching test thresholds for regulation.
C-32
References
Standards published by CEN (European standards organisation), ISO (International Standards organisation), Dutch Standards Organisation(NEN) en German Standards Organisation (DIN)Ecotoxicological characterization of waste – Results and experiences from a European ring test. Eds: J. Römbke, R. Becker & H. Moser, Springer Science+Business Media, Inc. Norwell (MA). Chapter : PostmaJ.F., van der Sloot, H.A. and van Zomeren A. (2009): Ecotoxicologicalresponse of three waste samples in relation to chemical speciation modelling of leachates.E. Brand et al. (2014) Development of emission testing values to assess sustainable landfill management on pilot landfills Phase 2: Proposals for testing values, RIVM report 607710002/2014
C-33
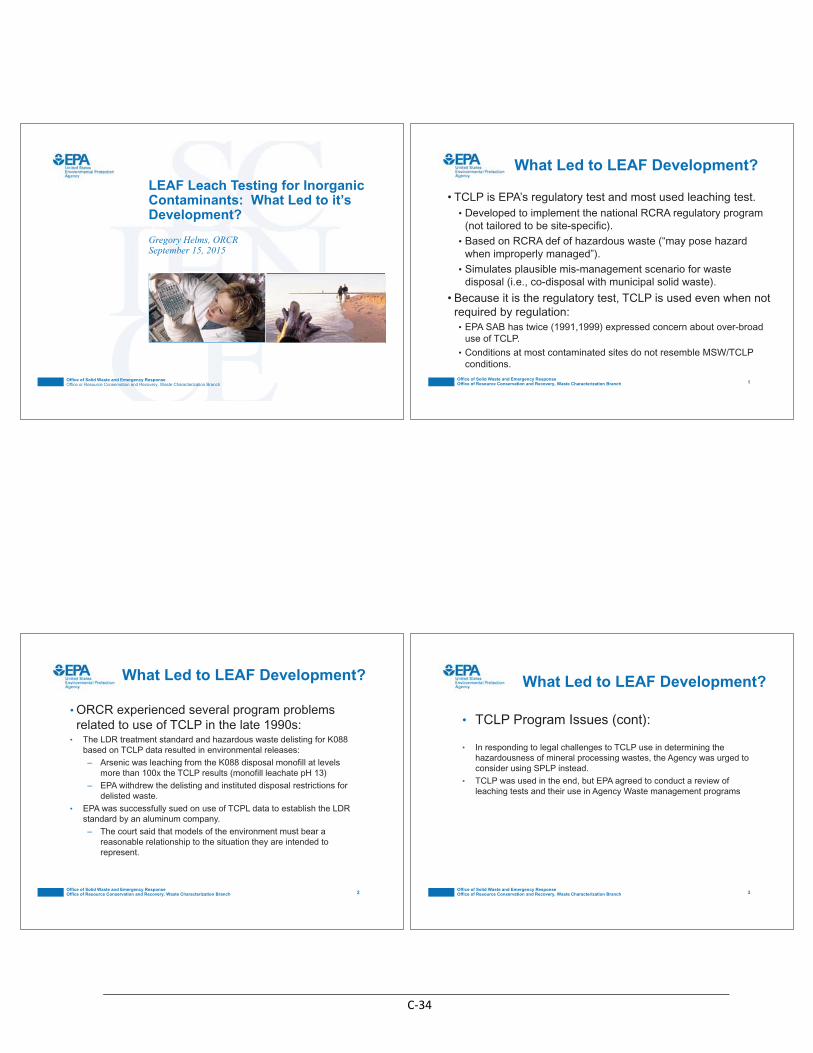
Office of Solid Waste and Emergency ResponseOffice or Resource Conservation and Recovery, Waste Characterization Branch
Photo image area measures 2” H x 6.93” W and can be masked by a collage strip of one, two or three images.
The photo image area is located 3.19” from left and 3.81” from top of page.
Each image used in collage should be reduced or cropped to a maximum of 2” high, stroked with a 1.5 pt white frame and positioned edge-to-edge with accompanying images.
LEAF Leach Testing for Inorganic Contaminants: What Led to it’s Development?
Gregory Helms, ORCRSeptember 15, 2015
Office of Solid Waste and Emergency ResponseOffice of Resource Conservation and Recovery, Waste Characterization Branch
What Led to LEAF Development?
• TCLP is EPA’s regulatory test and most used leaching test.• Developed to implement the national RCRA regulatory program
(not tailored to be site-specific).• Based on RCRA def of hazardous waste (“may pose hazard
when improperly managed”).• Simulates plausible mis-management scenario for waste
disposal (i.e., co-disposal with municipal solid waste).
• Because it is the regulatory test, TCLP is used even when notrequired by regulation:• EPA SAB has twice (1991,1999) expressed concern about over-broad
use of TCLP.• Conditions at most contaminated sites do not resemble MSW/TCLP
conditions.
1
Office of Solid Waste and Emergency ResponseOffice of Resource Conservation and Recovery, Waste Characterization Branch
What Led to LEAF Development?
• ORCR experienced several program problemsrelated to use of TCLP in the late 1990s:
• The LDR treatment standard and hazardous waste delisting for K088 based on TCLP data resulted in environmental releases:– Arsenic was leaching from the K088 disposal monofill at levels
more than 100x the TCLP results (monofill leachate pH 13)– EPA withdrew the delisting and instituted disposal restrictions for
delisted waste.• EPA was successfully sued on use of TCPL data to establish the LDR
standard by an aluminum company.– The court said that models of the environment must bear a
reasonable relationship to the situation they are intended to represent.
2Office of Solid Waste and Emergency ResponseOffice of Resource Conservation and Recovery, Waste Characterization Branch
What Led to LEAF Development?
• TCLP Program Issues (cont):
• In responding to legal challenges to TCLP use in determining the hazardousness of mineral processing wastes, the Agency was urged to consider using SPLP instead.
• TCLP was used in the end, but EPA agreed to conduct a review of leaching tests and their use in Agency Waste management programs
3
C-34
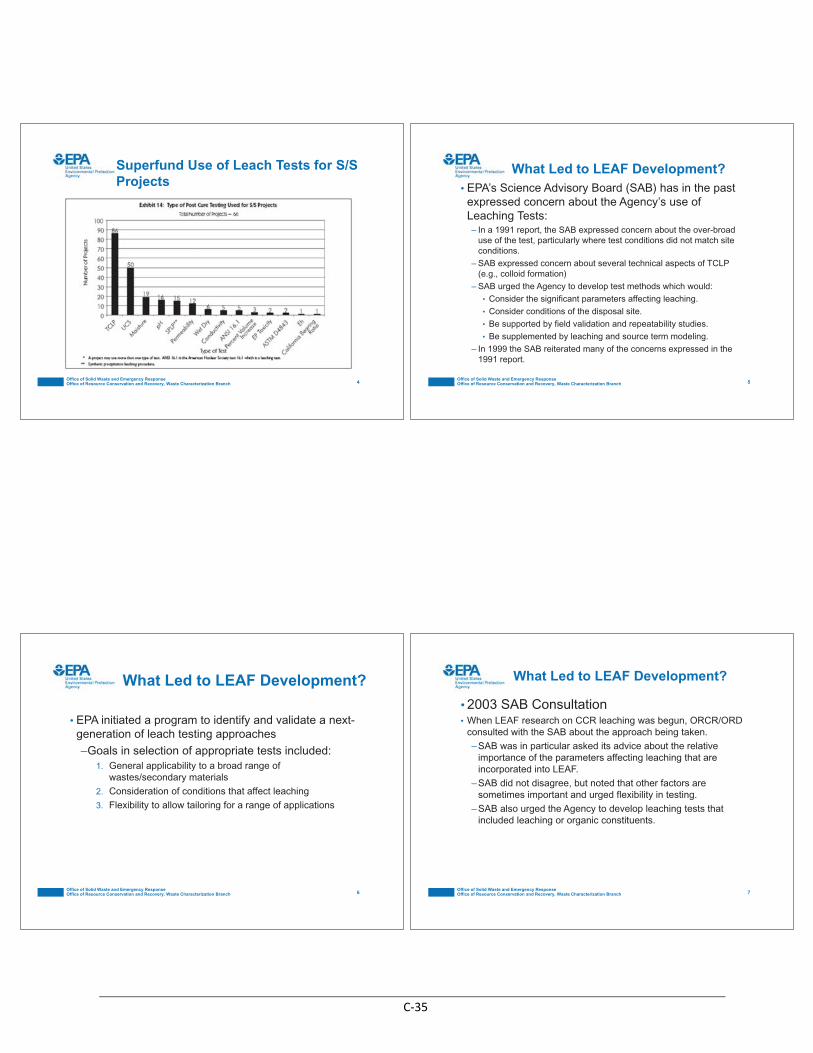
Office of Solid Waste and Emergency ResponseOffice of Resource Conservation and Recovery, Waste Characterization Branch
Superfund Use of Leach Tests for S/S Projects
4Office of Solid Waste and Emergency ResponseOffice of Resource Conservation and Recovery, Waste Characterization Branch
What Led to LEAF Development?• EPA’s Science Advisory Board (SAB) has in the pastexpressed concern about the Agency’s use ofLeaching Tests:– In a 1991 report, the SAB expressed concern about the over-broad
use of the test, particularly where test conditions did not match site conditions.
– SAB expressed concern about several technical aspects of TCLP (e.g., colloid formation)
– SAB urged the Agency to develop test methods which would: • Consider the significant parameters affecting leaching.• Consider conditions of the disposal site.• Be supported by field validation and repeatability studies.• Be supplemented by leaching and source term modeling.
– In 1999 the SAB reiterated many of the concerns expressed in the 1991 report.
5
Office of Solid Waste and Emergency ResponseOffice of Resource Conservation and Recovery, Waste Characterization Branch
What Led to LEAF Development?
• EPA initiated a program to identify and validate a next-generation of leach testing approaches–Goals in selection of appropriate tests included:
1. General applicability to a broad range ofwastes/secondary materials
2. Consideration of conditions that affect leaching 3. Flexibility to allow tailoring for a range of applications
6Office of Solid Waste and Emergency ResponseOffice of Resource Conservation and Recovery, Waste Characterization Branch
What Led to LEAF Development?
• 2003 SAB Consultation• When LEAF research on CCR leaching was begun, ORCR/ORD
consulted with the SAB about the approach being taken.–SAB was in particular asked its advice about the relative
importance of the parameters affecting leaching that are incorporated into LEAF.
–SAB did not disagree, but noted that other factors aresometimes important and urged flexibility in testing.
–SAB also urged the Agency to develop leaching tests thatincluded leaching or organic constituents.
7
C-35
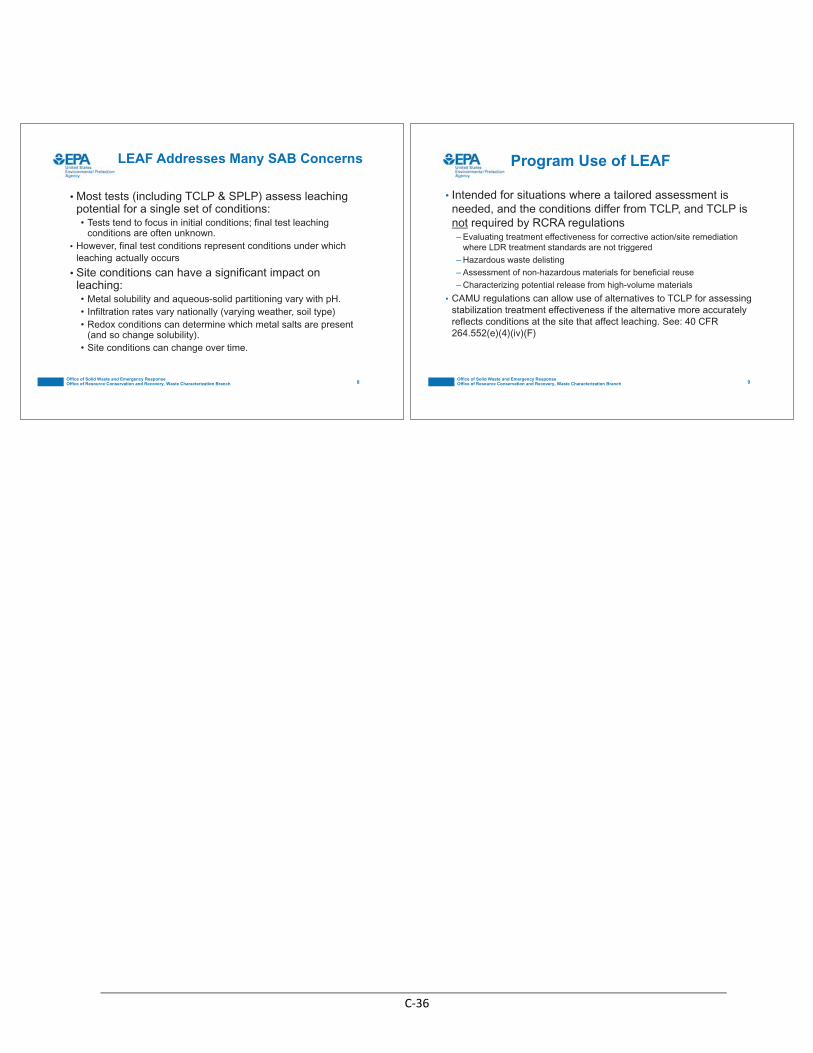
Office of Solid Waste and Emergency ResponseOffice of Resource Conservation and Recovery, Waste Characterization Branch
LEAF Addresses Many SAB Concerns
• Most tests (including TCLP & SPLP) assess leachingpotential for a single set of conditions:• Tests tend to focus in initial conditions; final test leaching
conditions are often unknown.• However, final test conditions represent conditions under which
leaching actually occurs
• Site conditions can have a significant impact onleaching:• Metal solubility and aqueous-solid partitioning vary with pH.• Infiltration rates vary nationally (varying weather, soil type) • Redox conditions can determine which metal salts are present
(and so change solubility).• Site conditions can change over time.
8Office of Solid Waste and Emergency ResponseOffice of Resource Conservation and Recovery, Waste Characterization Branch
Program Use of LEAF
• Intended for situations where a tailored assessment isneeded, and the conditions differ from TCLP, and TCLP isnot required by RCRA regulations– Evaluating treatment effectiveness for corrective action/site remediation
where LDR treatment standards are not triggered– Hazardous waste delisting– Assessment of non-hazardous materials for beneficial reuse– Characterizing potential release from high-volume materials
• CAMU regulations can allow use of alternatives to TCLP for assessing stabilization treatment effectiveness if the alternative more accurately reflects conditions at the site that affect leaching. See: 40 CFR 264.552(e)(4)(iv)(F)
9
C-36
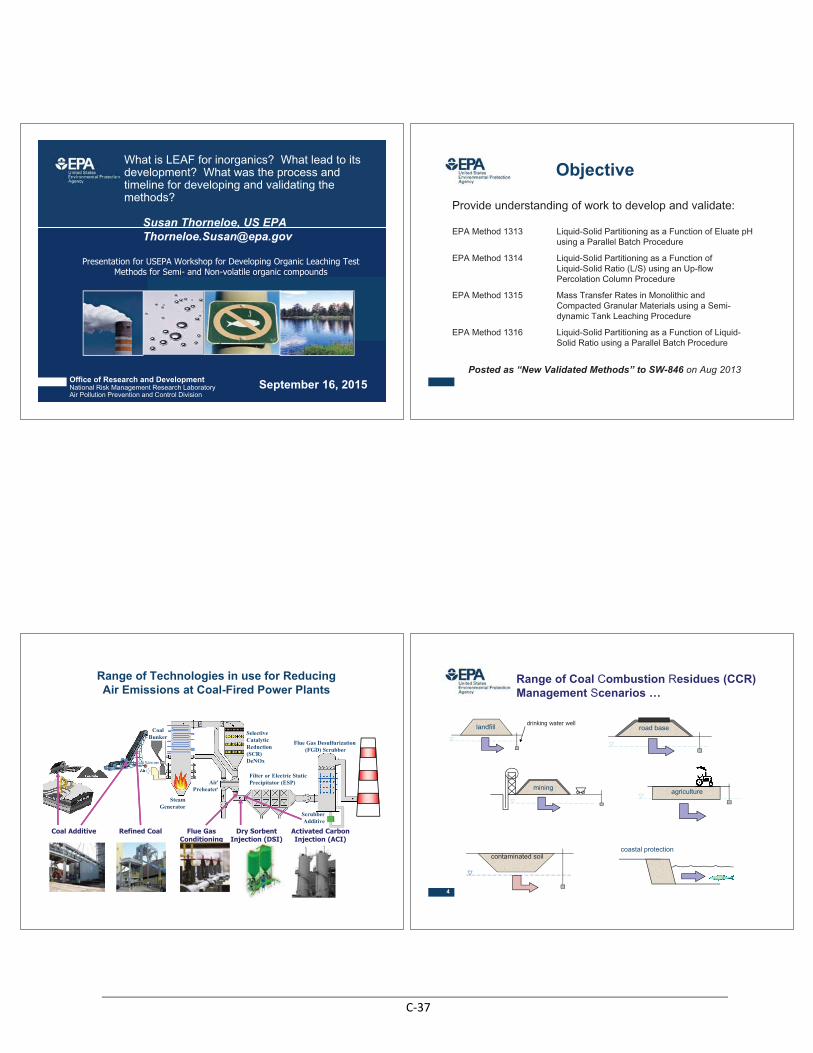
Office of Research and DevelopmentNational Risk Management Research LaboratoryAir Pollution Prevention and Control Division
September 16, 2015
Susan Thorneloe, US EPA
What is LEAF for inorganics? What lead to its development? What was the process and timeline for developing and validating the methods?
Presentation for USEPA Workshop for Developing Organic Leaching Test Methods for Semi- and Non-volatile organic compounds
Provide understanding of work to develop and validate:
EPA Method 1313 Liquid-Solid Partitioning as a Function of Eluate pH using a Parallel Batch Procedure
EPA Method 1314 Liquid-Solid Partitioning as a Function of Liquid-Solid Ratio (L/S) using an Up-flow Percolation Column Procedure
EPA Method 1315 Mass Transfer Rates in Monolithic and Compacted Granular Materials using a Semi-dynamic Tank Leaching Procedure
EPA Method 1316 Liquid-Solid Partitioning as a Function of Liquid-Solid Ratio using a Parallel Batch Procedure
Posted as “New Validated Methods” to SW-846 on Aug 2013
Objective
ScrubberAdditive
Filter or Electric Static Precipitator (ESP)
SelectiveCatalyticReduction(SCR)DeNOx
AirPreheater
SteamGenerator
Flue Gas Desulfurization(FGD) Scrubber
CoalBunker
Range of Technologies in use for Reducing Air Emissions at Coal-Fired Power Plants
Coal Additive Refined Coal Flue Gas Conditioning
Dry Sorbent Injection (DSI)
Activated Carbon Injection (ACI)
3
Range of Coal Combustion Residues (CCR) Management Scenarios …
coastal protection
drinking water welllandfill road base
agriculturemining
4
contaminated soil
C-37
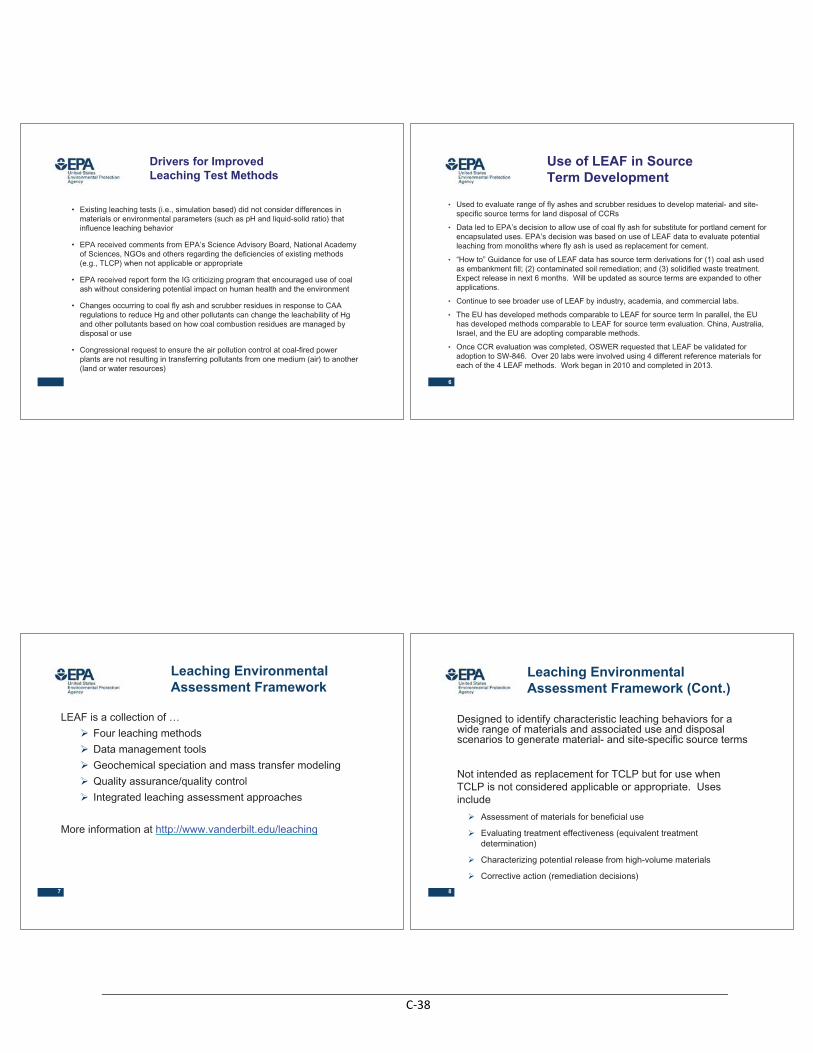
• Existing leaching tests (i.e., simulation based) did not consider differences in materials or environmental parameters (such as pH and liquid-solid ratio) that influence leaching behavior
• EPA received comments from EPA’s Science Advisory Board, National Academy of Sciences, NGOs and others regarding the deficiencies of existing methods (e.g., TLCP) when not applicable or appropriate
• EPA received report form the IG criticizing program that encouraged use of coal ash without considering potential impact on human health and the environment
• Changes occurring to coal fly ash and scrubber residues in response to CAA regulations to reduce Hg and other pollutants can change the leachability of Hg and other pollutants based on how coal combustion residues are managed by disposal or use
• Congressional request to ensure the air pollution control at coal-fired power plants are not resulting in transferring pollutants from one medium (air) to another (land or water resources)
Drivers for ImprovedLeaching Test Methods
Use of LEAF in Source Term Development
• Used to evaluate range of fly ashes and scrubber residues to develop material- and site-specific source terms for land disposal of CCRs
• Data led to EPA’s decision to allow use of coal fly ash for substitute for portland cement for encapsulated uses. EPA’s decision was based on use of LEAF data to evaluate potential leaching from monoliths where fly ash is used as replacement for cement.
• “How to” Guidance for use of LEAF data has source term derivations for (1) coal ash used as embankment fill; (2) contaminated soil remediation; and (3) solidified waste treatment. Expect release in next 6 months. Will be updated as source terms are expanded to other applications.
• Continue to see broader use of LEAF by industry, academia, and commercial labs.
• The EU has developed methods comparable to LEAF for source term In parallel, the EU has developed methods comparable to LEAF for source term evaluation. China, Australia, Israel, and the EU are adopting comparable methods.
• Once CCR evaluation was completed, OSWER requested that LEAF be validated for adoption to SW-846. Over 20 labs were involved using 4 different reference materials for each of the 4 LEAF methods. Work began in 2010 and completed in 2013.
6
Leaching Environmental Assessment Framework
LEAF is a collection of …
� Four leaching methods
� Data management tools
� Geochemical speciation and mass transfer modeling
� Quality assurance/quality control
� Integrated leaching assessment approaches
More information at http://www.vanderbilt.edu/leaching
7
Leaching Environmental Assessment Framework (Cont.)
Designed to identify characteristic leaching behaviors for a wide range of materials and associated use and disposal scenarios to generate material- and site-specific source terms
Not intended as replacement for TCLP but for use when TCLP is not considered applicable or appropriate. Uses include
� Assessment of materials for beneficial use
� Evaluating treatment effectiveness (equivalent treatment determination)
� Characterizing potential release from high-volume materials
� Corrective action (remediation decisions)
8
C-38
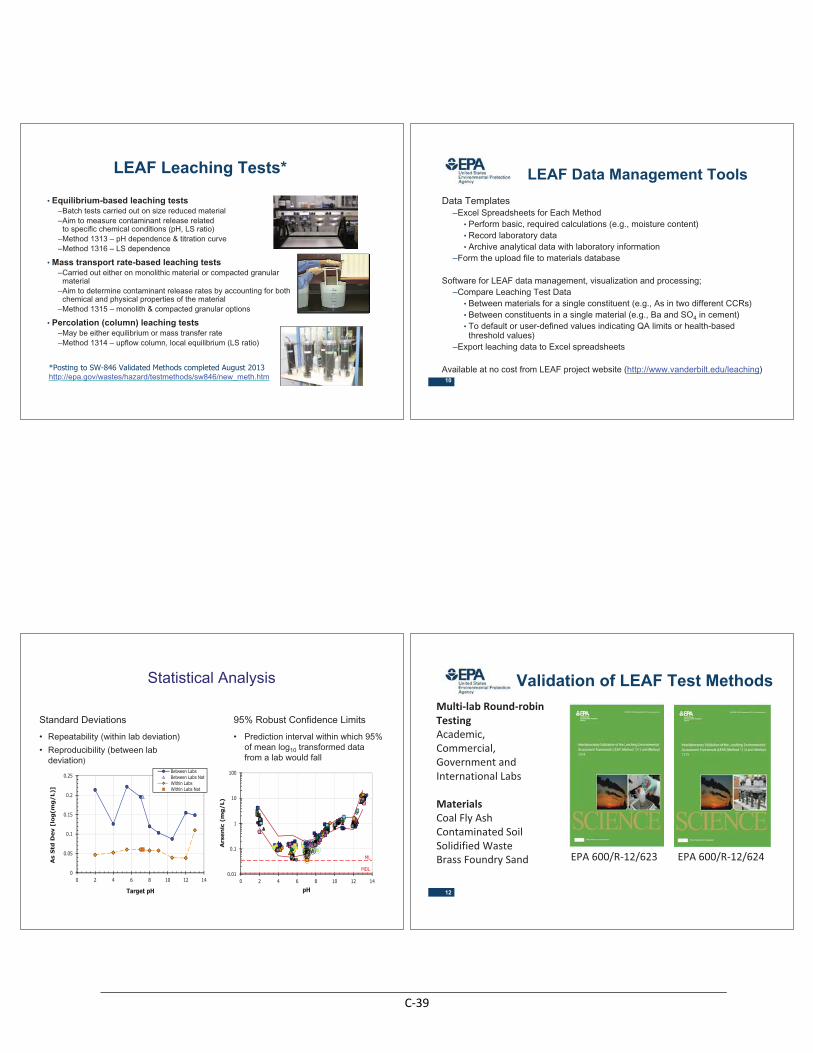
LEAF Leaching Tests*
• Equilibrium-based leaching tests–Batch tests carried out on size reduced material–Aim to measure contaminant release related
to specific chemical conditions (pH, LS ratio)–Method 1313 – pH dependence & titration curve–Method 1316 – LS dependence
• Mass transport rate-based leaching tests–Carried out either on monolithic material or compacted granular
material–Aim to determine contaminant release rates by accounting for both
chemical and physical properties of the material–Method 1315 – monolith & compacted granular options
• Percolation (column) leaching tests–May be either equilibrium or mass transfer rate–Method 1314 – upflow column, local equilibrium (LS ratio)
*Posting to SW-846 Validated Methods completed August 2013http://epa.gov/wastes/hazard/testmethods/sw846/new_meth.htm
9
LEAF Data Management ToolsData Templates
–Excel Spreadsheets for Each Method • Perform basic, required calculations (e.g., moisture content)• Record laboratory data• Archive analytical data with laboratory information
–Form the upload file to materials database
Software for LEAF data management, visualization and processing; –Compare Leaching Test Data
• Between materials for a single constituent (e.g., As in two different CCRs)• Between constituents in a single material (e.g., Ba and SO4 in cement)• To default or user-defined values indicating QA limits or health-based threshold values)
–Export leaching data to Excel spreadsheets
Available at no cost from LEAF project website (http://www.vanderbilt.edu/leaching)10
Statistical Analysis
Standard Deviations
• Repeatability (within lab deviation)
• Reproducibility (between lab deviation)
95% Robust Confidence Limits
• Prediction interval within which 95% of mean log10 transformed data from a lab would fall
0
0.05
0.1
0.15
0.2
0.25
0 2 4 6 8 10 12 14
As
Std
De
v [
log
(mg
/L)]
Target pH
Between LabsBetween Labs NatWithin LabsWithin Labs Nat
ML
MDL0.01
0.1
1
10
100
0 2 4 6 8 10 12 14
Ars
en
ic (
mg
/L)
pH
Validation of LEAF Test MethodsMulti�lab�Round�robin�TestingAcademic,Commercial,�Government�and�International�Labs
MaterialsCoal�Fly�AshContaminated�SoilSolidified�WasteBrass�Foundry�Sand EPA�600/R�12/623 EPA�600/R�12/624�
12
C-39
13
Validation Acknowledgements
Participating Labs – Domestic • Government
� Oak Ridge National Lab� Pacific Northwest National Lab� Savannah River National Lab� U.S. EPA- Research Triangle
Park, NC• Academia
� Ohio State University� University of Wisconsin –
Madison� University of Missouri – Rolla� Vanderbilt University
• Commercial� ARCADIS-US, Inc.� TestAmerica Laboratories, Inc.� URS Corporation
Other participating labs – international• DHI (Denmark)
• Energy Research Centre of the Netherlands
Support• Electric Power Research Institute
(EPRI)
• Recycled Materials Research Center (RMRC)
• Tennessee Valley Authority (TVA)
LEAF Methods Focus Group
Validation Lessons Learned
Modifications to Methods 1313 and 1316• Tolerance for contact time have been added
• Requirement that pH values to be measured within 1 hr after separation of solids and liquids due to lack of buffering in aqueous samples
Modifications to Data Templates• Mandatory information has been highlighted
• Instructions more closely follow method text
Other Recommendations• Calibration of pH meters should cover entire pH range to extent possible
• Reagents should be freshly prepared, stored in vessels of compatible materials (e.g., strong alkalis not be stored in borosilicate glass)
• Labs should establish a QC regimen to check the quality of reagent water (method blanks are important)
Laboratory-to-Field Relationships
• Provides�understanding�of�leaching�assessment�fundamentals
• 10�Cases�of�large�scale�field�analysis�coupled�with�laboratory�testing�for�7�different�materials�-Coal�combustion�residues�(fly�ash,�scrubber�residues-Inorganic�waste�(mixed�origin)�-Municipal�solid�waste�(MSW)-MSW�incinerator�bottom�ash�-Cement�stabilized�MSW�incinerator�fly�ash
-Portland�cement�mortars�and�concrete
EPA�600/R�14/06115
LEAF Method Validation Steps • Agreements with labs to conduct validation of individual methods
• Obtain or develop samples for analysis
• Prepare and deliver kits with equipment and samples for each lab andmethod
• Receive Excel spreadsheets with results from each lab for eachmaterial and method
• Statistical analysis of samples to evaluate inter- and intra- laboratoryvariability
• Documentation of results into two reports representing two batch equilibrium methods and two mass transfer methods
• Reviews and publication of EPA report
• Posting of validated methods onto SW-846 web site
16
C-40
Conclusions for LEAF Validation
LEAF methods for inorganics – have been found to provide data needed for assessing release behavior under range of
field conditions for use and disposal scenarios
– can be used to evaluate leaching behavior of a wide range of materials using a tiered approach that considers the effect of leaching on pH, liquid-to-solid ratio, and physical form
– were validated working with 20 different labs and posted on the SW846 website as validated methods
Research has been coordinated with international community resulting in leveraging expertise, data, and helping provide harmonization in leaching methods so that comparable data is provided when evaluating use of industrial by-products or treatment and remediation effectiveness
Field to lab report showed good comparison between lab and field data using geochemical speciation modeling for processes not easily evaluated in lab (i.e., oxidation and carbonation). Able to explain leaching behavior and found LEAF is good predicator of ultimate fate of inorganics.
17
Supporting Documentation for LEAF Validation� D.S. Kosson, H.A. van der Sloot, F. Sanchez, and A.C. Garrabrants
(2002) “An integrated framework for evaluating leaching in waste management and utilization of secondary materials,” Environmental Engineering Science, 19(3), 159-204.
� Background Information for the Leaching Environmental Assessment Framework Test Methods, EPA/600/R-10/170, Dec 2010
� Interlaboratory Validation of the Leaching Environmental Assessment Framework (LEAF) Leaching Tests for Inclusion into SW-846: Method 1313 and Method 1316, EPA 600/R-12/623, Sept 2012
� Interlaboratory Validation of the Leaching Environmental Assessment Framework (LEAF) Leaching Tests for Inclusion into SW-846: Method 1314 and Method 1315, EPA 600/R-12/624, Sept 2012
� Laboratory-to-Field Comparisons for Leaching Evaluation using the Leaching Environmental Assessment Framework (LEAF), EPA 600/R-14/061, Sept 2014.
18
Supporting Documentation for use of LEAF to evaluate coal combustion residues (CCRs)
� S.A. Thorneloe, D.S. Kosson, F. Sanchez, A.C. Garrabrants, and G. Helms (2010) “Evaluating the Fate of Metals in Air Pollution Control Residues from Coal-Fired Power Plants,” Environmental Science & Technology, 44(19), 7351-7356.
� Characterization of Coal Combustion Residues from Electric Utilities - Leaching and Characterization Data, EPA-600/R-09/151, Dec 2009
� Characterization of Coal Combustion Residues from Electric Utilities Using Wet Scrubbers for Multi-Pollutant Control, EPA-600/R-08/077, July 2008
� Characterization of Mercury-Enriched Coal Combustion Residues from Electric Utilities Using Enhanced Sorbents for Mercury Control, EPA-600/R-06/008, Feb 2006
19
Supplementary Slides on CCR Evaluation
20
C-41
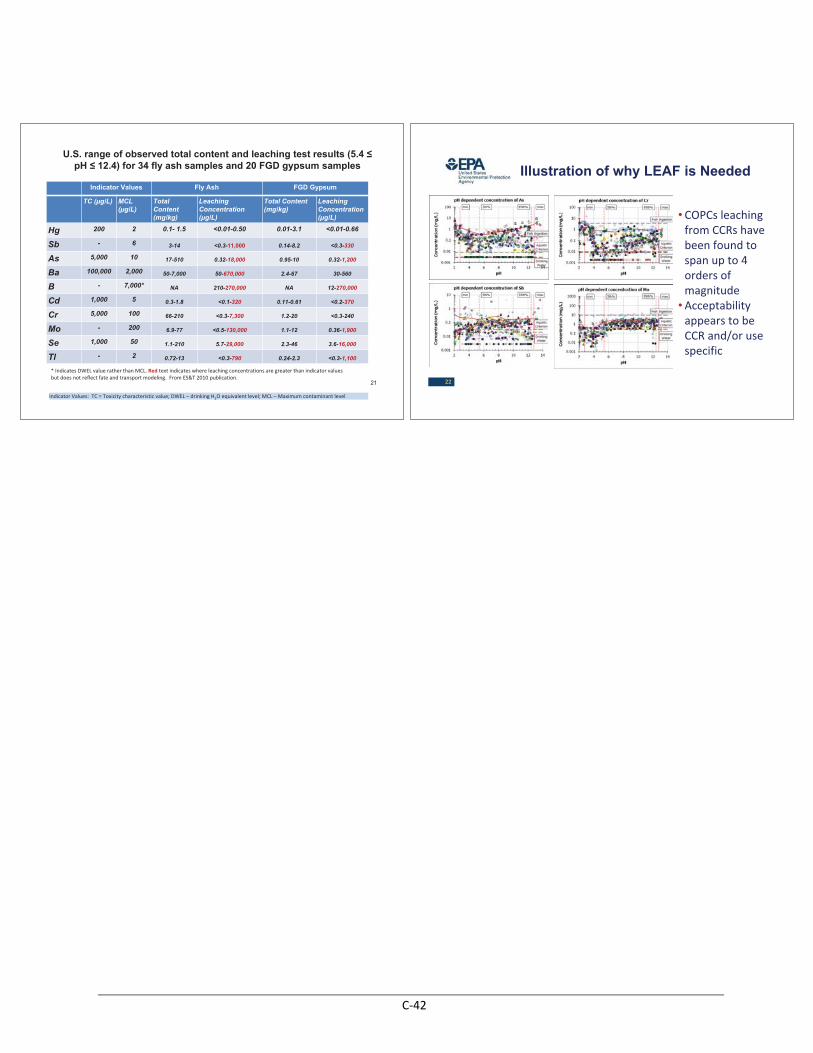
U.S. range of observed total content and leaching test results (5.4 � pH � 12.4) for 34 fly ash samples and 20 FGD gypsum samples
21
Indicator Values Fly Ash FGD Gypsum
TC (µg/L) MCL
(µg/L)
Total
Content
(mg/kg)
Leaching
Concentration
(µg/L)
Total Content
(mg/kg)
Leaching
Concentration
(µg/L)
Hg 200 2 0.1- 1.5 <0.01-0.50 0.01-3.1 <0.01-0.66
Sb - 6 3-14 <0.3-11,000 0.14-8.2 <0.3-330
As 5,000 10 17-510 0.32-18,000 0.95-10 0.32-1,200
Ba 100,000 2,000 50-7,000 50-670,000 2.4-67 30-560
B - 7,000* NA 210-270,000 NA 12-270,000
Cd 1,000 5 0.3-1.8 <0.1-320 0.11-0.61 <0.2-370
Cr 5,000 100 66-210 <0.3-7,300 1.2-20 <0.3-240
Mo - 200 6.9-77 <0.5-130,000 1.1-12 0.36-1,900
Se 1,000 50 1.1-210 5.7-29,000 2.3-46 3.6-16,000
Tl - 2 0.72-13 <0.3-790 0.24-2.3 <0.3-1,100
*�Indicates�DWEL�value�rather�than�MCL.�Red text�indicates�where�leaching�concentrations�are�greater�than�indicator�valuesbut�does�not�reflect�fate�and�transport�modeling. From�ES&T�2010�publication.
Indicator�Values:��TC�=�Toxicity�characteristic�value;�DWEL�– drinking�H2O�equivalent�level;�MCL�– Maximum�contaminant�level
Illustration of why LEAF is Needed
22
• COPCs�leaching�from�CCRs�have�been�found�to�span�up�to�4�orders�of�magnitude
•Acceptability�appears�to�be�CCR�and/or�use�specific
C-42
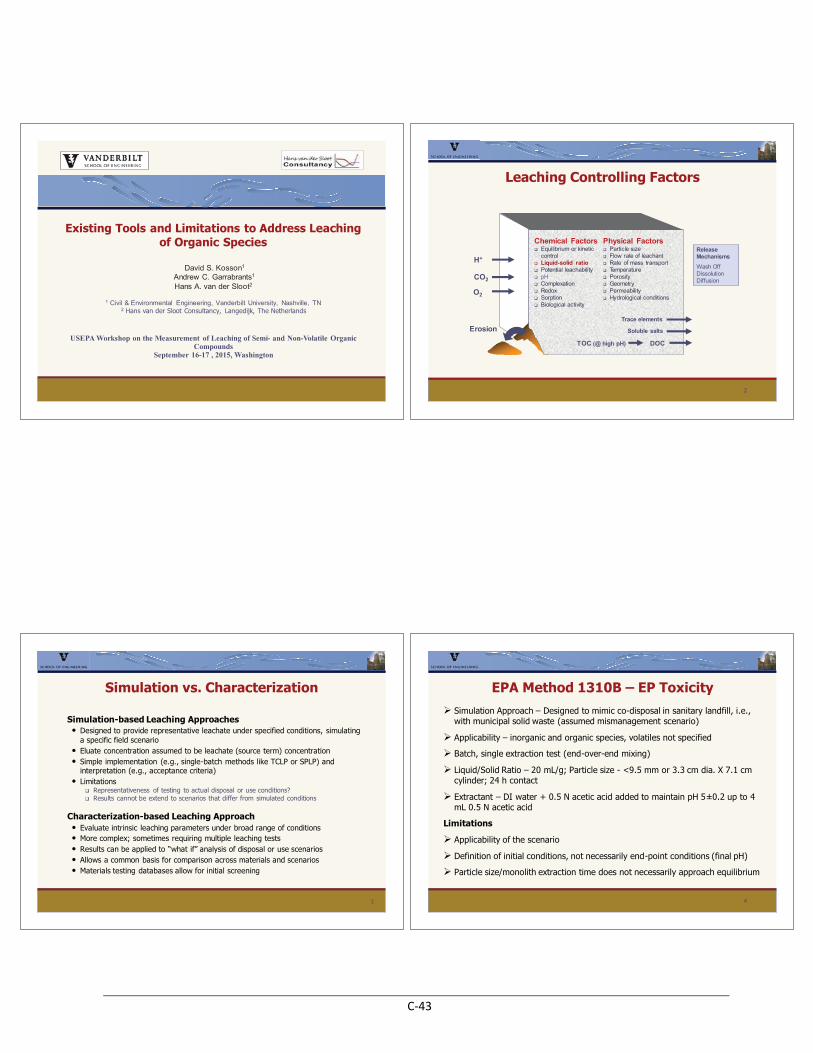
Existing Tools and Limitations to Address Leaching of Organic Species
1 Civil & Environmental Engineering, Vanderbilt University, Nashville, TN2 Hans van der Sloot Consultancy, Langedijk, The Netherlands
David S. Kosson1
Andrew C. Garrabrants1
Hans A. van der Sloot2
USEPA Workshop on the Measurement of Leaching of Semi- and Non-Volatile Organic Compounds
September 16-17 , 2015, Washington
Leaching Controlling Factors
Physical Factors� Particle size� Flow rate of leachant� Rate of mass transport� Temperature� Porosity� Geometry� Permeability� Hydrological conditions
Chemical Factors� Equilibrium or kinetic
control� Liquid-solid ratio� Potential leachability� pH� Complexation� Redox� Sorption � Biological activity
Trace elements
Soluble salts
TOC (@ high pH) DOC
H+
CO2
O2
Erosion
ReleaseMechanismsWash OffDissolutionDiffusion
2
Simulation vs. Characterization
Simulation-based Leaching Approaches
• Designed to provide representative leachate under specified conditions, simulating a specific field scenario
• Eluate concentration assumed to be leachate (source term) concentration• Simple implementation (e.g., single-batch methods like TCLP or SPLP) and
interpretation (e.g., acceptance criteria) • Limitations
� Representativeness of testing to actual disposal or use conditions?� Results cannot be extend to scenarios that differ from simulated conditions
Characterization-based Leaching Approach
• Evaluate intrinsic leaching parameters under broad range of conditions• More complex; sometimes requiring multiple leaching tests• Results can be applied to “what if” analysis of disposal or use scenarios• Allows a common basis for comparison across materials and scenarios• Materials testing databases allow for initial screening
3
EPA Method 1310B – EP Toxicity
� Simulation Approach – Designed to mimic co-disposal in sanitary landfill, i.e., with municipal solid waste (assumed mismanagement scenario)
� Applicability – inorganic and organic species, volatiles not specified
� Batch, single extraction test (end-over-end mixing)
� Liquid/Solid Ratio – 20 mL/g; Particle size - <9.5 mm or 3.3 cm dia. X 7.1 cm cylinder; 24 h contact
� Extractant – DI water + 0.5 N acetic acid added to maintain pH 5±0.2 up to 4 mL 0.5 N acetic acid
Limitations
� Applicability of the scenario
� Definition of initial conditions, not necessarily end-point conditions (final pH)
� Particle size/monolith extraction time does not necessarily approach equilibrium
4
C-43
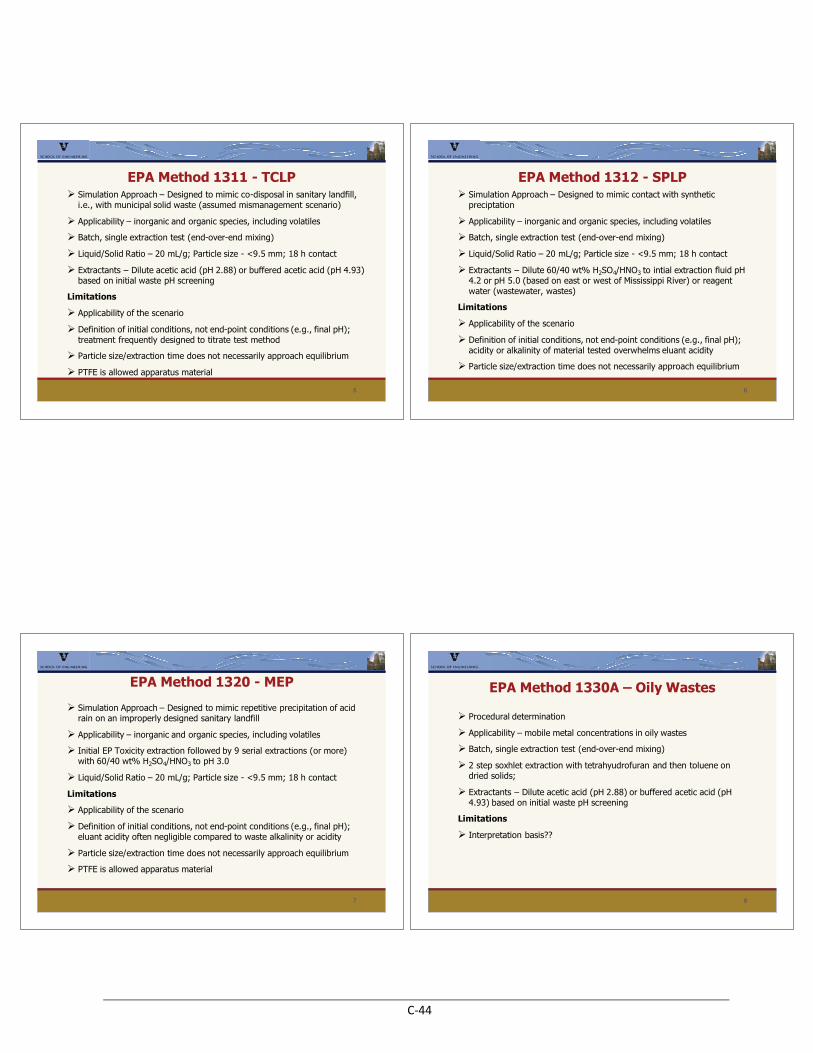
EPA Method 1311 - TCLP� Simulation Approach – Designed to mimic co-disposal in sanitary landfill,
i.e., with municipal solid waste (assumed mismanagement scenario)
� Applicability – inorganic and organic species, including volatiles
� Batch, single extraction test (end-over-end mixing)
� Liquid/Solid Ratio – 20 mL/g; Particle size - <9.5 mm; 18 h contact
� Extractants – Dilute acetic acid (pH 2.88) or buffered acetic acid (pH 4.93) based on initial waste pH screening
Limitations
� Applicability of the scenario
� Definition of initial conditions, not end-point conditions (e.g., final pH); treatment frequently designed to titrate test method
� Particle size/extraction time does not necessarily approach equilibrium
� PTFE is allowed apparatus material
5
EPA Method 1312 - SPLP� Simulation Approach – Designed to mimic contact with synthetic
preciptation
� Applicability – inorganic and organic species, including volatiles
� Batch, single extraction test (end-over-end mixing)
� Liquid/Solid Ratio – 20 mL/g; Particle size - <9.5 mm; 18 h contact
� Extractants – Dilute 60/40 wt% H2SO4/HNO3 to intial extraction fluid pH 4.2 or pH 5.0 (based on east or west of Mississippi River) or reagent water (wastewater, wastes)
Limitations
� Applicability of the scenario
� Definition of initial conditions, not end-point conditions (e.g., final pH); acidity or alkalinity of material tested overwhelms eluant acidity
� Particle size/extraction time does not necessarily approach equilibrium
6
EPA Method 1320 - MEP
� Simulation Approach – Designed to mimic repetitive precipitation of acid rain on an improperly designed sanitary landfill
� Applicability – inorganic and organic species, including volatiles
� Initial EP Toxicity extraction followed by 9 serial extractions (or more) with 60/40 wt% H2SO4/HNO3 to pH 3.0
� Liquid/Solid Ratio – 20 mL/g; Particle size - <9.5 mm; 18 h contact
Limitations
� Applicability of the scenario
� Definition of initial conditions, not end-point conditions (e.g., final pH); eluant acidity often negligible compared to waste alkalinity or acidity
� Particle size/extraction time does not necessarily approach equilibrium
� PTFE is allowed apparatus material
7
EPA Method 1330A – Oily Wastes
8
� Procedural determination
� Applicability – mobile metal concentrations in oily wastes
� Batch, single extraction test (end-over-end mixing)
� 2 step soxhlet extraction with tetrahyudrofuran and then toluene on dried solids;
� Extractants – Dilute acetic acid (pH 2.88) or buffered acetic acid (pH 4.93) based on initial waste pH screening
Limitations
� Interpretation basis??
C-44
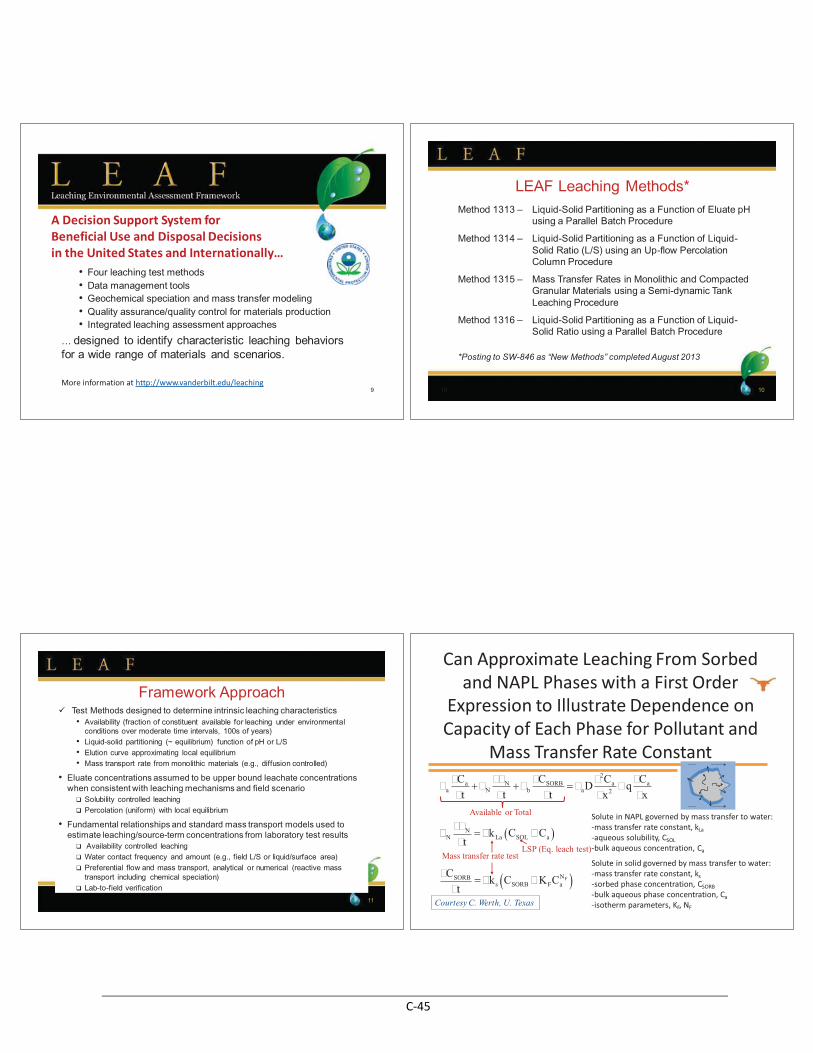
A Decision Support System for Beneficial Use and Disposal Decisions in the United States and Internationally…
� Four leaching test methods� Data management tools� Geochemical speciation and mass transfer modeling� Quality assurance/quality control for materials production� Integrated leaching assessment approaches
��designed to identify characteristic leaching behaviors for a wide range of materials and scenarios.
More information at http://www.vanderbilt.edu/leaching9
LEAF Leaching Methods*Method 1313 � Liquid-Solid Partitioning as a Function of Eluate pH
using a Parallel Batch Procedure
Method 1314 � Liquid-Solid Partitioning as a Function of Liquid-Solid Ratio (L/S) using an Up-flow Percolation Column Procedure
Method 1315 � Mass Transfer Rates in Monolithic and Compacted Granular Materials using a Semi-dynamic Tank Leaching Procedure
Method 1316 � Liquid-Solid Partitioning as a Function of Liquid-Solid Ratio using a Parallel Batch Procedure
*Posting to SW-846 as “New Methods” completed August 2013
10 10
Framework Approach� Test Methods designed to determine intrinsic leaching characteristics
� Availability (fraction of constituent available for leaching under environmental conditions over moderate time intervals, 100s of years)
� Liquid-solid partitioning (~ equilibrium) function of pH or L/S� Elution curve approximating local equilibrium� Mass transport rate from monolithic materials (e.g., diffusion controlled)
� Eluate concentrations assumed to be upper bound leachate concentrationswhen consistent with leaching mechanisms and field scenario
� Solubility controlled leaching� Percolation (uniform) with local equilibrium
� Fundamental relationships and standard mass transport models used to estimate leaching/source-term concentrations from laboratory test results
� Availability controlled leaching� Water contact frequency and amount (e.g., field L/S or liquid/surface area)� Preferential flow and mass transport, analytical or numerical (reactive mass
transport including chemical speciation)� Lab-to-field verification
11
Can Approximate Leaching From Sorbedand NAPL Phases with a First Order
Expression to Illustrate Dependence on Capacity of Each Phase for Pollutant and
Mass Transfer Rate Constant
�a
�Ca
�t��N
��N
�t��b
�CSORB
�t� �aD
�2Ca
�x2�q
�Ca
�x
�N
��N
�t� �kLa CSOL �Ca� �
�CSORB
�t� �ks CSORB �KFCa
NF� �
Solute in NAPL governed by mass transfer to water:-mass transfer rate constant, kLa-aqueous solubility, CSOL-bulk aqueous concentration, Ca
Solute in solid governed by mass transfer to water:-mass transfer rate constant, ks-sorbed phase concentration, CSORB-bulk aqueous phase concentration, Ca-isotherm parameters, KF, NF
Available or Total
LSP (Eq. leach test)Mass transfer rate test
Courtesy C. Werth, U. Texas
C-45
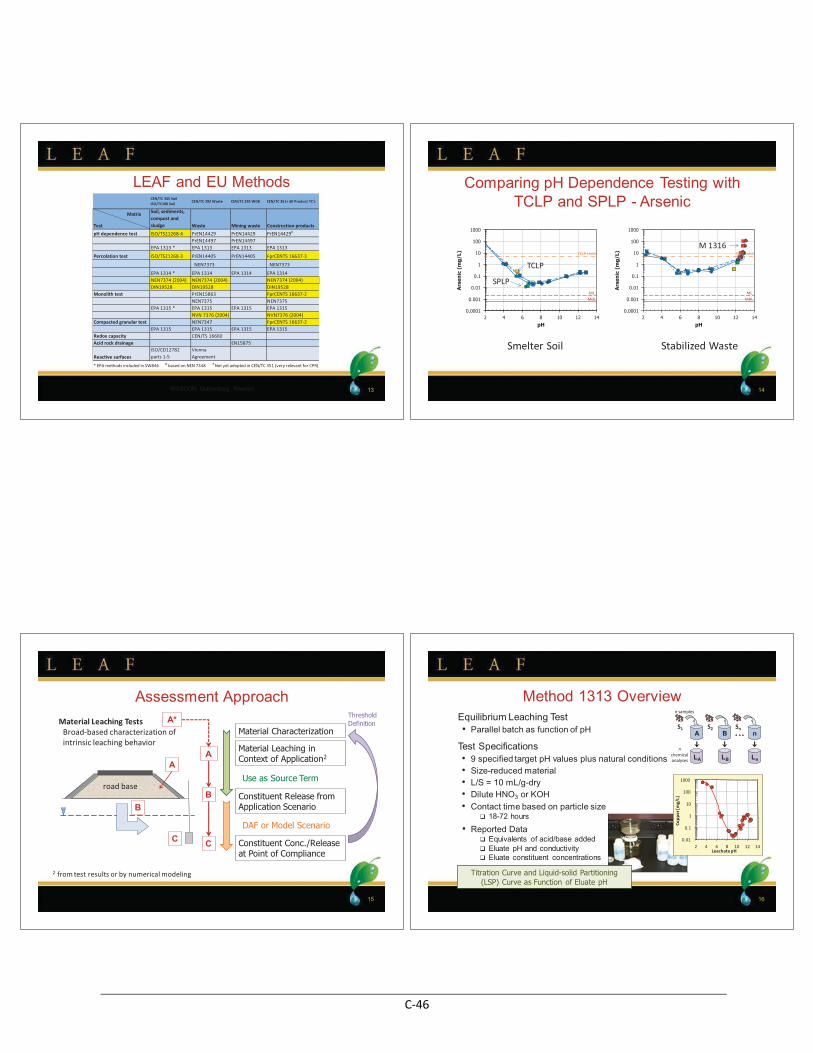
LEAF and EU Methods
WASCON, Gothenburg, Sweden 13
CEN/TC 345 Soil ISO/TC190 Soil CEN/TC 292 Waste CEN/TC 292 WG8 CEN/TC 351+ 60 Product TC's
Test
Soil, sediments, compost and sludge Waste Mining waste Construction products
pH dependence test ISO/TS21268-4 PrEN14429 PrEN14429 PrEN14429#
PrEN14497 PrEN14497EPA 1313 * EPA 1313 EPA 1313 EPA 1313
Percolation test ISO/TS21268-3 PrEN14405 PrEN14405 FprCENTS 16637-3
NEN7373 NEN7373
EPA 1314 * EPA 1314 EPA 1314 EPA 1314NEN7374 (2004) NEN7374 (2004) NEN7374 (2004)DIN19528 DIN19528 DIN19528
Monolith test PrEN15863 FprCENTS 16637-2NEN7375 NEN7375
EPA 1315 * EPA 1315 EPA 1315 EPA 1315NVN 7376 (2004) NVN7376 (2004)
Compacted granular test NEN7347 FprCENTS 16637-2EPA 1315 EPA 1315 EPA 1315 EPA 1315
Redox capacity CEN/TS 16660Acid rock drainage EN15875
Reactive surfacesISO/CD12782 parts 1-5
Vienna Agreement
* EPA methods included in SW846 & based on NEN 7348 # Not yet adopted in CEN/TC 351 (very relevant for CPR)
Matrix
Comparing pH Dependence Testing with TCLP and SPLP - Arsenic
14
MLMDL
TCLP Limit
0.0001
0.001
0.01
0.1
1
10
100
1000
2 4 6 8 10 12 14
Ars
en
ic (
mg
/L)
pH
MLMDL
TCLP Limit
0.0001
0.001
0.01
0.1
1
10
100
1000
2 4 6 8 10 12 14
Ars
en
ic (
mg
/L)
pH
Smelter Soil Stabilized Waste
TCLP
SPLP
M 1316
Assessment Approach
C
B
A
B
C
A*Material Characterization
Constituent Release from Application Scenario
Constituent Conc./Release at Point of Compliance
DAF or Model Scenario
Use as Source Term
Material Leaching in Context of Application2
ThresholdDefinition
A
road base
Material Leaching TestsBroad-based characterization of intrinsic leaching behavior
15
2 from test results or by numerical modeling
Method 1313 Overview
nchemicalanalyses LnLBLA
n samples
S2 SnnBA
S1
0.01
0.1
1
10
100
1000
2 4 6 8 10 12 14Leachate pH
Copp
er [m
g/L]
Titration Curve and Liquid-solid Partitioning (LSP) Curve as Function of Eluate pH
16
Equilibrium Leaching Test� Parallel batch as function of pH
Test Specifications� 9 specified target pH values plus natural conditions� Size-reduced material� L/S = 10 mL/g-dry � Dilute HNO3 or KOH� Contact time based on particle size
� 18-72 hours
� Reported Data� Equivalents of acid/base added� Eluate pH and conductivity� Eluate constituent concentrations
C-46
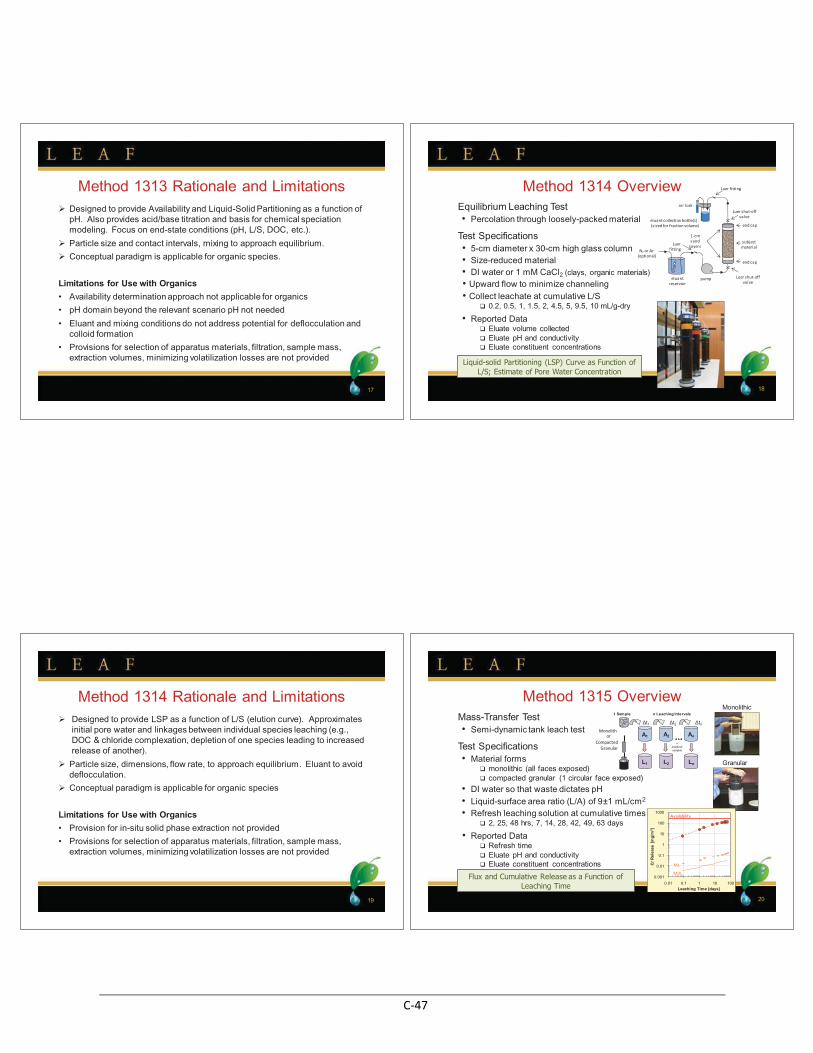
Method 1313 Rationale and Limitations� Designed to provide Availability and Liquid-Solid Partitioning as a function of
pH. Also provides acid/base titration and basis for chemical speciation modeling. Focus on end-state conditions (pH, L/S, DOC, etc.).
� Particle size and contact intervals, mixing to approach equilibrium.
� Conceptual paradigm is applicable for organic species.
Limitations for Use with Organics� Availability determination approach not applicable for organics
� pH domain beyond the relevant scenario pH not needed
� Eluant and mixing conditions do not address potential for deflocculation and colloid formation
� Provisions for selection of apparatus materials, filtration, sample mass, extraction volumes, minimizing volatilization losses are not provided
17
Equilibrium Leaching Test� Percolation through loosely-packed material
Test Specifications� 5-cm diameter x 30-cm high glass column� Size-reduced material� DI water or 1 mM CaCl2 (clays, organic materials)
� Upward flow to minimize channeling� Collect leachate at cumulative L/S
� 0.2, 0.5, 1, 1.5, 2, 4.5, 5, 9.5, 10 mL/g-dry
� Reported Data� Eluate volume collected� Eluate pH and conductivity� Eluate constituent concentrations
Method 1314 Overviewair lock
eluant collection bottle(s)(sized for fraction volume)
Luer shut-offvalve
eluant reservoir
end cap
end cap
1-cm sand
layers
pump
subjectmaterial
Luer shut-offvalve
Luer fitting
Luer fittingN2 or Ar
(optional)
Liquid-solid Partitioning (LSP) Curve as Function of L/S; Estimate of Pore Water Concentration
18
Method 1314 Rationale and Limitations� Designed to provide LSP as a function of L/S (elution curve). Approximates
initial pore water and linkages between individual species leaching (e.g., DOC & chloride complexation, depletion of one species leading to increased release of another).
� Particle size, dimensions, flow rate, to approach equilibrium. Eluant to avoid deflocculation.
� Conceptual paradigm is applicable for organic species
Limitations for Use with Organics� Provision for in-situ solid phase extraction not provided
� Provisions for selection of apparatus materials, filtration, sample mass, extraction volumes, minimizing volatilization losses are not provided
19
Method 1315 OverviewMass-Transfer Test� Semi-dynamic tank leach test
Test Specifications� Material forms
� monolithic (all faces exposed)� compacted granular (1 circular face exposed)
� DI water so that waste dictates pH� Liquid-surface area ratio (L/A) of 9±1 mL/cm2
� Refresh leaching solution at cumulative times� 2, 25, 48 hrs, 7, 14, 28, 42, 49, 63 days
� Reported Data� Refresh time� Eluate pH and conductivity� Eluate constituent concentrations
1 Sample
nanalyticalsamples
A1
L1
A2 An
L2 Ln
�t1 �tn
orMonolith
CompactedGranular
n Leaching Intervals
�t2
Flux and Cumulative Release as a Function of Leaching Time
Granular
Monolithic
0.001
0.01
0.1
1
10
100
1000
0.01 0.1 1 10 100
Cr R
elea
se [
mg/
m2 ]
Leaching Time [days]
Availability
MDL
ML
20
C-47
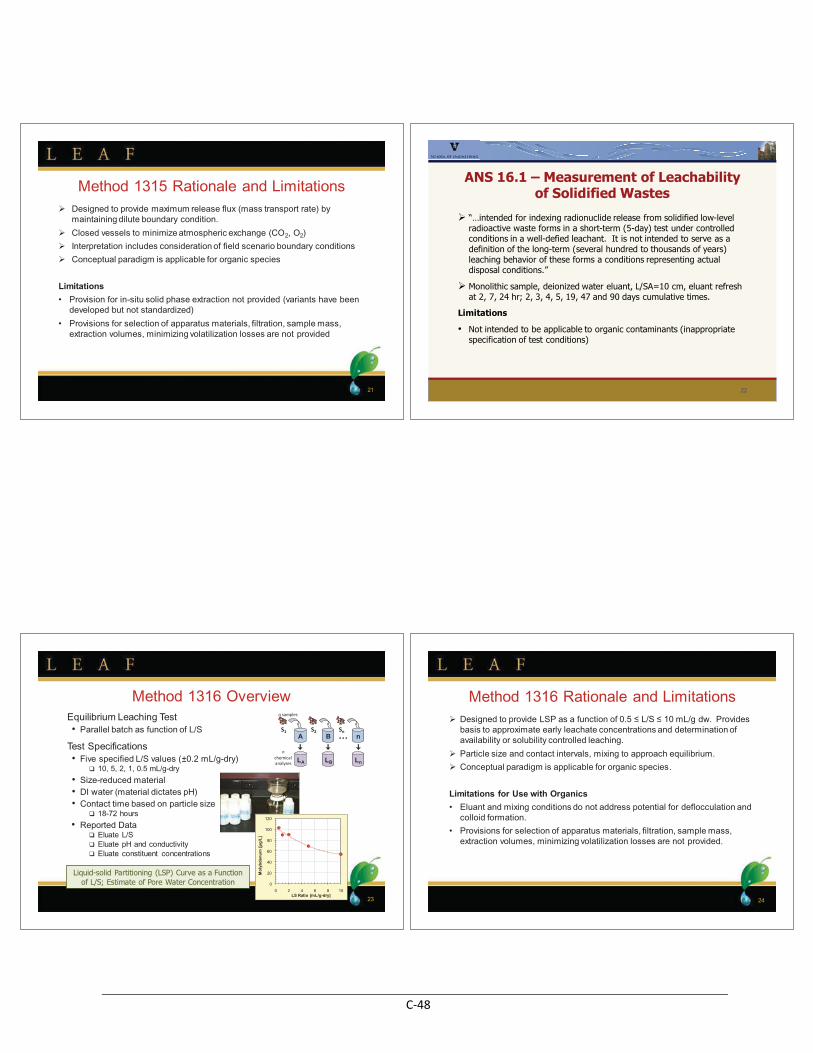
Method 1315 Rationale and Limitations� Designed to provide maximum release flux (mass transport rate) by
maintaining dilute boundary condition.
� Closed vessels to minimize atmospheric exchange (CO2, O2)
� Interpretation includes consideration of field scenario boundary conditions
� Conceptual paradigm is applicable for organic species
Limitations� Provision for in-situ solid phase extraction not provided (variants have been
developed but not standardized)
� Provisions for selection of apparatus materials, filtration, sample mass, extraction volumes, minimizing volatilization losses are not provided
21
ANS 16.1 – Measurement of Leachability of Solidified Wastes
� “…intended for indexing radionuclide release from solidified low-level radioactive waste forms in a short-term (5-day) test under controlled conditions in a well-defied leachant. It is not intended to serve as a definition of the long-term (several hundred to thousands of years) leaching behavior of these forms a conditions representing actual disposal conditions.”
� Monolithic sample, deionized water eluant, L/SA=10 cm, eluant refresh at 2, 7, 24 hr; 2, 3, 4, 5, 19, 47 and 90 days cumulative times.
Limitations
� Not intended to be applicable to organic contaminants (inappropriatespecification of test conditions)
22
Method 1316 OverviewEquilibrium Leaching Test� Parallel batch as function of L/S
Test Specifications� Five specified L/S values (±0.2 mL/g-dry)
� 10, 5, 2, 1, 0.5 mL/g-dry
� Size-reduced material� DI water (material dictates pH)� Contact time based on particle size
� 18-72 hours
� Reported Data� Eluate L/S� Eluate pH and conductivity� Eluate constituent concentrations
nchemicalanalyses LnLBLA
n samples
S2 SnnBA
S1
Liquid-solid Partitioning (LSP) Curve as a Function of L/S; Estimate of Pore Water Concentration
23
0
20
40
60
80
100
120
0 2 4 6 8 10
Mol
ybde
num
[�g/
L]
LS Ratio [mL/g-dry]
Method 1316 Rationale and Limitations� ����� �������� ������������������������������������ ����dw. Provides
basis to approximate early leachate concentrations and determination of availability or solubility controlled leaching.
� Particle size and contact intervals, mixing to approach equilibrium.
� Conceptual paradigm is applicable for organic species.
Limitations for Use with Organics� Eluant and mixing conditions do not address potential for deflocculation and
colloid formation.
� Provisions for selection of apparatus materials, filtration, sample mass, extraction volumes, minimizing volatilization losses are not provided.
24
C-48
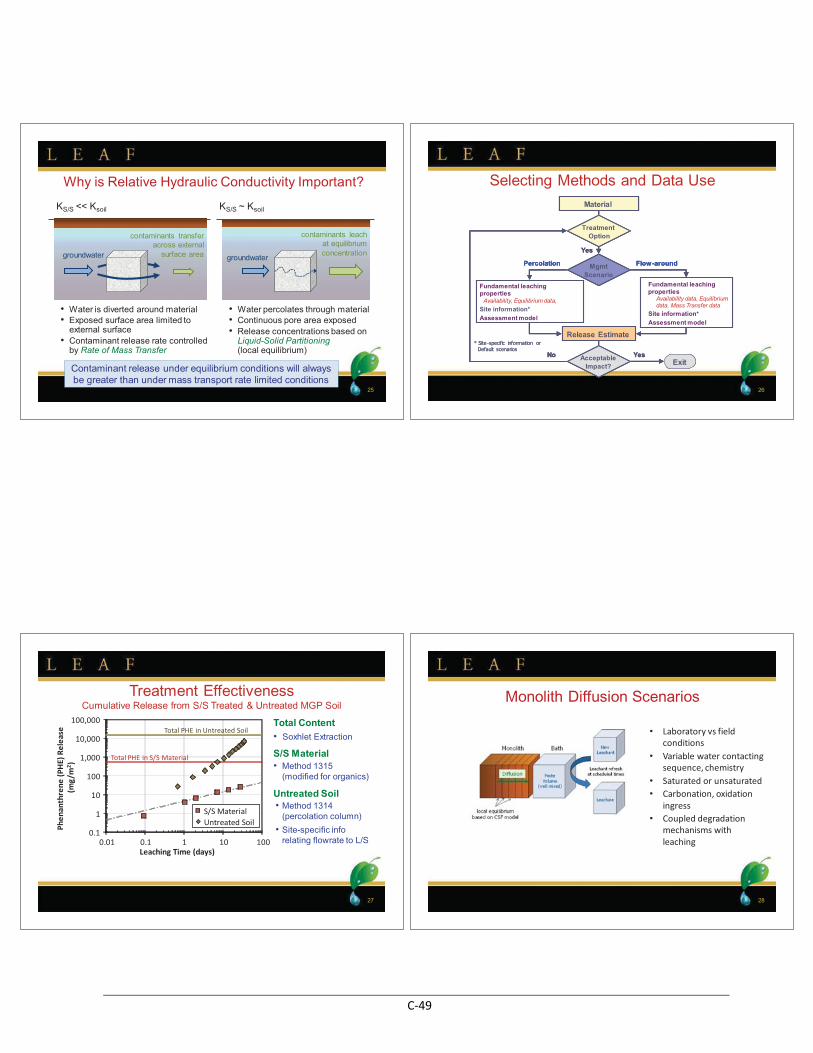
Why is Relative Hydraulic Conductivity Important?
KS/S << Ksoil
� Water percolates through material� Continuous pore area exposed� Release concentrations based on
Liquid-Solid Partitioning(local equilibrium)
KS/S ~ Ksoil
groundwater
contaminants leach at equilibrium concentrationgroundwater
contaminants transfer across external
surface area
� Water is diverted around material� Exposed surface area limited to
external surface� Contaminant release rate controlled
by Rate of Mass Transfer
Contaminant release under equilibrium conditions will always be greater than under mass transport rate limited conditions
25
Selecting Methods and Data Use
AcceptableImpact?
Treatment Option
MgmtScenario
Fundamental leaching properties
Equilibrium dataSite information*Assessment model
Fundamental leaching properties
Availability data, Equilibrium data, Mass Transfer data
Site information*Assessment model
Material
Yes
Release Estimate
ExitYesNo
Flow-aroundPercolation
* Site -specific information or Default scenarios
AcceptableImpact?
Treatment Option
MgmtScenario
Fundamental leaching properties
Equilibrium dataSite information*Assessment model
Fundamental leaching properties
Availability data, Equilibrium data, Mass Transfer data
Site information*Assessment model
Material
Yes
Release Estimate
ExitYesNo
Flow-aroundPercolation
AcceptableImpact?
Treatment Option
MgmtScenario
Fundamental leaching properties
Availability, Equilibrium data, Site information*Assessment model
Fundamental leaching properties
Availability data, Equilibrium data, Mass Transfer data
Site information*Assessment model
MaterialMaterial
Yes
Release Estimate
ExitYesNo
Flow-aroundPercolation
* Site -specific information or Default scenarios
26
Treatment EffectivenessCumulative Release from S/S Treated & Untreated MGP Soil
0.1
1
10
100
1,000
10,000
100,000
0.01 0.1 1 10 100Leaching Time (days)
S/S MaterialUntreated Soil
Total PHE in S/S Material
Total PHE in Untreated Soil
Phen
anth
rene
(PH
E) R
elea
se(m
g/m
2 )
Total Content� Soxhlet Extraction
S/S Material� Method 1315
(modified for organics)
Untreated Soil� Method 1314
(percolation column)
� Site-specific inforelating flowrate to L/S
27
Monolith Diffusion Scenarios
28
� Laboratory vs field conditions
� Variable water contacting sequence, chemistry
� Saturated or unsaturated� Carbonation, oxidation
ingress� Coupled degradation
mechanisms with leaching
C-49
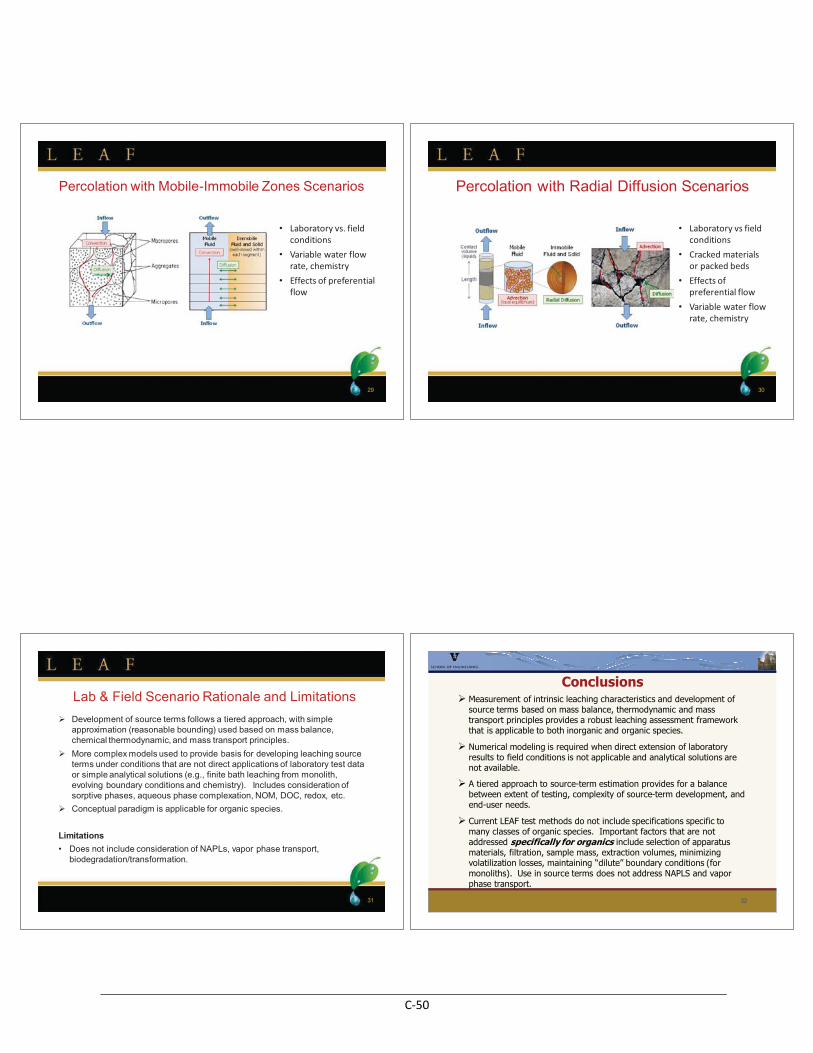
Percolation with Mobile-Immobile Zones Scenarios
29
� Laboratory vs. field conditions
� Variable water flow rate, chemistry
� Effects of preferential flow
Percolation with Radial Diffusion Scenarios
30
� Laboratory vs field conditions
� Cracked materials or packed beds
� Effects of preferential flow
� Variable water flow rate, chemistry
Lab & Field Scenario Rationale and Limitations
� Development of source terms follows a tiered approach, with simple approximation (reasonable bounding) used based on mass balance, chemical thermodynamic, and mass transport principles.
� More complex models used to provide basis for developing leaching source terms under conditions that are not direct applications of laboratory test data or simple analytical solutions (e.g., finite bath leaching from monolith, evolving boundary conditions and chemistry). Includes consideration of sorptive phases, aqueous phase complexation, NOM, DOC, redox, etc.
� Conceptual paradigm is applicable for organic species.
Limitations� Does not include consideration of NAPLs, vapor phase transport,
biodegradation/transformation.
31
Conclusions� Measurement of intrinsic leaching characteristics and development of
source terms based on mass balance, thermodynamic and mass transport principles provides a robust leaching assessment framework that is applicable to both inorganic and organic species.
� Numerical modeling is required when direct extension of laboratory results to field conditions is not applicable and analytical solutions are not available.
� A tiered approach to source-term estimation provides for a balance between extent of testing, complexity of source-term development, and end-user needs.
� Current LEAF test methods do not include specifications specific to many classes of organic species. Important factors that are not addressed specifically for organics include selection of apparatus materials, filtration, sample mass, extraction volumes, minimizing volatilization losses, maintaining “dilute” boundary conditions (for monoliths). Use in source terms does not address NAPLS and vapor phase transport.
32
C-50