working with confidence - home - ge healthcare/media/downloads/uk/product... · · 2012-06-04ge...
TRANSCRIPT

GE Healthcare
Working with confidenceOncology CT Solutions

2 • CT Oncology Solutions
for on
Applications
DetectionTechno
logy
innovation
Ch
GE Healthcare oncology solutions in computed tomography: A continuousengagement for improved lesion management in all workflow steps
Cancer care demands the highest-quality imaging. Quantitative approachessupport assessment of possible lesions, adequate characterization, andtreatment. Equally essential is traceability and automatic quantification of lesion size, especially in patient follow-up. Furthermore, early detectionresults in better therapy decisions and better patient prognosis.
GE Healthcare's wide portfolio of solutions helps you facing these challenges,using dedicated clinical applications validated by experienced physicians.These include solutions for treatment planning in radiation therapy, and the fluoro mode for guiding biopsy and pain relief. In each step of the oncology workflow - detection, characterization, staging, treatment andmonitoring – CT technology delivers precise and accurate information, at low radiation dose, together with the applications that are available inthe Dexus* environment.
CT technology applies from earlydetection to lesion follow-up, including treatment simulationfor radiation therapy planning.Tools include automatated lesiondetection and advanced solutionsderived from spectral imaging for lesion characterization.
Colon VCAR .........................................6LungVCAR............................................6OncoQuant..........................................6SmartView ...........................................7IR .............................................................7Perfusion 4D .......................................7SIM MD..................................................8GSI Viewer ...........................................8
With breakthrough technologythat sets a new standard in CTclarity and low dose, GE oncologysolutions enhance diagnosticimaging, provide new paths toclinical treatment and follow-up,and redefine quality care.
Automate analysis............................4Gemstone & Spectral ......................4Image Quality ....................................4Adaptive imaging..............................5Volume Helical Shuttle....................5Iterative recon....................................5
Detection is the crucial first stepin the oncology workflow, andprecise imaging is essential bothin regular imaging exams and in screening for targeted patientpopulations.

CT Oncology Solutions • 3
Leading solutions cology CT imaging
aracterization
Staging
Treatment Monitoring
Appropriate treatment decisionsdepend on proper lesion characterization, based on mass,morphology, functional responseor a combination.
Tracking the evolution of a diseaseby visualizing and quantifying the efficacy of treatment is a keystep in oncology workflow.
Proper cancer staging helps determine the most effectivecourse of treatment. Quality imaging is critical in characterizingcancer, assessing its progress,identifying metastases, and following changes over time.
CT supports simulation for radiation therapy planning, andpain relief administration in theCT fluoro mode to guide injectionof medications at the exact siteof the lesion.

4 • CT Oncology Solutions
Clinically r in on
CT technology innovation opens new directions in automated and accurate image processing, imagequality, and lesion characterization.
Gemstone*(1)
Spectral Imaging*(1) Image Quality
Automate analysis
Gemstone Spectral Imaginghelps characterize lesions byenabling clinicians to quantifyand separate materials – suchas calcium, iodine and water –
enhancing imagequality, and reducingartifacts from implanted devices.
True High Definition Imaging(1),with new levels of resolution,low-contrast detectability (LCD)and noise reduction, sets anew standard in anatomical visualization, even for the mostchallenging exams, such assmall lesions or low-contrasttissues.
Innovative VCAR (Volume Computer-Assisted Reading)technology fully exploits the power of high-resolutionvolume CT and PET/CT imaging.It’s most advanced forms automate finding, segmentingand measuring pathology in aprecise, repeatable fashion.
Technology
innovation

SYSTEMNOISE
STATISTICS
CT Oncology Solutions • 5
Clinically relevant innovation in oncology CT imaging
Adaptive imaging
Volume Helical Shuttle
IterativeReconstruction
(1) Available on Discovery* CT750 HD(2) May not be available in all markets. 510(k) pending, not commercially available in the US.
REAL 3D SYSTEM OPTICS
SYSTEM NOISE STATISTICS
Advantage* 4D retrospective gatinganalyzes and characterizes the respiration-induced motion of anatomy,providing relevant information on the true shape of anatomical objects.A prospective mode provides a snapshot of the lesion motion in a single image dataset.
Volume Helical Shuttle enables the CT table to travel back and forth incontinuous periodic movements duringthe acquisition. It improves temporalsampling with extended Z-coveragefrom 40 to 312 mm and can minimizeover-scanning, thus reducing dose.
ASiR*ASiR (Adaptive Statistical iterative Reconstruction) is an image recons-truction technique that allows reducingdose by up to 40 percent for whole-body exams while maintaining image quality. In oncology applications, it increases LCD, and suppresses noise withoutdegrading anatomical image integrity.
Veo*(1) (2)Veo, the world's first model-based iterative reconstruction technology,have the potential to change the way physicians use CT imaging. It delivers a combination of high-quality images and low dose that was previously unthinkable.

Imaging solutions for oncology
Dedicated post-processing solutions are available on the Advantage Workstation to cover all applicationsacross the oncology workflow, delivering the advantagesof CT imaging from diagnosis to treatment follow-up.
ColonVCAR(1) LungVCAR OncoQuant
ColonVCAR automatically detects and displays potentialpolyps with 360°virtual auto-dissection of thecolon lumen. It also supports Electronic
Cleansing during review, digitally removing residualmatter for better overall visualization of the colon walland lesion.
LungVCAR automatically detects and displays potentialpulmonary nodules while providing a volumetric assessment at initial and follow-up studies. When usedwith followup examinations,measurements include percentof growth and volume doublingtime. It detects all types of
nodules, including solid, part-solid, or Ground Glass Objects.
The OncoQuant platform provides robust tools for routine oncology diagnosis,treatment follow-up and clinical trial management. It includes a kit of tools to facilitate routine quantification(RECIST 1.0, 1.1 and WHO) andreview of data from CT, MR,PET/CT and 3D X-ray imagingover multiple time points.
6 • CT Oncology Solutions
Applications

Imaging solutions for oncology
SmartView* Integrated Registration
Perfusion 4D
CT Oncology Solutions • 7
SmartView combines advancedfluoroscopy with real time
reconstruction and display. It greatly enhances speed andprovides real-time visualizationfor intricate interventional procedures, such as needlebiopsies and drainage.
Integrated Registration allowseasy comparison of 3D anatomyimages from CT, MRI, PET,SPECT, and Innova* CT. It allowsregistration and fusion betweentwo volumetric acquisitions, and
automatic propagation of registration across series acquired in the same exam.
Perfusion 4D can characterizelesions by perfusion parametersdisplayed in color volumes or in adjacent maps such as BloodVolume, Blood Flow, Mean Transit Time and PermeabilitySurface Index. It provides aquantitative approach to differentiate normal from diseased tissue.
(1) Not available in the US
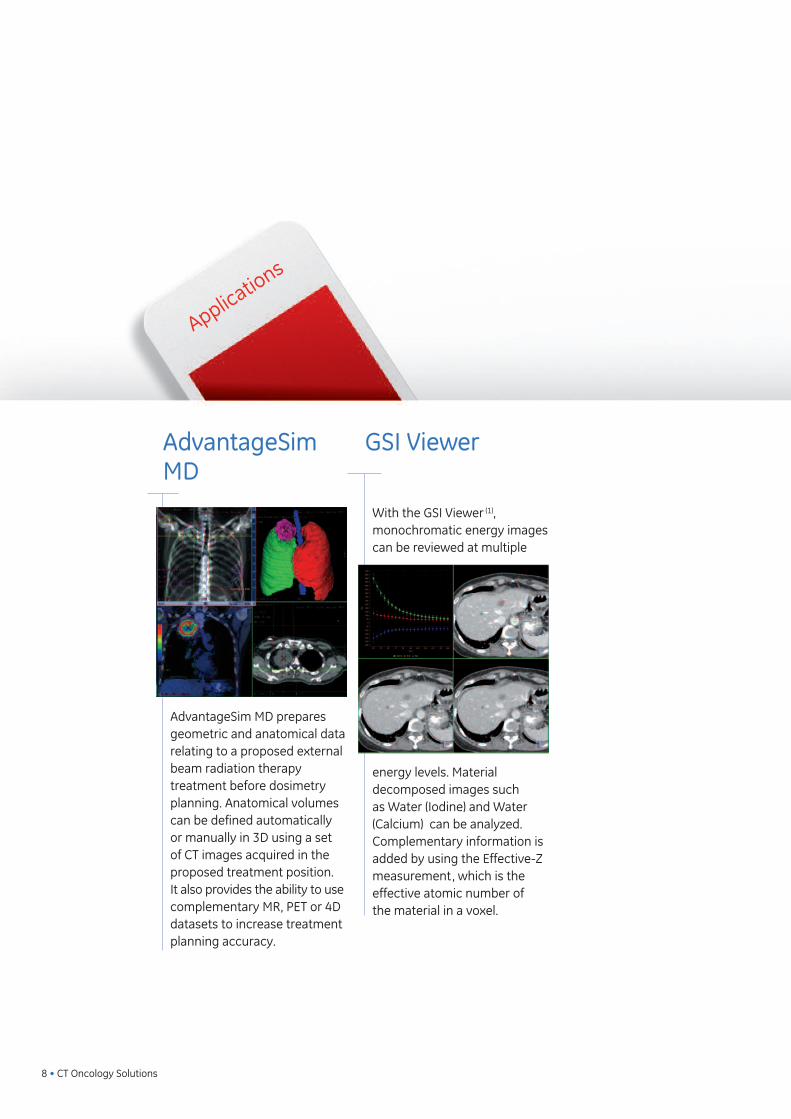
AdvantageSimMD
GSI Viewer
AdvantageSim MD preparesgeometric and anatomical datarelating to a proposed externalbeam radiation therapy treatment before dosimetryplanning. Anatomical volumescan be defined automaticallyor manually in 3D using a setof CT images acquired in theproposed treatment position. It also provides the ability to usecomplementary MR, PET or 4Ddatasets to increase treatmentplanning accuracy.
With the GSI Viewer (1), monochromatic energy imagescan be reviewed at multiple
energy levels. Material decomposed images such as Water (Iodine) and Water (Calcium) can be analyzed.Complementary information isadded by using the Effective-Zmeasurement, which is the effective atomic number of the material in a voxel.
8 • CT Oncology Solutions
Imaging solutions for oncology
Applications

CT Oncology Solutions • 9
Imaging solutions for oncology
Clinical case System Application/technology Page
Polyp detection Discovery CT750 HD ColonVCAR 10
Tumor detection BrightSpeed* Elite ColonVCAR 11
Solid nodules Optima* CT660 LungVCAR 12
GGO lesions Optima CT660 LungVCAR 13
Sessile polyp and tumor Optima CT660 ColonVCAR 14
Pancreas lesion Discovery VCT & Discovery Rx PET/CT Integrated Registration 15
Incomplete optical colonography LightSpeed* VCT ColonVCAR 16
Abdominal tumor GIST CT/MR fusion Integrated Registration 17
Liver lesion Discovery CT750 HD GSI Viewer 18
Metastasis biopsy LightSpeed Xtra SmartView 19
Renal lesion Discovery CT750 HD GSI Viewer 20
Tumor adjacent to hip prosthesis Discovery CT750 HD GSI Viewer 21
Hodgkin Lymphoma PET/CT, MR & CT images Integrated Registration 22
Colonic tumor and liver metastasis Optima CT660 Integrated Registration 23
Prostate tumor RT planning Discovery CT590 RT Sim MD 24
Coeliac plexus palliative neurolysis LightSpeed VCT SmartView 25
Breast tumor RT planning LightSpeed RT16 SIM MD 26
Lung tumor 4D gating Discovery CT590 RT 4D Gating 27
Nodule follow-up Optima CT660 Lung VCAR 28
Left Colic Tumor LightSpeed VCT Onco Quant 29
Liver metastasis anti-angiogenic treatment CT Perfusion Perfusion 4 30
Peritoneal carcinomatosis follow-up Discovery CT750 HD Integrated Registration 31
(1) available on Discovery* CT750 HD

10 • CT Oncology Solutions
� Patient HistoryFemale patient who underwent a first optical colonoscopythat showed a lesion in the hepatic flexure that couldnot be resected during optical colonoscopy. She wasthen referred to a second invasive colonoscopy that revealed a lesion in the splenic flexure which could alsonot be excised during colonoscopy. Patient was eventually referred to a CT Colonoscopy for surgical planning.
� Technique• Scanner: Discovery CT750 HD• 100 kV, 20-25 mA• 1.375 pitch (430 mm coverage)• ASiR reconstruction
� FindingsA polypoid was discovered in the transverse colon, and was later confirmed by surgery.
“ ConclusionOn this patient, the CT Colonoscopy provided the rightinformation for an accurate diagnosis. Additionally, the GE Discovery CT750 HD system and ASiRreconstruction allowed us to drastically reduce the dose down to 1.1mSv (2) for this CT Colonoscopy exam. ”(2) Dose conversion obtained from EUR-16262 EN with abdomenfactor of DLP*0.015 and a pelvis factor of DLP*0.019
Polyp detection
Dr V Barrau • Centre Cardiologique du Nord • Saint Denis, France
ColonVCAR
(1)
CASE
Combination of Auto-dissection of lumen viewwith electronic cleansing allows precise visualizationof the lesion. ASiR allowsdriving dose down to 1.1 mSv(2) for this procedure.
Oblique view Navigator view
Virtual dissection

CT Oncology Solutions • 11
Dr JM Sverzut • Clinique du Landy • Saint Ouen, France
� Patient HistoryPatient with history of familial polyposis and with partial colectomywas referred for colonic study.
� Technique• Scanner: BrightSpeed* Elite• 120 kV, 40-60 mAs• 1.375 pitch, 1.25 mm slice thickness, 0.5 sec scan rotation (375 mm coverage)• The CT Colonography exam was performed in supine and prone position with rectal insufflation of CO²• Gastrografin oral contrast was administered to increase the contrast between polyps and stool.
� Findings5 sessile polyps were depicted in ascending colon. Adenocarcinomawas found in sigmoid colon, measuring 25 mm x 12 mm. A lesion reducing lumen was also depicted at the sigmoid junction. Lobulated polyp was located in the caecum (40 mm x 31 mm).
“ ConclusionCT Colonography depicts accurately the location of multiple sessilepolyps in the ascending colon. Detailed study of colonic lesions are reported by using views correlated to 2D & 3D imaging. Electronic cleansing is applied for a thorough assessment. ”
Tumor detectionColonVCAR
(1)
CASE
The ability to reviewimages in both 2D and 3D views provides appropriate condition forlesion detection.
Lobulated polyp Sessile polyp n°1 Sessile polyp n°2
Adenocarcinoma
(1) Not available in the US

� Patient HistoryPatient was referred for a Chest CT Scan because of weight loss and persistent mucous cough.
� Technique• Scanner: Optima* CT660 (2)
• 120 kV, 90-150 mAs (mA modulation) • 0.984 pitch (330 mm coverage)• ASiR reconstruction • Radiation dose: 4.1 mSv (1)
(DLP=298 mGy.cm)
� Findings2 solid nodules were found in the Superior
right lobe, 2 other solid nodules were found in the left lung.
“ ConclusionOn this patient, Lung VCAR software allowed a fast study of themultiple nodules found. ”(1) Dose conversion obtained from IRCP with Chest factor of DLP*0.014 (2) May not be available in all markets. 510(k) pending, not commercially available in the US.
Solid nodules
Dr C Jardin • Centre Cardiologique du NordSaint Denis, France
LungVCAR
CASE
12 • CT Oncology Solutions
Automatic lesions detectionand segmentation allowfast and accurate diagnosisat low dose by using ASiR protocols.
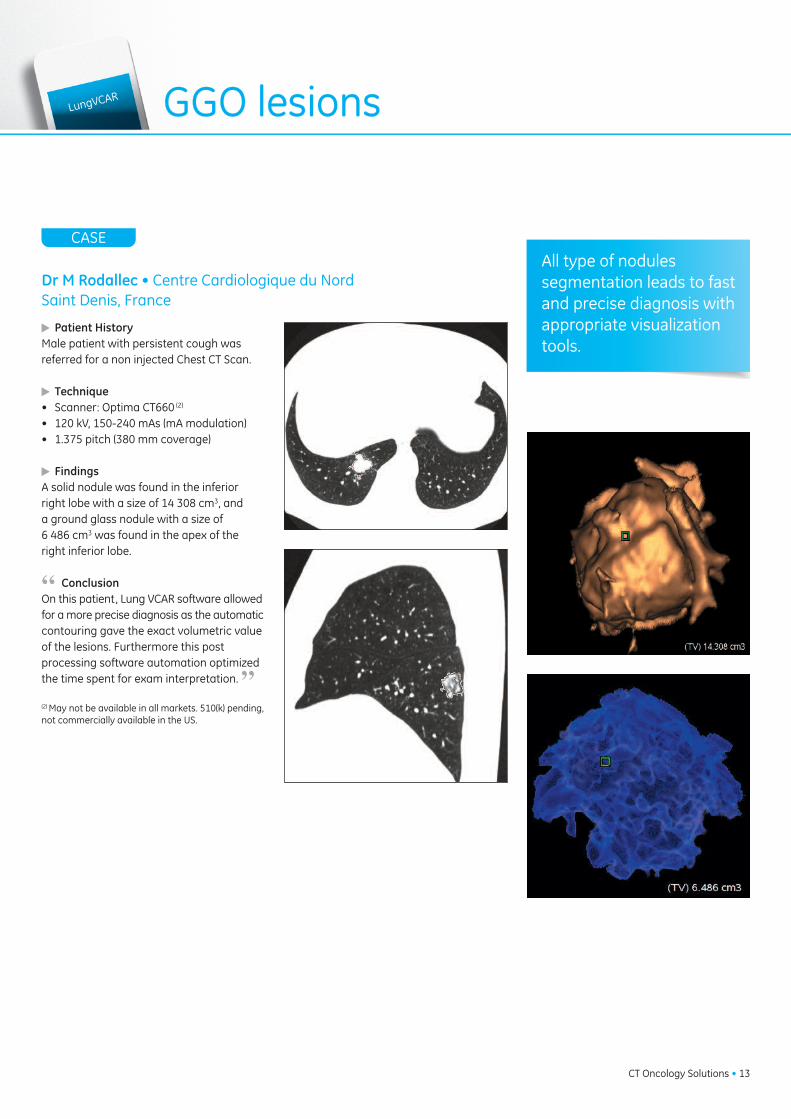
Dr M Rodallec • Centre Cardiologique du NordSaint Denis, France
� Patient HistoryMale patient with persistent cough was referred for a non injected Chest CT Scan.
� Technique• Scanner: Optima CT660 (2)
• 120 kV, 150-240 mAs (mA modulation) • 1.375 pitch (380 mm coverage)
� FindingsA solid nodule was found in the inferiorright lobe with a size of 14 308 cm3, and a ground glass nodule with a size of 6 486 cm3 was found in the apex of the right inferior lobe.
“ ConclusionOn this patient, Lung VCAR software allowedfor a more precise diagnosis as the automatic contouring gave the exact volumetric valueof the lesions. Furthermore this post processing software automation optimizedthe time spent for exam interpretation. ”(2) May not be available in all markets. 510(k) pending,not commercially available in the US.
GGO lesionsLungVCAR
CASE
CT Oncology Solutions • 13
All type of nodules segmentation leads to fastand precise diagnosis withappropriate visualizationtools.

� Patient HistoryElderly patient was referred foranemia assessment.
� Technique• Scanner: Optima CT660 (2)
• 120 kV, 53-59 mAs (mAmodulation)
• 1.375 pitch – 0.5 sec scan rotation (388 mm coverage)
• Supine and prone position • CTC acquisition with rectal insufflation of CO²• Gastrografin oral contrast agent taken for its differen- tiated attenuation properties between polyps and stool.
� FindingsAdenocarcinoma of 34x20 mm was found in the proximal sigmoid. Sessile polyp was measured at 8 mmdiameter in the caecum.
“ ConclusionCT Colonography with fluid tagging CO² showed clearlysessile polyp and tumor. Correlated views and synchronized supine and prone series allowed a detailedassessment of colonic study from rectum to caecum.Exceptional image quality was obtained with optimizedlow dose parameters. ”
Sessile polyp and tumor
Dr JM Sverzut • Clinique du Landy • Saint Ouen, France
ColonVCAR(1
)
CASE
14 • CT Oncology Solutions
Sessile polyp measurement Bookmarked lesion
Endo luminal view Oblique view
Prone and supine seriessynchronization combinedwith autodissection provides adequate visualization for lesions characterization.
(1) Not available in the US (2) May not be available in all markets. 510(k) pending, not commercially available in the US.

Dr T Hany • Head of the PET/CT Section University Hospital • Zurich, Switzerland
� Patient HistoryMale – 182 cm – 63 kg • Jaundice with unclear mass in pancreatic head• EUS & FNA: Adenocarcinoma of the pancreatic head• Insertion of a biliary plastic stent for drainage• Suspicion of liver metastases in segment VIIIReferred for 18F-FDG PET/CT for stagingand exclusion of liver metastases.
� Technique• Scanner: Discovery VCT & Discovery Rx PET/CT• PET acquisition: whole body acquisition• Static Acquisition time: 1min30 per bed position• Post-injection time: 43 min• Dose: 389 MBq of 18F-FDG• CT acquisition: Whole-body acquisition for localization and attenuation purpose• Contrast-enhanced acquisition of the abdominal region (parameters of acquisition)
� FindingsNon-enhanced PET/CT:The study showed a clear lesion in the head of the pancreas with anadjacent plastic stent. No conclusion could be made on the possibleinfiltration of the arterial or venous vasculature. A non 18F-FDG avid liver lesion in segment VII could be seen whichmade liver metastases very unlikely.
Contrast-enhanced PET/CT: Arterial Phase: Clear separation between tumor and arterial vasculature of the hepatic artery.Porto-venous Phase: No exclusion of porto-venous system infiltration was possible. The liver lesion in segment VII was clearly enhanced from the outside which is typical of a hemangioma (non malignant).
“ ConclusionIntegrated Registration software allowed a very fast and perfectmerge of multi modality volumes. ”
Pancreas lesion Integrated
Registration
CASE
CT Oncology Solutions • 15
Fusion of images from different techniquesprovides enhanced diagnosis and efficientcharacterization.
Non contrast-enhanced fused PET/CT views showing the pancreatic lesion adjacent to the biliary plastic stent and a non 18F-FDG avid liver lesion
Contrast-enhanced fused PET/CT views at arterial phase and porto-venous phase,respectively.
Volume rendered images of the pancreatic head tumor helping surgeons visualizethe tumor localization in 3D
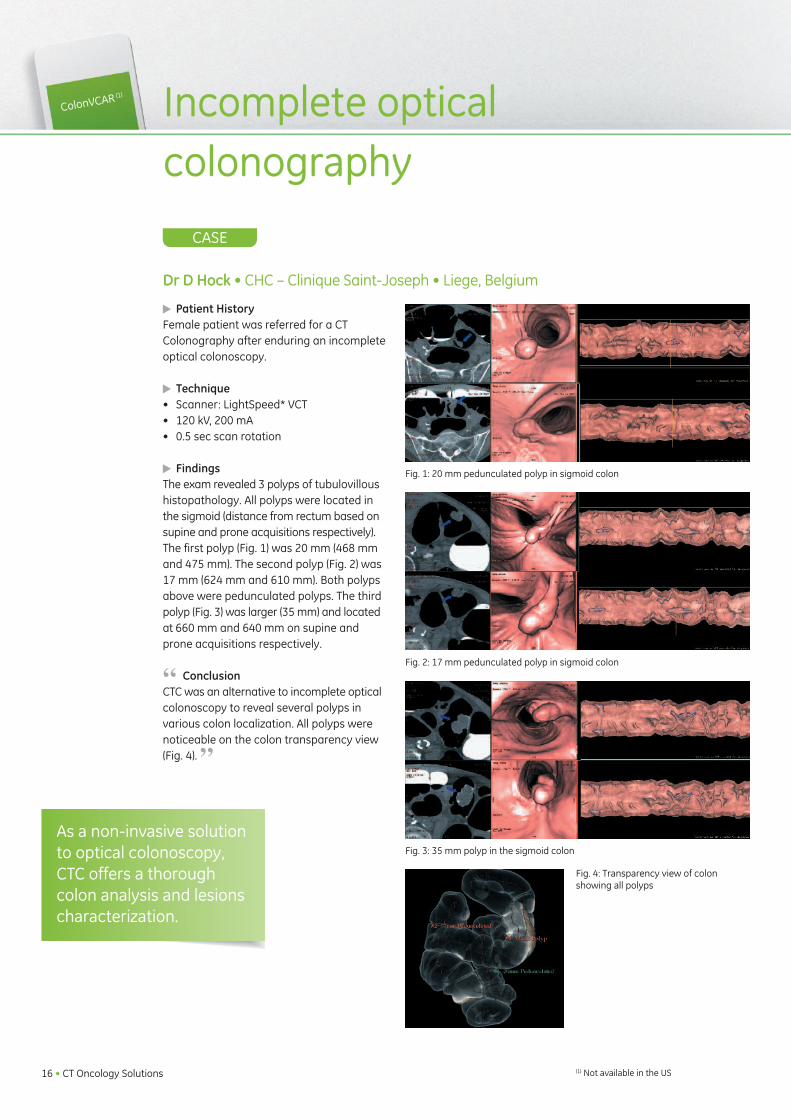
� Patient HistoryFemale patient was referred for a CT Colonography after enduring an incompleteoptical colonoscopy.
� Technique• Scanner: LightSpeed* VCT• 120 kV, 200 mA • 0.5 sec scan rotation
� FindingsThe exam revealed 3 polyps of tubulovilloushistopathology. All polyps were located inthe sigmoid (distance from rectum based onsupine and prone acquisitions respectively).The first polyp (Fig. 1) was 20 mm (468 mmand 475 mm). The second polyp (Fig. 2) was17 mm (624 mm and 610 mm). Both polypsabove were pedunculated polyps. The thirdpolyp (Fig. 3) was larger (35 mm) and locatedat 660 mm and 640 mm on supine andprone acquisitions respectively.
“ ConclusionCTC was an alternative to incomplete opticalcolonoscopy to reveal several polyps in various colon localization. All polyps werenoticeable on the colon transparency view(Fig. 4). ”
Incomplete optical colonography
Dr D Hock • CHC – Clinique Saint-Joseph • Liege, Belgium
ColonVCAR(1
)
CASE
16 • CT Oncology Solutions
As a non-invasive solutionto optical colonoscopy,CTC offers a thoroughcolon analysis and lesionscharacterization.
Fig. 1: 20 mm pedunculated polyp in sigmoid colon
Fig. 2: 17 mm pedunculated polyp in sigmoid colon
Fig. 3: 35 mm polyp in the sigmoid colon
Fig. 4: Transparency view of colon showing all polyps
(1) Not available in the US

Dr V Servois • Curie Institute - Department of Radiology • Paris, France
� Patient HistoryYoung patient with suspicion of primary ovarian mass.
� Technique• CT/MR fusion using Integrated Registration
� FindingsCT Abdomen/Pelvis baseline - with ovarian mass Pelvic MRI with Diffusion showing hotspots in ovarianmass and left colon.
“ ConclusionImages 1 & 2 - CT fused with MR DWI with hot iron coloroverlay. Image 3 – MR T2 fused with MR DWI Low Diffusion area was present in the left colon with noabnormal findings on CT. Surgery confirmed a primarycolon carcinoma with ovarian metastasis.”
Abdominal tumorGIST
Integrated
Registration
CASE
CT Oncology Solutions • 17
The enhanced CT/MR fusion capabilities of Integrated Registration increases the radiologistconfidence for making a diagnosis.
Image 1 Image 2
Image 3

Liver lesion
Dr Vaudano • San Giovanni Bosco • Torino, Italy
GSI Viewer
CASE
18 • CT Oncology Solutions
� Patient HistoryElderly man with melanoma undergoes a 3 phase Abdomen Pelvis CT exam.
� Technique• Scanner: Discovery CT750 HD
• Fast kVp switching Gemstone Spectral Imaging technique (GSI) was performed to improve iodine conspicuity.
� FindingsThe conventional 120 kVp images showed a non-specificmass on the upper part of the liver.By lowering the energy level on the monochromaticimages it became evident that this lesion had a ringshaped enhancement which suggested a malignant lesion.
“ ConclusionOn this patient, the GSI’s capability to reduce the energylevel on the images to increase iodine conspicuity enabled the radiologist to better characterize this malignant liver lesion. ”
Iodine based images with color coding Spectral HU Curve
59 keV Monochromatic ImageConventional image
Spectral imaging allows better lesion differentiationfor more precise findings in liver disease.

Dr V Vandenbroeck • CH Hornu - Frameries, Belgium
� Patient HistoryElderly female patient with low back pain and no previous history of cancer.
� Technique• Scanner: LightSpeed Xtra• 120 kV, 425 mA• 0.6 sec - HE+ 11.5 mm/rot• 1.25mm / 0.9 space• Fluoro mode with SmartView application
� FindingsDiagnostic CT revealed a lytic lesion in the right ilium,suggestive of metastasis.
“ ConclusionBiopsy of the lesion was performed for tissue analysis,using the real time fluoro mode. CT fluoroscopy enablea precise, quick and safe direct approach of the lesionin a 10 minutes procedure. Anatomopathology studyrevealed a primary breast cancer. ”
Metastasis biopsySmartView
CASE
CT Oncology Solutions • 19
Speed and accuracy ofSmartView applicationsallow biopsy of lesionusing CT fluoro-mode.

Renal lesion
Pr C Roy • Civil Hospital • Strasbourg, France
GSI Viewer
CASE
20 • CT Oncology Solutions
� Patient HistoryElderly male patient with cancer undergoes a 3 phaseAbdomen Pelvis CT exam.
� Technique• Scanner: Discovery CT750 HD• Fast kVp switching Gemstone Spectral Imaging technique (GSI) was performed to improve iodine conspicuity.
� FindingsThe standard images, close to 120 kVp images attenuationshowed an old calcified cyst in the right kidney. An undetermined mass had grown next to the calcified cyst.A color coded mapping of the Iodine images indicates anenhancement of the undetermined mass. Furthermore, a3 mg/cc iodine concentration was found on this lesionthus confirming the malignant nature of this lesion.
“ ConclusionOn this patient, the GSI’s capability to create Iodinebased Images and to evaluate Iodine quantification in the tissues enabled the radiologist to have a bettercharacterization of this renal malignant lesion. ”
Iodine Based Images with Colour Overlay Spectral HU Curve
60 keV Monochromatic ImageConventional image
Spectral imaging with GSI viewer allows lesion differentiation for precisediagnosis in kidney disease.

Dr JL Sablayrolles • Centre Cardiologique du Nord • Saint Denis, France
� Patient HistoryElderly female patient with thyroid cancer is referred fora Pelvis CT Scan to follow bony metastasis of the right hip.
� Technique• Scanner: Discovery CT750 HD• The first CT exam was performed using a single energy acquisition.• The second CT scan was performed using the Gemstone Spectral Imaging acquisition with the use of Metal Artifact Reduction Algorithm.
� FindingsOn the first CT scan a bony metastasis was found butthe metal artifacts from the hip prosthesis did not allowthe radiologist to get a correct measurement of its size.The second CT scan with Metal Artifact Reduction Algorithm allowed a better visualization of the metastasisthus providing a more precise measurement of the lesion.
“ ConclusionOn this patient, the Gemstone Spectral Imaging and itsMetal Artifact Reduction capabilities allowed the radiolo-gist to better visualize and measure a bony metastasisclose to the prosthesis.”
GSI Viewer Tumor adjacent to hip prosthesis
CASE
CT Oncology Solutions • 21
Spectral imaging providesMetal Artifact Reductioncapabilities that allow tobetter visualize structuresadjacent to prosthesis.
Single Energy Acquisition
Single Energy Acquisition
Spectral Imaging Acquisition with MARS
Spectral Imaging Acquisition with MARS

Hodgkin Lymphoma
Policlinico di Monza •Monza, Italy
Integrated Registration
CASE
22 • CT Oncology Solutions
The enhanced fusion capability of IntegratedRegistration between CT and MR increases diagnosis accuracy.
� Patient HistoryYoung male patient with biopsy proving Hodgkin Lymphoma was submitted to PET/CT for staging.PET/CT revealed multiple pathological uptake areas located in the lymph nodes of the neck, the mediastinumand the abdomen; pathological tracer uptake was alsopresent in the liver and in the lungs.Bone Marrow Biopsy was positive for Hodgkin disease.Final Clinical Stage: IV B.
� Technique• PET/CT, MR & CT images analyzed with Integrated Registration software, matching automatically all multi modality datasets.
� FindingsThe patient was then submitted to chemotherapy andthe response to treatment was assessed by PET/CTafter 4 treatment cycles.Compared to the baseline study the followup PET/CTexam showed a complete regression of the pathologicalfindings, but a new unexpected one was detected easilyusing Integrated Registration: an intense uptake of thetracer in the 3rd sacral vertebra (Image 2 & 3), withoutany anatomical bone abnormality on CT (Image 1).
Because all previous findings had regressed, and becausePET/CT scan had not shown pathological uptake in thesacrum in the baseline, this finding was consideredquite unusual (persistence of disease in a previouslyPET/CT negative site). Further evaluation by MRI showedan abnormal T1 signal in the right part of the third sacral vertebra, matching well with PET/CT finding. Biopsy was performed. The result was positive for HodgkinLymphoma bone marrow infiltration, and the patient wasthen submitted to a second line chemotherapy.
“ ConclusionIn this case metabolic imaging detected the persistenceof bone marrow infiltration; MRI was of help as it confirmed the abnormal finding of PET/CT (Image 2 & 3);Interestingly the CT part of PET/CT was completely normal (no anatomical abnormality on Image 1), underlining the better accuracy of metabolic imaging inthe management of this patient. As known, a PET positive study after treatment in HodgkinLymphoma is a bad prognostic factor and it was unfortunately confirmed for this patient who experienceddisease progression also after chemotherapy. ”
Image1 CT Image 2 PET/CTIntegrated Registration
Image 3 PET/MRIntegrated Registration

Dr V Barrau • Centre Cardiologique du Nord • Saint Denis, France
Integrated Registration Colonic tumor and liver metastasis
CASE
CT Oncology Solutions • 23
The enhanced fusion capability of Integrated Registration between CT, MR and PET CT brings confidence to the radiologistfor diagnosis setting.
� Patient HistoryElderly patient was referred for colonic tumor. and known secondary lesions assessment.
� Technique• Scanner: Optima CT660 (2)
The abdomen pelvis CT exam was performed to assess the extent of colonic cancer and metastasization. • 120 kV, 120-240 mAs• 0.984 pitch - 509 mm coverage• ASiR reconstruction for abdomen pelvis scan • Radiation dose 8.7mSv (1) (DLP=511 mGy.cm)
� FindingsTumor of left colic flexure, lesion was perforated with peripheral abscess of 7 cm x 3.4 cm. Extension of 2 hepatic lesions were slightly growing.
“ ConclusionCT exam was compared to MRI and previous PET/CT,allowing accurate and clear location and assessment of the hepatic matastisis. ”(1) Dose conversion obtained from EUR-16262 EN with abdomen factor of DLP*0.015 and a pelvis factor of DLP*0.019(2) May not be available in all markets. 510(k) pending, not commerciallyavailable in the US.
Integrated registration CT / MR
Hepatic lesion segmentation Left colic flexure

Prostate tumor RT planningSim MD
24 • CT Oncology Solutions
Dr C Scrase • The Ipswich Hospital NHS Trust • Ipswich, UK
� Patient HistoryElderly patient diagnosed with local advanced prostate cancer, T3b Gleason 7with seminal vesicle involvement. Prostateimplanted with gold seeds to facilitate lesion localization during treatment.
� Technique• Scanner: Discovery CT590 RT• Helical mode, 2.5 mm slices• 120 kV, SmartmA* 50-450 mA• Reconstructed with 40% ASiR algorithm• DLP = 748.75 mGy.cm
� Findings Prostate and seminal vesicles could be seenon the CT scan. Artefacts from the goldseeds were acceptable. The ASiR algorithmreduced the image noise, enabling the clinician to distinguish between tumor volume and healthy tissue. The target volume was contoured and beam placementcould be estimated virtual simulation.
CASE
CT acquisition with ASiRprovides precise and quantitative information for RT planning simulationincluding lesion contouringand beam placement.

Coeliac plexus palliative neurolysis
SmartView
CT Oncology Solutions • 25
Dr H Brat • CH Hornu - Frameries, Belgium
� Patient HistoryMale patient with invasive pancreas cancer addressedfor abdominal pain resistant to alkaloid narcotic drugs.Palliative coeliac neurolysis using alcohol is performedfor pain relief.
� Technique• Scanner: LightSpeed VCT• Helical mode • 120 kV, 60 mA - 0.5 sec• 1.25mm / 0.6mm space- HE+ 27.5 mm/rot• Fluoro mode using Smartview application
� Findings CT fluoroscopy enables millimetric targeting and quickpositioning of needle tip, avoiding pleural recess, leftkidney and aortic accidental puncture. Local contrastmedia injection confirms extra-vascular needle positioning. Alcohol injection shows successful diffusionof contrast media and medication.
CASE
Precision of SmartViewapplication allows comfort and efficiency forpain relief intervention.

Breast tumor RT planning SIM MD
Dr P Fenoglietto • CRLC Val d’Aurelle • Montpellier, France
� Patient HistoryFemale patient with right side breast cancer and nodes involvement.
� Technique• Scanner: LightSpeed RT16
• Helical mode • 120 kV, 148-350 mA• 372 mm coverage• Dose: CTDI 21.6 mGy - DLP 864 mGy.cm
� Findings With the large bore opening, patient datacould be acquired in treatment position. Virtual simulation was realized with the patient on the table and the representationof the beams on the patient's skin matched perfectly the 3D display.
CASE
26 • CT Oncology Solutions
Beams projection on the real patient Beams projection on the virtual patient
Beams display on an axial patient slice Patient image in an extended FOV of 64 cm
CT wide bore technologyallows acquisition in treatment position forprecise and reproduciblecondition for RT simulation planning.

Lung tumor 4D gating
4D Gating
J Cuijpers, J Zindler, N Haasbeek • VU University Medical Center Amsterdam, The Netherlands
� Patient HistoryInoperable elderly female with St I T2N0M0NSCLC in the left lung. Treatment with stereotactic body radiothe-rapy (5 fractions of 11Gy prescribed at the80% isodose).
� Technique• Scanner: Discovery CT590 RT• 140 kVp, 70 mAs• Retrospectively gated 4DCT, axial cine acquisition, gantry rotation speed 0.5s with segment reconstruction, cine time between images 0.35s, cine duration 4.5s.
� Findings Respiratory tumor motion of 20 mm peak to peak, residing for more than 50% of thetime at end-expiration. Target volume sizebased on maximum intensity projection was104 cc. Using information from probabilitydensity function of breathing motion as determined from the 4DCT, target volumesize for treatment could be reduced to 80 cc.
CASE
CT Oncology Solutions • 27
Average Intensity Projection
Maximum Intensity Projection
10 phases of breathing cycle
4D gating is essential for a precise and accurate visualization of the lunglesion to help optimizethe RT treatment volume.

Nodule follow-up Lung VCAR
Dr M Rodallec • Centre Cardiologique du Nord • Saint Denis, France
CASE
28 • CT Oncology Solutions
By featuring comprehensivenodule segmentation andlesion propagation overmultiple exams LungVCARfacilitates the diagnosis andthe quantification of diseaseprogression.
� Patient HistoryPatient was referred for an injected Chest CT scan for lung lesions follow-up 3 months after the first CT toassess chemotherapy efficiency.
� Technique• Scanner: Optima CT660• 120 kV, 90-150 mAs mA modulation• 0.984 pitch (340 mm coverage)• ASiR image reconstruction• Radiation dose 5.2 mSv (1) (DLP=370mGy.cm)
� FindingsThe solid nodule showed a significant decrease in sizewhereas the ground glass nodule appeared to be stablecompared to the initial exam.
“ ConclusionOn this patient, Lung VCAR software allowed for a muchquicker follow-up of the lung nodules. The software wasable to propagate the 2 initial lesions on the latest exam,which optimized significantly the processing time.Additionally, the GE Optima CT660 (2) system with ASiRand 3D dose modulation provided excellent image quality at lower dose. ”(1) Dose conversion obtained from IRCP with Chest factor of DLP*0.014(2) May not be available in all markets. 510(k) pending, not commercially available in the US.

OncoQuant
CT Oncology Solutions • 29
� Patient HistoryFemale patient, abdominal occlusion withleft colic tumor (PT4 N2 M1), 1 biliary cyst insegment VI-VII, and no liver metastasisfound on the first CT (Image 1).
� Technique• Scanner: LightSpeed VCT• Abdominal CT after contrast on portal phase. • Follow-up after chemotherapy.
� Findings1st Follow-up: 4 months & 6 chemotherapycycles Folfox & Avastin (Bevacizumab)First liver metastasis found in segment IV(Image 3a). CT also showed carcinomatosis in peritoneal gut. (Image 4a)
2nd Follow-up: 7 months & new chemotherapycycle Folfiri & Avastin (Bevacizumab)Increase of the diameter and volume of thelesion. (Image 3b)
3rd Follow-up: 14 months & new chemotherapycycle Folfiri, Avastin & Erbitux (Cetuximab)Reduction of both diameter and volume of the lesion (NADIR). (Image 3c)
4th Follow-up: Again, increase of the lesionsize of segment IV. (Image 3d)A second lesion appeared in segment V-VI,and we could notice an increase of carcino-matosis spread in the abdomen (Image 4b).
“ ConclusionOncoQuant software greatly helped volumeand 2D-max diameter follow-up, highlightingthe nadir. It was also time saving for decisionmaking. Multi-modality exams and multipledates were loaded and compared at thesame time. A very clear summary was givenin the table of results (Image 2). ”
Image 1
Image 2
Image 3a Image 3b
Image 3c Image 3d
Image 4a Image 4b
Left Colic Tumor
Dr I Boulay • Hôpital Saint-Joseph • Paris, France
CASE
OncoQuant registrationand tumor comparisonover multiple exams helpidentify the best tumorresponse and increasediagnosis efficiency andconfidence.

Liver metastasis anti-angiogenic treatment
Perfusion 4
Dr D Buthiau • Neuilly sur Seine, France
� Patient HistoryMid-age patient – Renal adeno-carcinoma with concomitant hepatic metastasis. Despite the complementary treatment (immuno-chemotherapy), the patient's condition worsened, with a major hepatic metastatic evolution (Fig. 1) and nodular pulmonary lesions. She was then enrolled in a clinical research protocol to undergo anti-angiogenic treatment.
� Technique• CT Perfusion: 80 kV and 180 mA• Iodinated contrast medium 300-370 mgl/ml-strength • Low contrast volume: 0.5ml per kg of body weight• Low injection rate 4cc/sec
� FindingsThe patient received three treatments (one per month). CT Perfusion evaluationwas performed every two months. After thefirst two treatments, a collapse of blood volumes and flow rates, and of the AUC, wasobserved at the lesion periphery while thesize of the tumor remained constant, basedon RECIST criteria (Figs. 1 and 2). Again 2months later, CT Perfusion evaluation sho-wed an almost complete obliteration of theangiogenesis and a sharp reduction of the
AUC, with a nearly flat curve. Nevertheless, the tumor size remainedunchanged, with no reduction or change in the RECIST criteria (Fig. 3).
“ ConclusionWithout CT perfusion, the patient would have been removed from theprotocol because, based on traditional monitoring criteria, the patientwould have been considered as non-responding.”
CASE
30 • CT Oncology Solutions
CT Perfusion brings additional information in treatment efficiency assessment based on quantitative and differentiating values at reasonable dose.
Fig1: CT perfusion of the major hepatic metastaticevolution and representation by native CT slices, andcurves with calculation of AUCs and of blood flows(BF) and blood volumes (BV).
Fig2: Following one to two treatments, while the sizeof the lesion remains identical based on RECIST criteria, a significant reduction of the tumor AUC, and of BVand BF rates, is observed.
Fig3: Two months later, all blood flow parameters havecollapsed, with almost complete disappearance of theneogenesis, while the tumor size and volume remainunchanged.

Integrated
Registration
CT Oncology Solutions • 31
Dr M Rodallec & Dr V Barrau • Centre Cardiologique du Nord • Saint Denis, France
� Patient HistorySenior man with peritoneal carcinomatosis from colon cancer.Follow-up exam 4 months after chemotherapy treatment.
� Technique• Scanner: Discovery CT750 HD• The first CT exam was performed on the Discovery CT750 HD • The second one was performed on the Optima CT660 (2)
• In both acquisitions the patient could benefit from low dose protocols as both systems have ASiR implemented.
(2) May not be available in all markets. 510(k) pending, not commercially available in the US.
� FindingsThe first CT scan demonstrated peritoneal carcinomatosis,with high signal intensity on weighted diffusion imagesand restricted ADC (0.8 x 10 –3 mm²/second). The follow-up examination showed a slight decrease ofthe mass and a significant decrease of the signal intensityof weighted diffusion images as well as an increase ofCDA (1.7 x 10⁻³ mm²/second), presumably due to theregression of cellularity of the lesion.
“ ConclusionOn this patient, the post processing tools used to combine CT and MR series allowed us to fuse a diffusionsequence with a CT portal phase thus increasing theconfidence in our diagnosis. ”
Diffusion sequence - Follow-Up n°1 CT/MR fused images highlighting the peritoneal mass
Diffusion sequence - Follow-Up n°2 CT Portal phase - Follow-Up n°2
Peritoneal carcinomatosis follow-up
CASE
The enhanced fusion capability of IntegratedRegistration between CTand MR brings confidenceto the radiologist for diagnosis setting.
GE imagination at work© Copyright GE Healthcare – 11605-BE
Data subject to change.Marketing Communications GE Medical SystemsSociété en Commandite Simple au capital de 63.875.865 EurosRCS Versailles B 315 013 359A General Electric company, doing business as GE Healthcare
*Trademarks of General Electric Company
FranceParisFax: +33 (0) 1 30 70 94 35
JapanTokyoFax: + 81-3-3223-8524
SingaporeFax: +65 62917006
USAMilwaukeeFax: + 1-262-521-6123
About GE Healthcare
GE Healthcare provides transformational medical technologies and services that are shaping a new age ofpatient care. Our broad expertise in medical imaging andinformation technologies, medical diagnostics, patientmonitoring systems, drug discovery, biopharmaceuticalmanufacturing technologies, performance improvementand performance solutions services help our customersto deliver better care to more people around the world at a lower cost. In addition, we partner with healthcare leaders, striving to leverage the global policy change necessary to implement a successful shift to sustainablehealthcare systems.
Our “healthymagination” vision for the future invites the world to join us on our journey as we continuouslydevelop innovations focused on reducing costs, increasingaccess and improving quality around the world. Headquartered in the United Kingdom, GE Healthcare is a unit of General Electric Company (NYSE: GE). Worldwide,GE Healthcare employees are committed to servinghealthcare professionals and their patients in more than100 countries. For more information about GE Healthcare,visit our website at www.gehealthcare.com.
GE HealthcareChalfont St.Giles,Buckinghamshire,UK