working paper series · working paper series . determinants of sub-sovereign ... responsibility is...
TRANSCRIPT
Working Paper Series Determinants of sub-sovereign bond yield spreads: the role of fiscal fundamentals and federal bailout expectations
Roland Beck, Gianluigi Ferrucci, Arno Hantzsche, Matthias Rau-Goehring
Note: This Working Paper should not be reported as representing the views of the European Central Bank (ECB). The views expressed are those of the authors and do not necessarily reflect those of the ECB.
No 1987 / December 2016
Abstract This paper investigates to what extent yield spreads on bonds issued by sub-sovereign entities within
federations are driven by bailout expectations and investors’ risk appetite, as opposed to fundamental
values related to default risk. The question is analysed both across and within federations using a
novel dataset for sub-sovereign governments that includes Australian states, Canadian provinces,
Swiss cantons, German Länder, US states, Spanish communities, and Indian states. The paper finds
that, regardless of the prevailing set-up of the federal system, sub-sovereign debt levels relative to
GDP and global risk aversion are important drivers of sub-sovereign spreads. Moreover, within
federations, the market’s expectation of a federal bailout of the sub-sovereign entity and the capacity
of the federal government to provide support to the weaker members of the federation affect the extent
to which fundamental factors are priced into spreads. In particular, the paper shows that the positive
link between debt and risk premia tends to break down when sub-sovereign government debt rises
above certain thresholds. This could reflect the market’s expectation of a federal bailout as
fundamentals deteriorate. Additionally, larger sub-sovereign entities tend to pay higher premia as
fundamentals worsen which could be linked to the limited capacity of the federal government to
provide support as the size of the expected bailout increases. A pattern of rising risk premia as
fundamentals worsen is also found for sub-sovereign entities when the central government faces
borrowing constraints.
JEL classification: E62, G12, H7
Keywords: fiscal federalism, sub-national governments, sovereign bond spreads, government debt
ECB Working Paper 1987, December 2016 1
Non-technical summary Following recent concerns about sovereign debt and the absence of a centralised fiscal stabilisation
function in the euro area, the discussion about further integration towards a European fiscal union has
intensified. Much effort has been made by policy-makers and academics to provide recommendations
on how the institutional framework of such a fiscal union could look like. Against this backdrop,
experiences from already existing fiscal unions can inform the European debate. In this paper we are
particularly interested in how the set-up of a fiscal union translates into borrowing costs borne by
lower-tier governments.
With hard budget constraints underpinned by a credible no-bailout regime, market discipline is
expected to work: financial markets will punish lower-tier governments with deteriorated fiscal
fundamentals by charging higher risk premia. Under soft budget constraints however, the link between
fiscal fundamentals and borrowing costs is expected to weaken or break down.
In our analysis we focus on bonds issued by local governments one level below the central
government, i.e. the state, provincial, cantonal, Länder or community level, which we refer to as “sub-
sovereigns”. Our data include Australian states, Canadian provinces, Swiss cantons, German Länder,
US states, Spanish communities, and Indian states. In our baseline specification, we estimate the
relationship between the spread of sub-sovereign bond yields relative to yields of bonds issued by the
central government and “fundamental variables”, i.e. our proxies for expected default risk, including
sub-sovereign debt/GDP, fiscal deficit/GDP, and real GDP growth as well as international risk
aversion. We also control for the liquidity of sub-sovereign bond markets. We obtain pooled estimates
from a dynamic panel data regression model using the system GMM estimator, which allows us to
account for endogeneity between spreads and fundamentals. Federation-specific results are obtained
from a constrained, static fixed effects estimation to deal with reduced sample sizes.
We find that across federations, the debt/GDP ratio is a significant determinant of spreads, regardless
of the prevailing federal system. International risk aversion is also found to significantly increase sub-
sovereign spreads across federations while the magnitude of the effect depends on the openness of the
sub-sovereign bond market. The deficit/GDP ratio, regional GDP growth and bond market liquidity
are less significant drivers.
In order to assess in more detail how differences in bailout expectations within federations affect the
pricing of sub-sovereign bonds, we control for relative economic size and borrowing conditions faced
by the central government. We use these indirect measures instead of direct data on fiscal transfers and
fiscal equalisation funds because assistance provided to sub-sovereign governments can take a myriad
of forms. Bailout payments may be made explicitly, or implicit bailouts may occur through transfers
ECB Working Paper 1987, December 2016 2
from the centre or across sub-sovereigns within the federation. On aggregate, we find that if the sub-
sovereign debt or deficit levels lie above the federation median, the positive link between
fundamentals and spreads breaks down. We take this as evidence that the markets may perceive a
bailout of sub-sovereign governments with particularly deteriorated fundamentals as more likely. We
also find that sub-sovereigns that are large, in terms of relative economic size within the federation,
pay higher risk premia. This could reflect the limited capacity of the federation to provide assistance
as the size of the expected bailout increases (“too big to be rescued”). In addition, sub-sovereign
entities whose central government faces borrowing constraints also pay higher risk premia.
ECB Working Paper 1987, December 2016 3
1 Introduction Following recent concerns about sovereign debt and the absence of a centralised fiscal stabilisation
function in the euro area, the discussion about further integration towards a European fiscal union has
intensified. Much effort has been made by policy-makers and academics to provide recommendations
on how the institutional framework of such a fiscal union could look like. Against this backdrop,
experiences from already existing fiscal unions can inform the European debate, even though the
current and future institutional design of the Economic and Monetary Union and member country
characteristics may differ from existing federal states.
In this paper, we are interested in how the set-up of a fiscal union translates into borrowing costs borne
by lower-tier governments. This empirical question is motivated by the theory of fiscal federalism
(Rodden et al., 2003; Oates, 2005, 2008). The relationship between the central government and the
lower-tier government in a fiscal union can be illustrated as a principal-agent problem. Fiscal
responsibility is delegated from the centre to regional or local governments, which in many existing
federations can issue their own debt. The institutional framework may be such that the centre can
credibly commit not to provide bailouts to lower-tier governments unable to service their debt. In this
case, the budget constraint of the lower-tier government is binding (“hard”). Examples include state
governments in the United States, provinces in Canada and cantons in Switzerland, where the no-
bailout principle is enshrined in the institutional set-up and, in the case of Canada and the United
States, has been upheld in practice in concrete historical cases. On the other hand, if the institutional
set-up is such that the promise of no-bailout is not credible, lower-tier governments face so-called
“soft” budget constraints. A moral hazard situation arises in which lower-tier governments have
incentives to run excessive deficits in expectation of a bailout or of large transfers from fiscal
equalisation schemes, as it occurred for instance in Germany.
With hard budget constraints underpinned by a credible no-bailout regime, market discipline is
expected to work: financial markets will punish lower-tier governments with deteriorated fiscal
fundamentals by charging higher risk premia. Under soft budget constraints however, the link between
fiscal fundamentals and borrowing costs is expected to weaken or break down. The empirical literature
on the euro area (Codogno et al., 2003; Attinasi et al., 2009; Bernoth and Erdogan, 2012) and
comparisons across fiscal federations (Schuknecht et al., 2009; Sola and Palomba, 2015) have shown
that, if bailouts are explicitly provided or implicitly anticipated through transfers and fiscal
equalisation, government bond yield spreads deviate from fundamentals. On the other hand, if the no-
bailout regime is credible, market discipline prevails and sub-sovereign issuers pay higher risk premia
as their fundamentals deteriorate.
ECB Working Paper 1987, December 2016 4
We study borrowing costs in fiscal unions by examining the functioning of existing federal states. In
our analysis we focus on bonds issued by local governments one level below the central government,
i.e. the state, provincial, cantonal, Länder or community level, which we refer to as “sub-sovereigns”.
We add to the existing literature by analysing the effect of bailout expectations on sub-sovereign bond
yield spreads in two dimensions: across federal systems and within federations.
Different institutional frameworks across fiscal federations are reflected in the degree to which market
discipline works. In particular, the previous empirical literature has somewhat overlooked the fact that
budget constraints may be “softer” for some entities than for others within a federation. Wildasin
(2004), for instance, provides a theory according to which some sub-sovereigns may be too important
to default because they produce positive externalities for the whole federation, i.e. they may be “too
big to fail”. Alternatively, sub-sovereigns may be “too small to fail” (Eyraud and Moreno Badia,
2013): bailout expectations prevail if sub-sovereign borrowing needs are small relative to the capacity
of the centre to provide assistance. However, even if the central government is willing to provide a
bailout, it may be constrained to do so. Jenkner and Lu (2014) provide evidence for a risk transfer
from the sub-sovereign level to the centre. When a sub-sovereign bailout is expected, the credit risk of
the centre rises. This, in turn, means that bailing out larger entities may exceed the bailout capacity of
the centre (“too big to be rescued”). Likewise, if the centre itself faces borrowing constraints in a
crisis, it may not be able to provide the expected bailout. We therefore analyse to what extent the
expectation of a federal bailout may break the link between sub-sovereigns’ risk premia and
fundamentals. Moreover, we investigate whether constraints in the capacity of the centre to provide
bailouts can reintroduce this link.
To test our hypotheses, we make use of the fact that borrowing by sub-sovereigns, in relation to
borrowing by the central government, contributes considerably to general government debt and deficit
ratios relative to GDP in existing and evolving federal states. For example, the World Bank estimates
that global annual borrowing of sub-sovereign governments in bond markets (including lower-level
governments like municipalities) reached levels above US dollar 700 billion in 2009 (Canuto and Liu,
2010). More than half of this amount originates in the United States while German, Japanese,
Canadian and Spanish sub-sovereign borrowers are responsible for most of the remaining issuances.
We construct a novel panel dataset with sub-sovereign bond yield spreads and data on respective sub-
sovereign fiscal deficits, debt levels and growth performance for the period 1999 to 2012, covering
Australia, Canada, Switzerland, Germany, and the United States of America, as well as Spain and
India as countries with evolving federal systems.
In our baseline specification, we estimate the relationship between the spread of sub-sovereign bond
yields relative to yields of bonds issued by the central government and “fundamental variables”. These
ECB Working Paper 1987, December 2016 5

are our proxies for expected default risk and include sub-sovereign debt/GDP, fiscal deficit/GDP, and
real GDP growth as well as international risk aversion. We obtain pooled estimates from a dynamic
panel data regression model using the system GMM estimator which allows us to account for
endogeneity between spreads and fundamentals. Federation-specific results are obtained from a
constrained, static fixed effects estimation to deal with reduced sample sizes. We find that across
federations, the debt/GDP ratio is a significant determinant of spreads regardless of the prevailing
federal system. International risk aversion is also found to significantly increase sub-sovereign spreads
across federations while the magnitude of this effect depends on the openness of the sub-sovereign
bond market. The deficit/GDP ratio and regional GDP growth are less significant drivers. This may
owe to the fact that the underlying data are less timely available or not fully comparable across
federations. We also find evidence for a statistically significant, negative risk premium for sub-
sovereign bonds that are more liquid, which we interpret as a control factor in our regressions.
In order to assess in more detail how differences in bailout expectations within federations affect the
pricing of sub-sovereign bonds, we control for the relative economic size of the sub-sovereign and the
borrowing conditions faced by the central government. We use these indirect measures instead of
direct data on fiscal transfers or fiscal equalisation because assistance provided to sub-sovereign
governments can take a myriad of forms. Bailout payments may be made explicitly, or implicit
bailouts may occur through transfers from the centre or across sub-sovereigns. On aggregate, we find
that if sub-sovereign debt or deficit levels lie above the federation median, the positive link between
fundamentals and spreads breaks down. We take this as evidence that markets may perceive a bailout
of sub-sovereign governments with particularly deteriorated fundamentals as more likely. We also find
that sub-sovereigns that are large in terms of relative economic size pay higher risk premia, a fact that
we attribute to the market’s perception that the bailout capacity of the federation is limited and may be
exhausted as the size of the rescue becomes too large (“too big to be rescued”). In addition, sub-
sovereigns whose central government faces borrowing constraints also pay higher risk premia.
This paper is organised as follows. The next section reviews the relevant empirical literature on the
determinants of sovereign and sub-sovereign bond yield spreads. In addition, it provides an overview
of the fiscal frameworks prevailing in the countries that are the focus of this study. Section 3 explains
how the dataset is constructed and presents salient data features. Section 4 sets out the econometric
strategy. Section 5 reports the main results and some robustness checks. Section 6 concludes.
2 Related literature A large amount of empirical work studies the determinants of government bond yield spreads from a
cross-country perspective. In particular, the pricing of sovereign debt in euro area countries has
attracted a lot of attention. In this context, it is important to note that the institutional set-up of the euro
ECB Working Paper 1987, December 2016 6
area can to some extent be linked to that of a federally structured country where a certain degree of
coordination of economic policies among member states, including in the fiscal domain, is achieved
through common rules enforced by means of peer review. In the absence of a substantial federal
budget and of sizeable fiscal transfers among member states, and with the no-bailout clause explicitly
enshrined in the Treaty regulating the functioning of the Economic and Monetary Union (EMU), the
euro area experience itself could be seen as an example of a fiscal union with a hard budget constraint.
In practice, however, following the adoption of the euro and before the financial crisis, financial
markets by and large refrained from pricing in large differences in sovereign risk between EMU
members. This narrative for the pre-crisis period is most plausible for the case of Greece whereas it
might be less evident in the case of Spain and Ireland where standard fiscal fundamentals looked
sound before the crisis. Overall, the pre-crisis experience in the euro area has been interpreted by
many observers as an indication that markets perceived the no-bailout clause to be not credible. The
Lehman collapse in 2008 and the subsequent sovereign debt crisis triggered a reinforcement of market
discipline as countries with weaker fiscal positions experienced soaring yield spreads (Schuknecht et
al., 2011; Bernoth and Erdogan, 2012). In addition, there is evidence that investors’ sentiment let
spreads to rise above what would have been expected from movements in fundamentals (De Grauwe
and Ji, 2013) as concerns about the viability of EMU and re-denomination risk intensified (De Santis,
2015). Since then, the announcement of the ECB’s Outright Monetary Transactions (OMT)
programme has contributed to a narrowing of the dispersion of bond yield spreads in the euro area.
Despite these large changes in market expectations about bailouts in the euro area, pre- and post-crisis
studies on euro area bond spreads find that both fiscal fundamentals associated with default risk and
global risk aversion are, at least at the margin, drivers of euro area bond spreads. Most prominently,
the debt/GDP ratio and the deficit/GDP ratio have been identified as the default risk-related variables
that most significantly increase spreads (Codogno et al., 2003; Attinasi et al., 2009; Schuknecht et al.,
2011; Bernoth and Erdogan, 2012). Moreover, the liquidity of bond markets has been found to have a
negative but rather limited effect on yield spreads (Gómez-Puig, 2006). At the same time, proxies for
international investors’ risk appetite have consistently been shown to have the largest effect on
sovereign bond yield spreads in the euro area, both in statistical and in economic terms (Manganelli
and Wolswijk, 2009; Sgherri and Zoli, 2009; Favero et al., 2010).
That financial markets take account of fiscal fundamentals when they price sovereign credit risk has
been confirmed by studies with a global focus. Edwards (1984) and Beirne and Fratzscher (2013) find
that debt and fiscal deficit as well as real GDP growth are significant determinants of emerging market
economies’ sovereign bond yield spreads, alongside trade openness and international risk appetite. An
international analysis of sovereign credit default swap (CDS) spreads by Aizenman et al. (2013) finds
a significantly positive relationship between CDS spreads as market prices of sovereign credit risk and
ECB Working Paper 1987, December 2016 7
debt and deficit ratios. Dell’Erba et al. (2013) show that the correlation between bond yield spreads
and debt levels is larger in emerging economies with mostly foreign-currency debt and in EMU
members compared to advanced economies where most debt is denominated in local currency. Like
issuers of foreign-currency debt, EMU members and sub-sovereign governments cannot decide
unilaterally to reduce the real value of their debt obligations through inflation, which should be
expected to reinforce the correlation between debt levels and spreads.
Only a small number of studies has looked into the determinants of sub-sovereign bond yield spreads.
In line with the works on EMU members, they agree on a common global factor to be the most
important driver of these spreads. The vast majority of these studies has been conducted for major
federal states individually, which renders cross-federation comparisons difficult. A significant
exception is Sola and Palomba (2015), which is fairly close to our study in terms of geographical
coverage and empirical approach. Using secondary market data, they study sub-sovereign risk premia
for a panel composed of the US, Canada, Australia and Germany. They find that fiscal fundamentals
like debt and deficit are priced into risk premia but their weight varies across federal systems. If
bailout guarantees exist, the relationship between fundamentals and spreads breaks down as market
discipline fails. The authors use the transfer dependency of a sub-sovereign government from the
central government, defined as the ratio of vertical transfers in sub-sovereign revenue, to approximate
bailout guarantees. In a related cross-federation comparison, Schuknecht et al. (2009) show that
Canadian provinces and German states pay lower spreads if they benefit from fiscal equalisation
schemes, which are also approximated using data on fiscal transfers. However, bailouts provided to
sub-sovereign governments can take a number of forms other than direct transfers. For instance, one-
off bailout payments may be provided explicitly, or horizontal fiscal equalisation across sub-sovereign
governments and revenue sharing between sub-sovereign governments and the central government
may reflect implicit bailout guarantees (Rodden et al., 2003). In this sense, there could be a benefit
from moving to more indirect measures of federal bailout guarantees, such as the relative economic
size of the sub-sovereign, which is what we do in this study.
Our study is also related to work on spreads for bonds issued by the lowest government level, i.e.
municipalities. Despite the existence of stronger bailout expectations compared to state and central
governments, analyses of selected US municipality bonds by Hastie (1972) and Capeci (1994) show
that fundamentals related to default risk increase spreads also for this class of government bonds,
alongside the relative illiquidity of the local government bond market and bond-specific
characteristics.
Turning to the forms of fiscal federalism, it is useful to start with a characterisation of the federations
included in our sample (Australia, Canada, Germany, India, Spain and Switzerland). While US states,
ECB Working Paper 1987, December 2016 8
Swiss cantons and, to a smaller extent, Canadian provinces enjoy relatively strong control over their
own revenue and expenditure and cannot rely on bailouts by the central level, Länder in Germany are
more constrained in fiscal policies while bailout expectations are high. Australia takes an intermediate
position on this spectrum in the sense that Australian states have substantial autonomy over spending
but are constrained in their revenue and borrowing choices while implicit bailout guarantees exist to
some degree. Despite being a unitary state, Spain would be relatively similar to Germany in terms of
bailout expectations, while India’s evolving fiscal framework leaves yet little room for sub-sovereign
autonomy.
US states and Swiss cantons raise around 40 percent of general government tax revenue and have
almost full command over spending. Strict no-bailout provisions and the Swiss element of direct
democracy serve as self-constraint limiting the fiscal autonomy of sub-sovereign governments in these
countries, which as a result show a low share of expenditure and debt relative to the federal level.
Bayoumi et al. (1995), Poterba and Rueben (1999, 2001) as well as Johnson and Kriz (2005) show that
bond spreads of US state governments significantly reflect differences in fiscal fundamentals and find
that spreads are lower in states with stricter, self-imposed fiscal rules. Feld et al. (2013) provide
similar evidence for Swiss cantons.
Vertical fiscal transfers guarantee fiscal flexibility of Canadian provinces and Australian states.
Despite strong fiscal equalisation and coordinated borrowing, Lemmen (1999) finds that higher sub-
sovereign yields reflect higher debt levels in Australian states but are also significantly correlated with
measures of international risk appetite. Although Canadian provinces enjoy higher borrowing
autonomy than Australian state governments, findings on whether spreads on their debt securities
carry fundamentals-based default premia are ambiguous. While Booth et al. (2007) find support for
this hypothesis, research by Landon and Smith (2007) and Galvani and Behnamian (2009) rejects it.
Using credit rating data, Landon and Smith (2000) find evidence of a transfer of credit risk from the
central level to particularly vulnerable, i.e. indebted provinces, despite no-bailout provisions; Joffe
(2012) shows that bailout expectations dampen sub-sovereign spreads.
Unlike in the United States, Switzerland, Canada and Australia, bailouts of sub-sovereign
governments by the federal level have taken place in Germany’s recent past. The Federal
Constitutional Court granted Bremen and Saarland additional funding in 1992 based on the “solidarity
obligation” enshrined in Germany’s constitution. In 2006, the court denied the state of Berlin a bailout
but generally confirmed the bailout option as last resort (Rodden, 2005; Schulz and Wolff, 2009).
Consequently, the fiscal autonomy of German Länder is relatively limited. Länder are part of a
complex, interwoven system in which fiscal equalisation plays an important role. Their revenue is
mostly made up of shares of centrally collected taxes, including up to a quarter of value added tax
ECB Working Paper 1987, December 2016 9
revenue. In addition, a system of horizontal fiscal equalisation ensures up to 95 percent of transfer
recipients’ financial needs while a minority of Länder is left contributing. Hence, yield spreads show
little variation and are found to carry either limited (Lemmen, 1999; Heppke-Falk and Wolff, 2007;
Schuknecht et al., 2009; Hong et al., 2012) or no fundamentals-based default risk premia (Schulz and
Wolff, 2009). Only since the financial crisis of 2008, the debt-to-GDP ratio has become a significant
spread determinant, alongside risk aversion and liquidity (Zipfel and Zimmer, 2013). In addition,
Heppke-Falk and Wolff (2007) find evidence for investor moral hazard as Länder, that are more likely
to receive bailouts, enjoy relatively lower spreads.
Although being a unitary state, Spain has become increasingly decentralised. The autonomous
communities (CCAA) haven taken over more and more responsibilities for public services from the
centre. In terms of revenue, CCAA have gradually gained autonomy through the assignment of
unconditional shares of centrally collected taxes. This process however has taken place
heterogeneously across regions with some CCAA, like the Basque country and Navarre, taking the
lead. Although borrowing is subject to central authorisation, debt levels soared in the course of the
crisis, in tandem with central government debt. Based on a limited number of observations,
Schuknecht et al. (2009) detect a significant link between spreads and fiscal fundamentals as well as
liquidity measures. By conducting an event study analysis, Jenkner and Lu (2014) find evidence for a
risk transfer occurring from the communities to the federal level in response to the most recent
bailouts in 2012: sub-sovereign premia decreased while sovereign premia rose.
In India, fiscal federalism is still in the making. Fiscal surveillance of sub-sovereign governments is
based on fiscal rules and market discipline, but it is still weak. The relationship between expenditure
and revenue is disproportionate as states have major spending responsibilities while revenue is mainly
raised by the centre. At the same time, sub-sovereign borrowing is constrained to domestic issuances.
Nevertheless, the market for state debt securities (“state development loans”) has gradually been
liberalised since 2006. Yet market discipline remains weak as spreads are uncorrelated with fiscal
fundamentals while transfers from the centre are associated with lower spreads (Bose et al., 2011).
3 Dataset We use a novel panel dataset which comprises annual sub-sovereign bond spreads and key fiscal and
economic indicators (fiscal deficit/GDP, debt/GDP, real GDP growth) for 7 Australian states, 10
Canadian provinces, 16 Swiss cantons, 13 German Länder, 11 Spanish communities, 20 Indian states,
and 19 US states (see Table A1 in the Appendix for the list of sub-sovereigns used in the analysis). In
all these federally organised countries, the sub-sovereign layer accounts for a substantial part of the
overall debt and borrowing of the general government (see Table A2 in the Appendix). Depending on
the country, total sub-sovereign debt accounts for between 11 and 47 percent of federal GDP,
ECB Working Paper 1987, December 2016 10
corresponding to at least a quarter of central government debt. In Canada, total sub-sovereign debt
even exceeds the size of central government debt. Given its time span from 1999 to 2012, our
unbalanced panel dataset covers a period that is marked by an increasing securitisation of debt at the
sub-sovereign level as well as the recent global financial and European sovereign debt crisis.
3.1 Sub-sovereign bond yield spreads
We compute sub-sovereign yield spreads by subtracting federal benchmark yields from yields-to-
maturity of bonds issued by sub-sovereign governments. We use secondary market yields as opposed
to yields at issue and we only include sub-sovereigns for which sufficient bond yield observations are
available. Using secondary market yields ensures that our results are free from sample selection biases,
which could be present if sub-sovereigns stop borrowing on bond markets as their fiscal fundamentals
deteriorate. Bonds of such sub-sovereigns would still be traded in secondary markets and increases in
default risk would be reflected in yields, while yields at issue would become unobservable.1 In line
with the literature, bonds of a total duration of 10 years are chosen. As benchmark, we consider
comparable federal government bonds in terms of duration, date of issuance and maturity, and coupon
payment structure. Finally, we use data from the last trading day of each year.
For Australia, Canada, Switzerland, Germany, and Spain – countries with relatively liquid sub-
sovereign bond markets – data were sourced from Bloomberg. For every sub-sovereign issuer we
compute a single time series of yield spreads by chaining together segments of spreads of most liquid
sub-sovereign bonds relative to the respective federal benchmarks. By doing so, we deliberately
exclude bonds with low liquidity from our analysis.2 As bond yields may nevertheless carry liquidity-
related premia, we control for sub-sovereign bond market liquidity separately. Chain segments decline
in years left to maturity over time, starting from between 5 to 10 years left. We control for remaining
maturities in our empirical analysis in order to rule out potential biases stemming from differences in
the term structure between the central and sub-sovereign level.
For the United States, most general obligation bonds of US states are not actively traded, thus yields
are not publicly available. We therefore rely on “fair value” yield indices from Bloomberg. For 19
states, these indices provide an average yield for a basket of representative state general obligation
bonds and bonds issued by state agencies, institutions, and municipalities. Spreads are computed
1 Sola and Palomba (2015) estimate a Heckman selection model using primary market data for a sub-sample of sub-sovereigns from Germany, Spain, Canada and Australia. They find that transfer dependency and GDP growth decreases the probability to issue debt on bond markets while debt/GDP increases this probability. This suggests that sub-sovereigns that are active on the bond market are characterised by strong fiscal fundamentals and low transfer dependency at the time of issuance. 2 We decided against averaging across different bonds per point in time. By averaging, information on the liquidity of individual bonds is lost and cannot be sufficiently accounted for in the empirical analysis. As yields of bonds with low liquidity are expected to contain higher liquidity premia, this would bias the average spread.
ECB Working Paper 1987, December 2016 11
relative to benchmark indices which, for each state, aggregate yields of AAA-rated subsamples of
these bond baskets. Finally, yield spreads of Indian “state development loans” are directly sourced
from the Clearing Corporation of India.
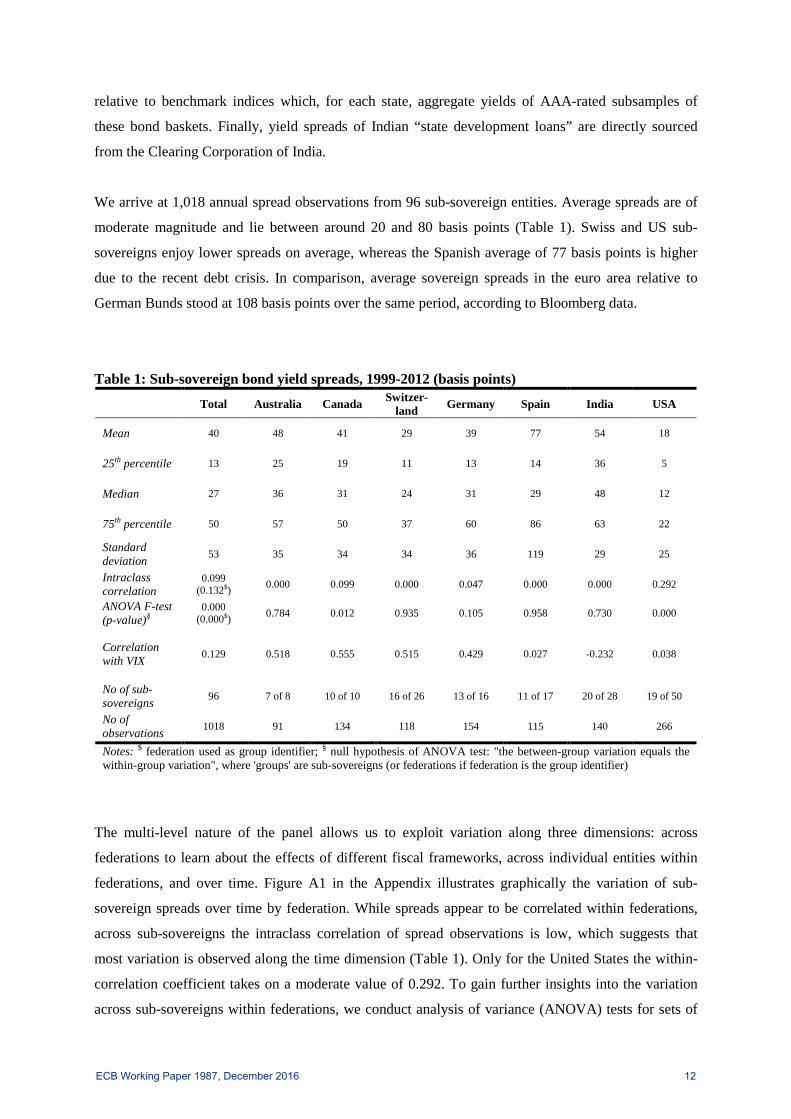
We arrive at 1,018 annual spread observations from 96 sub-sovereign entities. Average spreads are of
moderate magnitude and lie between around 20 and 80 basis points (Table 1). Swiss and US sub-
sovereigns enjoy lower spreads on average, whereas the Spanish average of 77 basis points is higher
due to the recent debt crisis. In comparison, average sovereign spreads in the euro area relative to
German Bunds stood at 108 basis points over the same period, according to Bloomberg data.
Table 1: Sub-sovereign bond yield spreads, 1999-2012 (basis points)
Total Australia Canada Switzer-land Germany Spain India USA
Mean 40 48 41 29 39 77 54 18
25th percentile 13 25 19 11 13 14 36 5
Median 27 36 31 24 31 29 48 12
75th percentile 50 57 50 37 60 86 63 22
Standard deviation 53 35 34 34 36 119 29 25
Intraclass correlation
0.099 (0.132$) 0.000 0.099 0.000 0.047 0.000 0.000 0.292
ANOVA F-test (p-value)§
0.000 (0.000$) 0.784 0.012 0.935 0.105 0.958 0.730 0.000
Correlation with VIX 0.129 0.518 0.555 0.515 0.429 0.027 -0.232 0.038
No of sub-sovereigns 96 7 of 8 10 of 10 16 of 26 13 of 16 11 of 17 20 of 28 19 of 50
No of observations 1018 91 134 118 154 115 140 266
Notes: $ federation used as group identifier; § null hypothesis of ANOVA test: "the between-group variation equals the within-group variation", where 'groups' are sub-sovereigns (or federations if federation is the group identifier)
The multi-level nature of the panel allows us to exploit variation along three dimensions: across
federations to learn about the effects of different fiscal frameworks, across individual entities within
federations, and over time. Figure A1 in the Appendix illustrates graphically the variation of sub-
sovereign spreads over time by federation. While spreads appear to be correlated within federations,
across sub-sovereigns the intraclass correlation of spread observations is low, which suggests that
most variation is observed along the time dimension (Table 1). Only for the United States the within-
correlation coefficient takes on a moderate value of 0.292. To gain further insights into the variation
across sub-sovereigns within federations, we conduct analysis of variance (ANOVA) tests for sets of
ECB Working Paper 1987, December 2016 12
spread series individually across federations. The hypothesis of “no significant difference between the
variance across relative to the variance within sub-sovereigns” can only be rejected at the 1 percent
significance level for the United States. This confirms that in all the other federations, the majority of
variation in spreads takes place along the time dimension rather than across sub-sovereign boundaries.
In other words, there is strong co-movement of spreads over time.
3.2 Fiscal and economic indicators for sub-sovereigns
In line with the previous literature, we consider the debt/GDP and the deficit/GDP ratio as the main
fiscal determinants of sub-sovereign yield spreads. Sub-sovereign data are collected from a wide range
of national sources (Table 2). Since we face a considerable variation in definitions and accounting
methods across federations, we choose measures that maximise comparability.
Annual sub-sovereign gross domestic product is reported in current prices in local currencies and is
regularly estimated by national statistics institutes for all federations other than Switzerland, where we
use estimates for 2000, 2005, and 2008 to 2010 and interpolate.
Debt refers to gross debt accumulated by the sub-sovereign government and is also reported in local
currency. For Canadian provinces, the amount of bonds outstanding at the end of each year serves as
an approximation of total provincial debt outstanding. With most sub-sovereign debt being securitised
in Canada, this measure is more similar to gross debt than officially reported net debt data. Since US
sub-sovereign spreads are based on both state and municipality debt issuances, the aggregate of total
state and local debt is used to compute the sub-sovereign debt/GDP ratio. As shown in Table 2,
median debt ratios are highest for Indian states and German Länder and lowest for Australian states
and Spanish communities.
We define the sub-sovereign fiscal deficit as the amount by which annual expenditure exceeds
revenue. Our deficit variable includes net transfer revenue from the federal level or fiscal equalisation
schemes. Post-transfer deficit ratios determine sub-sovereign fiscal capacity and ultimately credit risk.
In addition, using deficit data that include transfers renders this variable better comparable across
fiscal federations given that federal and intergovernmental transfers can take a large variety of forms.
Note that according to median deficit ratios, sub-sovereign governments in Australia, Canada,
Germany and Spain have been in deficit for most of the sample period (Table 2). In the other
federations, median budgets have been in surplus which results in a negative sign of the overall deficit
measure.
Finally, we consider real GDP growth as additional explanatory variable which we compute using sub-
sovereign GDP estimates and the federation-wide GDP deflator provided by the IMF.
ECB Working Paper 1987, December 2016 13
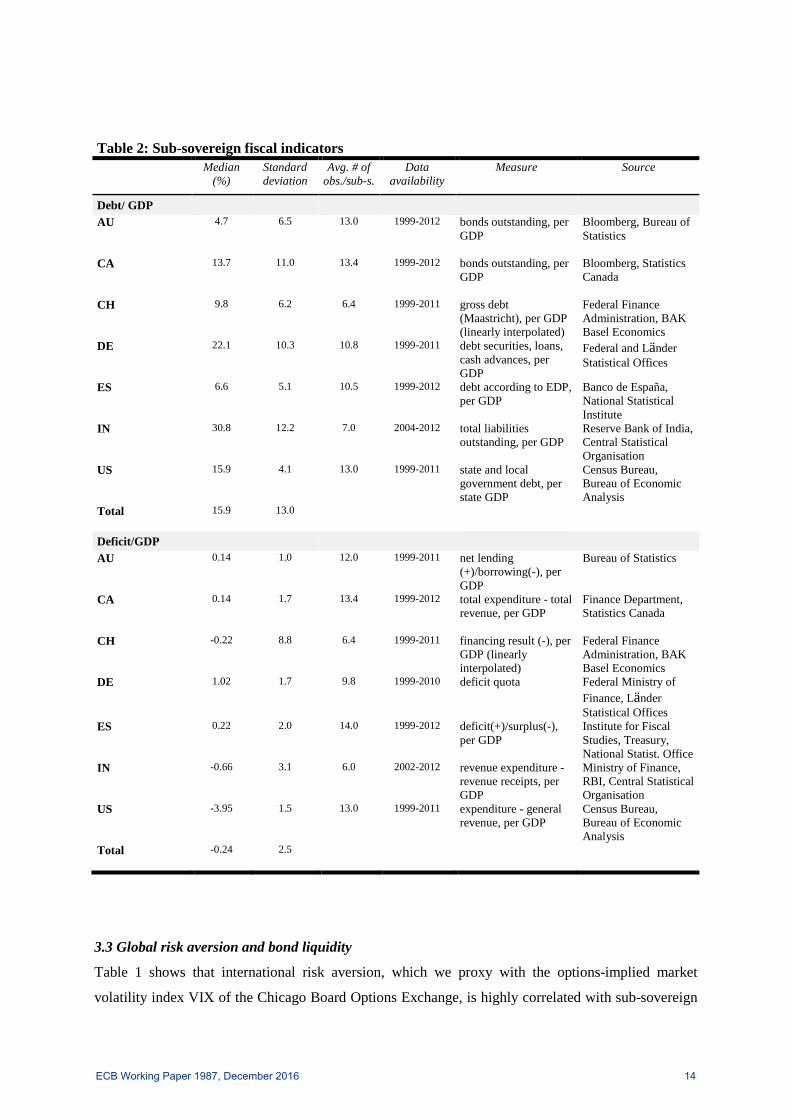
Table 2: Sub-sovereign fiscal indicators Median
(%) Standard deviation
Avg. # of obs./sub-s.
Data availability
Measure Source
Debt/ GDP AU 4.7 6.5 13.0 1999-2012 bonds outstanding, per
GDP Bloomberg, Bureau of Statistics
CA 13.7 11.0 13.4 1999-2012 bonds outstanding, per GDP
Bloomberg, Statistics Canada
CH 9.8 6.2 6.4 1999-2011 gross debt (Maastricht), per GDP (linearly interpolated)
Federal Finance Administration, BAK Basel Economics
DE 22.1 10.3 10.8 1999-2011 debt securities, loans, cash advances, per GDP
Federal and Länder Statistical Offices
ES 6.6 5.1 10.5 1999-2012 debt according to EDP, per GDP
Banco de España, National Statistical Institute
IN 30.8 12.2 7.0 2004-2012 total liabilities outstanding, per GDP
Reserve Bank of India, Central Statistical Organisation
US 15.9 4.1 13.0 1999-2011 state and local government debt, per state GDP
Census Bureau, Bureau of Economic Analysis
Total 15.9 13.0
Deficit/GDP
AU 0.14 1.0 12.0 1999-2011 net lending
(+)/borrowing(-), per GDP
Bureau of Statistics
CA 0.14 1.7 13.4 1999-2012 total expenditure - total revenue, per GDP
Finance Department, Statistics Canada
CH -0.22 8.8 6.4 1999-2011 financing result (-), per GDP (linearly interpolated)
Federal Finance Administration, BAK Basel Economics
DE 1.02 1.7 9.8 1999-2010 deficit quota Federal Ministry of Finance, Länder Statistical Offices
ES 0.22 2.0 14.0 1999-2012 deficit(+)/surplus(-), per GDP
Institute for Fiscal Studies, Treasury, National Statist. Office
IN -0.66 3.1 6.0 2002-2012 revenue expenditure - revenue receipts, per GDP
Ministry of Finance, RBI, Central Statistical Organisation
US -3.95 1.5 13.0 1999-2011 expenditure - general revenue, per GDP
Census Bureau, Bureau of Economic Analysis
Total -0.24 2.5
3.3 Global risk aversion and bond liquidity
Table 1 shows that international risk aversion, which we proxy with the options-implied market
volatility index VIX of the Chicago Board Options Exchange, is highly correlated with sub-sovereign
ECB Working Paper 1987, December 2016 14
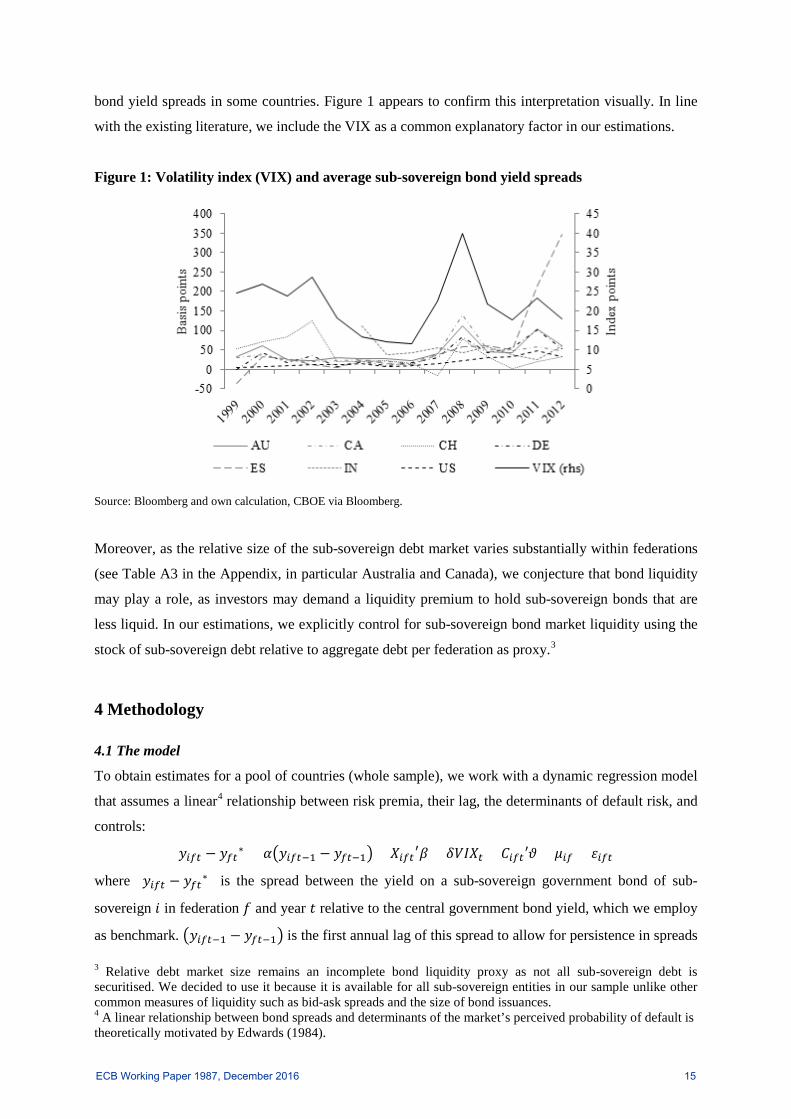
bond yield spreads in some countries. Figure 1 appears to confirm this interpretation visually. In line
with the existing literature, we include the VIX as a common explanatory factor in our estimations.
Figure 1: Volatility index (VIX) and average sub-sovereign bond yield spreads
Source: Bloomberg and own calculation, CBOE via Bloomberg.
Moreover, as the relative size of the sub-sovereign debt market varies substantially within federations
(see Table A3 in the Appendix, in particular Australia and Canada), we conjecture that bond liquidity
may play a role, as investors may demand a liquidity premium to hold sub-sovereign bonds that are
less liquid. In our estimations, we explicitly control for sub-sovereign bond market liquidity using the
stock of sub-sovereign debt relative to aggregate debt per federation as proxy.3
4 Methodology
4.1 The model
To obtain estimates for a pool of countries (whole sample), we work with a dynamic regression model
that assumes a linear4 relationship between risk premia, their lag, the determinants of default risk, and
controls:
𝑦𝑖𝑖𝑖 − 𝑦𝑖𝑖∗ = 𝛼�𝑦𝑖𝑖𝑖−1 − 𝑦𝑖𝑖−1�+ 𝑋𝑖𝑖𝑖′𝛽 + 𝛿𝑉𝑉𝑋𝑖 + 𝐶𝑖𝑖𝑖′𝜗 + 𝜇𝑖𝑖 + 𝜀𝑖𝑖𝑖
where (𝑦𝑖𝑖𝑖 − 𝑦𝑖𝑖∗) is the spread between the yield on a sub-sovereign government bond of sub-
sovereign 𝑖 in federation 𝑓 and year 𝑡 relative to the central government bond yield, which we employ
as benchmark. �𝑦𝑖𝑖𝑖−1 − 𝑦𝑖𝑖−1� is the first annual lag of this spread to allow for persistence in spreads
3 Relative debt market size remains an incomplete bond liquidity proxy as not all sub-sovereign debt is securitised. We decided to use it because it is available for all sub-sovereign entities in our sample unlike other common measures of liquidity such as bid-ask spreads and the size of bond issuances. 4 A linear relationship between bond spreads and determinants of the market’s perceived probability of default is theoretically motivated by Edwards (1984).
ECB Working Paper 1987, December 2016 15
over time. 𝑋𝑖𝑖𝑖 contains the macroeconomic and fiscal fundamentals debt/GDP, deficit/GDP and real
GDP growth.5 We expect the debt level and deficit to be positively related to spreads, and the GDP
growth rate to be negatively related. 𝑉𝑉𝑋𝑖 captures international risk aversion which is expected to
affect spreads positively. In order to control more generally for common factors, we also consider a
specification with year dummies instead of the VIX. 𝐶𝑖𝑖𝑖 contains as technical control the time left to
maturity of the bond in years. It further includes relative debt market size as proxy for bond market
liquidity which is expected to affect spreads negatively if investors charge liquidity premia for
relatively less liquid sub-sovereign bond issuances. The unobserved factor 𝜇𝑖𝑖 shifts the intercept at
the sub-sovereign level and can be interpreted as time-invariant influence of institutions, geography,
borrowing history, etc. on sub-sovereign spreads. Inherently, this sub-sovereign-fixed effect captures
time-invariant federation-specific influences on sub-sovereign spreads in a pooled analysis across sub-
sovereigns from different federations.
4.2 Testing for market’s expectation of a federal bailout and the capacity to bail out
In order to test our hypotheses about the market’s expectation of a federal bailout and the capacity of
the federal government to bail out sub-sovereign entities and how these factors impact on the pricing
of sub-sovereign fundamentals, we augment our baseline specification as follows. First, we add a
measure of relative economic size to our empirical framework. This is computed as the share of sub-
sovereign GDP in federation-wide GDP. A positive coefficient estimate for this measure would
support the hypothesis of “too big to be rescued”: all else equal, larger sub-sovereigns would pay
higher premia. A negative coefficient would support the counterhypothesis of “too big to fail”.
Second, we allow for non-linear effects of default risk determinants by adding the squared term of a
given default risk determinant 𝑥 to the specification. A significantly negative coefficient on 𝑥2 would
suggest that the relationship between the default risk determinant and spreads is concave and that the
positive link between default risk and spreads changes sign as the default risk rises beyond the
inflexion point. Third, we further assess the sources of non-linearities between default risk
determinants and spreads within federations in a threshold model specification, whereby the level of a
given default risk determinant 𝑥 is considered to be severely deteriorated, or “high”, if it lies above the
federation-specific threshold of 𝑥. For simplicity, we set this threshold to the federation-specific
median of 𝑥 over time.6 In practice, we construct a dummy variable that takes the value of one, if 𝑥
5 Unlike Beber et al. (2009), Schuknecht et al. (2009) or Sola and Palomba (2015) we use fiscal and economic variables in levels, not deviations from a common benchmark, such as within-federation averages of these variables. The latter would result in losing a significant amount of information given differences in definitions and accounting methods across countries. We experimented with deviations relative to within-federation averages at each point in time weighted by sub-sovereign size but found that the remaining variation contained only little information. 6 Sola and Palomba (2015) report results from similar specifications, i.e. including squared terms and median thresholds. They find that the relationship between debt/GDP and sub-sovereign spreads is concave but that both below- and above-median debt levels have a positive effect on spreads.
ECB Working Paper 1987, December 2016 16
lies above the federation-specific median. This dummy is then interacted with 𝑥. If the interaction
between the dummy and the variable x exhibits a negative sign, while the coefficient of x remains
positive, we would conclude the following: under a soft budget constraint regime, market discipline
binds for sub-sovereigns with strong fundamentals but breaks down if their fundamentals deteriorate.
In this case, a deterioration in fundamentals renders potential no-bailout commitments by the centre as
not credible.
We also consider a triple interaction between default risk determinants 𝑥, our dummy variable
capturing threshold effects and our measure of relative economic size. A positive coefficient on this
interaction term along with a positive coefficient for 𝑥 and a negative coefficient for the interaction
term 𝑥*dummy could be interpreted as follows: for sub-sovereigns that are relatively large, the centre,
although in principle expected to provide a bailout to sub-sovereigns with deteriorated fundamentals,
may not be capable to provide financial assistance due to the size of the respective sub-sovereign.
In order to assess in more detail the role of the centre’s bailout capacity, we consider an additional
specification in which we control for federal borrowing conditions. As a first proxy for bailout
capacity, we use sovereign debt credit ratings. Ratings are linearised and averaged across the three
main credit rating agencies Fitch, Moody’s and Standard & Poor’s. A rating-based sovereign risk
measure is then constructed as the negative, linearised average rating. This measure is comparable
across federations: low average ratings are a sign for borrowing constraints faced by the centre. In
addition, we consider the debt/GDP and deficit/GDP ratio of the central government as proxies for
sovereign risk that inhibits the bailout capacity of the centre. In order to avoid collinearity with sub-
sovereign debt and deficit ratios, we compute central government debt and deficit ratios relative to
year-specific cross-federation averages. Like before, we interact our measure of federal sovereign risk
with our fiscal indicators 𝑥 for sub-sovereigns. Given that 𝑥 retains a positive effect on the sub-
sovereign bond spread, a positive coefficient on the interaction between 𝑥 and federal sovereign risk
can be interpreted as follows: financial markets punish weak fundamentals more if the centre is
constrained in its borrowing. As before, we would conclude that capacity constraints of the centre
decrease the likelihood that it will provide bailouts to sub-sovereign governments in financial needs.
4.3 Sources of endogeneity
There are two potential sources of endogeneity arising in our empirical model. A first, standard
problem in dynamic panel data models stems from the presence of time-invariant sub-sovereign
specific effects 𝜇𝑖𝑖 in our equation. Due to their correlation with the error term caused by the dynamic
structure, OLS fixed effects estimates are inconsistent unless the time dimension is very large. We
therefore estimate our equation with dynamic panel data estimators difference GMM (Arellano and
Bond, 1991) and system GMM (Arellano and Bover, 1995). Both estimators use lagged levels
ECB Working Paper 1987, December 2016 17
(difference GMM) or lagged levels and lagged differences (system GMM) of the dependent variable
as internal instruments which solves the endogeneity problem caused by sub-sovereign specific
effects. Difference GMM can suffer from the problem of weak instruments if the variables in the
model are highly persistent, like spreads and fundamentals in some of our subsamples. Under the
assumption that differences of instrument variables are uncorrelated with sub-sovereign specific
effects, system GMM improves upon difference GMM. Because of its complexity, the GMM
estimator relies on a sufficiently large cross-sectional dimension. This requirement is not met if we
want to conduct estimations separately for every federation. In that case, therefore, we abstract from
dynamics and estimate a static version of our regression model, i.e. we set 𝛼 = 0 in the model
equation. We then use the fixed effects estimator and keep the sub-sovereign specific effects 𝜇𝑖𝑖 in our
specification.
Our dynamic panel framework for sub-sovereign spreads allows us to address a second endogeneity
problem that generally causes concerns in the empirical literature on bond yield spreads: fundamental
factors associated with an issuer’s creditworthiness can be affected by spreads (reverse causality), or
are simultaneously determined with spreads (e.g. Chen et al., 2007, JF; Bhojraj and Sengupta, 2003).
Governments may adjust their fiscal policies as spreads increase. The error term 𝜀𝑖𝑖𝑖 will then be
correlated with regressors in 𝑋𝑖𝑖𝑖 which is why OLS estimates of 𝛽 would be biased and inconsistent.
We deal with this second source of endogeneity in two ways. First, we use lagged differences of
debt/GDP, deficit/GDP, and real GDP growth as additional internal instruments in our system GMM
estimation. Second, we work with an external instrument. In a standard set-up with sovereign spreads
as dependent variable, the level of aggregation makes the identification of suitable instruments
difficult. In our set-up, variables for the federal level can serve as instruments for sub-sovereign
variables.7 Given that we address bailout expectations indirectly, we use the federation-wide growth
rate of GDP as instrument for sub-sovereign GDP growth and fiscal policy. Federation-wide GDP
growth is correlated with sub-sovereign growth rates (and through these indirectly with debt and
deficit ratios) as higher overall growth creates spillovers in investment and consumption. It is
sufficiently uncorrelated with sub-sovereign spreads however given that sub-sovereign entities in our
sample contribute at most 40 percent to federation-wide GDP.
7 Capeci (1994), for instance, uses grants municipalities receive from the centre as well as their determinants, including population size, as instruments for local government fiscal policy in his analysis of New Jersey municipality bond spreads.
ECB Working Paper 1987, December 2016 18
5 Results
5.1 Baseline results
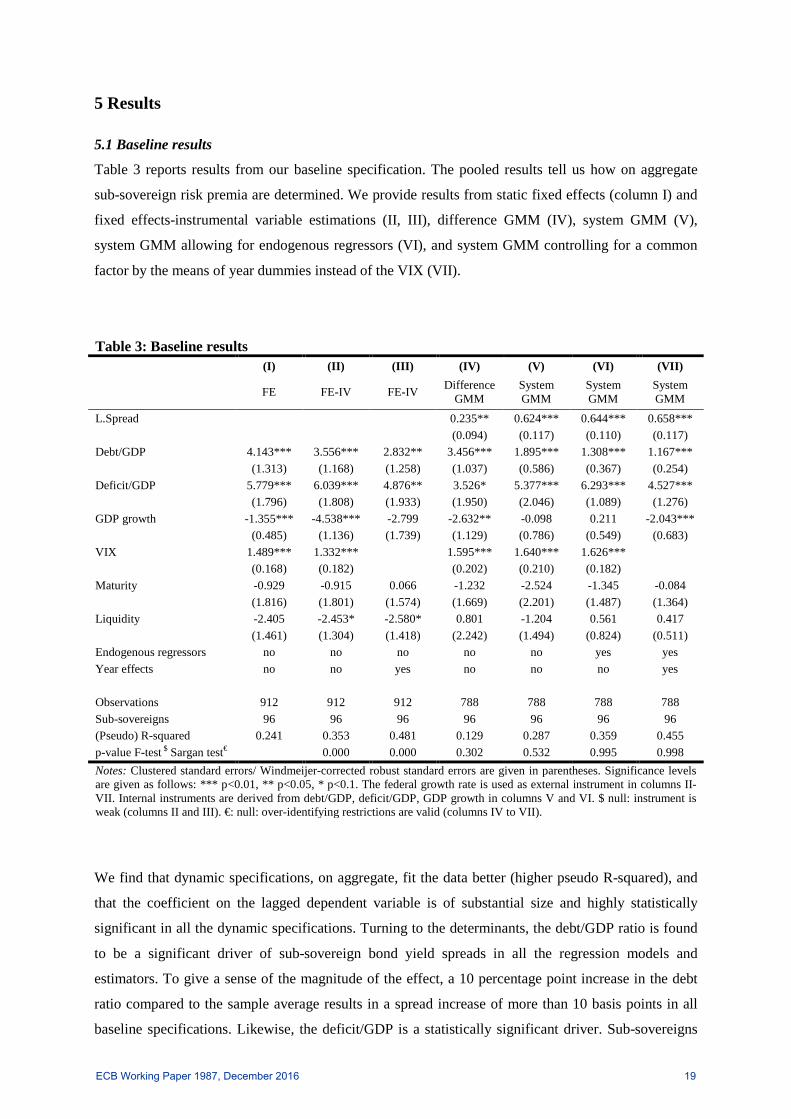
Table 3 reports results from our baseline specification. The pooled results tell us how on aggregate
sub-sovereign risk premia are determined. We provide results from static fixed effects (column I) and
fixed effects-instrumental variable estimations (II, III), difference GMM (IV), system GMM (V),
system GMM allowing for endogenous regressors (VI), and system GMM controlling for a common
factor by the means of year dummies instead of the VIX (VII).
Table 3: Baseline results (I) (II) (III) (IV) (V) (VI) (VII)
FE FE-IV FE-IV Difference GMM
System GMM
System GMM
System GMM
L.Spread 0.235** 0.624*** 0.644*** 0.658***
(0.094) (0.117) (0.110) (0.117) Debt/GDP 4.143*** 3.556*** 2.832** 3.456*** 1.895*** 1.308*** 1.167***
(1.313) (1.168) (1.258) (1.037) (0.586) (0.367) (0.254) Deficit/GDP 5.779*** 6.039*** 4.876** 3.526* 5.377*** 6.293*** 4.527***
(1.796) (1.808) (1.933) (1.950) (2.046) (1.089) (1.276) GDP growth -1.355*** -4.538*** -2.799 -2.632** -0.098 0.211 -2.043***
(0.485) (1.136) (1.739) (1.129) (0.786) (0.549) (0.683) VIX 1.489*** 1.332*** 1.595*** 1.640*** 1.626***
(0.168) (0.182) (0.202) (0.210) (0.182) Maturity -0.929 -0.915 0.066 -1.232 -2.524 -1.345 -0.084
(1.816) (1.801) (1.574) (1.669) (2.201) (1.487) (1.364) Liquidity -2.405 -2.453* -2.580* 0.801 -1.204 0.561 0.417
(1.461) (1.304) (1.418) (2.242) (1.494) (0.824) (0.511) Endogenous regressors no no no no no yes yes Year effects no no yes no no no yes
Observations 912 912 912 788 788 788 788 Sub-sovereigns 96 96 96 96 96 96 96 (Pseudo) R-squared 0.241 0.353 0.481 0.129 0.287 0.359 0.455 p-value F-test $ Sargan test€ 0.000 0.000 0.302 0.532 0.995 0.998 Notes: Clustered standard errors/ Windmeijer-corrected robust standard errors are given in parentheses. Significance levels are given as follows: *** p<0.01, ** p<0.05, * p<0.1. The federal growth rate is used as external instrument in columns II-VII. Internal instruments are derived from debt/GDP, deficit/GDP, GDP growth in columns V and VI. $ null: instrument is weak (columns II and III). €: null: over-identifying restrictions are valid (columns IV to VII).
We find that dynamic specifications, on aggregate, fit the data better (higher pseudo R-squared), and
that the coefficient on the lagged dependent variable is of substantial size and highly statistically
significant in all the dynamic specifications. Turning to the determinants, the debt/GDP ratio is found
to be a significant driver of sub-sovereign bond yield spreads in all the regression models and
estimators. To give a sense of the magnitude of the effect, a 10 percentage point increase in the debt
ratio compared to the sample average results in a spread increase of more than 10 basis points in all
baseline specifications. Likewise, the deficit/GDP is a statistically significant driver. Sub-sovereigns
ECB Working Paper 1987, December 2016 19
where the deficit rises 1 percentage point above the sample average see their risk premia increase by
between 3.5 and 6 basis points depending on the model specification. The coefficient estimate for real
GDP growth is statistically significant and shows the expected negative sign in the static set-up
(columns I and II), difference GMM (IV), and if time dummies are included (VII). However, estimates
of the coefficient for GDP growth in columns III, V and VI are statistically insignificant, possibly
reflecting measurement error and lags in the availability of GDP data.8 Taken together, these results
suggest that market discipline binds for the pricing of sub-sovereign government bonds as
fundamentals tend to be broadly priced into risk premia.
Turning to common factors, the VIX is another significant driver, entering all model specifications
with the expected sign. This confirms earlier findings and suggests that markets for sub-sovereign
bonds are sufficiently open for international risk aversion to significantly affect yield spreads.
Moreover, the VIX seems to capture most of the common variation in sub-sovereign spreads across
countries as year dummies do not improve results significantly (comparing columns II and III, and VI
and VII in Table 3).9
Time left to maturity appears to be insignificant on aggregate but it is kept as control. Our proxy for
bond liquidity shows the expected negative sign in some estimations, which suggests that liquidity
premia do play a role in the pricing of sub-sovereign spreads albeit not an important one. In what
follows, estimates in column VI (i.e. system GMM estimates allowing for endogenous regressors) will
serve as baseline.
5.2 Heterogeneity across federations: institutional differences and bailout expectations
In a next step, we estimate separate models for each federation in order to study how institutional
differences across fiscal federations are reflected in the determinants of sub-sovereign spreads. Table 4
reports results from a fixed effects estimation of the static version of our model.10 As for the baseline
8 Real GDP growth seems to negatively affect spreads only with a one-year lag, i.e. as estimates become available. This can be inferred from Table A4 in the Appendix, which reports estimates from a model specification with a richer dynamic structure. These estimates show that debt/GDP has a contemporaneous effect on spreads, while deficit/GDP affects spreads with a one-year lag. The effect of GDP growth seems to be positive initially and shows the expected negative sign with a lag, likely as a result of the delay in the publication of sub-sovereign GDP estimates. 9 We experimented with realised stock market volatility as an alternative, local measure of risk aversion but failed to find similarly significant results. 10 Results from a fixed effects-IV estimation using the federation-wide growth rate as instrument largely resemble results in Table 4 (Table A5 in the Appendix). Only for Australia and India the federation-wide growth rate seems to be an invalid instrument as coefficients on fundamentals turn insignificant which is confirmed by an F-test for weak instruments.
ECB Working Paper 1987, December 2016 20
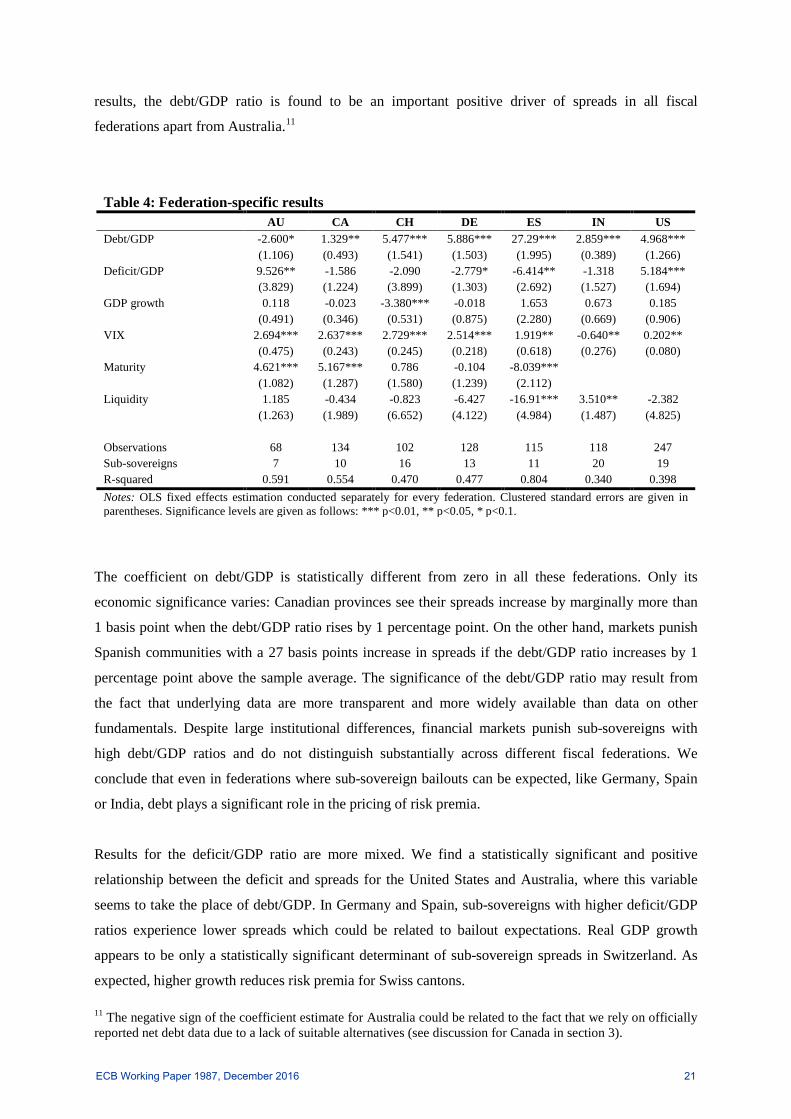
results, the debt/GDP ratio is found to be an important positive driver of spreads in all fiscal
federations apart from Australia.11
Table 4: Federation-specific results AU CA CH DE ES IN US Debt/GDP -2.600* 1.329** 5.477*** 5.886*** 27.29*** 2.859*** 4.968***
(1.106) (0.493) (1.541) (1.503) (1.995) (0.389) (1.266) Deficit/GDP 9.526** -1.586 -2.090 -2.779* -6.414** -1.318 5.184***
(3.829) (1.224) (3.899) (1.303) (2.692) (1.527) (1.694) GDP growth 0.118 -0.023 -3.380*** -0.018 1.653 0.673 0.185
(0.491) (0.346) (0.531) (0.875) (2.280) (0.669) (0.906) VIX 2.694*** 2.637*** 2.729*** 2.514*** 1.919** -0.640** 0.202**
(0.475) (0.243) (0.245) (0.218) (0.618) (0.276) (0.080) Maturity 4.621*** 5.167*** 0.786 -0.104 -8.039***
(1.082) (1.287) (1.580) (1.239) (2.112) Liquidity 1.185 -0.434 -0.823 -6.427 -16.91*** 3.510** -2.382
(1.263) (1.989) (6.652) (4.122) (4.984) (1.487) (4.825)
Observations 68 134 102 128 115 118 247 Sub-sovereigns 7 10 16 13 11 20 19 R-squared 0.591 0.554 0.470 0.477 0.804 0.340 0.398 Notes: OLS fixed effects estimation conducted separately for every federation. Clustered standard errors are given in parentheses. Significance levels are given as follows: *** p<0.01, ** p<0.05, * p<0.1.
The coefficient on debt/GDP is statistically different from zero in all these federations. Only its
economic significance varies: Canadian provinces see their spreads increase by marginally more than
1 basis point when the debt/GDP ratio rises by 1 percentage point. On the other hand, markets punish
Spanish communities with a 27 basis points increase in spreads if the debt/GDP ratio increases by 1
percentage point above the sample average. The significance of the debt/GDP ratio may result from
the fact that underlying data are more transparent and more widely available than data on other
fundamentals. Despite large institutional differences, financial markets punish sub-sovereigns with
high debt/GDP ratios and do not distinguish substantially across different fiscal federations. We
conclude that even in federations where sub-sovereign bailouts can be expected, like Germany, Spain
or India, debt plays a significant role in the pricing of risk premia.
Results for the deficit/GDP ratio are more mixed. We find a statistically significant and positive
relationship between the deficit and spreads for the United States and Australia, where this variable
seems to take the place of debt/GDP. In Germany and Spain, sub-sovereigns with higher deficit/GDP
ratios experience lower spreads which could be related to bailout expectations. Real GDP growth
appears to be only a statistically significant determinant of sub-sovereign spreads in Switzerland. As
expected, higher growth reduces risk premia for Swiss cantons.
11 The negative sign of the coefficient estimate for Australia could be related to the fact that we rely on officially reported net debt data due to a lack of suitable alternatives (see discussion for Canada in section 3).
ECB Working Paper 1987, December 2016 21
The coefficient on international risk aversion is significant throughout our regressions and of
comparable size for Australia, Canada, Switzerland, Germany and Spain. This may be because sub-
sovereign bonds of these federations are internationally traded. By contrast, the coefficient for the
United States is relatively small. This may be a result of the Muni market being relatively decoupled
from international developments. The coefficient for India is negative, perhaps partly due to the fact
that Indian state development loans cannot be traded outside the country. The disaggregate analysis
shows that it is important to include time to maturity as technical control as it is found significant for
Australia, Canada, and Spain.
5.3 Heterogeneity within federations: bailout expectations and capacity
Having established that sub-sovereign bond yield spreads tend to reflect fiscal and macroeconomic
fundamentals regardless of the prevailing institutional arrangement at the federal level, we now turn to
study the factors affecting the spread variation within federations.
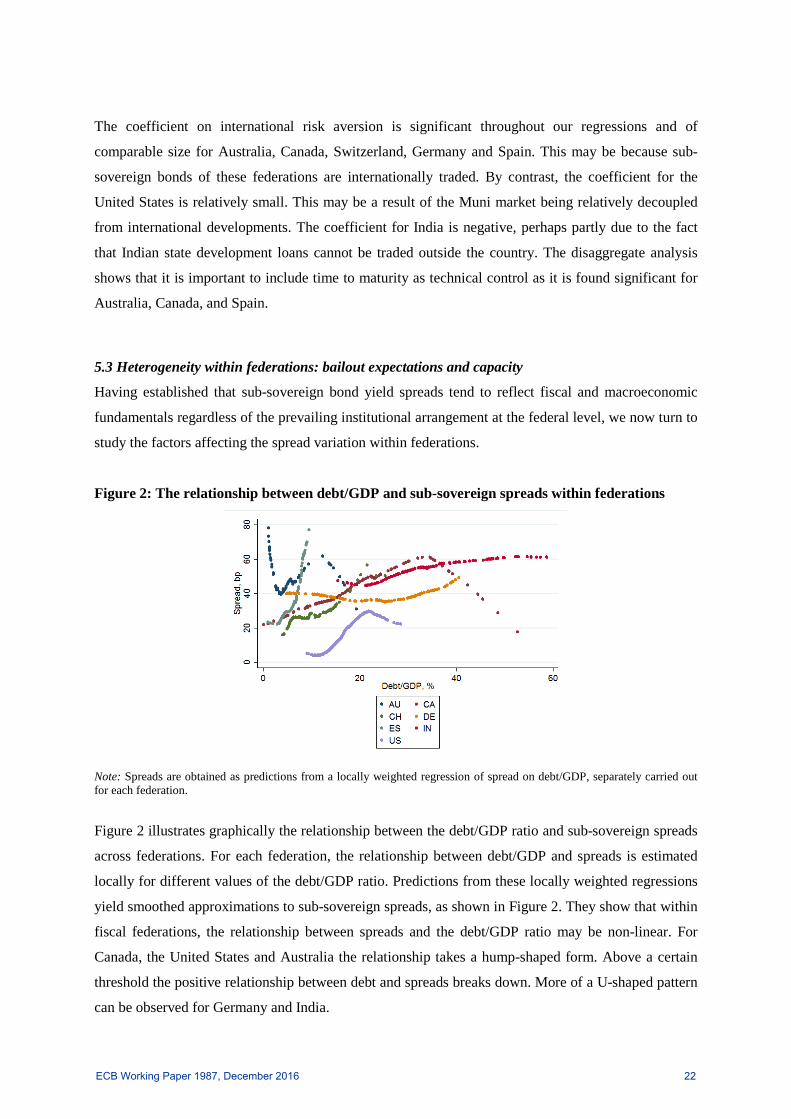
Figure 2: The relationship between debt/GDP and sub-sovereign spreads within federations
Note: Spreads are obtained as predictions from a locally weighted regression of spread on debt/GDP, separately carried out for each federation.
Figure 2 illustrates graphically the relationship between the debt/GDP ratio and sub-sovereign spreads
across federations. For each federation, the relationship between debt/GDP and spreads is estimated
locally for different values of the debt/GDP ratio. Predictions from these locally weighted regressions
yield smoothed approximations to sub-sovereign spreads, as shown in Figure 2. They show that within
fiscal federations, the relationship between spreads and the debt/GDP ratio may be non-linear. For
Canada, the United States and Australia the relationship takes a hump-shaped form. Above a certain
threshold the positive relationship between debt and spreads breaks down. More of a U-shaped pattern
can be observed for Germany and India.
ECB Working Paper 1987, December 2016 22
In order to analyse non-linearities in more detail, we employ the second part of our econometric
framework, as described in section 4.2, and test our hypotheses about (i) the market’s expectation that
the centre may bail out a sub-sovereign when fundamentals deteriorate, and (ii) the impact of bailout
capacity constraints set by the size of the sub-sovereign and borrowing conditions faced by the centre.
i) Bailout expectations
Table 5 provides results on the effect of bailout expectations on spreads. Column I shows that relative
economic size on its own is not a statistically significant determinant of sub-sovereign spreads.
However, this result does not hold when non-linearities are explicitly accounted for. This is shown in
Column II, which adds the square of the debt/GDP ratio to the specification. The statistically
significant and negative coefficient of this term indicates that a concave relationship exists between
debt/GDP and sub-sovereign spreads. Sub-sovereign governments pay larger premia for increases in
debt but sub-sovereigns with very high debt levels benefit from proportionally smaller increases in
premia until the inflection point is reached, at which point spreads will fall as the debt ratio increases.
We interpret this as a sign for soft budget constraints: debt ratios above certain thresholds make the
no-bailout commitment of the central government less credible. A similar finding was also highlighted
by Sola and Palomba (2015). Having controlled for the expectation of a federal bailout in this fashion,
the coefficient on relative economic size becomes significantly positive. Larger sub-sovereign entities
pay larger premia which further reinforces the conclusion that they may be “too big to be rescued”.
In columns III and IV, we assess in more detail the source of non-linearities between fundamentals
and spreads within fiscal federations. Column III controls for such a non-linear relationship through an
interaction between debt/GDP and a dummy that takes the value of one if debt/GDP lies above the
federation-specific median. This shows that sub-sovereign issuers with high debt levels do not
generally enjoy lower spreads, which might suggest that soft budget constraints do not apply to every
sub-sovereign equally. However, this result has to be interpreted with caution as the coefficient on the
relative interaction term in column III is statistically insignificant. Only when an additional interaction
between debt, the dummy variable and relative economic size is introduced, the pattern becomes in
fact more clear (column IV). If debt ratios are low, a positive relationship between debt and spreads
exists as bailouts are not expected and market discipline functions normally. This is reflected in a
significantly positive coefficient on the debt ratio. At the same time, sub-sovereigns with debt/GDP
ratios above federation medians pay lower premia the higher their debt level: the estimated coefficient
on the interaction between debt and the dummy for high indebtedness is significantly negative. The
larger the sub-sovereign entity, the smaller is the “benefit” on financial markets from having above-
median debt levels (“too big to be rescued”). This can be seen from the fact that the coefficient on the
ECB Working Paper 1987, December 2016 23
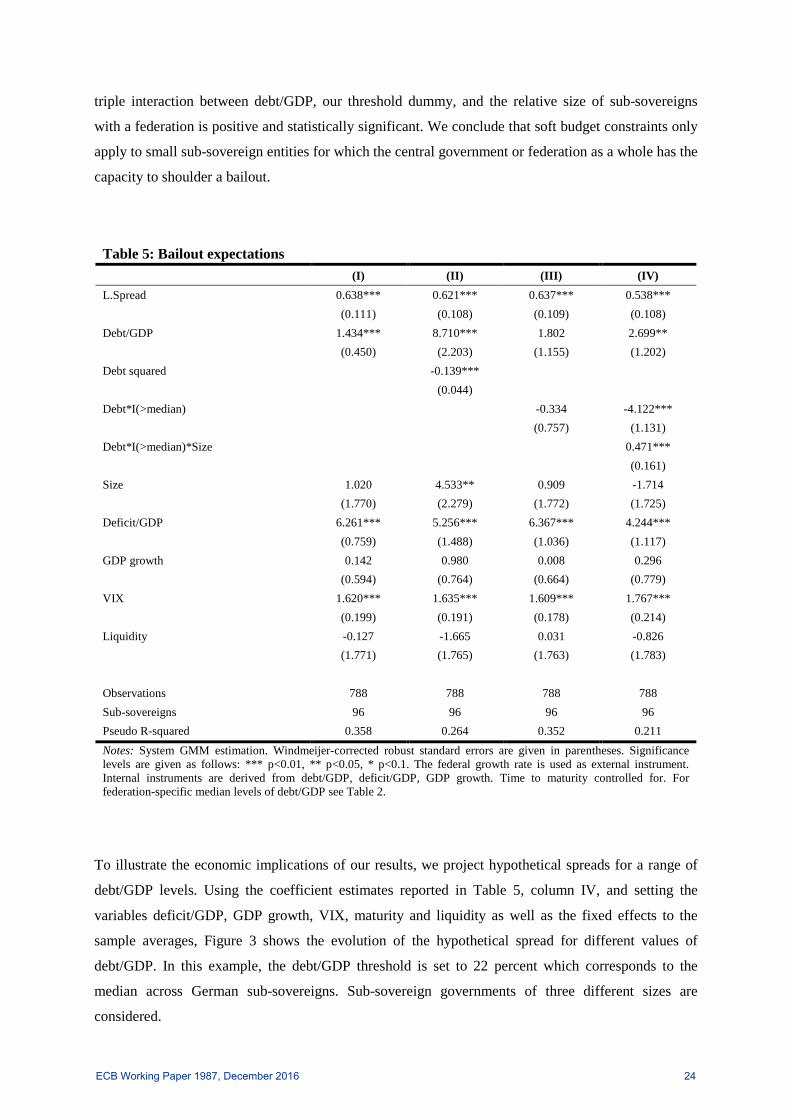
triple interaction between debt/GDP, our threshold dummy, and the relative size of sub-sovereigns
with a federation is positive and statistically significant. We conclude that soft budget constraints only
apply to small sub-sovereign entities for which the central government or federation as a whole has the
capacity to shoulder a bailout.
Table 5: Bailout expectations (I) (II) (III) (IV) L.Spread 0.638*** 0.621*** 0.637*** 0.538***
(0.111) (0.108) (0.109) (0.108) Debt/GDP 1.434*** 8.710*** 1.802 2.699**
(0.450) (2.203) (1.155) (1.202) Debt squared -0.139*** (0.044) Debt*I(>median) -0.334 -4.122*** (0.757) (1.131) Debt*I(>median)*Size 0.471***
(0.161) Size 1.020 4.533** 0.909 -1.714
(1.770) (2.279) (1.772) (1.725) Deficit/GDP 6.261*** 5.256*** 6.367*** 4.244***
(0.759) (1.488) (1.036) (1.117) GDP growth 0.142 0.980 0.008 0.296
(0.594) (0.764) (0.664) (0.779) VIX 1.620*** 1.635*** 1.609*** 1.767*** (0.199) (0.191) (0.178) (0.214) Liquidity -0.127 -1.665 0.031 -0.826
(1.771) (1.765) (1.763) (1.783)
Observations 788 788 788 788 Sub-sovereigns 96 96 96 96 Pseudo R-squared 0.358 0.264 0.352 0.211 Notes: System GMM estimation. Windmeijer-corrected robust standard errors are given in parentheses. Significance levels are given as follows: *** p<0.01, ** p<0.05, * p<0.1. The federal growth rate is used as external instrument. Internal instruments are derived from debt/GDP, deficit/GDP, GDP growth. Time to maturity controlled for. For federation-specific median levels of debt/GDP see Table 2.
To illustrate the economic implications of our results, we project hypothetical spreads for a range of
debt/GDP levels. Using the coefficient estimates reported in Table 5, column IV, and setting the
variables deficit/GDP, GDP growth, VIX, maturity and liquidity as well as the fixed effects to the
sample averages, Figure 3 shows the evolution of the hypothetical spread for different values of
debt/GDP. In this example, the debt/GDP threshold is set to 22 percent which corresponds to the
median across German sub-sovereigns. Sub-sovereign governments of three different sizes are
considered.
ECB Working Paper 1987, December 2016 24
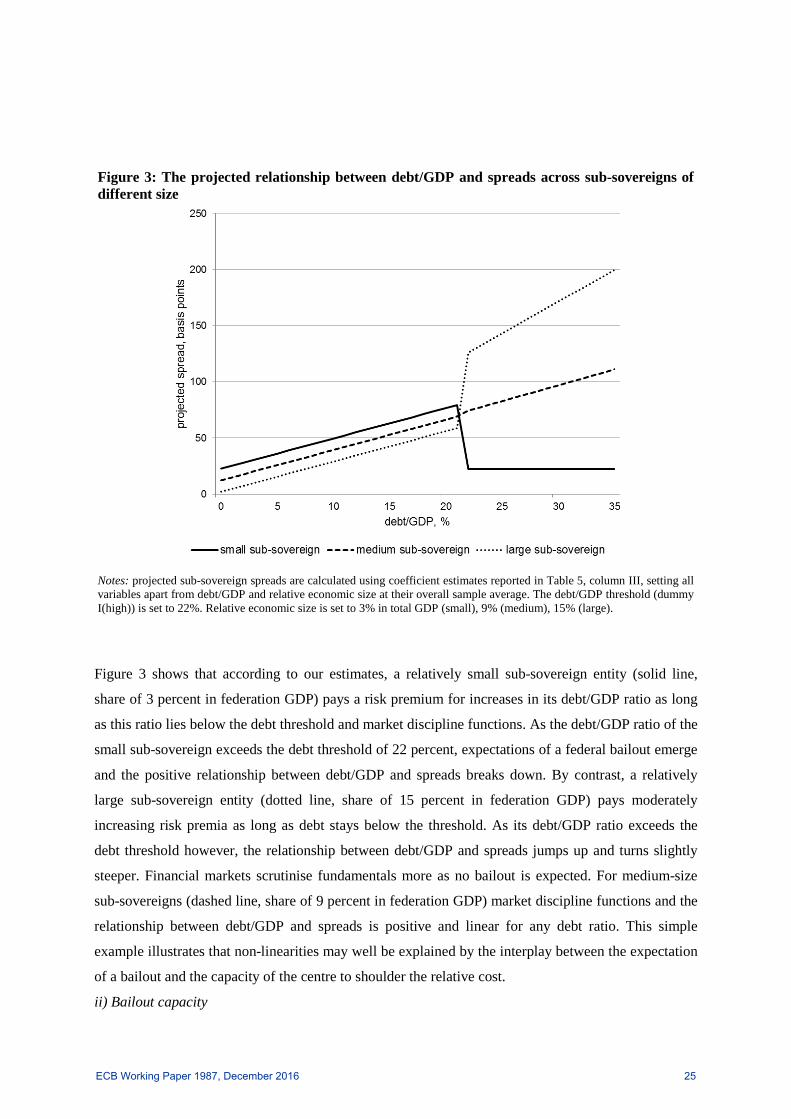
Figure 3: The projected relationship between debt/GDP and spreads across sub-sovereigns of different size
Notes: projected sub-sovereign spreads are calculated using coefficient estimates reported in Table 5, column III, setting all variables apart from debt/GDP and relative economic size at their overall sample average. The debt/GDP threshold (dummy I(high)) is set to 22%. Relative economic size is set to 3% in total GDP (small), 9% (medium), 15% (large).
Figure 3 shows that according to our estimates, a relatively small sub-sovereign entity (solid line,
share of 3 percent in federation GDP) pays a risk premium for increases in its debt/GDP ratio as long
as this ratio lies below the debt threshold and market discipline functions. As the debt/GDP ratio of the
small sub-sovereign exceeds the debt threshold of 22 percent, expectations of a federal bailout emerge
and the positive relationship between debt/GDP and spreads breaks down. By contrast, a relatively
large sub-sovereign entity (dotted line, share of 15 percent in federation GDP) pays moderately
increasing risk premia as long as debt stays below the threshold. As its debt/GDP ratio exceeds the
debt threshold however, the relationship between debt/GDP and spreads jumps up and turns slightly
steeper. Financial markets scrutinise fundamentals more as no bailout is expected. For medium-size
sub-sovereigns (dashed line, share of 9 percent in federation GDP) market discipline functions and the
relationship between debt/GDP and spreads is positive and linear for any debt ratio. This simple
example illustrates that non-linearities may well be explained by the interplay between the expectation
of a bailout and the capacity of the centre to shoulder the relative cost.
ii) Bailout capacity
ECB Working Paper 1987, December 2016 25
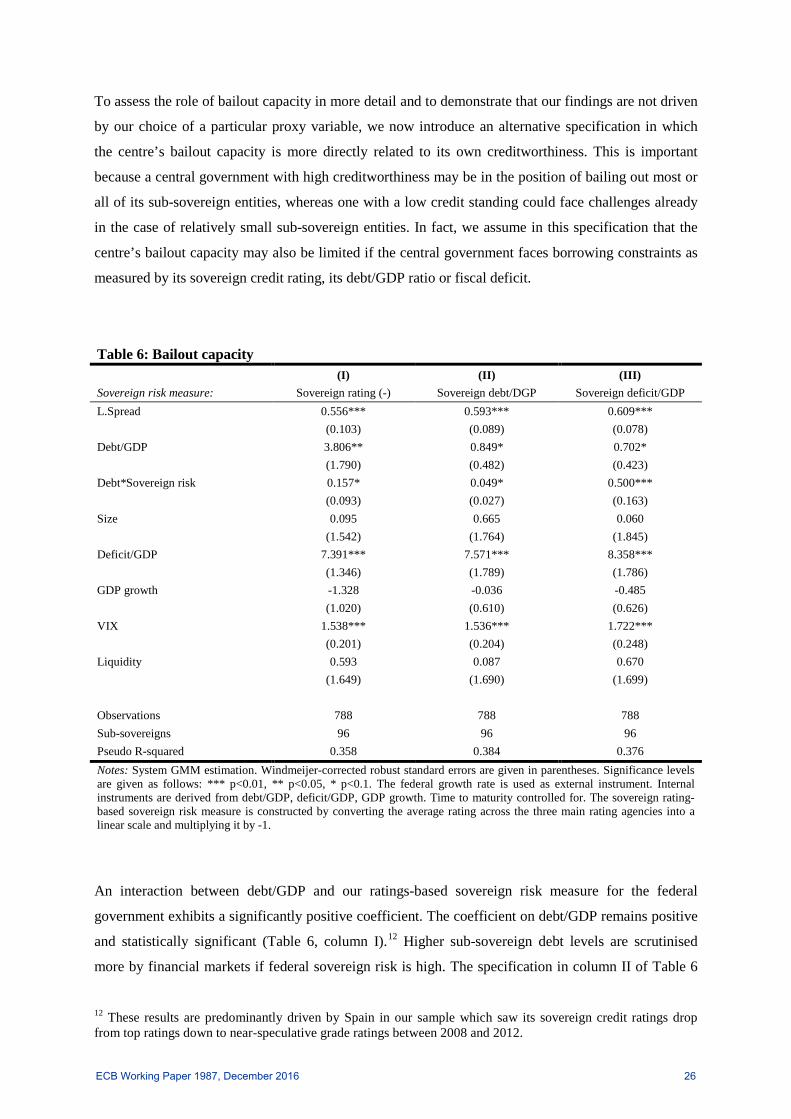
To assess the role of bailout capacity in more detail and to demonstrate that our findings are not driven
by our choice of a particular proxy variable, we now introduce an alternative specification in which
the centre’s bailout capacity is more directly related to its own creditworthiness. This is important
because a central government with high creditworthiness may be in the position of bailing out most or
all of its sub-sovereign entities, whereas one with a low credit standing could face challenges already
in the case of relatively small sub-sovereign entities. In fact, we assume in this specification that the
centre’s bailout capacity may also be limited if the central government faces borrowing constraints as
measured by its sovereign credit rating, its debt/GDP ratio or fiscal deficit.
Table 6: Bailout capacity
(I) (II) (III) Sovereign risk measure: Sovereign rating (-) Sovereign debt/DGP Sovereign deficit/GDP L.Spread 0.556*** 0.593*** 0.609***
(0.103) (0.089) (0.078) Debt/GDP 3.806** 0.849* 0.702*
(1.790) (0.482) (0.423) Debt*Sovereign risk 0.157* 0.049* 0.500*** (0.093) (0.027) (0.163) Size 0.095 0.665 0.060
(1.542) (1.764) (1.845) Deficit/GDP 7.391*** 7.571*** 8.358***
(1.346) (1.789) (1.786) GDP growth -1.328 -0.036 -0.485
(1.020) (0.610) (0.626) VIX 1.538*** 1.536*** 1.722***
(0.201) (0.204) (0.248) Liquidity 0.593 0.087 0.670 (1.649) (1.690) (1.699)
Observations 788 788 788 Sub-sovereigns 96 96 96 Pseudo R-squared 0.358 0.384 0.376 Notes: System GMM estimation. Windmeijer-corrected robust standard errors are given in parentheses. Significance levels are given as follows: *** p<0.01, ** p<0.05, * p<0.1. The federal growth rate is used as external instrument. Internal instruments are derived from debt/GDP, deficit/GDP, GDP growth. Time to maturity controlled for. The sovereign rating-based sovereign risk measure is constructed by converting the average rating across the three main rating agencies into a linear scale and multiplying it by -1.
An interaction between debt/GDP and our ratings-based sovereign risk measure for the federal
government exhibits a significantly positive coefficient. The coefficient on debt/GDP remains positive
and statistically significant (Table 6, column I).12 Higher sub-sovereign debt levels are scrutinised
more by financial markets if federal sovereign risk is high. The specification in column II of Table 6
12 These results are predominantly driven by Spain in our sample which saw its sovereign credit ratings drop from top ratings down to near-speculative grade ratings between 2008 and 2012.
ECB Working Paper 1987, December 2016 26
approximates sovereign risk with central government debt/GDP. Confirming our results using credit
ratings, we find that an increase in central government debt/GDP decreases its capacity to bailout,
which more than proportionally increases risk premia for affected sub-sovereigns: the interaction
between sub-sovereign debt/GDP and central government debt/GDP is positive and significant while
the benchmark coefficient for sub-sovereign debt/GDP remains positive and statistically significant.
Similar findings are obtained for central government deficit/GDP as sovereign risk measure (column
III).
5.4 Robustness checks
To confirm the robustness of our results to the chosen estimation strategy, we estimate our non-linear
specifications for the expectation of a bailout and for the bailout capacity using the static version of
our fixed effects-IV regression model. Table A6 in the Appendix reports results from static but
otherwise equivalent specifications for bailout expectations. Results hold, albeit at lower levels of
statistical significance. The economic size variable is found to be statistically significant and positive
which confirms that larger sub-sovereigns pay larger premia (“too big to be rescued”) while sub-
sovereigns with more liquid bond markets benefit from lower liquidity premia. Table A7 in the
Appendix confirms that our results on bailout capacity also hold when a simpler static fixed effects-IV
estimator is used. Higher sovereign credit risk translates into higher risk premia for increases in sub-
sovereign debt/GDP.
As a further robustness check, we re-estimate our model considering deficit/GDP as the fundamental
variable whose effect on sub-sovereign spreads is allowed to vary with bailout expectations and
capacity considerations. Tables A8a and A8b in the Appendix provide results on bailout expectation
for deficit/GDP. While the non-linearity between deficit/GDP and spreads seems to be weaker than for
debt/GDP (columns I), we find that in particular larger sub-sovereign entities pay increasing risk
premia as their deficit ratios increase. This supports our findings on the role of bailout expectations for
the pricing of sub-sovereign bond spreads. Interacting deficit/GDP with measures of sovereign risk
confirms the findings we obtain for debt/GDP: the more sovereign creditworthiness deteriorates, the
more are sub-sovereign governments scrutinised for larger fiscal deficits (Tables A9a and A9b in the
Appendix).
For completeness, we also test for non-linear relationships between fiscal fundamentals and sub-
sovereign spreads separately for each fiscal federation (Tables A10a and A10b in the Appendix).
Again, we find that regardless of the prevailing fiscal framework, our core results hold. Even in the
United States where strict no-bailout provisions apply, states with above-median debt levels benefit
from lower premia unless they are large in terms of economic size (Table A10a). For Canada, only the
triple interaction between debt/GDP, our threshold dummy and relative economic size is significantly
ECB Working Paper 1987, December 2016 27
positive: market discipline seems to function only for larger sub-sovereigns with relatively high debt
levels (Table A10a).
6 Conclusion In a novel panel dataset of sub-sovereign bond yield spreads, we exploit the variation of spreads across
and within federations and over time. We find that differences in the institutional design of fiscal
federations are reflected in spreads but not in a straightforward way. On aggregate, investors appear to
price fiscal fundamentals – in particular the debt/GDP ratio – into bond yield spreads, with global risk
aversion also playing an important role. Although different weights are put on the various fiscal
fundamentals, the result holds across highly heterogeneous federal systems with different fiscal
institutions and heterogeneous market expectations about eventual bailout provisions by the federal
government. While we conclude that, on aggregate, market discipline operates, there are exceptions.
By allowing for heterogeneous effects of bailout expectations within federations, we find that for sub-
sovereigns with very high levels of debt, the positive link between debt/GDP and sub-sovereign
spreads breaks down. Our interpretation is that financial markets expect the central government, or
federation as a whole, to provide bailouts when debt levels enter a “danger zone”. However, the
capacity of the centre to provide assistance should also be put into the picture. In fact, we find that
beyond a certain debt threshold, larger sub-sovereigns pay higher premia for high levels of debt,
whereas smaller sub-sovereigns pay lower spreads as their debt increases. From this, we infer that “too
big to be rescued” considerations may be at play for larger sub-sovereign governments. Finally, we
find that, if a federation as a whole faces borrowing constraints in the form of a low sovereign credit
rating, high central government debt/GDP or high fiscal deficits, its bailout capacity is reduced. As a
result, market discipline binds, and sub-sovereigns are scrutinised more as their fiscal fundamentals
deteriorate. We conclude that the extent to which fiscal fundamentals are reflected in bond spreads
depends on both the expectation of a federal bailout and the capacity of the centre, or federation as a
whole, to provide assistance.
ECB Working Paper 1987, December 2016 28
References Aizenman, J., Hutchison, M., and Jinjarak, Y. (2013). What is the risk of European sovereign debt defaults? Fiscal space, CDS spreads and market pricing of risk. Journal of International Money and Finance, 34, 37-59.
Arellano, M., and Bond, S. (1991). Some tests of specification for panel data: Monte Carlo evidence and an application to employment equations. Review of Economic Studies, 58, 227-297.
Arellano, M., and Bover, O. (1995). Another look at the instrumental variable estimation of error-components models. Journal of Econometrics, 68(1), 29-51.
Attinasi M.-G., Checherita, C., and Nickel, C. (2009). What Explains the Surge in Euro Area Sovereign Spreads During the Financial Crisis of 2007-09? European Central Bank Working Paper Series, No. 1131, Dec. 2009.
Bayoumi, T., Goldstein, M., and Woglom, G. (1995). Do Credit Markets Discipline Sovereign Borrowers? Evidence from U.S. States. Journal of Money, Credit and Banking, Vol. 24, No. 4, Part 1, pp. 1046-1059.
Beber, A., Brandt, M., and Kavajecz, K. (2009). Flight-to-Quality or Flight-to-Liquidity? Evidence from the Euro-Area Bond Market. The Review of Financial Studies, 22/3, 925-957.
Beirne, J., and Fratzscher, M. (2013). The pricing of sovereign risk and contagion during the European sovereign debt crisis. Journal of International Money and Finance, 34, 60-82.
Bernoth, K., and Erdogan, B. (2012). Sovereign bond yield spreads: A time-varying coefficient approach. Journal of International Money and Finance, 31(3), 639-656.
Bhojraj, S., and Sengupta, P. (2003). Effect of corporate governance on bond ratings and yields: The role of institutional investors and outside directors. The Journal of Business, 76.3, 455-475.
Booth, L., Georgopoulos, G., and Hejazi, W. (2007). What drives provincial‐Canada yield spreads?. Canadian Journal of Economics/Revue canadienne d'économique, 40(3), 1008-1032.
Bose, D., Jain, R., and Lakshmanan, L. (2011). Determinants of Primary Yield Spreads of States in India: An Econometric Analysis. RBI Working Paper Series, DEPR 10/2011, Reserve Bank of India.
Capeci, J. (1994). Local fiscal policies, default risk, and municipal borrowing costs. Journal of Public Economics, 53, 73-89.
Canuto, O., and Liu, L. (2010). Subnational Debt Finance and the Global Financial Crisis. Economic Premise, May 2010, Number 13, Poverty Reduction and Economic Management Network, The World Bank.
Chen, L., Lesmond, D., and Wei, J. (2007). Corporate yield spreads and bond liquidity. Journal of Finance, 62, 1, 119-149.
Codogno, L., Favero, C., and Missale, A. (2003). Yield spreads on EMU government bonds. Economic Policy, 18(37), 503-532.
De Grauwe, P., and Ji, Y. (2013). Self-fulfilling crises in the Eurozone: an empirical test. Journal of International Money and Finance, 34, 15-36.
ECB Working Paper 1987, December 2016 29

Dell’Erba, S., Hausmann, R., and Panizza, U. (2013). Debt levels, debt composition, and sovereign spreads in emerging and advanced economies. Oxford Review of Economic Policy, vol. 29, number 9, 2013, 518-547.
De Santis, R. (2015). A Measure of Re-Denomination Risk. ECB Working Paper No. 1785, April.
Edwards, S. (1984). LDC foreign borrowing and default risk: An empirical investigation. 1976-1980. American Economic Review 74, 726-734.
Eyraud, L., and Moreno Badia, M. (2013). Too small to fail? Subnational spending pressures in Europe. IMF Working Paper, 13/46.
Favero, C., Pagano, M., and von Thadden, E.L., 2010. How does liquidity affect government bond yields? Journal of Financial and Quantitative Analysis, 45, 107–134.
Feld, L., Kalb, A., Moessinger, M., and Osterloh, S. (2013). Sovereign Bond Market Reactions to Fiscal Rules and No-Bailout Clauses – The Swiss Experience. CESifo Working Paper Series, 4195, Munich.
Galvani, V., and Behnamian, A. (2009). A Comparative Analysis of the Returns on Provincial and Federal Canadian Bonds. University of Alberta, Department of Economics Working Papers, (2009-7).
Gómez-Puig, M. (2006). Size matters for liquidity: Evidence from EMU sovereign yield spreads. Economics Letters, 90(2), 156-162.
Hastie, L. (1972). Determinants of municipal bond yields. The Journal of Financial and Quantitative Analysis, 7(3), 1729-1748.
Heppke-Falk, K., Wolff, G. (2007). Moral hazard and bail-out in fiscal federations: Evidence for the German Länder. Discussion Paper, Series 1, 07/2007, Deutsche Bundesbank.
Hong, S., Nadler, D., and von Müller, C. (2012). Do (German) State Bond Markets Discount Politics? Program on Education Policy and Governance Working Paper Series, Harvard University.
Johnson, C., and Kriz, K. (2005). Fiscal Institutions, Credit Ratings, and Borrowing Costs. Public Budgeting and Finance, Spring 2005, pp. 84-103.
Jenkner, E., Lu, Z. (2014). Sub-National Credit Risk and Sovereign Bailouts – Who Pays the Premium? IMF Working Paper, 14/20, International Monetary Fund.
Joffe, M. (2012). Provincial Solvency and Federal Obligations. Macdonald-Laurier Institute.
Landon, S., and Smith, C. E. (2000). Government debt spillovers and creditworthiness in a federation. Canadian Journal of Economics/Revue canadienne d'économique, 33(3), 634-661.
Landon, S., and Smith, C. (2007). Government debt spillovers in a monetary union. North American Journal of Economics and Finance, 18(2007), pp. 135-154.
Lemmen, J. (1999). Managing Government default Risk in Federal States. FMG Special Paper, No. 116.
Liu, L., and Tan, K. (2009). Subnational Credit Ratings. A Comparative Review. Policy Research Working Paper, 5013, The World Bank.
ECB Working Paper 1987, December 2016 30
Manganelli, S., and Wolswijk, G. (2009). What drives spreads in the euro area government bond market? Economic Policy, 24(58), 191-240.
Oates, W. E. (2005). Toward a second-generation theory of fiscal federalism. International Tax and Public Finance, 12(4), 349-373.
Oates, W. E. (2008). On the evolution of fiscal federalism: theory and institutions. National Tax Journal, 313-334.
Poterba, J., and Rueben, K. (1999). State Fiscal Institutions and U.S. Municipal Bond Market. In Poterba, J. (ed). Fiscal Institutions and Fiscal Performance, University of Chicago Press, pp. 181-208.
Rodden, J., Eskeland, G., and Litvack, J. (2003). Fiscal Decentralization and the Challenge of Hard Budget Constraints. MIT Press.
Rodden, J. (2005). And the last shall be first: federalism and soft budget constraints in Germany. Mimeo (Massachusetts Institute of Technology).
Schuknecht, L., Von Hagen, J., and Wolswijk, G. (2009). Government risk premiums in the bond market: EMU and Canada. European Journal of Political Economy, 25(3), 371-384.
Schuknecht, L., Von Hagen, J., and Wolswijk, G. (2011). Government bond risk premiums in the EU revisited: The impact of the financial crisis. European Journal of Political Economy, 27(1), 36-43.
Schulz, A., and Wolff, G. (2009). The German Sub-national Government Bond Market: Structure, Determinants of Yield Spreads and Berlin’s Forgone Bail-out. Journal of Economics and Statistics, Justus Liebig University Giessen, 229(1), pp. 61-83.
Sgherri, S., and Zoli, E., (2009). Euro area sovereign risk during the crisis. IMF Working Papers, 09/222, International Monetary Fund.
Sola, S., and Palomba, G. (2015). Sub-National Governments’ Risk Premia: Does Fiscal Performance Matter? IMF Working Papers, 15/117, International Monetary Fund.
Wildasin, D. E. (2004). The institutions of federalism: Toward an analytical framework. National Tax Journal, 247-272.
Wooldridge, J. M. (2010). Econometric analysis of cross section and panel data. MIT press.
Zipfel, F., and Zimmer, J. (2013). Länder bonds. What drives the spreads between federal bonds and Länder bonds? Current Issues Germany, Deutsche Bank Research.
ECB Working Paper 1987, December 2016 31
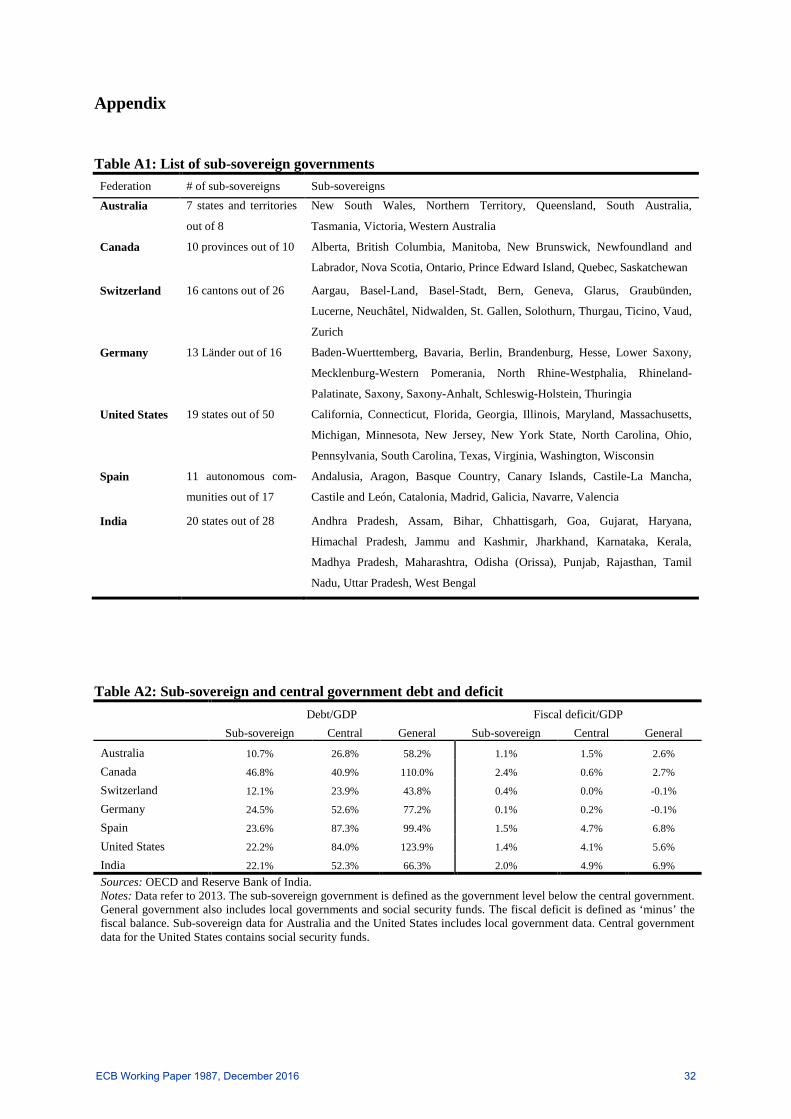
Appendix
Table A1: List of sub-sovereign governments Federation # of sub-sovereigns Sub-sovereigns Australia 7 states and territories
out of 8
New South Wales, Northern Territory, Queensland, South Australia,
Tasmania, Victoria, Western Australia
Canada 10 provinces out of 10 Alberta, British Columbia, Manitoba, New Brunswick, Newfoundland and
Labrador, Nova Scotia, Ontario, Prince Edward Island, Quebec, Saskatchewan
Switzerland 16 cantons out of 26 Aargau, Basel-Land, Basel-Stadt, Bern, Geneva, Glarus, Graubünden,
Lucerne, Neuchâtel, Nidwalden, St. Gallen, Solothurn, Thurgau, Ticino, Vaud,
Zurich
Germany 13 Länder out of 16 Baden-Wuerttemberg, Bavaria, Berlin, Brandenburg, Hesse, Lower Saxony,
Mecklenburg-Western Pomerania, North Rhine-Westphalia, Rhineland-
Palatinate, Saxony, Saxony-Anhalt, Schleswig-Holstein, Thuringia
United States 19 states out of 50 California, Connecticut, Florida, Georgia, Illinois, Maryland, Massachusetts,
Michigan, Minnesota, New Jersey, New York State, North Carolina, Ohio,
Pennsylvania, South Carolina, Texas, Virginia, Washington, Wisconsin
Spain 11 autonomous com-
munities out of 17
Andalusia, Aragon, Basque Country, Canary Islands, Castile-La Mancha,
Castile and León, Catalonia, Madrid, Galicia, Navarre, Valencia
India 20 states out of 28 Andhra Pradesh, Assam, Bihar, Chhattisgarh, Goa, Gujarat, Haryana,
Himachal Pradesh, Jammu and Kashmir, Jharkhand, Karnataka, Kerala,
Madhya Pradesh, Maharashtra, Odisha (Orissa), Punjab, Rajasthan, Tamil
Nadu, Uttar Pradesh, West Bengal
Table A2: Sub-sovereign and central government debt and deficit
Debt/GDP Fiscal deficit/GDP
Sub-sovereign Central General Sub-sovereign Central General
Australia 10.7% 26.8% 58.2% 1.1% 1.5% 2.6%
Canada 46.8% 40.9% 110.0% 2.4% 0.6% 2.7%
Switzerland 12.1% 23.9% 43.8% 0.4% 0.0% -0.1%
Germany 24.5% 52.6% 77.2% 0.1% 0.2% -0.1%
Spain 23.6% 87.3% 99.4% 1.5% 4.7% 6.8%
United States 22.2% 84.0% 123.9% 1.4% 4.1% 5.6%
India 22.1% 52.3% 66.3% 2.0% 4.9% 6.9% Sources: OECD and Reserve Bank of India. Notes: Data refer to 2013. The sub-sovereign government is defined as the government level below the central government. General government also includes local governments and social security funds. The fiscal deficit is defined as ‘minus’ the fiscal balance. Sub-sovereign data for Australia and the United States includes local government data. Central government data for the United States contains social security funds.
ECB Working Paper 1987, December 2016 32
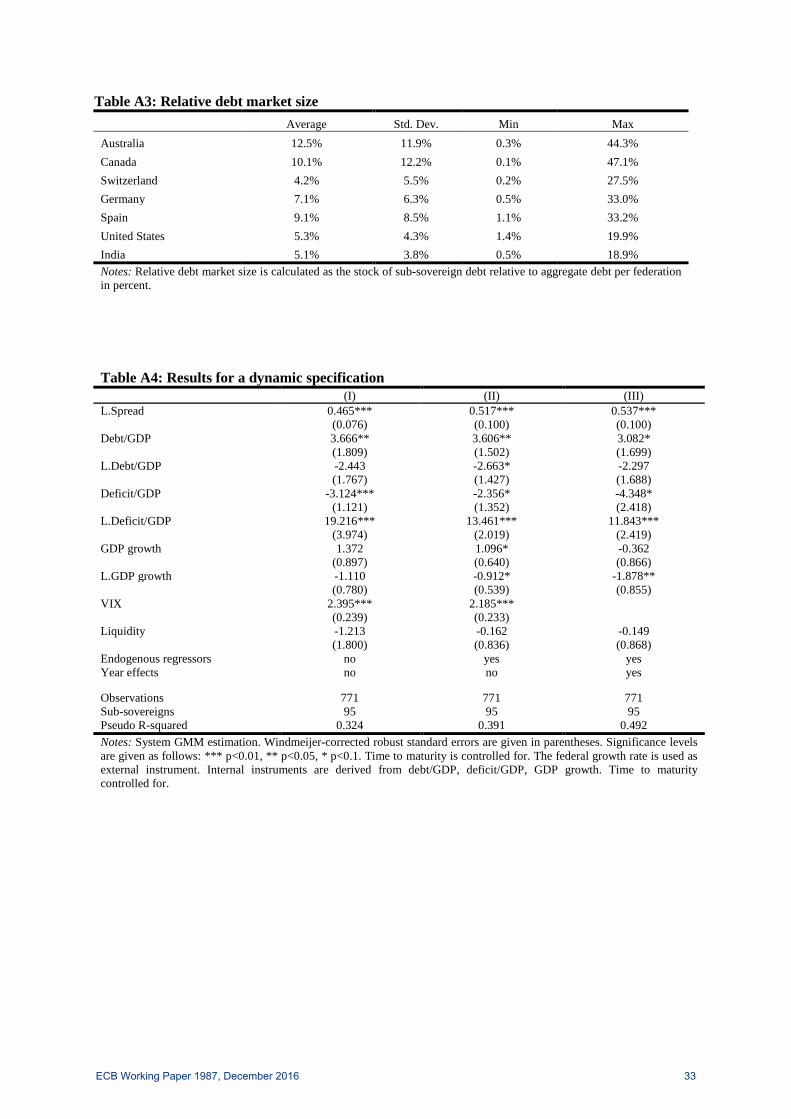
Table A3: Relative debt market size
Average Std. Dev. Min Max
Australia 12.5% 11.9% 0.3% 44.3% Canada 10.1% 12.2% 0.1% 47.1% Switzerland 4.2% 5.5% 0.2% 27.5% Germany 7.1% 6.3% 0.5% 33.0% Spain 9.1% 8.5% 1.1% 33.2% United States 5.3% 4.3% 1.4% 19.9% India 5.1% 3.8% 0.5% 18.9% Notes: Relative debt market size is calculated as the stock of sub-sovereign debt relative to aggregate debt per federation in percent.
Table A4: Results for a dynamic specification
(I) (II) (III)
L.Spread 0.465*** 0.517*** 0.537***
(0.076) (0.100) (0.100)
Debt/GDP 3.666** 3.606** 3.082*
(1.809) (1.502) (1.699)
L.Debt/GDP -2.443 -2.663* -2.297
(1.767) (1.427) (1.688)
Deficit/GDP -3.124*** -2.356* -4.348*
(1.121) (1.352) (2.418)
L.Deficit/GDP 19.216*** 13.461*** 11.843***
(3.974) (2.019) (2.419)
GDP growth 1.372 1.096* -0.362
(0.897) (0.640) (0.866)
L.GDP growth -1.110 -0.912* -1.878**
(0.780) (0.539) (0.855)
VIX 2.395*** 2.185***
(0.239) (0.233) Liquidity -1.213 -0.162 -0.149
(1.800) (0.836) (0.868)
Endogenous regressors no yes yes Year effects no no yes
Observations 771 771 771 Sub-sovereigns 95 95 95 Pseudo R-squared 0.324 0.391 0.492 Notes: System GMM estimation. Windmeijer-corrected robust standard errors are given in parentheses. Significance levels are given as follows: *** p<0.01, ** p<0.05, * p<0.1. Time to maturity is controlled for. The federal growth rate is used as external instrument. Internal instruments are derived from debt/GDP, deficit/GDP, GDP growth. Time to maturity controlled for.
ECB Working Paper 1987, December 2016 33
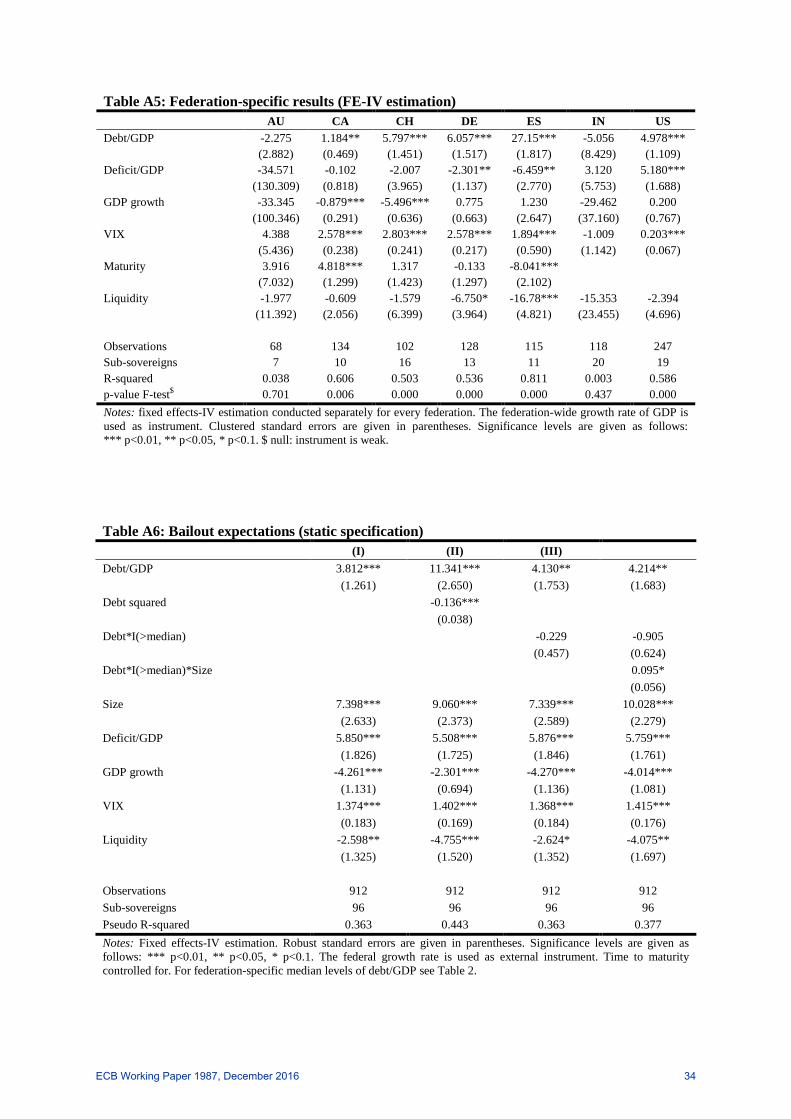
Table A5: Federation-specific results (FE-IV estimation) AU CA CH DE ES IN US Debt/GDP -2.275 1.184** 5.797*** 6.057*** 27.15*** -5.056 4.978***
(2.882) (0.469) (1.451) (1.517) (1.817) (8.429) (1.109) Deficit/GDP -34.571 -0.102 -2.007 -2.301** -6.459** 3.120 5.180***
(130.309) (0.818) (3.965) (1.137) (2.770) (5.753) (1.688) GDP growth -33.345 -0.879*** -5.496*** 0.775 1.230 -29.462 0.200
(100.346) (0.291) (0.636) (0.663) (2.647) (37.160) (0.767) VIX 4.388 2.578*** 2.803*** 2.578*** 1.894*** -1.009 0.203***
(5.436) (0.238) (0.241) (0.217) (0.590) (1.142) (0.067) Maturity 3.916 4.818*** 1.317 -0.133 -8.041***
(7.032) (1.299) (1.423) (1.297) (2.102) Liquidity -1.977 -0.609 -1.579 -6.750* -16.78*** -15.353 -2.394
(11.392) (2.056) (6.399) (3.964) (4.821) (23.455) (4.696)
Observations 68 134 102 128 115 118 247 Sub-sovereigns 7 10 16 13 11 20 19 R-squared 0.038 0.606 0.503 0.536 0.811 0.003 0.586 p-value F-test$ 0.701 0.006 0.000 0.000 0.000 0.437 0.000 Notes: fixed effects-IV estimation conducted separately for every federation. The federation-wide growth rate of GDP is used as instrument. Clustered standard errors are given in parentheses. Significance levels are given as follows: *** p<0.01, ** p<0.05, * p<0.1. $ null: instrument is weak.
Table A6: Bailout expectations (static specification) (I) (II) (III) Debt/GDP 3.812*** 11.341*** 4.130** 4.214**
(1.261) (2.650) (1.753) (1.683) Debt squared -0.136*** (0.038) Debt*I(>median) -0.229 -0.905 (0.457) (0.624) Debt*I(>median)*Size 0.095*
(0.056) Size 7.398*** 9.060*** 7.339*** 10.028***
(2.633) (2.373) (2.589) (2.279) Deficit/GDP 5.850*** 5.508*** 5.876*** 5.759***
(1.826) (1.725) (1.846) (1.761) GDP growth -4.261*** -2.301*** -4.270*** -4.014***
(1.131) (0.694) (1.136) (1.081) VIX 1.374*** 1.402*** 1.368*** 1.415*** (0.183) (0.169) (0.184) (0.176) Liquidity -2.598** -4.755*** -2.624* -4.075**
(1.325) (1.520) (1.352) (1.697)
Observations 912 912 912 912 Sub-sovereigns 96 96 96 96 Pseudo R-squared 0.363 0.443 0.363 0.377 Notes: Fixed effects-IV estimation. Robust standard errors are given in parentheses. Significance levels are given as follows: *** p<0.01, ** p<0.05, * p<0.1. The federal growth rate is used as external instrument. Time to maturity controlled for. For federation-specific median levels of debt/GDP see Table 2.
ECB Working Paper 1987, December 2016 34
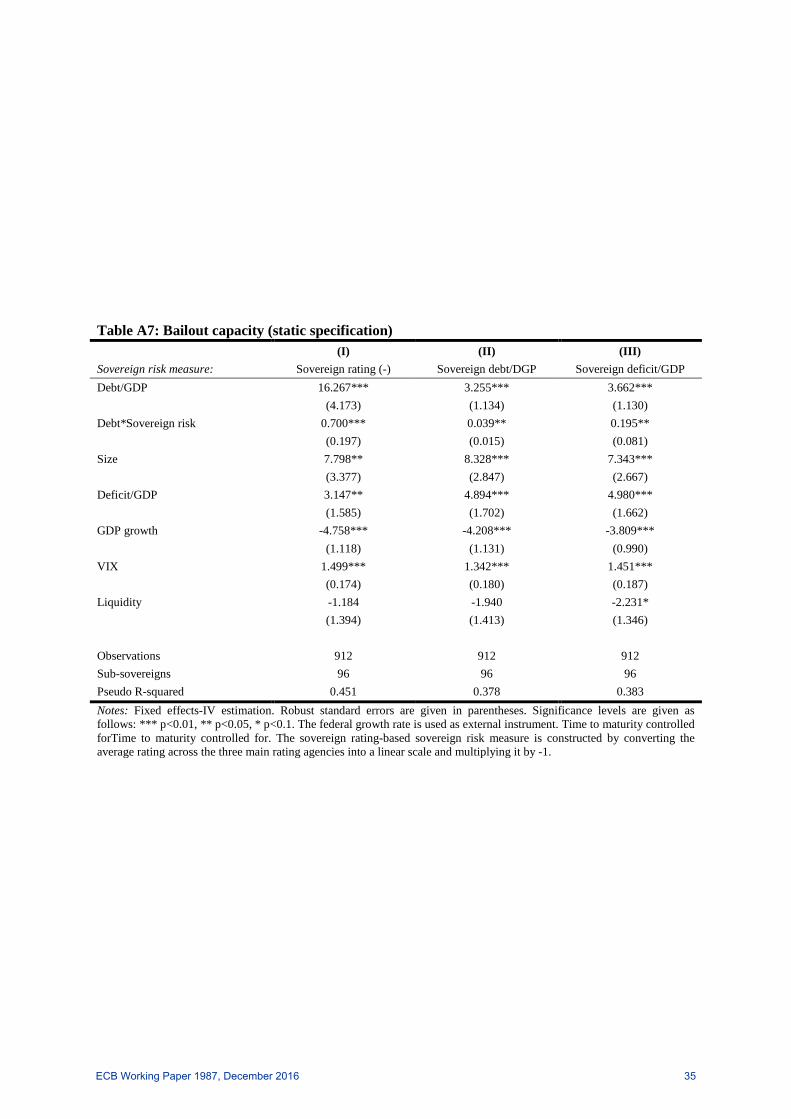
Table A7: Bailout capacity (static specification)
(I) (II) (III) Sovereign risk measure: Sovereign rating (-) Sovereign debt/DGP Sovereign deficit/GDP Debt/GDP 16.267*** 3.255*** 3.662***
(4.173) (1.134) (1.130) Debt*Sovereign risk 0.700*** 0.039** 0.195** (0.197) (0.015) (0.081) Size 7.798** 8.328*** 7.343***
(3.377) (2.847) (2.667) Deficit/GDP 3.147** 4.894*** 4.980***
(1.585) (1.702) (1.662) GDP growth -4.758*** -4.208*** -3.809***
(1.118) (1.131) (0.990) VIX 1.499*** 1.342*** 1.451***
(0.174) (0.180) (0.187) Liquidity -1.184 -1.940 -2.231* (1.394) (1.413) (1.346)
Observations 912 912 912 Sub-sovereigns 96 96 96 Pseudo R-squared 0.451 0.378 0.383 Notes: Fixed effects-IV estimation. Robust standard errors are given in parentheses. Significance levels are given as follows: *** p<0.01, ** p<0.05, * p<0.1. The federal growth rate is used as external instrument. Time to maturity controlled forTime to maturity controlled for. The sovereign rating-based sovereign risk measure is constructed by converting the average rating across the three main rating agencies into a linear scale and multiplying it by -1.
ECB Working Paper 1987, December 2016 35
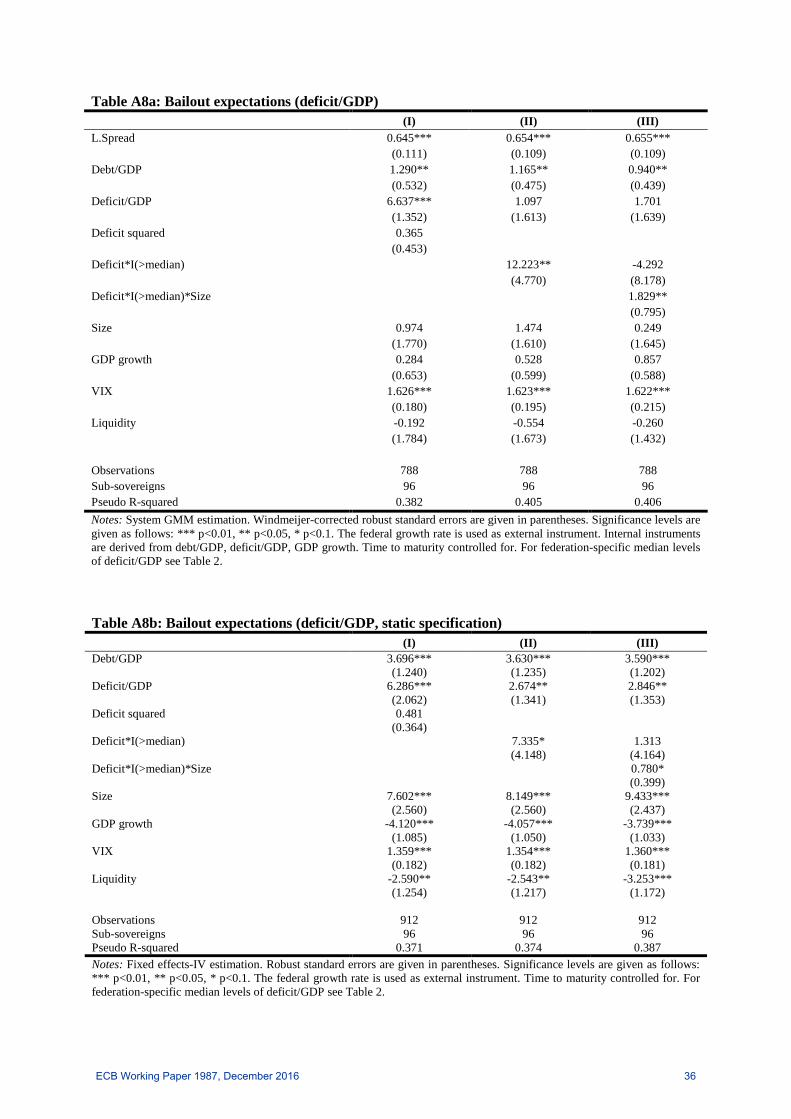
Table A8a: Bailout expectations (deficit/GDP) (I) (II) (III) L.Spread 0.645*** 0.654*** 0.655***
(0.111) (0.109) (0.109) Debt/GDP 1.290** 1.165** 0.940**
(0.532) (0.475) (0.439) Deficit/GDP 6.637*** 1.097 1.701 (1.352) (1.613) (1.639) Deficit squared 0.365 (0.453) Deficit*I(>median) 12.223** -4.292 (4.770) (8.178) Deficit*I(>median)*Size 1.829**
(0.795) Size 0.974 1.474 0.249
(1.770) (1.610) (1.645) GDP growth 0.284 0.528 0.857
(0.653) (0.599) (0.588) VIX 1.626*** 1.623*** 1.622*** (0.180) (0.195) (0.215) Liquidity -0.192 -0.554 -0.260
(1.784) (1.673) (1.432)
Observations 788 788 788 Sub-sovereigns 96 96 96 Pseudo R-squared 0.382 0.405 0.406 Notes: System GMM estimation. Windmeijer-corrected robust standard errors are given in parentheses. Significance levels are given as follows: *** p<0.01, ** p<0.05, * p<0.1. The federal growth rate is used as external instrument. Internal instruments are derived from debt/GDP, deficit/GDP, GDP growth. Time to maturity controlled for. For federation-specific median levels of deficit/GDP see Table 2.
Table A8b: Bailout expectations (deficit/GDP, static specification) (I) (II) (III) Debt/GDP 3.696*** 3.630*** 3.590***
(1.240) (1.235) (1.202) Deficit/GDP 6.286*** 2.674** 2.846** (2.062) (1.341) (1.353) Deficit squared 0.481 (0.364) Deficit*I(>median) 7.335* 1.313 (4.148) (4.164) Deficit*I(>median)*Size 0.780*
(0.399) Size 7.602*** 8.149*** 9.433***
(2.560) (2.560) (2.437) GDP growth -4.120*** -4.057*** -3.739***
(1.085) (1.050) (1.033) VIX 1.359*** 1.354*** 1.360*** (0.182) (0.182) (0.181) Liquidity -2.590** -2.543** -3.253***
(1.254) (1.217) (1.172)
Observations 912 912 912 Sub-sovereigns 96 96 96 Pseudo R-squared 0.371 0.374 0.387 Notes: Fixed effects-IV estimation. Robust standard errors are given in parentheses. Significance levels are given as follows: *** p<0.01, ** p<0.05, * p<0.1. The federal growth rate is used as external instrument. Time to maturity controlled for. For federation-specific median levels of deficit/GDP see Table 2.
ECB Working Paper 1987, December 2016 36
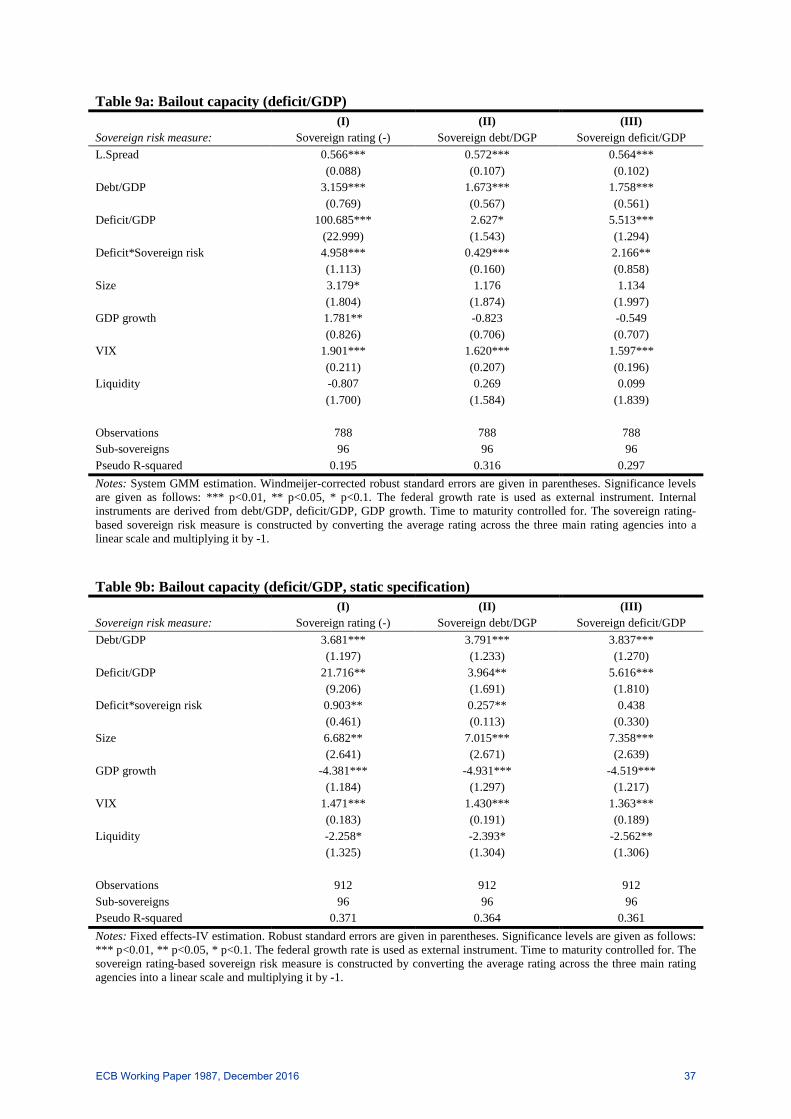
Table 9a: Bailout capacity (deficit/GDP) (I) (II) (III)
Sovereign risk measure: Sovereign rating (-) Sovereign debt/DGP Sovereign deficit/GDP L.Spread 0.566*** 0.572*** 0.564***
(0.088) (0.107) (0.102) Debt/GDP 3.159*** 1.673*** 1.758***
(0.769) (0.567) (0.561) Deficit/GDP 100.685*** 2.627* 5.513*** (22.999) (1.543) (1.294) Deficit*Sovereign risk 4.958*** 0.429*** 2.166**
(1.113) (0.160) (0.858) Size 3.179* 1.176 1.134
(1.804) (1.874) (1.997) GDP growth 1.781** -0.823 -0.549
(0.826) (0.706) (0.707) VIX 1.901*** 1.620*** 1.597***
(0.211) (0.207) (0.196) Liquidity -0.807 0.269 0.099 (1.700) (1.584) (1.839)
Observations 788 788 788 Sub-sovereigns 96 96 96 Pseudo R-squared 0.195 0.316 0.297 Notes: System GMM estimation. Windmeijer-corrected robust standard errors are given in parentheses. Significance levels are given as follows: *** p<0.01, ** p<0.05, * p<0.1. The federal growth rate is used as external instrument. Internal instruments are derived from debt/GDP, deficit/GDP, GDP growth. Time to maturity controlled for. The sovereign rating-based sovereign risk measure is constructed by converting the average rating across the three main rating agencies into a linear scale and multiplying it by -1.
Table 9b: Bailout capacity (deficit/GDP, static specification) (I) (II) (III)
Sovereign risk measure: Sovereign rating (-) Sovereign debt/DGP Sovereign deficit/GDP Debt/GDP 3.681*** 3.791*** 3.837***
(1.197) (1.233) (1.270) Deficit/GDP 21.716** 3.964** 5.616*** (9.206) (1.691) (1.810) Deficit*sovereign risk 0.903** 0.257** 0.438
(0.461) (0.113) (0.330) Size 6.682** 7.015*** 7.358***
(2.641) (2.671) (2.639) GDP growth -4.381*** -4.931*** -4.519***
(1.184) (1.297) (1.217) VIX 1.471*** 1.430*** 1.363***
(0.183) (0.191) (0.189) Liquidity -2.258* -2.393* -2.562** (1.325) (1.304) (1.306)
Observations 912 912 912 Sub-sovereigns 96 96 96 Pseudo R-squared 0.371 0.364 0.361 Notes: Fixed effects-IV estimation. Robust standard errors are given in parentheses. Significance levels are given as follows: *** p<0.01, ** p<0.05, * p<0.1. The federal growth rate is used as external instrument. Time to maturity controlled for. The sovereign rating-based sovereign risk measure is constructed by converting the average rating across the three main rating agencies into a linear scale and multiplying it by -1.
ECB Working Paper 1987, December 2016 37
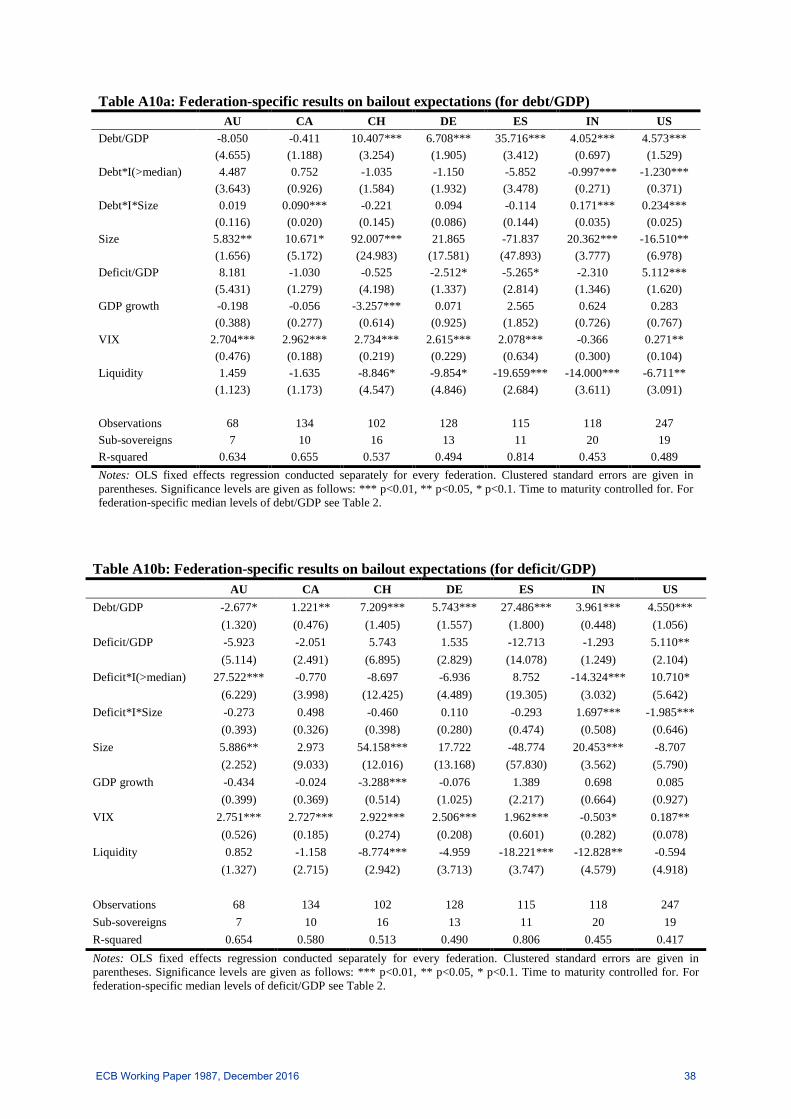
Table A10a: Federation-specific results on bailout expectations (for debt/GDP) AU CA CH DE ES IN US Debt/GDP -8.050 -0.411 10.407*** 6.708*** 35.716*** 4.052*** 4.573***
(4.655) (1.188) (3.254) (1.905) (3.412) (0.697) (1.529) Debt*I(>median) 4.487 0.752 -1.035 -1.150 -5.852 -0.997*** -1.230*** (3.643) (0.926) (1.584) (1.932) (3.478) (0.271) (0.371) Debt*I*Size 0.019 0.090*** -0.221 0.094 -0.114 0.171*** 0.234***
(0.116) (0.020) (0.145) (0.086) (0.144) (0.035) (0.025) Size 5.832** 10.671* 92.007*** 21.865 -71.837 20.362*** -16.510** (1.656) (5.172) (24.983) (17.581) (47.893) (3.777) (6.978) Deficit/GDP 8.181 -1.030 -0.525 -2.512* -5.265* -2.310 5.112***
(5.431) (1.279) (4.198) (1.337) (2.814) (1.346) (1.620) GDP growth -0.198 -0.056 -3.257*** 0.071 2.565 0.624 0.283
(0.388) (0.277) (0.614) (0.925) (1.852) (0.726) (0.767) VIX 2.704*** 2.962*** 2.734*** 2.615*** 2.078*** -0.366 0.271** (0.476) (0.188) (0.219) (0.229) (0.634) (0.300) (0.104) Liquidity 1.459 -1.635 -8.846* -9.854* -19.659*** -14.000*** -6.711**
(1.123) (1.173) (4.547) (4.846) (2.684) (3.611) (3.091)
Observations 68 134 102 128 115 118 247 Sub-sovereigns 7 10 16 13 11 20 19 R-squared 0.634 0.655 0.537 0.494 0.814 0.453 0.489 Notes: OLS fixed effects regression conducted separately for every federation. Clustered standard errors are given in parentheses. Significance levels are given as follows: *** p<0.01, ** p<0.05, * p<0.1. Time to maturity controlled for. For federation-specific median levels of debt/GDP see Table 2.
Table A10b: Federation-specific results on bailout expectations (for deficit/GDP) AU CA CH DE ES IN US Debt/GDP -2.677* 1.221** 7.209*** 5.743*** 27.486*** 3.961*** 4.550***
(1.320) (0.476) (1.405) (1.557) (1.800) (0.448) (1.056) Deficit/GDP -5.923 -2.051 5.743 1.535 -12.713 -1.293 5.110** (5.114) (2.491) (6.895) (2.829) (14.078) (1.249) (2.104) Deficit*I(>median) 27.522*** -0.770 -8.697 -6.936 8.752 -14.324*** 10.710* (6.229) (3.998) (12.425) (4.489) (19.305) (3.032) (5.642) Deficit*I*Size -0.273 0.498 -0.460 0.110 -0.293 1.697*** -1.985***
(0.393) (0.326) (0.398) (0.280) (0.474) (0.508) (0.646) Size 5.886** 2.973 54.158*** 17.722 -48.774 20.453*** -8.707
(2.252) (9.033) (12.016) (13.168) (57.830) (3.562) (5.790) GDP growth -0.434 -0.024 -3.288*** -0.076 1.389 0.698 0.085
(0.399) (0.369) (0.514) (1.025) (2.217) (0.664) (0.927) VIX 2.751*** 2.727*** 2.922*** 2.506*** 1.962*** -0.503* 0.187** (0.526) (0.185) (0.274) (0.208) (0.601) (0.282) (0.078) Liquidity 0.852 -1.158 -8.774*** -4.959 -18.221*** -12.828** -0.594
(1.327) (2.715) (2.942) (3.713) (3.747) (4.579) (4.918)
Observations 68 134 102 128 115 118 247 Sub-sovereigns 7 10 16 13 11 20 19 R-squared 0.654 0.580 0.513 0.490 0.806 0.455 0.417 Notes: OLS fixed effects regression conducted separately for every federation. Clustered standard errors are given in parentheses. Significance levels are given as follows: *** p<0.01, ** p<0.05, * p<0.1. Time to maturity controlled for. For federation-specific median levels of deficit/GDP see Table 2.
ECB Working Paper 1987, December 2016 38
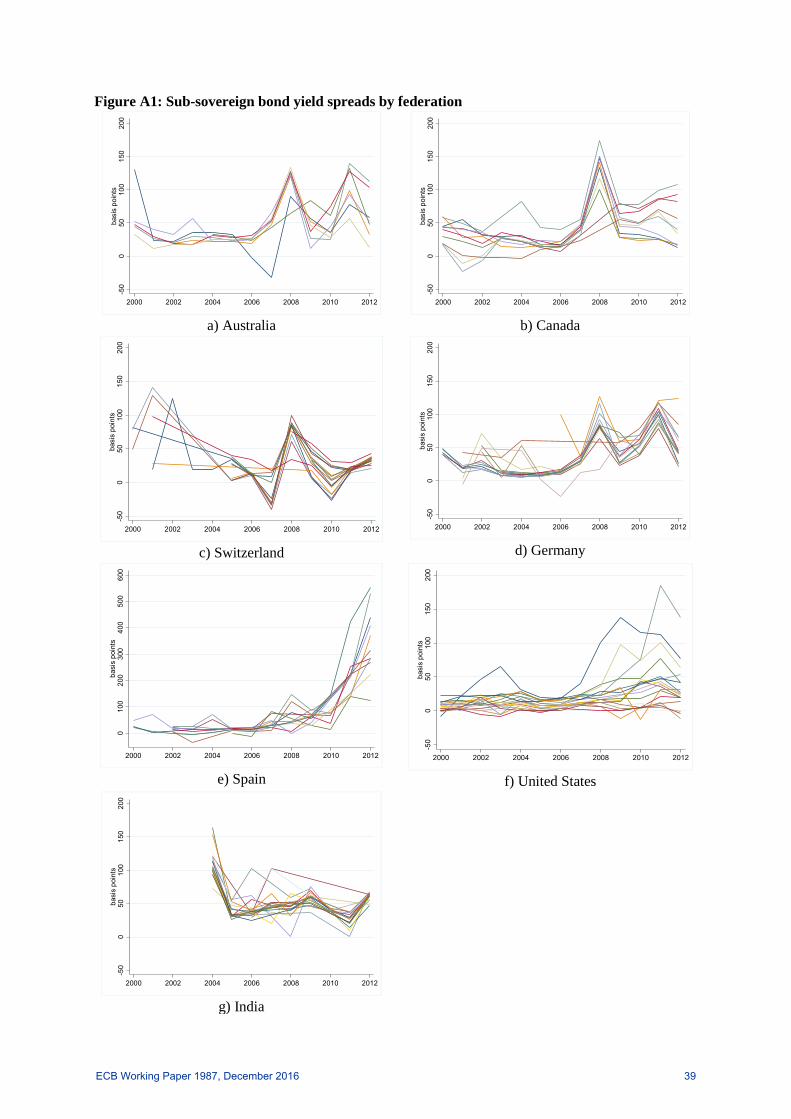
Figure A1: Sub-sovereign bond yield spreads by federation
a) Australia
b) Canada
c) Switzerland
d) Germany
e) Spain
f) United States
g) India
-50
050
100
150
200
basi
s po
ints
2000 2002 2004 2006 2008 2010 2012
-50
050
100
150
200
basi
s po
ints
2000 2002 2004 2006 2008 2010 2012
-50
050
100
150
200
basi
s po
ints
2000 2002 2004 2006 2008 2010 2012
-50
050
100
150
200
basi
s po
ints
2000 2002 2004 2006 2008 2010 2012
010
020
030
040
050
060
0ba
sis
poin
ts
2000 2002 2004 2006 2008 2010 2012
-50
050
100
150
200
basi
s po
ints
2000 2002 2004 2006 2008 2010 2012
-50
050
100
150
200
basi
s po
ints
2000 2002 2004 2006 2008 2010 2012
ECB Working Paper 1987, December 2016 39

Acknowledgements For helpful comments and suggestions we would like to thank Paul Mizen, Pawel Smietanka, seminar participants at the University of Nottingham and the European Central Bank, conference participants at the ZEW Public Finance Conference 2016 as well as an anonymous referee. The opinions expressed in this paper are those of the authors, and do not necessarily reflect the views of the European Central Bank or the Eurosystem. All errors are our responsibility. Roland Beck European Central Bank; email: [email protected] Gianluigi Ferrucci European Central Bank; email: [email protected] Arno Hantzsche University of Nottingham (former trainee at ECB); email: [email protected] Matthias Rau-Goehring European Central Bank; email: [email protected]
© European Central Bank, 2016
Postal address 60640 Frankfurt am Main, Germany Telephone +49 69 1344 0 Website www.ecb.europa.eu
All rights reserved. Any reproduction, publication and reprint in the form of a different publication, whether printed or produced electronically, in whole or in part, is permitted only with the explicit written authorisation of the ECB or the authors.
This paper can be downloaded without charge from www.ecb.europa.eu, from the Social Science Research Network electronic library or from RePEc: Research Papers in Economics. Information on all of the papers published in the ECB Working Paper Series can be found on the ECB’s website.
ISSN 1725-2806 (pdf) DOI 10.2866/651604 (pdf) ISBN 978-92-899-2236-4 (pdf) EU catalogue No QB-AR-16-104-EN-N (pdf )