working paper no. 1 - curtin universityurbanet.curtin.edu.au/local/pdf/working_paper_no1...
TRANSCRIPT

0
The Capacity of State and Local Government
to Deliver Sustainable and Integrated Transport
WORKING PAPER No. 1
Perth: Policy Position
August 2009
Carey Curtis and Rachel Armstrong
Australasian Centre for the Governance and Management of Transport
(GAMUT)
Curtin University of Technology

1

2
Contents Executive Summary .............................................................................................................................................. 4
1. Introduction ................................................................................................................................................. 7
2. Research Approach ................................................................................................................................... 11
Aim ................................................................................................................................................................... 11
Study Area ........................................................................................................................................................ 11
Approach ......................................................................................................................................................... 13 Review of government process and policy relevant to the integration of land use and transport, and the collation of policy documents ..................................................................................................................... 13 The ‘Land Use Transport Integration’ principles ........................................................................................ 15 Content Analysis method ............................................................................................................................ 19 Selection of documents for content analysis ............................................................................................... 20 Data analysis ............................................................................................................................................... 23
3. The governance of land use and transport integration in the Greater Perth Metropolitan Region .. 25
Western Australian State Government ............................................................................................................. 27
Local Government ........................................................................................................................................... 28
Regional Councils ............................................................................................................................................ 29
4. Policy for Land use and transport integration in the Perth Metropolitan Region .............................. 33
State Government statutory policy documents ................................................................................................. 34
State strategic policy documents ...................................................................................................................... 36
Local Government Policy ................................................................................................................................ 38
Local Planning Schemes .................................................................................................................................. 40
Local Planning Strategies ................................................................................................................................ 41
Local Transport Strategies and Bicycle Plans ................................................................................................. 41
5. Content Analysis results ........................................................................................................................... 43
Overview .......................................................................................................................................................... 44 Access ......................................................................................................................................................... 46 Land Use ..................................................................................................................................................... 48 People Places .............................................................................................................................................. 51
Detailed results ................................................................................................................................................ 52 Access criteria ............................................................................................................................................. 53 Land Use ..................................................................................................................................................... 66 People Places Criteria ................................................................................................................................. 81
Detailed analysis of local planning schemes against 5 key criteria ................................................................ 91
Ambiguity or negative representation in state and local government policy ................................................... 99
Metroplan and Network City: changing representation of LUTI criteria in Perth’s strategic planning documents over time. ..................................................................................................................................... 100
6 Discussion and scoping for stage two of the research project ............................................................. 101
Addressing the research question .................................................................................................................. 102
Progressing to stage two of the research ....................................................................................................... 103
7 Acknowledgements ................................................................................................................................. 113
3
8 References ..................................................................................................................................................... 114
9 Appendices .............................................................................................................................................. 117
Appendix 1A: ................................................................................................................................................. 118
Appendix 1B: Full suite of Policy Documents by Local Government from which sample is drawn ............. 121
Appendix 2 LUTI Content Analysis Template .................................................................................................... 5
Appendix 3 Example Content Analysis – City of Fremantle Local Planning Scheme No. 4 .............................. 7
Appendix 4: Local Government Profiles .......................................................................................................... 23
Appendix 5: Summary of Perth state and local policy document analysis by positive, negative or mixed reference to LUTI Criteria ............................................................................................................................... 24
Appendix 6 Summary of Perth state and local policy document analysis by highest rating score for each LUTI criterion .................................................................................................................................................. 27
Appendix 7 Representation of LUTI Criteria in local government planning schemes by location .................. 29
Appendix 8 Representation of LUTI criteria in local government planning schemes by LGA population ...... 31
Appendix 9 Representation of LUTI Criteria in local government planning schemes by number of employees ......................................................................................................................................................................... 33
Appendix 10 Representation of LUTI Criteria in local government planning schemes by year in which the local planning scheme was first drafted .......................................................................................................... 35
Appendix 11 Representation of LUTI Criteria in local government planning schemes by membership to the sustainable transport coalition ........................................................................................................................ 37

4
Executive Summary Globally, the capacity of local and regional governments to implement policy and invest in integrated land use and transport decisions has emerged as an important issue for urban transport policy and for urban policy in general. In Australia there is a National Charter on Integrated Land Use and Transport Planning and at the state level, in Western Australia, the metropolitan local governments have an ‘Integrated Transport Planning Partnering Agreement’ with the objective of working cooperatively with the state. However, bringing together the policy tools to achieve optimal planning outcomes in such a way to aid delivery is an ongoing challenge.
This working paper reports the results of a content analysis of state and local government policy texts in order to understand the capacity of government for land use and transport integration in the Greater Perth metropolitan area. Our interests also encompass the need to understand the extent to which there is ‘vertical integration’ of policy – from state to local government, and the extent to which there is ‘horizontal integration’ of policies documents within any given agency or level of government. This is the first stage of the research; the second stage will focus on the barriers to the delivery of land use transport integration. Findings from both stages aim to identify how the capacity of state and local government can be improved. In addition to the Perth case study, a study of metropolitan Melbourne is in progress.
Policies represent the ‘front door’ of the particular agency; they can indicate the extent to which there is any capacity for land use transport integration as conceived in this project. We acknowledge that the texts are open to multiple interpretations, they are influenced by the content and interpretation of other policy texts and that interpretation and emphasis changes with the political climate in which policy is interpreted. In Stage 2 of this research we aim to delve much deeper into the organisational dynamics and interrelationships that influence policy development and implementation, but as a pre-requisite to that work it is important to understand the way in which policy texts are presented in published documents.
A comprehensive suite of land use transport integration (LUTI) principles were developed to frame policy content analysis and are grouped into three key components: ‘access’, ‘land use’, and 'people places'. Policy statements were assessed, recording whether these made both a positive or negative (productive or counter-productive) contribution towards LUTI and a how well (or poorly) the policy statement performed in relation to satisfaction of LUTI criteria. Overall, it was found that there was significant commitment to many of the principles that enable the integration of land use and transport. This was particularly the case in non-statutory policy at both the state government and local government levels, although not all local governments have developed these policy types. Statutory policy at the state government level, compared to the statutory local planning schemes, shows more consistent and broader coverage of the LUTI principles. In local planning schemes, the representation of LUTI criteria is inconsistent and often patchy and, therefore, can be seen to currently reflect varied capacity to implement LUTI across local government, and often, a limited capacity to support LUTI.
In relation to the three categories of LUTI criteria: ‘Access’ There significant gaps in coverage of ‘access’ criteria in both state and local government
documents around the operational aspects of public transport service and this demonstrates a gap in the capacity to deliver LUTI.
Particular state government documents provide the greatest breadth of support across ‘access’ criteria and include the Metropolitan Transport Strategy, Network City and the Liveable Neighbourhoods Design Codes.

5
It is noted that local government in metropolitan Perth has limited responsibility for public transport, and only has responsibility for local roads; nevertheless these policy shortcomings demonstrate a limit in the capacity to deliver LUTI.
Of particular note is that whilst coverage of access criteria was patchy at the local government level, most of the criteria were covered in at least a few local planning schemes. This suggests that schemes can be supportive of many of the access criteria; so while local planning schemes may be a blunt tool for the implementation of the access elements of land use and transport, they can, and in some cases, do a better job.
‘Access’ criteria are better captured in local government Transport Planning Strategies, however local government are not required to produce these policy documents and neither are they necessarily integrated with local government planning policy documents.
Even where Local Transport Strategies showed the best coverage of access criteria, there was a similar gap around some of the operational aspects of public transport. Importantly, however, the Transport Strategy for one local government (South Perth) covered all criteria in the subcategory of service demonstrating that capacity in this aspect can be developed.
‘Land Use’ There were fewer pronounced gaps in coverage across the suite of documents for ‘land use’
criteria than there were for access criteria. The most notable gaps are in relation to detailing land use configuration and design to support high pedestrian trip generating uses in close proximity of transit stops. This is absent from state government documents and covered only in a few local planning schemes.
Coverage of land use criteria, in terms of strength and breadth, is slightly stronger in the suite of state government documents than in the local planning schemes.
There is much diversity in how local government documents cover the LUTI land use criteria. Whilst the breadth of coverage of criteria in the local planning schemes is better than for the access criteria, coverage is inconsistent between local governments. Where local planning schemes are supportive of land use criteria, they are most likely to be only weakly supportive of them.
There is no clear framework or trend by which LUTI criteria are incorporated, yet all the criteria are covered in at least a few local planning schemes, suggesting that they can all be supported by local planning schemes, even though in practice they are not.
‘People places’ ‘People places’ criteria were covered better in local government documents than state government
documents as a whole. At the state government level there are significant gaps of coverage. In relation to vertical integration (state to local): There is a broader trend where the highest degree of vertical integration is associated with the
LUTI criteria that contain less specific detail for planning. In relation to particular LUTI categories, ‘access’ considerations are less integrated than ‘land
use’ or ‘people places’. Local planning strategies also show stronger support for access criteria than local government
planning schemes – many of the access criteria are supported, or strongly supported, whereas in cases where local planning schemes provide support to the access criteria, they are for the most part only weakly supportive.
In relation to horizontal integration: There is little correlation in the way that LUTI ‘access’ criteria are dealt with in planning
strategies and local planning schemes in individual local governments. This is also the case for ‘land use’ criteria, although an exception to this is the City of Fremantle local planning strategy. This finding is a concern, given the role of local planning strategies in informing the ongoing development of local planning schemes – however perhaps in the future these links will become more consistent.

6
Similarly, there is no coherent link between the planning schemes and the local transport strategies or the bicycle plans in terms of their support for access criteria.
Fixing the age of the plan to enable a consideration of capacity by age of policy is not easy. The year in which the local planning scheme was first drafted varies between local governments from 1983 to 2007. There have been amendments to some schemes during this period, but these relate to particular aspects of the scheme and are not designed to replace the scheme as a whole. Where amendments have been made these have been analysed in our research but we have not changed the gazettal date of the plan to reflect this later policy. Notwithstanding this point, over time there has been a trend toward greater capacity for policy to support for LUTI in policy texts in recent years. This is particularly so for ‘access’ criteria, where local planning schemes drafted since 2000 reflect more access criteria and more consistently. This may be related to the introduction by the State in 1999 of the Model Scheme Text, which guides the content of local planning schemes. There are, however, significant anomalies, the planning schemes for Stirling (1985) Swan (1985), Mundaring (1994), and in particular, Mandurah (1999) all showed comparatively good coverage despite being outside this timeframe. The time trend is much less clear for land use criteria. The three schemes that reflect positively the most land use criteria are Swan (1985), Bassendean (1983) and Fremantle (2007) through it would appear that there is a more consistent reflection of land use criteria schemes drafted since 1999. A brief analysis of the effect of particular local government characteristics, such as location, size of government (measured by both resident population and number of local government employees) suggests a possible relationship between these factors. Local Governments with more employees, larger populations and more recently drafted planning schemes tend to refer positively to more of the LUTI ‘land use’ and ‘access’ criteria. Limited inference can be drawn from membership of the local government to the Sustainable Transport Coalition in terms of the number of LUTI criteria that were positively reflected. However in assessing particular local government characteristics, there were also many examples of outliers to this analysis suggesting that there are several other factors at work. There are also likely to be additional local government specific factors that affect policy integration and implementation and these will be explored in detail during Stage 2 of the research.
From this first stage of research there would appear to be benefits in introducing the following measures aimed at improving the capacity of state and local government to deliver sustainable and integrated transport: A statutory requirement for all local governments to produce a Local Transport Strategy, similar
to Local Transport Plans prepared in the UK. An improvement to the mechanisms to ensure state policy is articulated into local government
policy. This may require both a review of the Model Scheme Text and a review of the way in which local schemes and strategies are assessed by the state.
An improvement in the way local planning schemes are integrated with and informed by policy contained in the local planning strategy.
The ‘showcasing’ of exemplars in professional workshops.
7
Introduction This paper is the first in a series of Working Papers reporting on the research findings for the
project ‘The Capacity of State and Local Government to Deliver Sustainable and Integrated
Transport: A case study investigation in Perth and Melbourne’. The purpose of the research
is to understand with precision the real barriers created by the horizontal and vertical
governmental relationships. In this working paper the results of a policy content analysis are
presented, the focus is on how the principles for land use and transport integration are
reflected in relevant state and local government policy in Perth.
'Land use and transport integration' is seen as a means of achieving sustainable travel
outcomes, a message reinforced by the National Charter on Integrated Land Use and
Transport Planning (DOTARS, 2003). In Western Australia the 30 metropolitan local
governments signed an agreement in 2001 to work cooperatively with the state in accordance
with an ‘Integrated Transport Planning Partnering Agreement’ (DPI, 2001). Historically, the
state government has played the major role in the development and management of transport
policy and transport systems. However the importance of state – local government
partnerships to enable place-based integration of transport policy is now recognised.
Important roles for local government include establishing community visions; forming
policy; undertaking integrated transport planning; and making connections to planning and
development control (Richardson, 2002). In practice, while there has been policy support for
the integration of land use and transport planning in Western Australia for some time,
implementation has been selective and the Perth’s urban form is reflective of low density
suburban sprawl. This makes transport choices other than the car difficult and compromises
progress toward a more sustainable city. Pressure for ‘Greenfield’ development on the urban
fringe continues (Curtis, 2008).

8
Globally, the capacity of local and regional governments to implement policy and invest in
integrated land use and transport decisions has emerged as an important issue for urban
transport policy and for urban policy in general (ECMT/OECD, 2003). However while
optimal planning outcomes are well understood in theory, bringing together the policy tools
to make them happen is an ongoing challenge (Kennedy et al, 2005). In many western
European countries and the USA the trend has been to devolve decision making and
resources to the local level, and this is also the case in Australia. Given this direction it is
important to examine the degree to which integrated land use and transport planning policy is
being adopted by local and state institutions, the influence of any such policy on decision
making and the difficulties encountered in implementation (Breheny et al, 1996). As Condon
(2008) illustrates, there is often a disjunction between high-level strategic plans and
implementation (Condon, 2008).
Banister (2005) identifies six types of barriers to implementation: resource; institutional and
policy; social and cultural; legal; 'side effects' (effects of one action reduce the outcome of
another action); and physical barriers. Reitveld and Stough (2005) argue that one of the
primary barriers to the delivery of sustainable transport is the institutional barrier. Such
barriers can either reduce the potential of delivery, or make it impossible to achieve (Banister,
2005). Conversely, Kennedy et al (2005) identify enabling factors to sustainable transport
planning as: integrative governance across transport and land use planning, stable funding,
strategic infrastructure investment and local design. Achieving implementation requires an
understanding of two components – the rules and rule structures that guide action (North,
1990) and the organisations as agents of those rules with particular organisational dynamics
that influence actions and implementation. An analysis of the institutional barriers can then

9
provide for an exploration of the interactions between different levels of public sector policy,
and examination of the benefits to be achieved from policies which reallocate authority from
one level of government to the next. By examining how organisations operate, via an analysis
of their policy instruments, it is possible to begin an evaluation of the impact, in part, on
delivery of sustainable transport outcomes.
One type of institutional barrier arises where there is an inability of one jurisdiction of
government to effect the actions of another (Ubbels and Verhoef, 2005) and it is this area of
research which requires further investigation in Western Australia: the ability of state
agencies to effect the delivery of sustainable transport through other state agencies and
through local agencies; and the ability for agencies at the local level to influence each other
for more holistic and integrated outcomes. This gives rise to the following research
questions:
1. What is the current capacity (using statutory and non-statutory powers) of state and local
public agencies to integrate land use and transport planning towards achieving
infrastructure/services for collective and active modes of transport?
2. What is the current capacity of state and local public agencies to integrate land use and
transport planning and manage car-based travel?
3. What are the institutional constraints (rules, finance, structures, cultures etc) to delivery?
4. How can the capacity be improved?
With these questions in mind our research has three main objectives:
1) To assess, through a content analysis of key state and local government policy
documents, the capacity of the governmental system in Australia to deliver
sustainable and integrated land-use/transport outcomes;

10
2) To detail the horizontal (interagency) and vertical (intergovernmental – state/local)
relationships at bureaucratic level that come into play to restrict integrated land
use/transport outcomes; and
3) To identify how the capacity of the governmental system can be improved.
This paper reports on the findings for objective one for the Perth case study. Prior to
presenting the results of the content analysis, a review of government relationships and
government policy is necessary in order to frame the context for the content analysis results.
Whilst the content analysis documented in this working paper focuses on government policy,
as reflected in policy documents, the broader context of government relationships that affect
the drafting and implementation of policy is also central to this study, and will be the core
focus of research undertaken in Stage 2 of the project.

11
2. Research Approach
Aim
The study is aimed at assessing the capacity of the planning and infrastructure institutions in
the Greater Perth Metropolitan Area to deliver sustainable and integrated land-use/transport
outcomes. In this Working Paper we report the findings of the first stage of our research. We
assess the suite of policies and strategies of local government and state government agencies.
These policies and strategies are evaluated against a comprehensive set of land use transport
integration criteria. The aim of this stage of the research is to produce a comprehensive
position statement about the degree to which, and in what way public institutions aspire to the
delivery of sustainable transport, and the extent of that aspiration.
Study Area
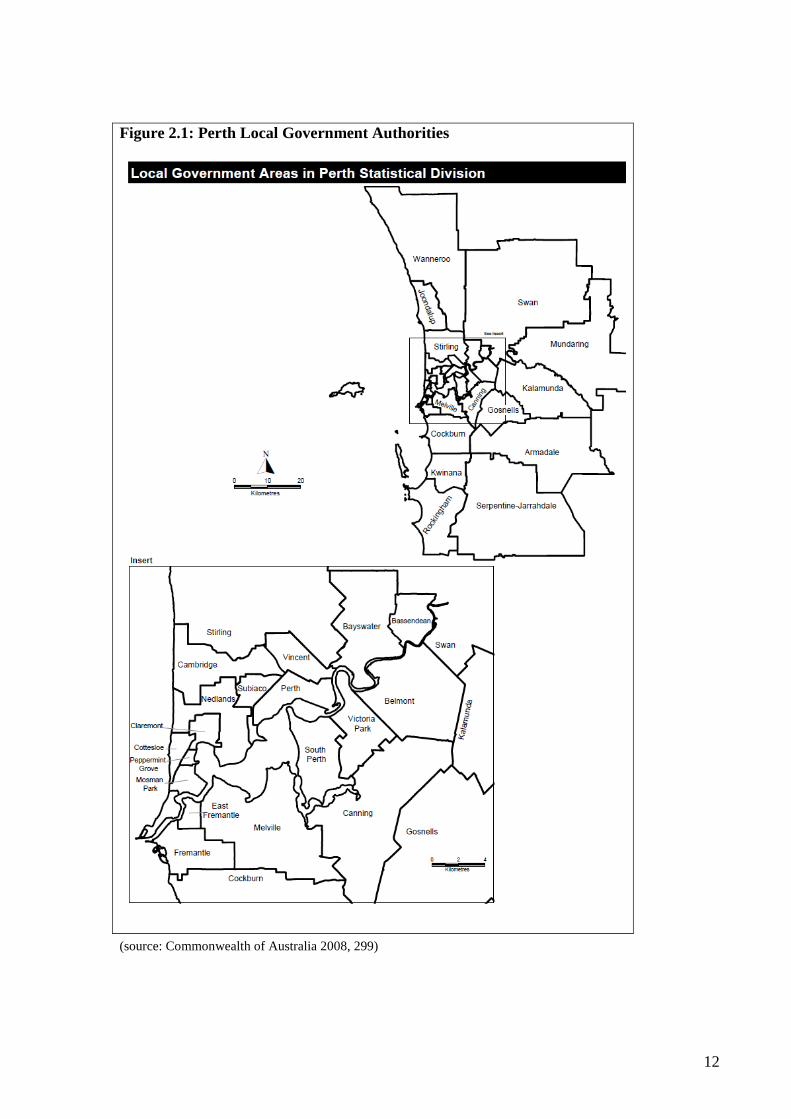
We have taken an area that, for this study, will be called the Greater Perth Metropolitan Area.
This area comprises of 32 local government authorities (LGA’s) (see Figure 2.1 – note
Mandurah LGA at the southern extremity is also included but absent from this figure) and is
greater than what is considered as metropolitan Perth as defined by the Metropolitan Region
Scheme (the statutory planning scheme). Instead the boundaries of this project are drawn
around the extent of the actual urban area (as far as local government boundaries coincide
with this extent).
12
(source: Commonwealth of Australia 2008, 299)
Figure 2.1: Perth Local Government Authorities

13
Approach
Review of government process and policy relevant to the integration of land use
and transport, and the collation of policy documents
In order to frame the research, a review of government relationships in Western Australia
and of the relevant policy documents at the state and local level was undertaken. A wide
range of policy documents that aim to portray the land use and transport policies of each
particular agency were collated from local and state authorities in Perth. This is in line with
the focus of stage 1 for this research, upon which this working paper reports.
‘Policy’ includes both the texts that guide direction, as well as the discourse and actions of
the individuals and organisations that manage policy interpretation and implementation.
Policy texts themselves are open to multiple interpretations, and are influenced by the content
and interpretation of other policy texts. Policy interpretation and emphasis changes with the
political climate in which policy is interpreted (Ball, 1993). Policy is not only an output from
the political system, but open to interests and demands articulated from outside the political
system (Radaelli, 1995). It is therefore best viewed as an open ended and interactive process
rather than a particular, time limited outcome, such as that represented in a document. Stage
one of this research, reported in this working paper, focuses only on the policy texts that
guide direction. In Stage 2 of this research, we aim to delve much deeper into the
organisational dynamics and interrelationships that influence policy development and
implementation. As a pre-requisite to the Stage 2 work it is, nevertheless, important to gain
some impression of the way in which policy texts are presented in published documents,
notwithstanding the above discussion. One key reason for so doing is that these policies
14
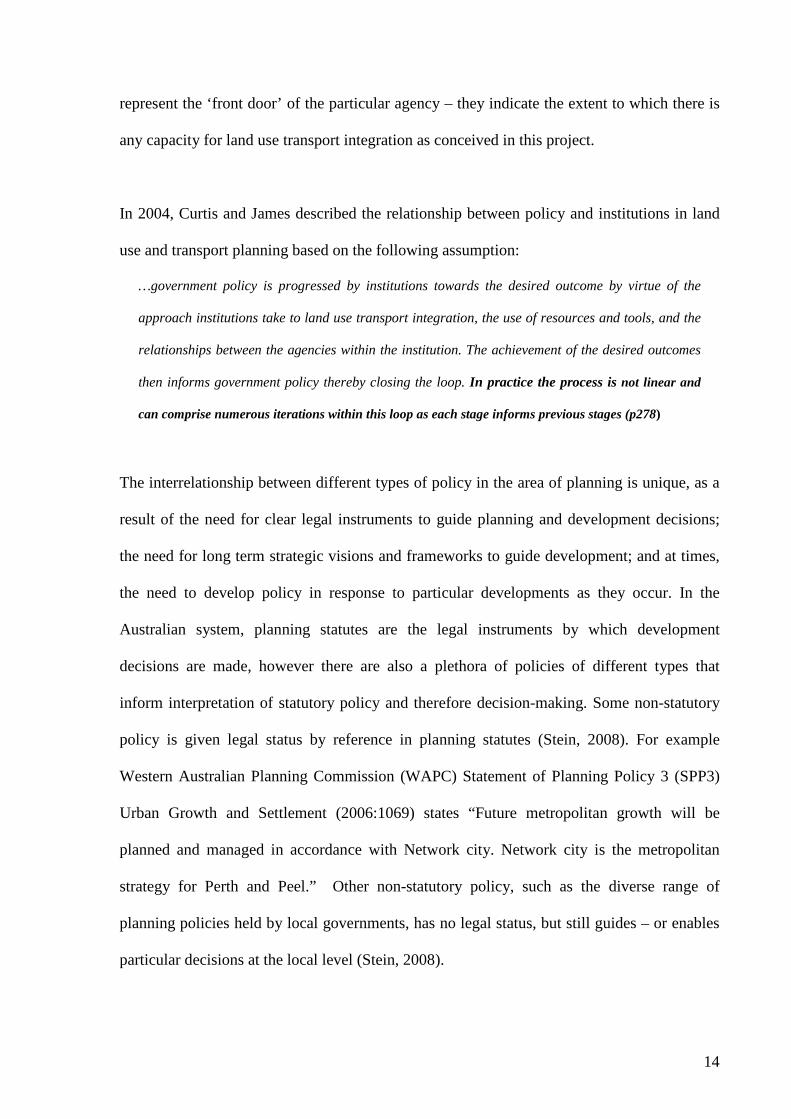
represent the ‘front door’ of the particular agency – they indicate the extent to which there is
any capacity for land use transport integration as conceived in this project.
In 2004, Curtis and James described the relationship between policy and institutions in land
use and transport planning based on the following assumption:
…government policy is progressed by institutions towards the desired outcome by virtue of the
approach institutions take to land use transport integration, the use of resources and tools, and the
relationships between the agencies within the institution. The achievement of the desired outcomes
then informs government policy thereby closing the loop. In practice the process is not linear and
can comprise numerous iterations within this loop as each stage informs previous stages (p278)
The interrelationship between different types of policy in the area of planning is unique, as a
result of the need for clear legal instruments to guide planning and development decisions;
the need for long term strategic visions and frameworks to guide development; and at times,
the need to develop policy in response to particular developments as they occur. In the
Australian system, planning statutes are the legal instruments by which development
decisions are made, however there are also a plethora of policies of different types that
inform interpretation of statutory policy and therefore decision-making. Some non-statutory
policy is given legal status by reference in planning statutes (Stein, 2008). For example
Western Australian Planning Commission (WAPC) Statement of Planning Policy 3 (SPP3)
Urban Growth and Settlement (2006:1069) states “Future metropolitan growth will be
planned and managed in accordance with Network city. Network city is the metropolitan
strategy for Perth and Peel.” Other non-statutory policy, such as the diverse range of
planning policies held by local governments, has no legal status, but still guides – or enables
particular decisions at the local level (Stein, 2008).
15
Strategic planning policy in Perth, through Network City Community Planning Strategy
(WAPC, 2004) and for Australian cities more generally has moved toward sustainability
generally, and land use and transport integration in particular, as a central element to the
creation of sustainable urban form (Bunker and Searle, 2009). Sustainability is also
incorporated in the Western Australian Planning and Development Act (2005), where one of
the purposes of the act is to “promote the sustainable use and development of land in the
State” (Part 1, Section 3.1C). Implementing land use and transport integration throughout the
urban fabric requires mutually supportive integration of State and local level policy. Whilst
policy documents are not enough to ensure this, they do set the framework though which the
many small scale and local decisions required to achieve this can be made. They are therefore
a central part of analysing the policy framework for land use and transport integration. A
comprehensive analysis of the horizontal and vertical relationships relevant to the governance
of land use and transport integration is included in the background discussion in section 3:
The governance of land use and transport integration in the Greater Perth Metropolitan
region – and overview of government relationships and policy.
The ‘Land Use Transport Integration’ principles
A comprehensive set of land use transport integration (LUTI) principles were developed to
frame policy content analysis. A broad definition of LUTI would include physical, spatial,
behavioural and institutional characteristics. The content analysis reported in this working
paper focuses on the physical and spatial characteristics. However it is recognised that in
order to achieve LUTI all four aspects must be addressed as they are complementary (see for
example Rietveld and Stough, 2005; Curtis and James, 2004, on behavioural or institutional
aspects). Behavioural and institutional characteristics will be investigated through more
detailed case study analysis in stage 2.
16
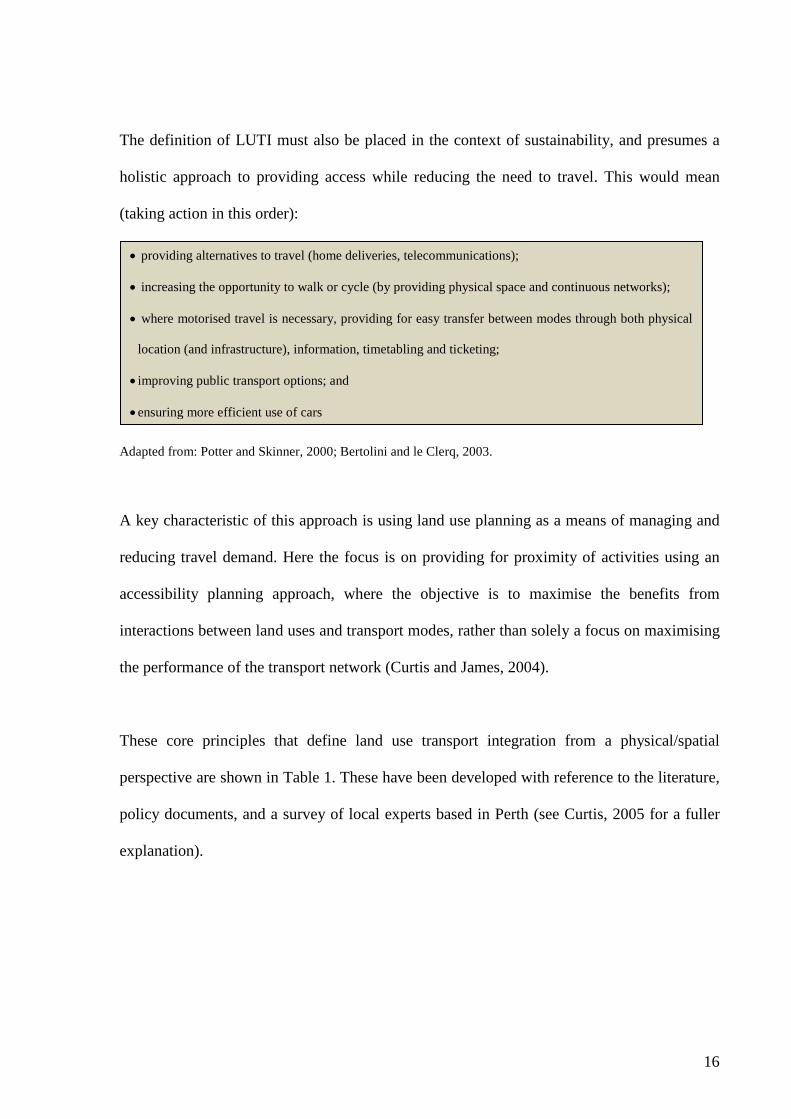
The definition of LUTI must also be placed in the context of sustainability, and presumes a
holistic approach to providing access while reducing the need to travel. This would mean
(taking action in this order):
Adapted from: Potter and Skinner, 2000; Bertolini and le Clerq, 2003.
A key characteristic of this approach is using land use planning as a means of managing and
reducing travel demand. Here the focus is on providing for proximity of activities using an
accessibility planning approach, where the objective is to maximise the benefits from
interactions between land uses and transport modes, rather than solely a focus on maximising
the performance of the transport network (Curtis and James, 2004).
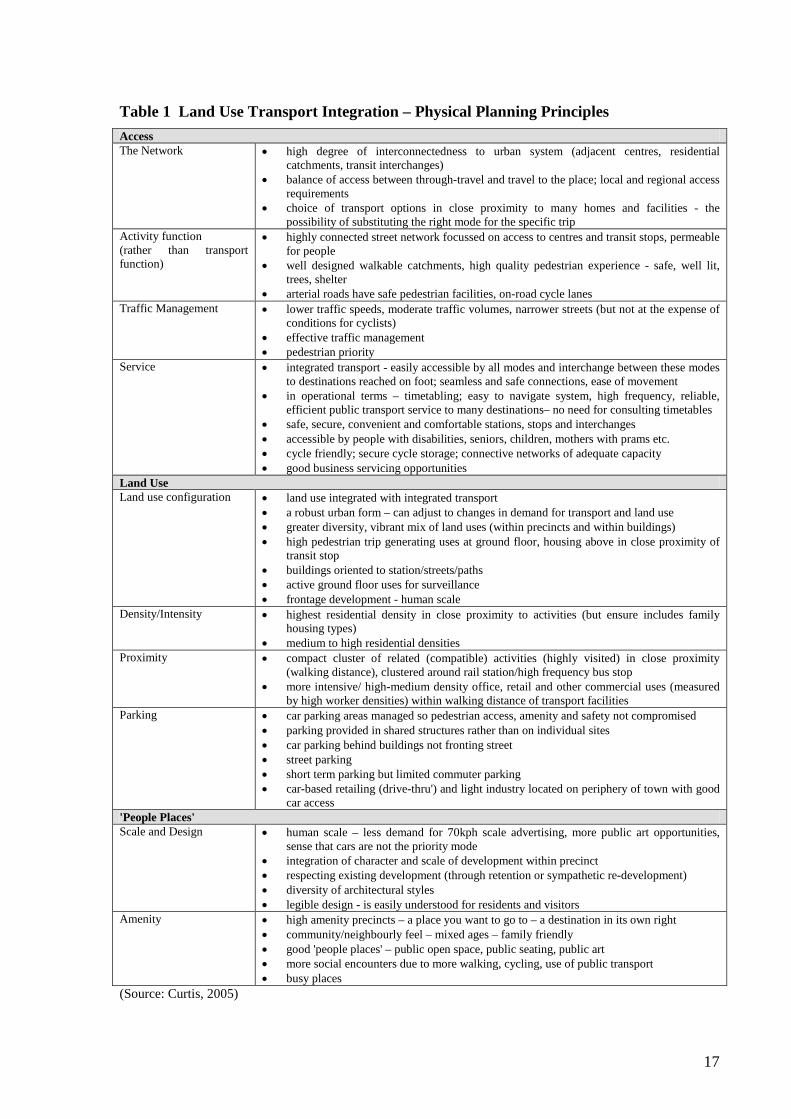
These core principles that define land use transport integration from a physical/spatial
perspective are shown in Table 1. These have been developed with reference to the literature,
policy documents, and a survey of local experts based in Perth (see Curtis, 2005 for a fuller
explanation).
• providing alternatives to travel (home deliveries, telecommunications);
• increasing the opportunity to walk or cycle (by providing physical space and continuous networks);
• where motorised travel is necessary, providing for easy transfer between modes through both physical
location (and infrastructure), information, timetabling and ticketing;
• improving public transport options; and
• ensuring more efficient use of cars
17
Table 1 Land Use Transport Integration – Physical Planning Principles Access The Network • high degree of interconnectedness to urban system (adjacent centres, residential
catchments, transit interchanges) • balance of access between through-travel and travel to the place; local and regional access
requirements • choice of transport options in close proximity to many homes and facilities - the
possibility of substituting the right mode for the specific trip Activity function (rather than transport function)
• highly connected street network focussed on access to centres and transit stops, permeable for people
• well designed walkable catchments, high quality pedestrian experience - safe, well lit, trees, shelter
• arterial roads have safe pedestrian facilities, on-road cycle lanes Traffic Management • lower traffic speeds, moderate traffic volumes, narrower streets (but not at the expense of
conditions for cyclists) • effective traffic management • pedestrian priority
Service • integrated transport - easily accessible by all modes and interchange between these modes to destinations reached on foot; seamless and safe connections, ease of movement
• in operational terms – timetabling; easy to navigate system, high frequency, reliable, efficient public transport service to many destinations– no need for consulting timetables
• safe, secure, convenient and comfortable stations, stops and interchanges • accessible by people with disabilities, seniors, children, mothers with prams etc. • cycle friendly; secure cycle storage; connective networks of adequate capacity • good business servicing opportunities
Land Use Land use configuration • land use integrated with integrated transport
• a robust urban form – can adjust to changes in demand for transport and land use • greater diversity, vibrant mix of land uses (within precincts and within buildings) • high pedestrian trip generating uses at ground floor, housing above in close proximity of
transit stop • buildings oriented to station/streets/paths • active ground floor uses for surveillance • frontage development - human scale
Density/Intensity • highest residential density in close proximity to activities (but ensure includes family housing types)
• medium to high residential densities Proximity • compact cluster of related (compatible) activities (highly visited) in close proximity
(walking distance), clustered around rail station/high frequency bus stop • more intensive/ high-medium density office, retail and other commercial uses (measured
by high worker densities) within walking distance of transport facilities Parking • car parking areas managed so pedestrian access, amenity and safety not compromised
• parking provided in shared structures rather than on individual sites • car parking behind buildings not fronting street • street parking • short term parking but limited commuter parking • car-based retailing (drive-thru') and light industry located on periphery of town with good
car access 'People Places' Scale and Design • human scale – less demand for 70kph scale advertising, more public art opportunities,
sense that cars are not the priority mode • integration of character and scale of development within precinct • respecting existing development (through retention or sympathetic re-development) • diversity of architectural styles • legible design - is easily understood for residents and visitors
Amenity • high amenity precincts – a place you want to go to – a destination in its own right • community/neighbourly feel – mixed ages – family friendly • good 'people places' – public open space, public seating, public art • more social encounters due to more walking, cycling, use of public transport • busy places
(Source: Curtis, 2005)

18
The core principles are grouped into three key components: access, land use, and 'people
places'. 'Access' principles involve creating a transport network connected to centres, capable
of meeting local and regional travel needs. Many of the daily activities should be served
locally. The network must provide for transport choice and recognise the way in which
journey purposes may have different spatial reach, thus enabling local trips to be undertaken
by walking and cycling, inter-suburban trips by public transport, and those less frequent trips
outside centres and further afield to be undertaken by car. 'Land Use' principles focus on
locating higher density/intensity uses close to transit, and clustering complementary uses in
walking proximity to each other and to transit. 'People places' focuses on urban design at the
human scale assuming pedestrian and bicycle priority.
These principles have their roots in both the transport and urban design disciplines.
Westerman (1998) argues that land use location and the transport network must not be
planned independently. In planning the transport network the focus should be on equal access
to places rather than on provision for through-traffic (Schaeffer and Sclar,1975; Yenken,
1995). Common principles include concentrating development in locations that have access
to public transport; developing mixed use; higher densities that can support a choice of
transport modes; locating complementary activities closer together; giving priority to public
transport; and controlling parking to encourage public transport use. Through-traffic should
be directed away from 'people-places' where streets should be traffic calmed providing space
for all modes in a safe, attractive and convenient manner. There should be a strong sense of
place including street-oriented uses along arterials (Westerman, 1998; Ministry of
Transportation and Ministry of Municipal Affairs, 1995). At the neighbourhood scale the
focus is on a physical environment that encourages walking and cycling. Appleyard and
Lintel (1972), Whyte (1980), Gehl (1987), Tibbalds (2001), Jacobs (2001) all argue for
19
particular qualities of city space based on designing at a human-scale – reducing distance
between buildings, and increasing activity on the street in order to maximise the opportunity
for contact and observation. It is not just the physical distance that is important but also the
quality of the experience: the design of buildings and orientation to the street and mix of uses
to serve daily activity needs. They argue for replacement of car-dominated city centres by
pedestrian-scale street systems.
Content Analysis method
Content analysis methodology provides a systematic and quantitative approach to the analysis
of text (Neuendorf, 2005). It involves the use of codes for textual analysis in order to compile
the messages contained in the texts in a condensed form, enabling an assessment of patterns
and trends both within and across documents (Stemler, 2001). Content analysis is therefore
ideal to enable assessment of the content of policy texts in terms of land use and transport
integration and to assess the degree of horizontal (state level between documents) and vertical
integration (state to local policy) present towards achieving land use and transport
integration.
In the content analysis reported on in this working paper, the patterns and trends being
evaluated are the integration of Land Use and Transport Integration within and across policy
documents relevant to the Perth Metropolitan region. Achieving this involves the
development of exhaustive and mutually exclusive categories as a basis for content analysis
(Stemler, 2001). This was carried out by assessing each document (policy, strategy etc)
against a set of core ‘land use transport integration’ (LUTI) principles derived from earlier
research (Curtis, 1998; 1999; 2005).

20
The assessment of documents against these core LUTI principles was carried out using the
template shown in Appendix 2. This provided for the recording of particular policy
statements, recording whether these made either a positive or negative (productive or counter
productive) contribution towards LUTI and the use of a rating system to broadly indicate how
well (or poorly) the policy statement performed in relation to satisfaction of LUTI criteria.
The rating system used a 7 point scale:
3 Strongly satisfies LUTI criterion
2 Satisfies LUTI criterion
1 Weakly satisfies LUTI criterion
0 Ambiguous
-1 Weakly works against LUTI criterion
-2 works against LUTI criterion
-3 Strongly works against LUTI criterion
An example data sheet for the content analysis is included in Appendix 3 for the City of
Fremantle Local Planning Scheme no. 4.
Selection of documents for content analysis
There are a very wide range of potential policy documents that could be analysed (see
Appendix 1B), but time and resources limit this research (as is generally the case). This
required a sample of documents to be selected (see Appendix 1A). In this respect, the
documents ultimately selected for content analysis were those that are central to framing
planning decision making, either strategically, or through statutory requirements, at the state
and local level. The suite of documents analysed includes statutory documents, such as Local
Planning Schemes (this is a core document which each local government is required by law
to produce – it guides the development of land), and at the State level, Development Control

21
Policies and Statements of Planning Policy. It also includes documents with a more strategic
planning orientation, such as Network City Community Planning Strategy at the state level,
and Local Planning Strategies designed to provide an overarching guide the development and
implementation of statutory policy, and to set the context for development decisions. The
documents and the relationships between different departments and levels of government are
discussed in detail in section 3 of this working paper.
The documents from the state government level ultimately selected for analysis were:
• The State Planning Strategy (1997)
• The Perth Metropolitan Transport Strategy (1995-2029);
• Network City Community Planning Strategy (2004);
• Metroplan (1990, replaced by Network City in 2004);
• The Liveable Neighbourhoods Design Code Edition 2 (2000);
• WAPC Statement of Planning Policy 3 Urban Growth Settlement (March 2006);
• WAPC Development Control Policy 1.5 Bicycle Planning (July 1998);
• WAPC Development Control Policy 1.6, Planning to Support Transit Use and Transit
Oriented Development (January 2006);
• WAPC Development Control Policy 2.6 Residential Road Planning (June 1998)
The documents selected for local government authorities for analysis were:
• Local Planning Schemes (LPS) for each local government;
• and for those local governments that had them:
o Local Planning Strategies;
o Local Transport Strategies; and
o Local Bicycle Plans

22
These documents are discussed in more detail in section 4. While there are other relevant
documents at a regional council level, such as Strategic plans, Regional Environmental
Initiatives and at the local level, such as sustainability strategies, the rationale for the
selection of the above suite of documents is that collectively, these make up the most direct
and significant core of the overall policy framework that facilitates the delivery of sustainable
and integrated transport in the Greater Perth Metropolitan Region.
The documents were gathered by searching the websites of each of the authority and then by
a follow up phone call to that authority to obtain any further documents not listed or
accessible via the web. Document selection and collation occurred in late 2006, and the
document analysis therefore reflects the suite of documents that were available for analysis at
this time. One limitation of this method of search was that not all the documents were
available on the authority websites. Some sites were difficult to navigate making it difficult to
find documents. Another limitation was that due to high turn-over rates of staff at authorities
the contact person was sometimes not aware of what policies would relate to land use
transport integration. While this can be seen as a potential weakness for this aspect of the
research (in that there may not be comprehensive coverage) it can also be seen in the context
of the authority’s ability to properly make its policies and strategies publicly accessible. This
may impact on the ability to implement those policies and therefore on the authorities
capacity to deliver sustainable and integrated transport. A complete list of documents
selected and analysed is shown at Appendix 1A.

23
Data analysis
Following the content analysis, two sets of data were compiled for each document as follows:
Data set 1 provides a summative indication for each of the LUTI criteria, coded as follows:
1 Document has content that satisfies the LUTI criterion
2 Document has content that works against the LUTI criterion
3 Document has some content that satisfies the LUTI criterion, and some data that
works against the criterion.
This data set does not consider the relative strength of policy statements in the document in
relation to each LUTI criterion. The purpose of this data set is to get an overall indication, for
each document as to whether there is generally, support, lack of support, or ambiguity in
relation to each LUTI criteria. A summary of the content analysis for data set 1 is available in
Appendix 5 Summary of Perth state and local policy document analysis by positive, negative
or mixed reference to LUTI Criteria
Data set 2 records the highest point achieved on the seven point rating scale (-3 through to
+3) used for the content analysis (see content analysis method above) in each document in
relation to each LUTI criteria – that is, the best case scenario as reflected in the document
(Appendix 6).
The rationale for compiling these two data sets is as follows. Firstly, we wanted an overall
measure of whether or not a document was supportive of each of the LUTI criteria and to
identify where there were mixed or ambiguous messages within a document in relation to the
LUTI criteria. Secondly, we wanted to present a realistic, but positive overall analysis of each

24
policy document, hence the choice of a data set that scores each document according to its
best rating.
It is important to note that our analysis does not include a count of how many times each
criterion was referenced in each document. In any one document, some criteria however may
have been coded several times, others only once (or not at all). With more time, this may
have been a useful way to also collect data in that it shows the degree to which a particular
LUTI criterion is infused across each document.
Several challenges were noted through the process of the content analysis. In many cases, the
documents analysed were lengthy and the process was therefore time consuming. There were
also observed implications from breaking down a policy document into separate elements to
score. Firstly, a qualitative assessment of the overall document is not achieved. Secondly,
data may become de-contextualised. For example, a local planning scheme could score +3 for
the criterion relating to medium to high residential densities because one precinct within the
scheme strongly advocates for higher density, whereas the overall picture for the total scheme
area works against higher densities. This was the case for the Melville Local Planning
Scheme (1999), and is reflected in the score for ambiguity in this document. Finally, the sheer
amount of data generated makes analysis complex.
25
3. The governance of land use and transport integration in the Greater Perth Metropolitan Region The Australian constitution delegates power for urban planning to each state and territory,
which has its own statutory, policy and procedural planning framework (Williams, 2007).
The governance of land use and transport integration in Australia is therefore a state
government responsibility. There is no national framework for sustainable transport to direct
state and local government (Curtis, 2008). The power relationships across state government
departments and between state and local government play an important part in the
institutional capacity ability to deliver sustainable and integrated transport. So it is therefore
necessary understand the position of each level of government and its ability to influence land
use and transport integration.
The Greater Perth Metropolitan area (Perth metropolitan plus Peel area) is the jurisdiction of
32 Local Government Authorities, Five Regional Councils, the State Government of Western
Australia (see Figure 3.1) and the Federal Government of Australia (over Federal government
land only, for example the international and domestic airport). Each level of government has
its own interests and agenda that it pursues and coordination between competing agendas is a
challenge. It is therefore important to look at where the power to make decisions, enforce
policy and statutory authority lie. It is best to examine each layer of government individually.
The Federal government position will not be outlined as it is not in the scope of this study.

26
Figure 3.1 Government Structure: Greater Perth Metropolitan Region
State Government of Western Australia
Bassendean
Bayswater
Belmont
Kalamunda
Mundaring
Cambridge Armadale Canning Claremont Mandurah
Swan
Joondalup
Perth
Stirling
Wanneroo
Victoria
Vincent
Gosnells
South Perth
Cockburn
East
Fremantle
Kwinana
Melville
Rockingham
Cottesloe
Mosman
Peppermint
Subiaco
Murray
Nedlands
Serpentine
East Metropolitan
Regional Council
Mindarie Regional Council
South East Metropolitan
Regional Council
Southern Metropolitan
Regional Council
Western Metropolitan
Regional Council

27
Western Australian State Government
The Parliament of Western Australia has the power to legislate for town planning in the State
and has done so widely. The most important Act with respect to planning that the Parliament
has passed was the Town Planning and Development Act 1928 (now superseded by the
Planning and Development Act 2005) with the stated purpose of the current Act being to,
‘provide for an efficient and effective land use planning system in the State; and
promote the sustainable use and development of land in State’
The Act establishes the requirements for approval of the subdivision of land and for
development and production of local government town planning schemes to guide and
control development at the local level. An independent authority, now the Western Australian
Planning Commission (previously State Planning Commission, previously Metropolitan
Planning Commission), was established for the purpose of making recommendations to the
Minister on the guidance and control of development. It has wide powers over all aspects of
planning in the state and can block a development. As coordinator of development and
infrastructure the Commission plays a key role in the integration of land use and transport
policy and in so guiding the approach to transport infrastructure provision.
The parliament can also legislate for planning in specific areas of the state that are perceived
to have special significance. For example the Swan Valley Planning Legislation Amendment
Act 1995 and the Swan Valley Planning Legislation Amendment Act (2006) were designed to
retain the Swan Valley as an agricultural/tourism area, protecting it from being lost to
suburban development (WAPC 2006). The Parliament of Western Australia is instrumental in
the way planning is carried out in the state as it has created a number of statutes as well as
statutory bodies that regulate the planning profession and land development.
28
The Minister that has the most direct control over planning is the Minister for Planning and
Infrastructure. The Minister is responsible for the Department of Planning and Infrastructure.
The duties of the Department of Planning and Infrastructure are,
‘Enriching the quality of life for all Western Australians by connecting and delivering
economic and social networks’ and to integrate land use and transport planning by
carrying out policy (Department of Planning and Infrastructure n.d. 2)
As established in the Planning and Development Act (2005) the State Administrative
Tribunal (SAT) is an important executive function for planning in Western Australia. Subject
to Part 14 of the Act, development applications and decisions can be reviewed in the State
Administrative Tribunal. The Minister can also call in any application, and if this occurs, the
decision of the Minister is final and cannot be appealed (s246). The State Government covers
every aspect of planning in the state and has the final decision on planning matters in most
cases.
Local Government
The next tier of government is local government. The population and territory size of local
governments vary. There are a total of 32 local governments in the Perth Metropolitan area
and more if the area is extended to include greater Perth (see above). Appendix 4 provides
details and a profile of each local government within our study. Local governments exist by
virtue of the State Government and have no protection under the Commonwealth Of Australia
Constitution Act 1900. Whilst they have an important role in planning, this exercised within
the boundaries of State government policy and statutory frameworks (Murphy 2007). An
example of the power of the state government over local government is when a previous
government passed the City Of Perth Restructuring Act 1993. This Act dissolved the City of

29
Perth LGA and appointed commissionaires in their place until the city boundaries were
reorganised creating the Town of Vincent, Town of Victoria Park, Town of Cambridge and a
much smaller City of Perth. However, even though local government is subordinate to the
state government in planning, devolution of power from centralised planning agency towards
local governments has increased. Local governments have increasingly asserted power over
planning decision making and even though state government has the power to overrule local
decisions, the politics involved may make this complicated (Hedgcock, 2003).
Local governments play an important role in town planning in Western Australia. The most
important thing that local governments do is to produce and apply a local planning scheme,
which must be reviewed every 5 years, as outlined by Part 5 of the Planning and
Development Act 2005. Any development in an area has to be approved by a local
government to make sure that it conforms to the local planning scheme. The decision of the
council may be appealed against to the State Administrative Tribunal. In relation to transport
planning, local government have responsibility for maintaining local roads (the State Main
Roads Agency and The WAPC have responsibility for primary roads within the metropolitan
area). As a rule local government do not have responsibility for public transport within the
metropolitan area, which is a function of the state Public Transit Authority (PTA) which sits
within the Minister for Planning and Infrastructure’s portfolio. The exception to this has been
in the provision of three ‘City Access Transit Schemes’ (CATS) where a free bus service is
operated by local government in conjunction with the PTA in Perth CBD, Fremantle and
Subiaco-UWA.
Regional Councils
Five Regional councils operate in the Perth Greater Metropolitan Area. These are councils
that have been formed by local government authorities in the same region to share

30
information, resources and take advantage of synergies. Part 3, Division 4, Section 3.61 of
the Local Government Act 1995 States that,
“Two or more local governments may, establish a regional local government to do
things, for the participants, for any purpose for which a local government can do
things under this Act or any other Act”
In this light regional councils have the ability to tackle transport issues that extend beyond
one local government authority. Regional councils are voluntary with some local
governments, such as Nedlands, not being a part of any Regional council. The South West
Regional Group is similar to a regional council, but formed in 1983 before the Local
Government Act 1995 which outlined rules for the operation of regional councils came into
affect. It exists outside the Local Government Act 1995.
Most regional councils deal only with waste management and, to a limited degree,
environmental initiatives. There is significant potential for the regional councils to have a role
in delivering more coordination and cooperation on regional issues, including transport.
Regional councils may develop regional transport strategies aimed at providing a transport
network that is highly efficient and promoting common interest outcomes for the council in
the regional body, drawing on the state governments Metropolitan Transport Strategy. These
regional transport strategies can enable securing more funding from the Federal Government,
although this is not a formal process. At the time the content analysis was undertaken, only
the South West Regional Group had an integrated transport strategy (2003). In December
2007, the East Metropolitan Regional Council finalised its Regional Integrated Transport
Strategy (December 2007).
31
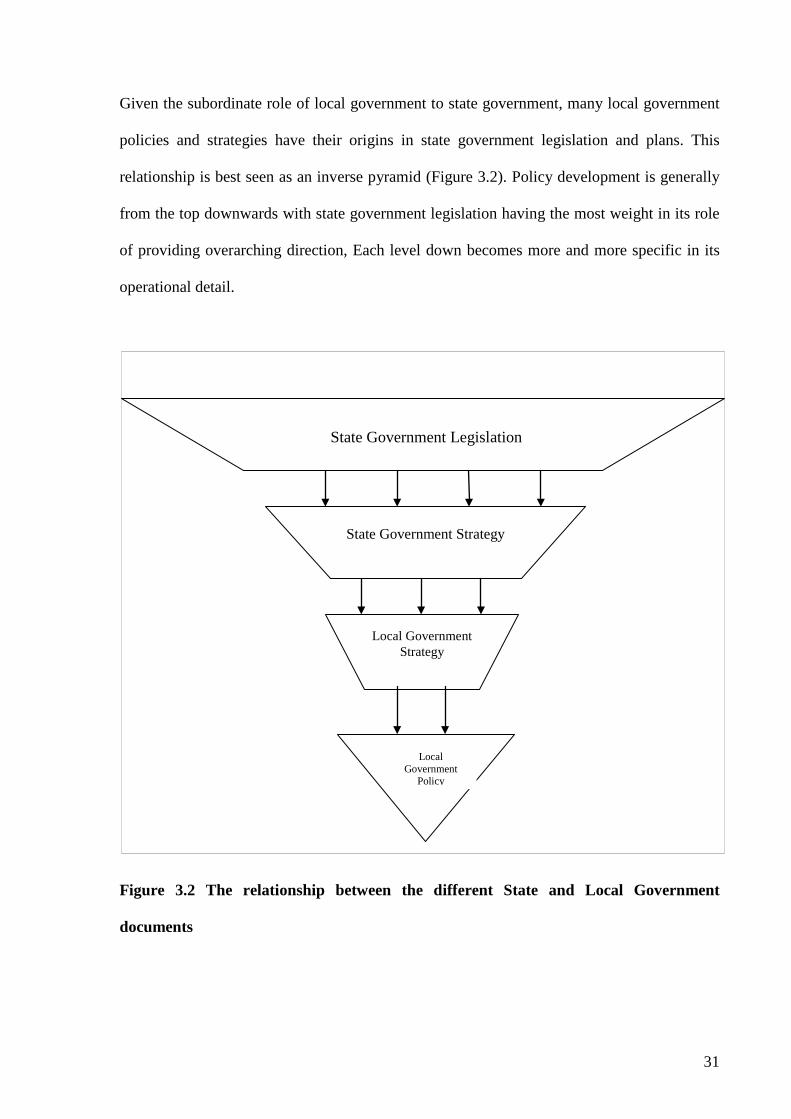
Given the subordinate role of local government to state government, many local government
policies and strategies have their origins in state government legislation and plans. This
relationship is best seen as an inverse pyramid (Figure 3.2). Policy development is generally
from the top downwards with state government legislation having the most weight in its role
of providing overarching direction, Each level down becomes more and more specific in its
operational detail.
Figure 3.2 The relationship between the different State and Local Government
documents
Local Government
Policy
State Government Legislation
State Government Strategy
Local Government Strategy

32
An example of this inverse pyramid is the structure of land use planning documents and their
level within the scheme of planning in Western Australia (Figure 3.3). At the peak is the
most important planning and development document, the Planning and Development Act
2005.
Figure 3.3 Relationship between state and local government policies, strategies and
statutory planning documents.
Planning and Development Act 2005
State Planning Strategy
Metropolitan Region Scheme
State Planning Policy
Local Planning Strategy
Local Planning Scheme
Local Government Area
Local Planning Policies

33
4. Policy for Land use and transport integration in the Perth Metropolitan Region There are a large range of documents that relate to land use and transport produced by the
state government. Many of these documents give direction to local government documents
and policies, as has been outlined previously. To understand the how land use and transport
integration is incorporated in policy requires consideration of a range of documents produced
at the state level, as well as the documents produced by local governments.
Current planning policy, at the state level is comprised of a set of policies, strategy plans and
statutory instruments. Different elements of the policy framework operate at different levels,
ranging from the whole state (such as the State Planning Strategy), to the metropolitan region,
to particular places or sectors. There are also detailed operational policies applicable to
particular aspects of development, for example WAPC Development Control Policy 1.6,
Transport Oriented Development (January 2006), which is relevant to transport precincts.
Local governments also produce planning policies, though they sit within the framework of
state policy and are normally produced on an ad hoc basis. The most important planning
documents that local governments produce are local planning schemes and local planning
strategies (Curtis, 1999). Figure 4.1 shows the relationships between statutory and non
statutory instruments in the Western Australia Planning Policy Framework.

34
Figure 4.1 Western Australia Policy Framework and Statutory Instruments Key:
In broad terms, statutory documents are designed to give regulatory force to the visions
contained in strategic planning documents. The problem is that statutory controls, such as
zoning are blunt tools for the interpretation of complex ideas and goals – such as the
integration of land use and transport planning. Planning policy informs the interpretation of
statutory planning schemes (Stein, 2008)
State Government statutory policy documents
The Metropolitan Region Scheme provides overall direction for development in the Perth
metropolitan area. The scheme has statutory backing under the Part 4 of the Planning and
Development Act 2005. Local planning schemes must be consistent with the Metropolitan
Region Scheme (MRS) and where they are not consistent, the MRS prevails. The MRS also
Strategy Plans Eg. State Planning Strategy, Network City,
Strategic Policies
Eg. Metro Centres etc
Region Schemes
Regional / Sub-Regional Structure
Plans District
Structure Plans
Local Structure Plans
Local Planning Scheme & Strategy
Subdivision and Development control
policies
Local Govt. Policies
Statutory processes
Non-Statutory – but must have ‘due regard’ in preparing planning schemes and decisions on planning matters
Local Transport Strategies
35
identifies the major transport routes through the region and sets out where these routes are to
go in the future. As the MRS is map based, zoning land for urban, non-urban and public
purposes, it was not subject to content analysis in this research. It is, however important to
acknowledge it as of primary statutory importance to planning and development decisions.
Overall there were five State government statutory documents that were analysed using the
LUTI framework:
1) WAPC Development Control Policy 2.6 Residential Road Planning (June 1998). This
policy sets out the requirements for the design and planning of roads in residential
areas. It has a significant impact on nature of urban streets, their integration with the
urban fabric, and the types of transport modes that are enabled.
2) Development Control Policy 1.5 Bicycle Planning (July 1998). This policy focuses on
the planning considerations necessary to improving the safety and convenience of
cycling. It includes measure to enable integration of the needs to cyclists in new
subdivisions, as well as feature related to commuter cyclist routes and end of trip
facilities.
3) Liveable Neighbourhoods Edition 2 (2000). This document operates as a planning
design code, or development control policy for the assessment of structure plans and
subdivision applications toward the implementation of the State Planning Strategy,
which aims to guide the sustainable development of the Perth Metropolitan Region to
2029. The first edition of the policy was published in 1997. While this particular
version of the document was non-statutory, at the time of analysis a later version
(which incorporated the content of this version) was adopted as a statutory document.
For this reason this policy text is included in this category. This document is generally
36
relevant to LUTI. In particular, Element 2, the Movement Network contains several
provisions for the integration land use and transport planning.
4) Development Control Policy 1.6 Planning to Support Transit Use and Transport
Oriented Development (TOD) (January 2006). This policy “seeks to maximise the
benefits to the community of an effective and well used public transit system by
promoting planning and development outcomes that will support and sustain public
transport use, and which will achieve the more effective integration of land use and
public transport infrastructure” (p2). It is directly relevant to achieving land use and
transport integration, particularly in the vicinity of key transit nodes.
5) Statement of Planning Policy 3 Urban Growth Settlement (Feb 2006). This policy
“sets out the principles and considerations which apply to planning for urban growth
and settlement in Western Australia.” (p1065). It is central to framing the integration
of land use and transport, with one of its objectives being,
To promote the development of a sustainable and liveable neighbourhood
form which reduces energy, water and travel demand whilst ensuring safe
and convenient access to employment and services by all modes, provides
choice and affordability of housing and creates an identifiable sense of
place for each community (p1066)
Together, these five policies provide the statutory framework guiding the potential
achievement of land use and transport integration in the Perth Greater Metropolitan Region.
State strategic policy documents
Strategy documents do not tend to carry the same type of detail as non-statutory documents
and are focussed on setting the strategic framework within which development occur and by
which statutory instruments are interpreted. The preparation of schemes, and decisions on
37
planning matters must have ‘due regard’ to non-statutory planning policy (Curtis, 1999) and
some strategy documents are referenced in statutory policy, providing them legal status
(Stein, 2008). There were four core strategic documents at the state level relevant to land use
and transport integration that were subject to the content analysis:
1) The State Planning Strategy. The Strategy is published in two parts. Part 1 provides
an overview of the future direction for planning in Western Australia as a whole.
Some short-term priority actions have been identified in Part 1 to improve the way
planning is undertaken and decisions made. Part 2 provides a list of strategies and
actions for government to improve the environment, community, economy and
infrastructure. It also provides a range of strategies and actions for each of the 10
regions of the State (of which metropolitan Perth is one).
2) Network City. This sets out the regional planning strategy for the metropolitan Perth
and Peel regions until the year 2029. One of the key areas that it deals with is
transport. It places a heavy emphasis on the development of the metropolis around
public transport networks and in the need to improve walkability of local areas. This
strategy acts as a policy guide to both local governments (for development of their
own Local Planning Strategies) and other state government departments.
3) Perth Metropolitan Transport Strategy Proposes strategies for moving from a highly
car dependent transport system to one that is more sustainable based on other means
of transport. This strategy has no statutory weight but is seen as a guiding document
when framing policy and other strategies by both local Governments and government
departments.
4) Metroplan (1990) Metroplan was replaced by Network City as Perth Strategic
planning strategy in 2004. Metroplan envisaged Perth’s strategic development through

38
a hierarchy of retail centres ranging from strategic regional centres to neighbourhood
centres, with the assumption of car based access (Curtis and Scheurer, 2007). Many
current local planning schemes were developed under the strategic framework of
Metroplan, and it therefore has ongoing influence in the policy context for land use
and transport integration
It is important to note that there are other, albeit less relevant, strategic documents that are
relevant to the framework for land use and transport integration at the state level; time
constraints and a focus on analysis of those documents most influential in terms of decision
making means that documents such as these have not been analysed. These include
documents like: Bike Ahead: Bicycle Strategy for the 21st Century; Perth Bicycle Network
Plan; Travelsmart 10 year Plan; and the PTA corporate plan.
Local Government Policy
There are a wide range of local government documents that relate to land use and transport
both directly and indirectly. Some are required by State legislation, others are policies that are
used to guide the council and it officers. In this respect the weight to be accorded to each
document in decision making varies. A content analysis was undertaken on the local planning
schemes for each LGA and three additional types of document – local planning strategies,
local transport strategies and local bike plans. Although not all local governments had these
additional documents at the time of the analysis, they are important due to their direct role in
influencing planning decision making at the local level. Before a more focussed review of the
documents that were subject to content analysis in this research, a review of some of the other
potentially relevant local government documents is undertaken.

39
Although local government strategic (or corporate plans) were not analysed they are also
important to the context for land use and transport integration. Local governments are
required to produce a corporate or strategic plan under s5.56 of the Local Government Act
1995. However the provisions made are not directive – simply stating that,
(1) “A local government is to plan for the future of the district.
(2) A local government is to ensure that plans made under subsection (1) are in
accordance with any regulations made about planning for the future of the district.”
This is further defined in s.19C of The Local Government (Administration) regulations 1996,
including the requirement for these documents to set out the council’s values and objectives
for a minimum of two years ahead and councils are required to pay due regard to their
corporate or strategic plan in the development of their annual budget. They are linked to the
development of a Plan of Principle Activities, which sets out all the proposed activities to be
undertaken in a four to five year cycle, as a statutory requirement under the Local
Government Act (1995) There is no legislative backing, or necessity to focus on areas
relevant to land use and transport integration within these documents and therefore they are
not of direct relevance to our research on LUTI. Planning Schemes, Planning Strategies,
Transport Strategies and Bicycle Plans are by their nature, directly relevant to LUTI.
However, it is possible for a strategic or corporate plan to guide planning and development
decisions, and the integration of land use and transport if these considerations are drawn into
the strategic/corporate planning process. For example, the Gosnells Strategic Plan 2007-2010
(City of Gosnells, 2007) includes a strategy to work with State government and surrounding
local governments in the development of an integrated transport strategy, and a strategy for
suburb regeneration and town centre revitalisation.
40
Local governments usually have their own policy manual, which is an organised group of
policies to guide actions, including an operations policy manual and a planning policy
manual. The operations policy manual is for the day to day running of the council and has
only minor impacts on transport matters. The planning policy manual is directly linked to the
local planning scheme and serves as a guide on land use planning decisions; it is of interest to
transport matters. The planning policy manual tends to evolve in response to the need to
manage issues that are not covered in the town planning scheme, and can therefore cover a
diverse range of issues, dependent on the local government. The scheme may be amended to
include measures from the policy manual at a later date. Neither of the two policy manuals is
a statutory document, as such they are unlikely to be accorded much weight in a development
decision.
Additionally, different local government have different non-statutory strategies that may
influence land use and transport integrations indirectly. These include: environmental
strategies; sustainability plans; access plans; and safety plans, all of which may have
measures relevant to the integration of land use and transport, though may have less of an
impact on the actual practice of planning in local governments.
Local Planning Schemes
The local planning scheme is the most powerful document that a council can produce as it is
the statutory basis of all land use planning and development in the council’s jurisdiction.
Local planning schemes must sit within the broad framework set by the Metropolitan Region
Scheme, but provide a much more detailed plan for each LGA. Local schemes set out
residential densities, plot ratios, where and what type of development can occur. They have a
significant impact on the capacity to achieve integrated transport and land use. The local
41
planning scheme goes through a period of public consultation as well as an examination by
the WAPC before the final document goes to the Minister for Planning and Infrastructure for
final approval. The importance of local planning schemes to land use transport integration is
high as they determine the nature of development and land use in an area. Councils are
required to produce a local planning scheme and a local planning strategy in accordance with
s.5 of the Planning and Development Act 2005. All of the LGA’s in the Greater Perth
Metropolitan Region have a local planning scheme, but not all have drafted a local planning
strategy yet.
Local Planning Strategies
These are strategies that set out the long term land use and development aims of the council.
They are prepared by the council and used as the guiding document informing the content of
the Local Planning Scheme. The Local Planning Strategy is the goal for the future and the
Local Planning Scheme is the tool to achieve the goal. The importance of Local Planning
Strategy to land use transport integration is high as it sets out the future direction of
development. At the time of the content analysis, only seven LGA’s in the Greater Perth
Metropolitan Region had drafted a local planning strategy. These were: Armadale;
Bassendean; Cockburn; Cottesloe; East Fremantle; Fremantle; Kwinana.
Local Transport Strategies and Bicycle Plans
Two types of local transport documents were subject to the LUTI content analysis. Local
Transport Strategies are non-statutory documents, and there is no requirement for a LG to
have one. Where they are present, local transport strategies draw on and are consistent with
the State Government Metropolitan Transport Strategy. At the time of analysis, there were
five local governments with local transport strategies: Fremantle, Nedlands, Rockingham,
South Perth and Subiaco. As an example, the intention of the Rockingham Integrated

42
Transport Plan (Worley Parsons, 2007) is to identify a range of strategies to assist in the
management of urban growth and quality of life. These strategies include a focus in the areas
of: process and policy; infrastructure and planning; and travel demand management,
empowerment and lobbying.
Like Transport Strategies, Local Bicycle Plans are not required for local governments, but are
a prerequisite for receiving state government funding for local bicycle facilities. They are
designed to enable the coordination and integration of bicycle infrastructure and networks in
local government areas. Support for their development is offered by Bikewest, which is
located in the State Department of Transport (Bikewest 2008). At the time the LUTI content
analysis was undertaken four local governments had bicycle plans: Canning, Fremantle,
Melville and Rockingham. As an example, the Fremantle bicycle plan (Transplan Pty Ltd,
2003) envisages a bike friendly city where the safety and legitimacy of cycling as a form of
transport is recognised and supported on all roads, cost effective infrastructure is provided,
and the role in health and welfare is supported.

43
5. Content Analysis results The suite of state and local government policy documents most relevant to integrating
transport and land use planning were analysed using the methodology discussed in part 2 of
this working paper. This section presents the results for the content analysis of policy
documents against the LUTI criteria (shown in Table 1). The LUTI principles are divided
into three main categories, with subcategories as follows:
LUTI PRINCIPLES
Access
• The Network
• Activity Function
• Traffic Management
• Service
Land Use
• Land use configuration
• Density/intensity
• Proximity
• Parking
People Places
• Scale and design
• Amenity
The results discuss particular criteria for each of the three categories, and are also references
to the sub categories under each main category that are listed above.
The focus of the results is to provide a comparative horizontal analysis across the suite of
local government documents, and the suite of state government documents and a vertical

44
analysis looking at the degree of policy integration between state and local government.
Where there are interesting findings in relation to particular documents, these are also
discussed. State and local government documents are divided into two categories, statutory
and non- statutory.
Overview
To summarise the representation of LUTI criteria in state and local policy documents, the
documents were divided into 3 types: state statutory documents, state non statutory
documents and local planning schemes. Local planning strategies, local transport strategies
and local bike plans have not been included in this overview, as only a few local governments
have them. They are discussed in the detailed analysis that follows.
For each of these document types, Table 2 summarises the representation of the LUTI Access
criteria; Table 3 summarises representation of the LUTI Land Use criteria; and Table 4
summarises representation of the LUTI People Places criteria. These tables show: a) the
percentage of each type of document that positively represents each LUTI criterion and b) the
highest rating, or level of support provided, in each type of document. For example, if the
highest coding that any local planning scheme received for a criterion was 3, then this is what
the table reflects – even though other local planning schemes may have not reflected, or even
worked against this criteria. These finer details emerge in the more comprehensive analysis
that follows. By representing the highest coding, or level of support provided in each type of
document alongside the percentage data, an indication of both the current best potential
strength and the overall breadth of support for each LUTI criteria are provided.

45
In considering analysis of the state government documents, it is important to remember that
the suite of documents here needs to be considered together as ‘state policy’ for LUTI.
Therefore the percentage of statutory and non-statutory state documents representing a
particular criterion is only a partial representation of how well the criteria are represented at
the state level. Some documents, such as DC2.6 Residential Road Planning have a very
specific purpose, and therefore, would not necessarily be expected to cover, for example, the
operational aspects of public transport. Others, such as the State Planning Strategy are very
strategic, and would not be expected, for example, to cover the intricacies of residential road
design. With this in mind, the analysis does provide an overview of the degree of horizontal
integration of LUTI principles across state government policy documents.
The percentage of local government planning schemes representing each criteria is perhaps
more interesting in demonstrating the horizontal variation across local planning schemes. In
1999, Town Planning Amendment Regulations were gazetted, requiring local zoning schemes
to comply with a Model Scheme Text. The aims of this amendment included the need to
improve consistency and to introduce a greater strategic component to local schemes
(WAPC, 1999). Nonetheless, there are significant differences across schemes in terms of
how well and in which areas the LUTI criteria are supported. Further, several local planning
schemes were drafted prior to the introduction of the model scheme text. Findings are
summarised for Access, Land Use and People Places following each table.

46
Access
A brief visual analysis of Table 2 shows that best overall integration across state statutory and
non statutory documents, and local government planning schemes1
• Activity Function, A6 - High quality pedestrian experience, arterial roads have safe
pedestrian facilities, on-road cycle lanes; and
is achieved for LUTI
access criteria in the areas of:
• Traffic Management, A10 – Effective traffic management
• Service, A20 - Cycle friendly; secure cycle storage; connective networks of adequate
capacity.
On the positive, this reflects strength in its focus on non-motorised transport. However, it also
reflects a lack of supportive details integrated between state and local government to enable
integration across transport modes, such as traffic management, or the detailed operational
aspects required for a good public transport. Inevitably these other factors will impact on the
actual achievement of a high quality pedestrian experience, and a cycle friendly environment
that connects cyclists to public transport.
1 Defined as a minimum of 20% in each type of document (statutory and non statutory state and local government schemes)
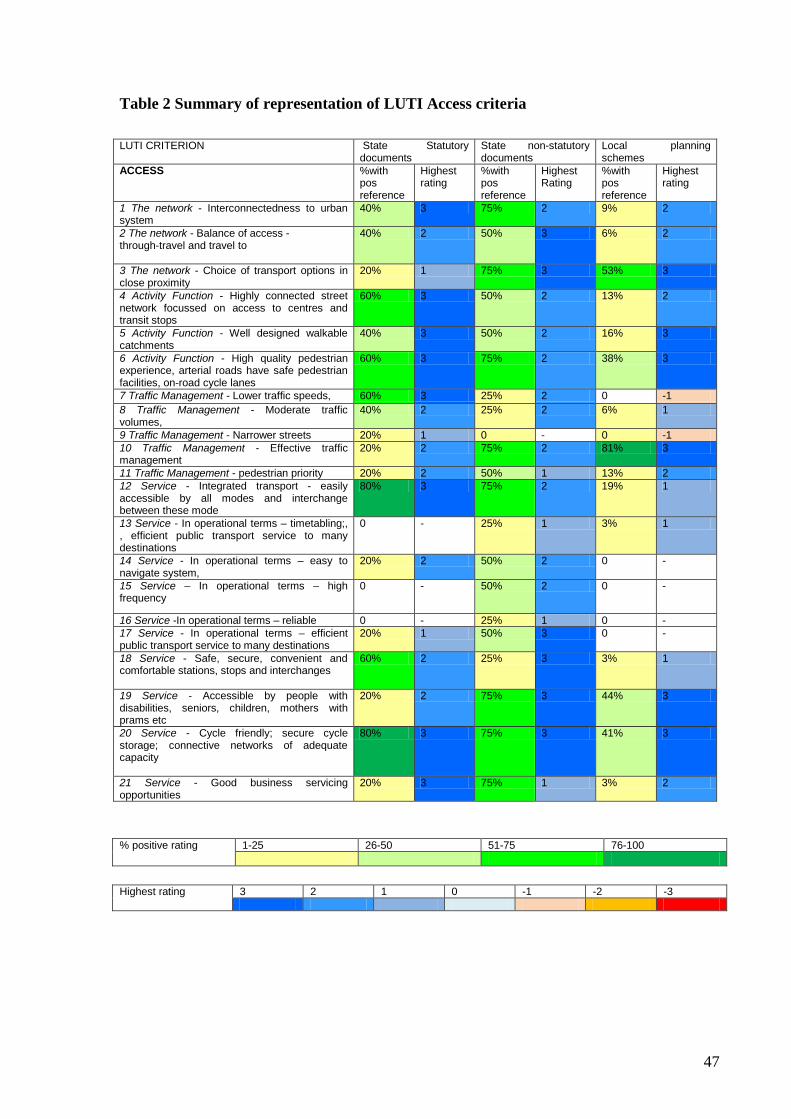
47
Table 2 Summary of representation of LUTI Access criteria
LUTI CRITERION State Statutory documents
State non-statutory documents
Local planning schemes
ACCESS %with pos reference
Highest rating
%with pos reference
Highest Rating
%with pos reference
Highest rating
1 The network - Interconnectedness to urban system
40% 3 75% 2 9% 2
2 The network - Balance of access - through-travel and travel to
40% 2 50% 3 6% 2
3 The network - Choice of transport options in close proximity
20% 1 75% 3 53% 3
4 Activity Function - Highly connected street network focussed on access to centres and transit stops
60% 3 50% 2 13% 2
5 Activity Function - Well designed walkable catchments
40% 3 50% 2 16% 3
6 Activity Function - High quality pedestrian experience, arterial roads have safe pedestrian facilities, on-road cycle lanes
60% 3 75% 2 38% 3
7 Traffic Management - Lower traffic speeds, 60% 3 25% 2 0 -1 8 Traffic Management - Moderate traffic volumes,
40% 2 25% 2 6% 1
9 Traffic Management - Narrower streets 20% 1 0 - 0 -1 10 Traffic Management - Effective traffic management
20% 2 75% 2 81% 3
11 Traffic Management - pedestrian priority 20% 2 50% 1 13% 2 12 Service - Integrated transport - easily accessible by all modes and interchange between these mode
80% 3 75% 2 19% 1
13 Service - In operational terms – timetabling;, , efficient public transport service to many destinations
0 - 25% 1 3% 1
14 Service - In operational terms – easy to navigate system,
20% 2 50% 2 0 -
15 Service – In operational terms – high frequency
0 - 50% 2 0 -
16 Service -In operational terms – reliable 0 - 25% 1 0 - 17 Service - In operational terms – efficient public transport service to many destinations
20% 1 50% 3 0 -
18 Service - Safe, secure, convenient and comfortable stations, stops and interchanges
60% 2 25% 3 3% 1
19 Service - Accessible by people with disabilities, seniors, children, mothers with prams etc
20% 2 75% 3 44% 3
20 Service - Cycle friendly; secure cycle storage; connective networks of adequate capacity
80% 3 75% 3 41% 3
21 Service - Good business servicing opportunities
20% 3 75% 1 3% 2
% positive rating 1-25 26-50 51-75 76-100
Highest rating 3 2 1 0 -1 -2 -3

48
Overall, the access criteria are better integrated across the state government documents and
their representation in local planning schemes is inconsistent. Whilst many of the access
criteria were covered in local planning schemes as a whole, for the most part, only a small
proportion of the schemes were supportive of any particular criteria. There significant gaps in
coverage of access criteria in both state and local documents around the operational aspects
of public transport service and this demonstrates a gap in the capacity to deliver LUTI.
Land Use
A brief visual analysis of Table 3 shows that best integration2
• Land use configuration:
across state statutory and non
statutory documents and local government planning schemes is achieved for land use criteria
in the areas of:
o LU 1 - Land use integrated with integrated transport;
o LU 2 - A robust urban form – Can adjust to changes in demand for transport
and land use; and
o LU 3 - Greater diversity, vibrant mix of land uses within precincts.
• Density/Intensity, LU9 - Highest residential density in close proximity to activities.
There were fewer pronounced gaps in coverage across the suite of documents for land use
criteria than there were for access criteria. The most notable gap to mention is: LU5, Land
use configuration - High pedestrian trip generating uses at ground floor, housing above in
close proximity of transit stop, which is absent from state government documents, and
covered only in a few local planning schemes. Parking criteria, LU 13-18 featured more
prominently in local planning schemes that in state government documents. However,
2 Defined as a minimum of 20% in each type of document (statutory and non statutory state and local government schemes)

49
overall, coverage of land use criteria, in terms of strength and breadth, is slightly stronger in
the suite of state government documents than in the local planning schemes.
The results in the sub category of land use configuration, demonstrate a broader trend where
the highest degree of vertical integration (state to local) is associated with the LUTI criteria
that contain less specific detail for planning. The first three criteria under land use
configuration: LU1 - land use integrated with integrated transport; LU2 - A robust urban form
– can adjust to changes in demand for transport and land use, and LU3 - greater diversity,
vibrant mix of land uses within precincts more open to interpretation that the other land use
criteria. These are: LU4 – Greater diversity, vibrant mix of land uses within buildings. LU5 –
High pedestrian trip generating uses as ground floor, housing above in close proximity of
transit stop; LU6 – Buildings orientated to station/streets/paths; LU7 – active ground floor
uses for surveillance; LU8 – Frontage development human scale.

50
Table 3 Summary of representation of LUTI land use criteria
LUTI CRITERION State Statutory documents
State non-statutory documents
Local planning schemes
LAND USE %with pos reference
Highest rating
%with pos reference
Highest Rating
%with pos reference
Highest rating
1. Land use configuration - Land use integrated with integrated transport
60% 3 100% 3 69% 2
2. Land use configuration - A robust urban form – Can adjust to changes in demand for transport and land use.
60% 3 50% 2 34% 2
3. Land use configuration - Greater diversity, vibrant mix of land uses within precincts
60% 3 75% 3 53% 3
4. Land use configuration - Greater diversity, vibrant mix of land uses and within buildings
20% 1 25% 3 28% 3
5. Land use configuration - High pedestrian trip generating uses at ground floor, housing above in close proximity of transit stop;
0 - 0 - 22% 2
6. Land use configuration - Buildings oriented to station/streets/paths;
20% 3 25% - 9% 2
7. Land use configuration - Active ground floor uses for surveillance;
20% 3 25% 1 3% 1
8. Land use configuration - Frontage development – human scale.
20% 3 25% - 3% 1
9.Density/Intensity - Highest residential density in close proximity to activities (but ensure includes family housing types);
80% 3 75% 2 53% 3
10. Density/Intensity - Medium to high residential densities;
60% 2 25% 2 25% 3
11. Proximity - Compact cluster of related (compatible) activities (highly visited) in close proximity (walking distance), clustered around rail station/high frequency bus stop;
20% 3 100% 3 25% 2
12. Proximity - More intensive/ high-medium density office, retail and other commercial uses (measured by high worker densities) within walking distance of transport facilities.
20% 2 75% 3 22% 1
13. Parking - Car parking areas managed so pedestrian access, amenity and safety not compromised;
0 - 50% 1 63% 3
14. Parking - Parking provided in shared structures rather than on individual sites;
20% 2 25% 1 41% 3
15. Parking - Car parking behind buildings not fronting street
20% 3 0 - 9% 3
16. Parking - Street parking 40% 2 0 - 22% 3 17. Parking -Short-term parking but limited commuter parking;
20% 1 25% 1 13% 2
18. Parking - Car-based retailing (drive-thru’) and light industry located on periphery of town with good car access.
20% 2 0 - 50% 3
% positive rating 1-25 26-50 51-75 76-100
Highest rating 3 2 1 0 -1 -2 -3

51
Table 4 Summary of representation of LUTI People Place Criteria LUTI CRITERION State
Statutory documents
State non-statutory documents
Local planning schemes
PEOPLE PLACES %with pos reference
Highest rating
%with pos reference
Highest Rating
%with pos reference
Highest rating
1. Scale and Design - Human scale – less demand for 70kph scale advertising, more sense that cars are not the priority mode;
60% 3 0 - 50% 3
2. Scale and Design - Integration of character and scale of development within precinct;
40% 3 75% 2 94% 3
3. Scale and Design - Respecting existing development (through retention or sympathetic redevelopment);
20% 1 50% 3 100% 3
4. Scale and Design - Diversity of architectural styles;
0 - 0 - 16% 3
5. Scale and Design - Legible design – is easily understood for residents and visitors.
60% 3 50% 1 0 -
6. Amenity - High amenity precincts – a place you want to go to – a destination in its own right.
60% 3 75% 2 91% 3
7. Amenity - Community/neighbourly feel – mixed ages – family friendly.
40% 2 25% 1 88% 3
8. Amenity - Good ‘people places’ – public open space, public seating, public art.
0 - 50% 3 91% 3
9. Amenity - More social encounters due to more walking, cycling, use of public transport.
0 - 0 - 9% 3
10. Amenity - Busy places. 20% 1 0 1 16% 1
% positive rating 1-25 26-50 51-75 76-100
Highest rating 3 2 1 0 -1 -2 -3
People Places
A brief visual analysis shows that best integration3
• PP2, Scale and Design - Integration of character and scale of development within
precinct;
across state statutory and non-statutory
documents and local government planning schemes is achieved for LUTI people places
criteria in the areas of:
3 Defined as a minimum of 20% in each type of document (statutory and non statutory state and local government schemes)

52
• PP6, Amenity - High amenity precincts – a place you want to go to – a destination in
its own right.
There are significant gaps of coverage for people places criteria, particular at the state
government level. Overall, there is much better coverage of the people places criteria in local
planning schemes.
Detailed results
This section provides detailed results for the LUTI content analysis across state and local
government documents. The results are provided separately for each LUTI category, access,
land use and people places. The results begin with a more detailed overview of the vertical
integration between state and local documents. For the purpose of this content analysis, it is
suggested that the policy framework is generally supportive of a particular LUTI criteria if it
is covered in statutory and non-statutory state documents and local planning schemes, which
are the only relevant document that is present in all Perth local government areas. What
follows is a detailed analysis of state government documents, including horizontal integration
across them and a review of coverage in local planning schemes as well as local planning
strategies, transport strategies and bike plans, where they are available is provided. See
Appendix 4 Summary of Perth state and local policy document analysis by positive, negative
or mixed reference to LUTI Criteria and Appendix 5 Summary of Perth state and local policy
document analysis by highest rating score for each LUTI criterion for full tables of data upon
which this analysis is based.
53
Access criteria
Overall, the results across state and local government for access reflect less vertical
integration between documents than for the LUTI land use and people places criteria. This is
significantly due to the finding that although the state statutory and non statutory documents
provide support to most of the access criteria, coverage in local planning schemes is patchy.
When compared, the state documents are far more likely to support or strongly support the
LUTI access criteria. Where local planning schemes do reflect the LUTI access criteria, these
criteria are, for the most part only weakly satisfied. As discussed in part 3 of this working
paper a significant part of the context for this finding is that local government has limited
responsibility for public transport, and only has responsibility for local roads. Primary
distributors, those roads that connect major destinations, are the responsibility of the state
government (Main Roads, nd).
The prominent access criteria, in terms of overall policy support at a state and local level is in
the area of traffic management, A10 - effective traffic management. This is supported at the
state level in statutory and non-statutory documents and by the majority of local planning
schemes4. The only other Access criteria that is supported at the statutory and non statutory
level in state policy, and in more than half of the local planning schemes5 is in the sub-
category of The Network, A3 - choice of transport options in close proximity. In the
subcategory of service, A19 - Public Transport Service, Accessible by people with
disabilities, seniors, children, mothers with prams etc;6 and A20 Public Transport Service,
Cycle friendly; secure cycle storage; connective networks of adequate capacity7
4 Supported by 26 of 32 local planning schemes
are also
comparatively well reflected through state policy and local planning schemes, however it is
5 Supported by 17 of 32 local planning schemes 6 Supported by 14 of 32 local planning schemes 7 Supported by 13 of 32 local planning schemes

54
important to note that less than half of the local planning schemes are directly supportive of
these two criteria. A noticeable gap in coverage of the access criteria appears in the category
of service, between A13 and A17,8
both in State statutory policy and local planning schemes.
These are the access criteria that deal with the operational aspects of a good public transport
system. As it has already been noted, local government has no responsibilities for public
transport provision. This represents a significant problem in the capacity of current policy at
the state and local level to support the detailed operational requirements of a good public
transport system. In the area of traffic management, A9 - narrower streets is another gap
through state and local documents.
State Government Documents
Of the State Government documents that were analysed, the Metropolitan Transport Strategy
provides the greatest breadth of support across access criteria, with only A9, Narrower
Streets not supported by this policy. WAPC DC 2.6, Residential Road Planning is the only
state document that did provide some policy support to A9, Narrower streets. Network City
and the Liveable Neighbourhoods Design Codes also demonstrate significant breadth of
coverage in access (see Table 5).
In terms of strength of coverage the Metropolitan Transport Strategy, The Liveable
Neighbourhoods Design Codes and WAPC 1.5 Jan 06 Transport Oriented Development
included several statements that strongly satisfy or satisfy the LUTI Access criterion. These
latter two documents, which include significant focus on land use (see analysis further on
8 A13, In operational terms – timetabling; efficient public transport service to many destinations; A14 In operational terms – easy to navigate system; A15, In operational terms – high frequency. A16 In operational terms – reliable, A17 In operational terms – efficient public transport service to many destinations

55
under land use), are a positive demonstration of the integration of land use and transport
policy (see Table 6).
Table 5 State Government Documents – Access Criteria Summary
State Policy Documents – Strategic A1 A2 A3 A4 A5 A6 A7 A8 A9 A10 A11 A12 A13 A14 A15 A16 A17 A18 A19 A20 A21
State Planning Strategy 1
Metropolitan Transport Strategy 1 1 1 1 1 1 1 1 1 1 1 1 1 1 1 1 1 1 1 1
Network City 1 1 1 1 1 1 1 1 1 1 1 1 1 1 1
MetroPlan 1990 1 3 1 1 1 1 1 1
State Policy Documents – Statutory
A1 A2 A3 A4 A5 A6 A7 A8 A9 A10 A11 A12 A13 A14 A15 A16 A17 A18 A19 A20 A21
Liveable Neighbourhoods 1 1 1 1 1 1 1 1 1 1 1 1 1 1 1 1
WAPC SPP 3 Urban Growth Settlement 1 1 1 1 1
WAPC DC 1.5 Bicycle Planning 3 1 1 1
WAPC DC 1.6 TOD 1 1 1 1 1 1
WAPC DC 2.6 Residential Road Planning 1 3 3 1 1 1 3 1 1
Key
1 Document includes one or more statements that meet LUTI Criterion
2 Document includes one or more statements that work against the LUTI criterion
3 Document includes some statements that meet LUTI criterion and some that work against it
The access criteria that most frequently received a positive mention in State documents were:
• Activity Function, A6 - a high quality pedestrian experience including arterial roads
that have pedestrian facilities and on-road cycle lanes;
• Service;
o A12 - Public Transport Service, Integrated transport - easily accessible by all
modes and interchange between these modes; and
o A20, Cycle friendly; secure cycle storage; connective networks of adequate
capacity.
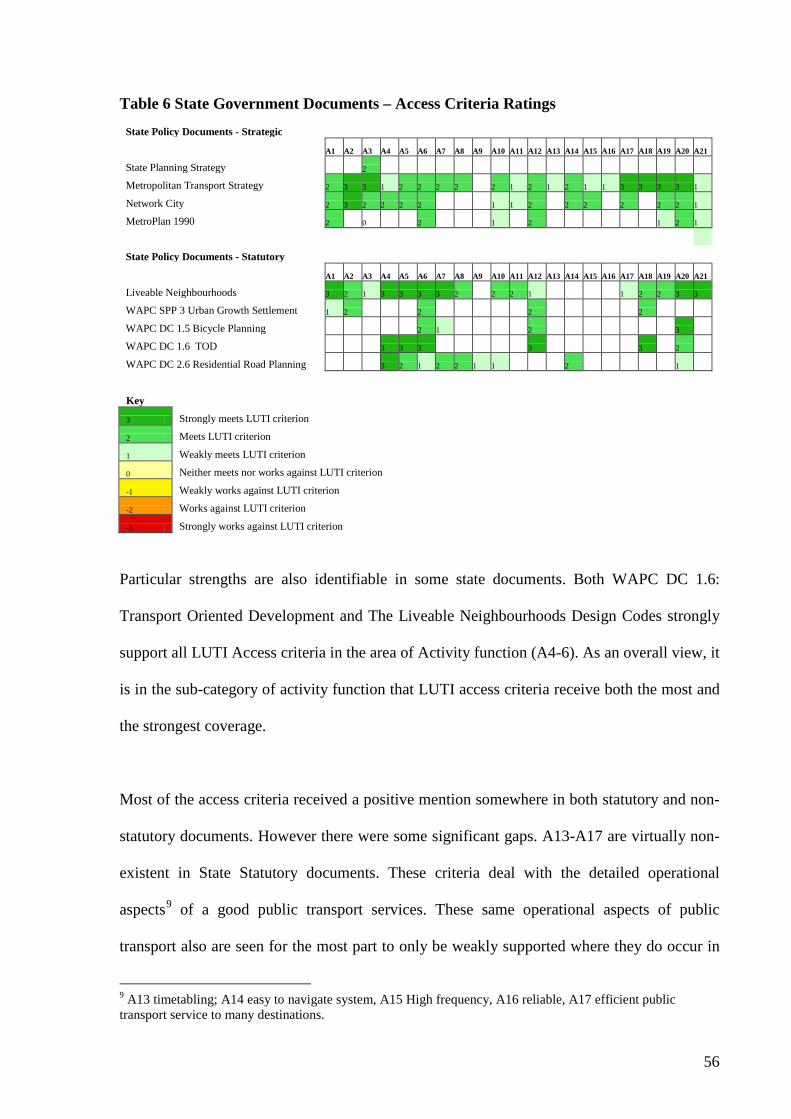
56
Table 6 State Government Documents – Access Criteria Ratings
State Policy Documents - Strategic
A1 A2 A3 A4 A5 A6 A7 A8 A9 A10 A11 A12 A13 A14 A15 A16 A17 A18 A19 A20 A21
State Planning Strategy 2
Metropolitan Transport Strategy 2 3 3 1 2 2 2 2 2 1 2 1 2 1 1 3 3 3 3 1
Network City 2 3 2 2 2 2 1 1 2 2 2 2 2 2 1
MetroPlan 1990 2 0 2 1 2 1 2 1
State Policy Documents - Statutory
A1 A2 A3 A4 A5 A6 A7 A8 A9 A10 A11 A12 A13 A14 A15 A16 A17 A18 A19 A20 A21
Liveable Neighbourhoods 3 2 1 3 3 3 3 2 2 2 1 1 2 2 3 3
WAPC SPP 3 Urban Growth Settlement 1 2 2 2 2
WAPC DC 1.5 Bicycle Planning 2 1 2 3
WAPC DC 1.6 TOD 3 3 3 3 3 2
WAPC DC 2.6 Residential Road Planning 3 2 1 2 2 1 1 2 1
Key
3 Strongly meets LUTI criterion
2 Meets LUTI criterion
1 Weakly meets LUTI criterion
0 Neither meets nor works against LUTI criterion
-1 Weakly works against LUTI criterion
-2 Works against LUTI criterion
-3 Strongly works against LUTI criterion
Particular strengths are also identifiable in some state documents. Both WAPC DC 1.6:
Transport Oriented Development and The Liveable Neighbourhoods Design Codes strongly
support all LUTI Access criteria in the area of Activity function (A4-6). As an overall view, it
is in the sub-category of activity function that LUTI access criteria receive both the most and
the strongest coverage.
Most of the access criteria received a positive mention somewhere in both statutory and non-
statutory documents. However there were some significant gaps. A13-A17 are virtually non-
existent in State Statutory documents. These criteria deal with the detailed operational
aspects9
9 A13 timetabling; A14 easy to navigate system, A15 High frequency, A16 reliable, A17 efficient public transport service to many destinations.
of a good public transport services. These same operational aspects of public
transport also are seen for the most part to only be weakly supported where they do occur in

57
state government documents. Only one of the LUTI criteria in this set, A17, efficient public
transport service to many destinations, is strongly supported and only in one document, the
Perth Metropolitan Transport Strategy.
Local Government
Support for access criteria in local planning schemes was patchy, with significant gaps.
Where LUTI Access criteria were covered in local planning schemes, the content analysis
shows that for the most part, they only weakly satisfy the LUTI criterion (see Table 7 and
Table 9). Compared to the local planning schemes, the non-Statutory Local Government
Transport and Planning strategies, generally showed greater breadth and strength in satisfying
the LUTI criteria (see Table 8 and Table 11). However, at the time of the content analysis,
only 7 of 32 Local governments had local planning strategies, and 5 of 32 had local transport
strategies. 4 local governments had local bike plans (see Table 8).

58
Table 7 Local Planning Schemes – Access Criteria Summary Local Planning Schemes
A1 A2 A3 A4 A5 A6 A7 A8 A9 A10 A11 A12 A13 A14 A15 A16 A17 A18 A19 A20 A21
Armadale 1 1 1 1 1 1
Bassendean 1 1 1 1
Bayswater 3 1 2 2 1 1 1 1
Belmont 1 1 2 1 1
Cambridge 1 1 2 1
Canning 1 1 1
Claremont 2 1 1 1
Cockburn 1 1 1 1
Cottesloe 1
East Fremantle 1 1 1 1 1
Fremantle 1 1 1 1 1 1
Gosnells 1 1 1 1
Joondalup 1 1
Kalamunda 1 1 1
Kwinana 1
Mandurah 1 1 1 1 1 2 2 1 1
Melville 1 1 1
Mosman Park 2 1 1
Mundaring 1 1 1 2 1 1
Murray 1 1
Nedlands 1 2 1
Peppermint Grove 1
Perth 1 1 1 1
Rockingham 1 1 1 1 1 1
Serpentine-Jarrahdale 1 1
South Perth 1 1 1
Stirling 1 1 1 2 2 1 1 1
Subiaco 1 1 1 1
Swan 1 1 1 1 1
Victoria Park
Vincent 2
Wanneroo 1 1 1 1 1
Key
1 Document includes one or more statements that meet LUTI Criterion
2 Document includes one or more statements that work against the LUTI criterion
3 Document includes some statements that meet LUTI criterion and some that work against it

59
Table 8 Non Statutory Local Government Documents – Access Criteria Summary Local Planning Strategies
A1 A2 A3 A4 A5 A6 A7 A8 A9 A10 A11 A12 A13 A14 A15 A16 A17 A18 A19 A20 A21 Armadale 1 1 1 1 1 1 2 1 3
Bassendean 1 1 1
Cockburn 1 1 1 1 1 1
Cottesloe 1 1 2 2 1 1 1 1 1
East Fremantle 1 1 1 1
Fremantle 1 1 1 1 1 1 1 1 1 1 1 1 1 1 1
Kwinana 1 1 1 1 1 2 3 1 1 1 1 1
Local Transport Strategies
A1 A2 A3 A4 A5 A6 A7 A8 A9 A10 A11 A12 A13 A14 A15 A16 A17 A18 A19 A20 A21
Fremantle 1 1 1 1 1 1 1 1 1 1 1 1 1 1 1
Nedlands 1 1 1 1 1 1 1 1 1 1 1 1
Rockingham 1 1 2 1 1 1 1 1 1 3 1 1 1 1
South Perth 1 1 1 1 1 1 1 1 1 1 1 1 1 1 1 1 1 1
Subiaco 1 1 1 1 1 1 1 1 1 1 1 1 1
Local Bike Plans
A1 A2 A3 A4 A5 A6 A7 A8 A9 A10 A11 A12 A13 A14 A15 A16 A17 A18 A19 A20 A21
Canning 1 1 1 1
Fremantle 1 1 1 1
Melville 1 1
Rockingham 1 1
Key
1 Document includes one or more statements that meet LUTI Criterion
2 Document includes one or more statements that work against the LUTI criterion
3 Document includes some statements that meet LUTI criterion and some that work against it
Local Planning Schemes
A10, Effective Traffic Management, was the only access criterion that was consistently
supported in local planning schemes10. With a few exceptions11, however the content analysis
reflected that this criteria was only weakly supported (Table 9). Close to half of the local
planning schemes were supportive of: A3, The Network, Choice of transport options in close
proximity12
10 28 of 32 local planning schemes
; A19, public transport service, public transport that is accessible by people with
11 Kalamunda was strongly supportive, Cambridge and Canning, supportive 12 17 of 32 local governments with positive mention, only 1, Mosman Park, strongly supportive, and one, Belmont supportive

60
disabilities, seniors, children, mothers with prams etc13; and A 20, service, cycle friendly,
secure cycle storage, connective networks of adequate capacity14. Beyond these criteria,
positive mention of the LUTI access criteria in Local planning schemes was patchy, and
limited to a few local governments only. Six access criteria were not mentioned positively in
any local planning scheme.15 Similar to State Statutory documents, these criteria were around
the operational aspects of good public transport services (A14-A18) and for A7, lower traffic
speeds and A9, narrower streets. While the majority of criteria referring to the operational
aspects of a good public transport system were simply absent, there were schemes that were
unsupportive of lower traffic speeds16 and narrower streets17
.
This reiterates a point made in the overview. There is support provided to non motorised
modes of transport, and to public transport, albeit in general terms. However, lack of breadth
in coverage of the access criteria means that the many issues – such as those related to traffic
management and public transport service that are interrelated with the use of non motorised
transport are not - means that overall, the practical achievement of these LUTI principles will
be constrained.
Overall, 7 of 21 access criteria were not mentioned positively at all in local planning
schemes. Beyond these, what is particularly interesting is that whilst coverage was patchy,
most of the criteria were covered in at least a few schemes. This suggests that local planning
schemes can be supportive of many of the access criteria, even though for the most part they
13 14 local government with an positive mention, 4 strongly supportive 14 13 local governments with a positive mention, 3 strongly supportive, and 5 supportive 15 A14-A18 16 10 of 32 local planning schemes 17 2 of 32 local planning schemes

61
are not. So while local planning schemes may be a blunt tool for the implementation of the
access elements of land use and transport, they can, and some do, do a better job.
Table 9 Local Planning Schemes – Access Criteria Ratings
Local Planning Schemes A1 A2 A3 A4 A5 A6 A7 A8 A9 A10 A11 A12 A13 A14 A15 A16 A17 A18 A19 A20 A21
Armadale 1 3 1 1 1 3
Bassendean 1 1 1 2
Bayswater 2 2 -2 -1 1 1 3 3
Belmont 2 1 -2 2 1
Cambridge 1 1 -2 1
Canning 2 3 2
Claremont -3 1 2 3
Cockburn 1 1 1 1
Cottesloe 1
East Fremantle 1 1 1 1 1
Fremantle 1 1 1 1 1 2
Gosnells 1 1 3 2
Joondalup 1 1
Kalamunda 1 2 3
Kwinana 1
Mandurah 1 1 1 1 2 -1 -3 1 1
Melville 3 1 3
Mosman Park -1 1 1
Mundaring 1 1 1 -1 1 1
Murray 1 1
Nedlands 1 -1 1
Peppermint Grove 1
Perth 2 1 1 1
Rockingham 1 1 2 2 1 1
Serpentine-Jarrahdale 1 1
South Perth 1 1 2
Stirling 1 1 3 -1 -1 1 1 1
Subiaco 1 1 1 1
Swan 1 1 1 1 1
Victoria Park
Vincent -1
Wanneroo 1 1 1 1 2
Key
3 Strongly meets LUTI criterion
2 Meets LUTI criterion
1 Weakly meets LUTI criterion
0 Neither meets nor works against LUTI criterion
-1 Weakly works against LUTI criterion
-2 Works against LUTI criterion
-3 Strongly works against LUTI criterion

62
It is difficult to identify notable local planning schemes in terms of their support of the access
criteria. However Mandurah (dated 1999) covers A4-6, all the Access – Activity function
criteria, and positively mentions 7 of the 21 access criteria overall. This is the highest breadth
of coverage of all local governments. There are several local planning schemes where access
criteria are unsupported, hardly mentioned, or not mentioned at all. The Town of Vincent
(dated 1998) was only coded once as weakly working against A7, Lower traffic speeds. No
LUTI access criteria were coded for the Victoria Park local planning scheme (dated 1998).
The Cottesloe and Peppermint Grove Schemes (dated 1988 and 1996 respectively) were
weakly supportive of only one access criteria A12, Integrated transport - easily accessible by
all modes and interchange between these mode. Joondalup (dated 2000) was only weakly
supportive of A3 – Choice of transport options in close proximity, and A11 – Pedestrian
priority.
Non Statutory Local government documents
Of all local government documents reviewed, local transport strategies showed the best
coverage of access criteria, though even in these there was a similar gap around some of the
operational aspects of public transport (Table 10).18 Importantly, however, the Transport
Strategy for South Perth covered all criteria in the subcategory of service; the Fremantle and
Subiaco transport strategies covers all except one traffic management criteria;19
Table
and Subiaco
transport strategy covers all the activity function criteria. The local planning strategies also
show stronger support for access criteria than local government planning schemes – many of
the access criteria are supported, or strongly supported, whereas where local planning
schemes provide support to the access criteria, they are for the most part only weakly
supportive (see 7 and Table 9).
18 In particular, A14 easy to navigate system, A15 High frequency, A16 reliable 19 In both instances, A9, Narrower streets

63
Local planning strategies, as a whole, also demonstrated better coverage of access criteria.
A10, Effective traffic management was universally covered in local planning strategies. Only
one strategy did not refer to A1, Interconnectedness to the urban system. Similar gaps
occurred here to those in the state documents and in the local planning schemes, in the areas
of traffic management (A7-A9) and service (A13-A19).
Table 10 Non Statutory Local Government Documents – Access Criteria Ratings Local Planning
Strategies A1 A2 A3 A4 A5 A6 A7 A8 A9 A10 A11 A12 A13 A14 A15 A16 A17 A18 A19 A20 A21
Armadale 2 1 1 1 2 2 -1 2 0
Bassendean 1 1 1
Cockburn 2 1 1 2 2 2
Cottesloe 1 1 -1 -1 1 2 1 1 1
East Fremantle 2 1 2 2
Fremantle 2 1 1 1 1 1 1 2 2 3 1 1 2 1 1
Kwinana 1 2 1 2 1 -1 1 2 2 1 1 2
Local Transport
Strategies A1 A2 A3 A4 A5 A6 A7 A8 A9 A10 A11 A12 A13 A14 A15 A16 A17 A18 A19 A20 A21
Fremantle 1 3 2 2 2 1 1 2 2 2 2 1 3 3 3
Nedlands 1 2 2 1 2 2 2 1 1 2 1 1
Rockingham 2 1 -1 1 2 1 3 1 3 2 1 2 1 2
South Perth 1 2 1 3 1 3 2 2 3 2 2 2 3 3 2 1 3 1
Subiaco 3 1 2 1 2 2 1 2 1 1 2 2 1
Local Bike Plans
A1 A2 A3 A4 A5 A6 A7 A8 A9 A10 A11 A12 A13 A14 A15 A16 A17 A18 A19 A20 A21
Canning 3 2 3 2
Fremantle 3 2 1 3
Melville 3 2
Rockingham 2 1
Key
3 Strongly meets LUTI criterion
2 Meets LUTI criterion
1 Weakly meets LUTI criterion
0 Neither meets nor works against LUTI criterion
-1 Weakly works against LUTI criterion
-2 Works against LUTI criterion
-3 Strongly works against LUTI criterion
Notable documents in terms of coverage of particular sets of access criteria were:
64
• Fremantle, which covers all Network and Activity function criteria and all except one
traffic management criteria20
• Kwinana, which covers all network criteria and misses only one each for activity
function
;
21
For those local governments that had local planning strategies, local transport strategies and
local bike plans, a comparison of these non-statutory documents was made with the relevant
schemes. The comparison between local planning strategies and local planning schemes is
particularly interesting, as local planning strategies are designed to inform the development
of local planning schemes as well as having a supplementary role in guiding decisions made
through the scheme.
and traffic management. Interestingly, both of the missing criteria refer to
pedestrian amenity.
Table 11 compares local planning strategies and local planning schemes
for those local governments that had them. It is clear from a visual analysis that there is little
correlation in the way that LUTI access criteria are dealt with in planning strategies, and
planning schemes in local governments. Similarly, there is no coherent link between the
schemes and the local transport strategies or the bike plans in terms of their support for access
criteria.
20 A8 Moderate traffic volumes 21 For activity function, A6 High quality pedestrian experience and for traffic management, A11, pedestrian priority
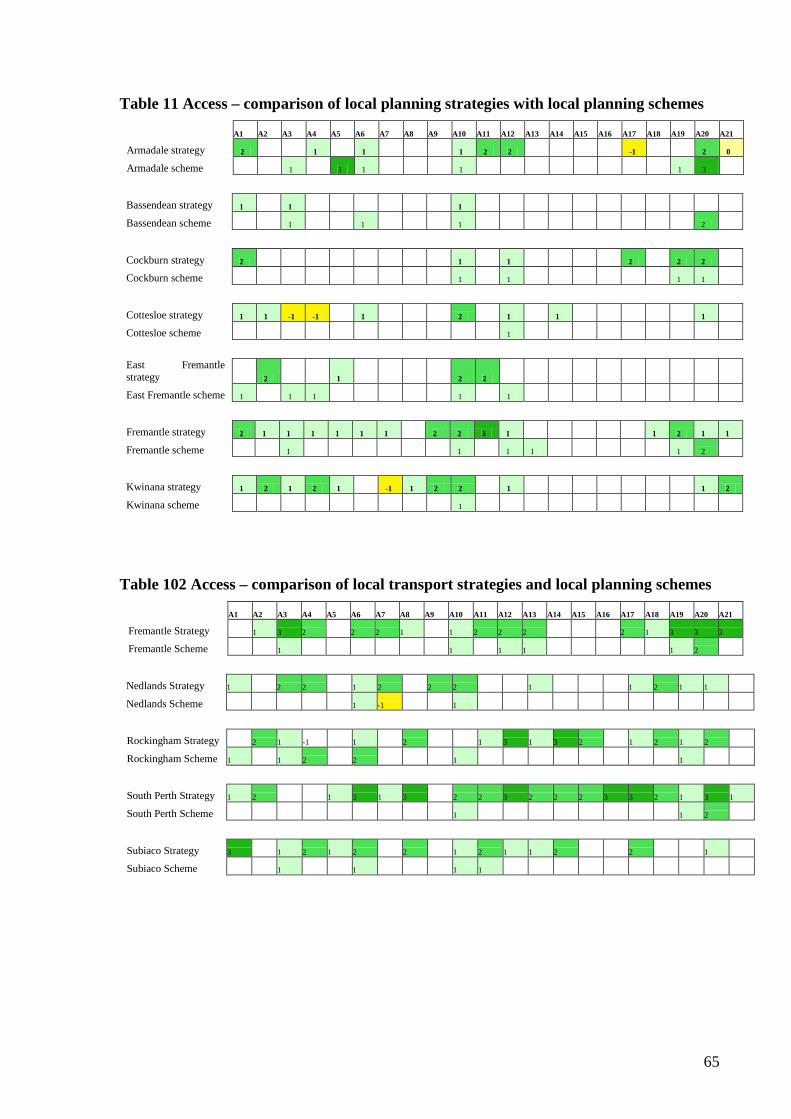
65
Table 11 Access – comparison of local planning strategies with local planning schemes
A1 A2 A3 A4 A5 A6 A7 A8 A9 A10 A11 A12 A13 A14 A15 A16 A17 A18 A19 A20 A21
Armadale strategy 2 1 1 1 2 2 -1 2 0
Armadale scheme 1 3 1 1 1 3
Bassendean strategy 1 1 1
Bassendean scheme 1 1 1 2
Cockburn strategy 2 1 1 2 2 2
Cockburn scheme 1 1 1 1
Cottesloe strategy 1 1 -1 -1 1 2 1 1 1
Cottesloe scheme 1
East Fremantle strategy 2 1 2 2
East Fremantle scheme 1 1 1 1 1
Fremantle strategy 2 1 1 1 1 1 1 2 2 3 1 1 2 1 1
Fremantle scheme 1 1 1 1 1 2
Kwinana strategy 1 2 1 2 1 -1 1 2 2 1 1 2
Kwinana scheme 1
Table 102 Access – comparison of local transport strategies and local planning schemes
A1 A2 A3 A4 A5 A6 A7 A8 A9 A10 A11 A12 A13 A14 A15 A16 A17 A18 A19 A20 A21
Fremantle Strategy 1 3 2 2 2 1 1 2 2 2 2 1 3 3 3
Fremantle Scheme 1 1 1 1 1 2
Nedlands Strategy 1 2 2 1 2 2 2 1 1 2 1 1
Nedlands Scheme 1 -1 1
Rockingham Strategy 2 1 -1 1 2 1 3 1 3 2 1 2 1 2
Rockingham Scheme 1 1 2 2 1 1
South Perth Strategy 1 2 1 3 1 3 2 2 3 2 2 2 3 3 2 1 3 1
South Perth Scheme 1 1 2
Subiaco Strategy 3 1 2 1 2 2 1 2 1 1 2 2 1
Subiaco Scheme 1 1 1 1

66
Table 13 Access – Comparison of local bike plans and planning schemes A1 A2 A3 A4 A5 A6 A7 A8 A9 A10 A11 A12 A13 A14 A15 A16 A17 A18 A19 A20 A21
Canning Plan 3 2 3 2
Canning Scheme 2 3 2
Fremantle Plan 3 2 1 3
Fremantle Scheme 1 1 1 1 1 2
Melville Plan 3 2
Melville Scheme 3 1 3
Rockingham Plan 2 1
Rockingham Scheme 1 1 2 2 1 1
There are a few different ways to view these findings. Perhaps as the strategy documents are
more likely to be supportive of more LUTI access criteria, through a supplementary role, they
lead to better overall support at the local government level. This is an important consideration
given the limitations in the capacity of local planning schemes to support the LUTI access
criteria. Another interpretation, which is particularly relevant to the analysis across local
planning schemes and local planning strategies, is that there is no real integration between
these documents, particularly in terms of access when perhaps there should be. These
questions need to be followed up with further research. The links between strategies and the
interpretation of schemes, including how development decisions are made is a grey area.
Land Use
It was much easier to trace the LUTI land-use criteria through state and local documents than
it was for the access criteria. Many more are represented across all types of documents. The
links are strongest in:
• Land use configuration;
o LU1 - land use configuration, land use integrated with integrated transport;
o LU2 a robust urban form – can adjust to changes in demand for transport and
land use

67
• Density/intensity, LU9 - density/intensity, highest residential density in close
proximity to activities.
These criteria are present in 3 or more of the state statutory documents, 3 or more of the state
and non-statutory documents, and positively supported by more than half of the local
planning schemes. When compared, state government documents and local non-statutory
documents are more likely to be strongly supportive, or supportive, of land use criteria and
less likely to have policy statements that work against them, or have a mix of supportive and
unsupportive statements. Local planning schemes are less supportive of the LUTI land use
criteria – they tend to cover less breadth, and are more frequently only weakly supportive.
There are clear strengths and weaknesses in both state and local government documents. In
particular, the local government schemes are far more likely to cover parking criteria than the
state government documents.
Of 18 land use criteria there are only three that cannot be traced through state statutory and
non statutory documents and at least some local planning schemes. In the sub category of
land use configuration, LU5 - land use configuration, high pedestrian trip generating uses at
ground floor, housing above in close proximity of transit stop is not present at all in state
documents, but supported by 7 local planning schemes. LU7 - active ground floor uses for
surveillance receives support in state statutory and non-statutory documents, but the
Wanneroo local planning scheme was the only scheme supportive of this criterion. In the sub
category of parking, LU 15, car parking behind buildings not fronting street, LU16, Street
Parking and LU18 Car-based retailing (drive-thru’) and light industry located on periphery of
town with good car access were only supported at the state level in statutory documents, but
received support in three and seven and sixteen local planning schemes respectively.

68
Overall far fewer complete gaps in coverage through from state to local level can be
identified in land use compared to access criteria. What is interesting about this, particularly
in the local planning schemes, is to consider why some LUTI criteria, that are represented at
the state level; such as LU 10, density/intensity, medium to high residential densities; flow
through to many local government planning schemes, and others, such as LU 12, proximity,
more intensive/high-medium density office, retail and other commercial uses within walking
distance of transport facilities, to only a few.
State Government Documents
The criteria that most commonly receive a positive mention in state documents overall are:
• LU1, Land Use Configuration, Land Use integrated with Integrated transport
• LU3, Land Use Configuration, A robust urban form – Can adjust to changes in
demand for transport and land use.
• LU9, Density/Intensity, Highest residential density in close proximity to activities
(but ensure includes family housing types); and
• LU11, Proximity, Compact cluster of related (compatible) activities (highly visited) in
close proximity (walking distance), clustered around rail station/high frequency bus
stop (see Table 15).
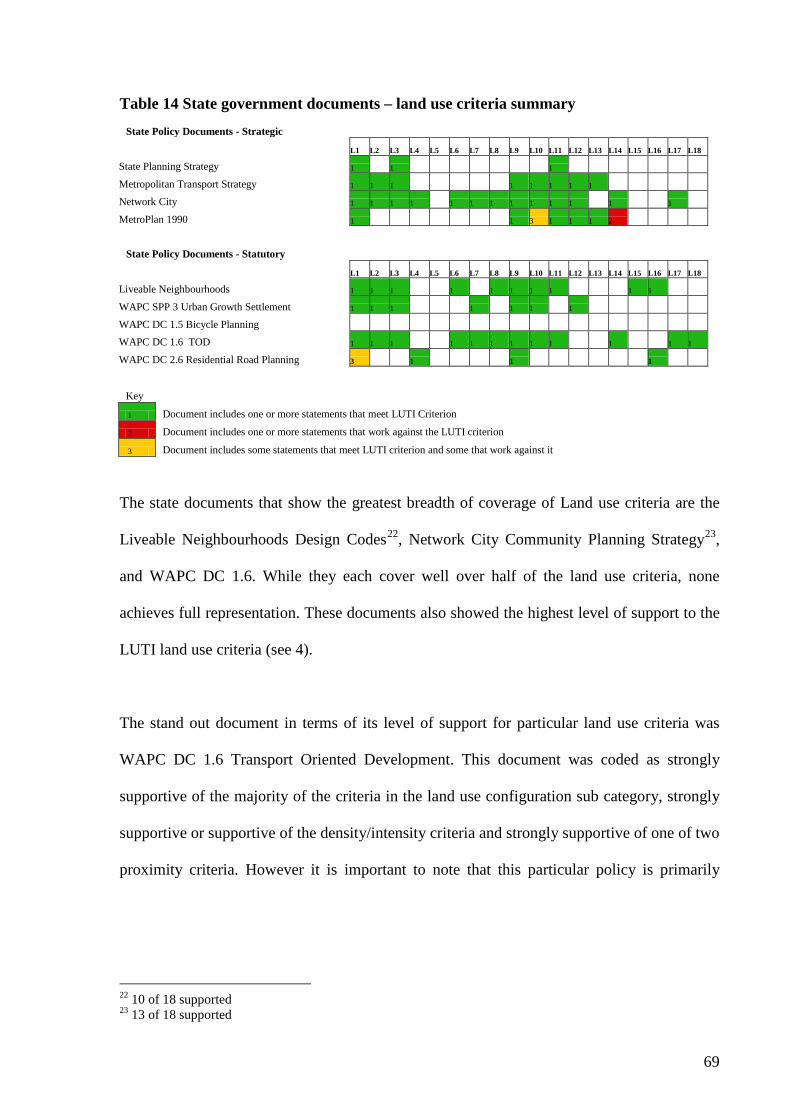
69
Table 14 State government documents – land use criteria summary State Policy Documents - Strategic
L1 L2 L3 L4 L5 L6 L7 L8 L9 L10 L11 L12 L13 L14 L15 L16 L17 L18
State Planning Strategy 1 1 1
Metropolitan Transport Strategy 1 1 1 1 1 1 1 1
Network City 1 1 1 1 1 1 1 1 1 1 1 1 1
MetroPlan 1990 1 1 3 1 1 1 2
State Policy Documents - Statutory
L1 L2 L3 L4 L5 L6 L7 L8 L9 L10 L11 L12 L13 L14 L15 L16 L17 L18
Liveable Neighbourhoods 1 1 1 1 1 1 1 1 1 1
WAPC SPP 3 Urban Growth Settlement 1 1 1 1 1 1 1
WAPC DC 1.5 Bicycle Planning
WAPC DC 1.6 TOD 1 1 1 1 1 1 1 1 1 1 1 1
WAPC DC 2.6 Residential Road Planning 3 1 1 1
Key
1 Document includes one or more statements that meet LUTI Criterion
2 Document includes one or more statements that work against the LUTI criterion
3 Document includes some statements that meet LUTI criterion and some that work against it
The state documents that show the greatest breadth of coverage of Land use criteria are the
Liveable Neighbourhoods Design Codes22, Network City Community Planning Strategy23
,
and WAPC DC 1.6. While they each cover well over half of the land use criteria, none
achieves full representation. These documents also showed the highest level of support to the
LUTI land use criteria (see 4).
The stand out document in terms of its level of support for particular land use criteria was
WAPC DC 1.6 Transport Oriented Development. This document was coded as strongly
supportive of the majority of the criteria in the land use configuration sub category, strongly
supportive or supportive of the density/intensity criteria and strongly supportive of one of two
proximity criteria. However it is important to note that this particular policy is primarily
22 10 of 18 supported 23 13 of 18 supported
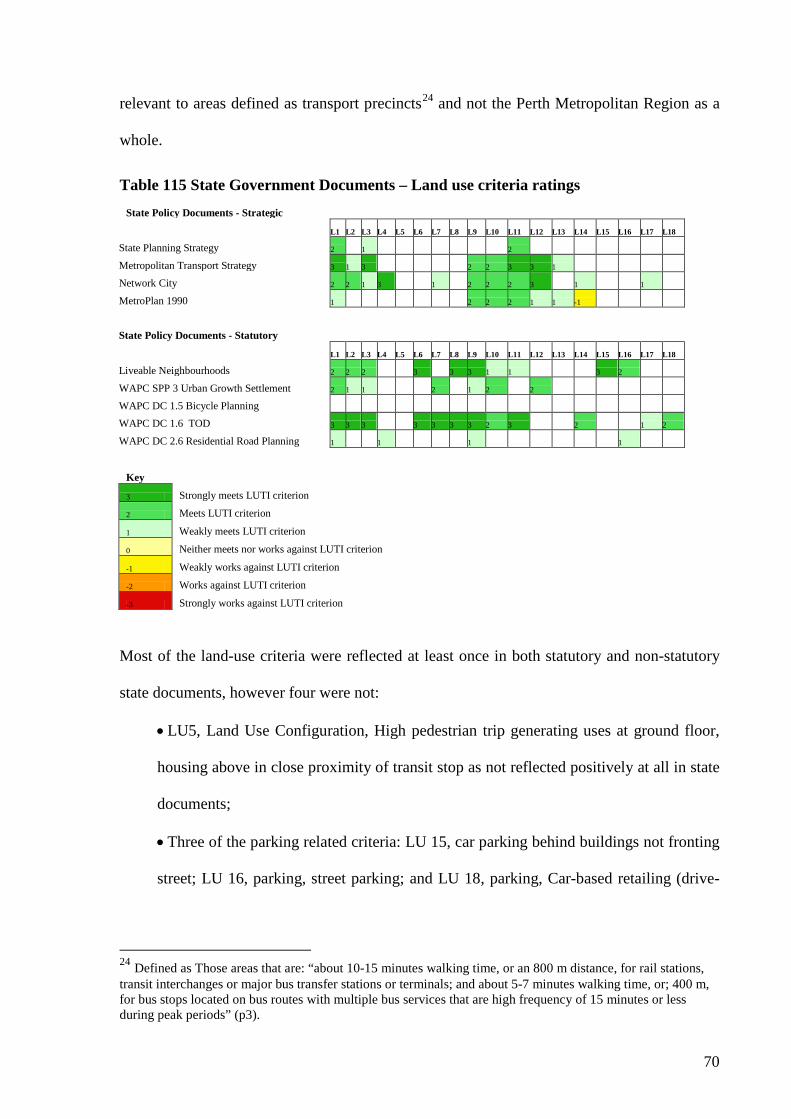
70
relevant to areas defined as transport precincts24
Table 115 State Government Documents – Land use criteria ratings
and not the Perth Metropolitan Region as a
whole.
State Policy Documents - Strategic L1 L2 L3 L4 L5 L6 L7 L8 L9 L10 L11 L12 L13 L14 L15 L16 L17 L18
State Planning Strategy 2 1 2
Metropolitan Transport Strategy 3 1 3 2 2 3 3 1
Network City 2 2 1 3 1 2 2 2 3 1 1
MetroPlan 1990 1 2 2 2 1 1 -1
State Policy Documents - Statutory
L1 L2 L3 L4 L5 L6 L7 L8 L9 L10 L11 L12 L13 L14 L15 L16 L17 L18
Liveable Neighbourhoods 2 2 2 3 3 3 1 1 3 2
WAPC SPP 3 Urban Growth Settlement 2 1 1 2 1 2 2
WAPC DC 1.5 Bicycle Planning
WAPC DC 1.6 TOD 3 3 3 3 3 3 3 2 3 2 1 2
WAPC DC 2.6 Residential Road Planning 1 1 1 1
Key
3 Strongly meets LUTI criterion
2 Meets LUTI criterion
1 Weakly meets LUTI criterion
0 Neither meets nor works against LUTI criterion
-1 Weakly works against LUTI criterion
-2 Works against LUTI criterion
-3 Strongly works against LUTI criterion
Most of the land-use criteria were reflected at least once in both statutory and non-statutory
state documents, however four were not:
• LU5, Land Use Configuration, High pedestrian trip generating uses at ground floor,
housing above in close proximity of transit stop as not reflected positively at all in state
documents;
• Three of the parking related criteria: LU 15, car parking behind buildings not fronting
street; LU 16, parking, street parking; and LU 18, parking, Car-based retailing (drive-
24 Defined as Those areas that are: “about 10-15 minutes walking time, or an 800 m distance, for rail stations, transit interchanges or major bus transfer stations or terminals; and about 5-7 minutes walking time, or; 400 m, for bus stops located on bus routes with multiple bus services that are high frequency of 15 minutes or less during peak periods” (p3).

71
thru’) and light industry located on periphery of town with good car access were only
mentioned positively in statutory documents.
There are there two notable areas where there is comparatively lower coverage of the LUTI
criteria at the state level. These are: between LU4 and 825, which focus on some of the more
specific details of relationship between activities in buildings, and between buildings and the
street; and LU14-1826
, which relate to parking. Metroplan was the only document where
content analysis revealed policy statements that would work against any of the LUTI criteria,
with the highest coding for LU14, parking provided in shared structures rather than on
individual sites showing that the policy weakly works against this.
Local Government Documents
Overall, there is much diversity in how local government documents cover the LUTI land use
criteria. Whilst the breadth of coverage of criteria in the local planning schemes is better than
for the access criteria, coverage is inconsistent between local governments. The local
planning strategies were more consistent in terms of coverage, and showed higher support
ratings. Both schemes and planning strategies show a gap around LU5 to LU8, in the
subcategory of land use configuration. These are specific criteria relating to the relationship
between buildings and the street27
Table 17
. Local transport strategies and to an even greater extent,
local bicycle plans showed minimal coverage of the land use criteria (see ).
25 LU4, Greater diversity, vibrant mix of land uses and within buildings, LU5, High pedestrian trip generating uses at ground floor, housing above in close proximity of transit stop; LU6, Buildings oriented to station/streets/paths; LU7, Active ground floor uses for surveillance;, LU8, Frontage development – human scale. 26 LU14, parking provided in shared structures rather than on individual sites; LU15 car parking behind buildings not fronting street, LU16 Street parking, LU17, short-term parking but limited commuter parking; LU18 Car-based retailing (drive-thru’) and light industry located on periphery of town with good car access. 27 LU 5 High pedestrian trip generating uses at ground floor, housing above in close proximity of transit stop, LU6 Active ground floor uses for surveillance, LU7 Active ground floor uses for surveillance, LU 8 frontage development – human scale.
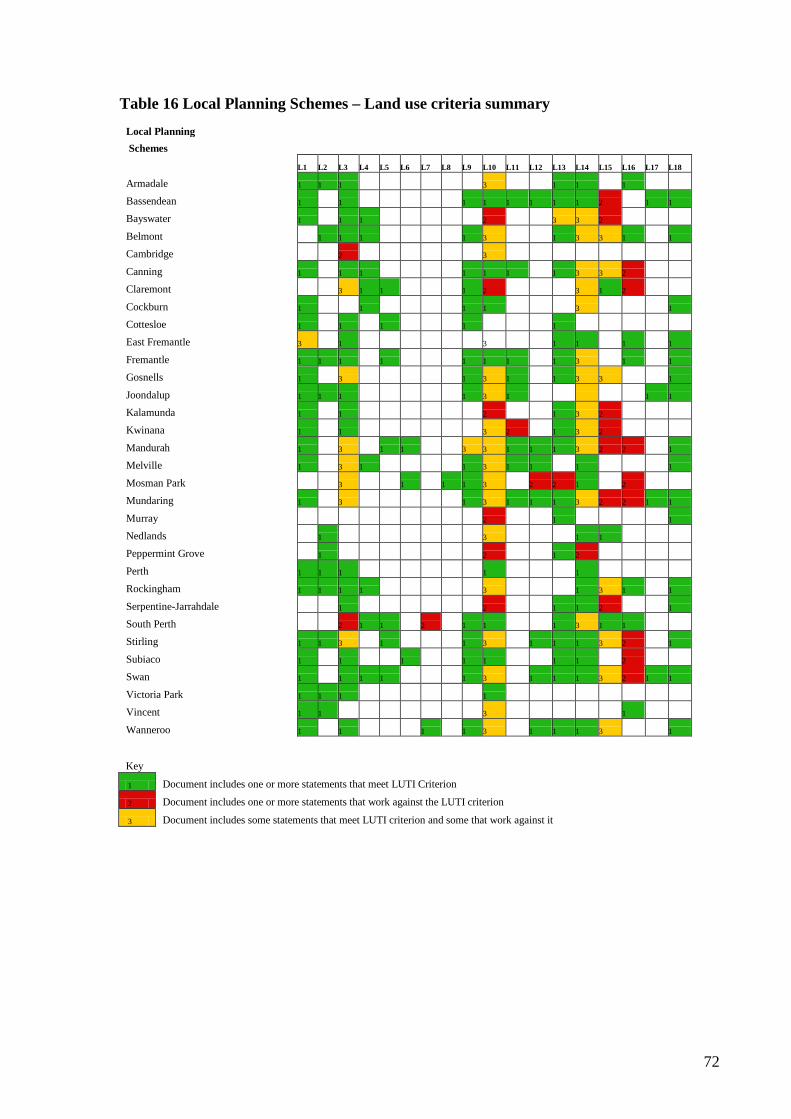
72
Table 16 Local Planning Schemes – Land use criteria summary Local Planning Schemes L1 L2 L3 L4 L5 L6 L7 L8 L9 L10 L11 L12 L13 L14 L15 L16 L17 L18
Armadale 1 1 1 3 1 1 1
Bassendean 1 1 1 1 1 1 1 1 2 1 1
Bayswater 1 1 1 2 3 3 2
Belmont 1 1 1 1 3 1 3 3 1 1
Cambridge 2 3
Canning 1 1 1 1 1 1 1 3 3 2
Claremont 3 1 1 1 2 3 1 2
Cockburn 1 1 1 1 3 1
Cottesloe 1 1 1 1 1
East Fremantle 3 1 3 1 1 1 1
Fremantle 1 1 1 1 1 1 1 1 3 1 1
Gosnells 1 3 1 3 1 1 3 3 1
Joondalup 1 1 1 1 3 1 1 1
Kalamunda 1 1 2 1 3 2
Kwinana 1 1 3 2 1 3 2
Mandurah 1 3 1 1 3 3 1 1 1 3 2 2 1
Melville 1 3 1 1 3 1 1 1 1
Mosman Park 3 1 1 1 3 2 2 1 2
Mundaring 1 3 1 3 1 1 1 3 2 2 1 1
Murray 2 1 1
Nedlands 1 3 1 1
Peppermint Grove 1 2 1 2
Perth 1 1 1 1 1
Rockingham 1 1 1 1 3 1 3 1 1
Serpentine-Jarrahdale 1 2 1 1 2 1
South Perth 2 1 1 2 1 1 1 3 1 1
Stirling 1 1 3 1 1 3 1 1 1 3 2 1
Subiaco 1 1 1 1 1 1 1 2
Swan 1 1 1 1 1 3 1 1 1 3 2 1 1
Victoria Park 1 1 1 1
Vincent 1 1 3 1
Wanneroo 1 1 1 1 3 1 1 1 3 1
Key
1 Document includes one or more statements that meet LUTI Criterion
2 Document includes one or more statements that work against the LUTI criterion
3 Document includes some statements that meet LUTI criterion and some that work against it
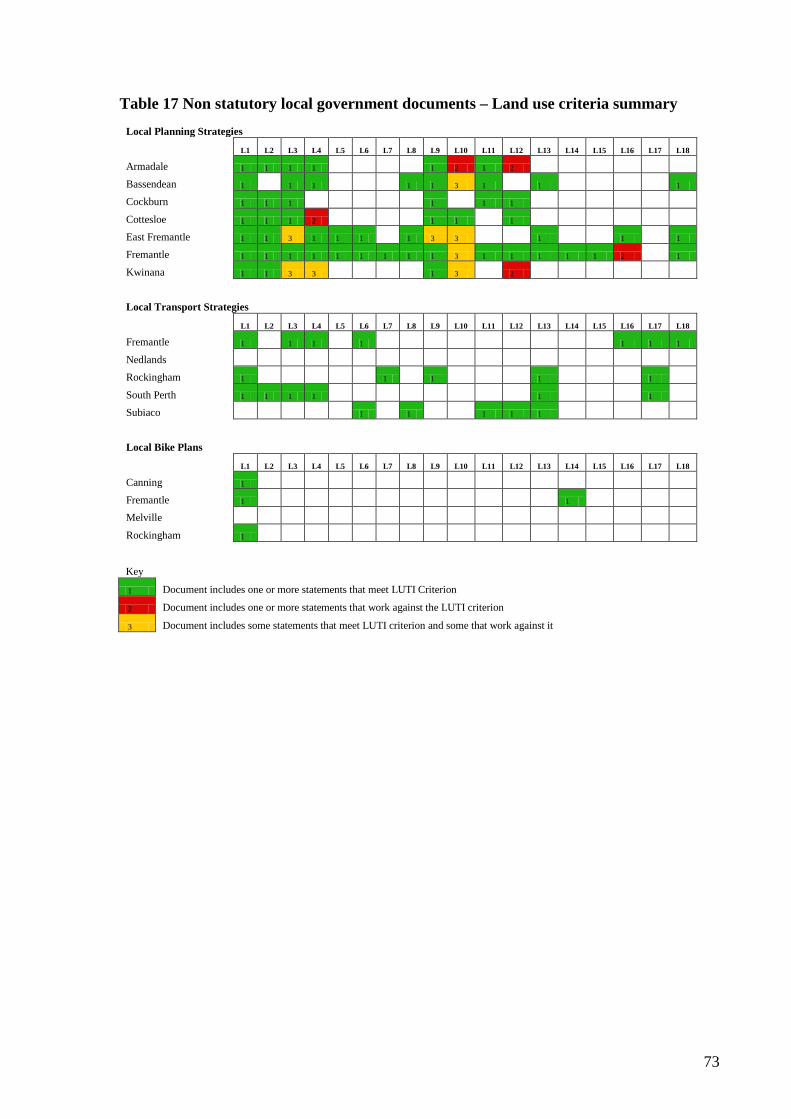
73
Table 17 Non statutory local government documents – Land use criteria summary Local Planning Strategies L1 L2 L3 L4 L5 L6 L7 L8 L9 L10 L11 L12 L13 L14 L15 L16 L17 L18
Armadale 1 1 1 1 1 2 1 2
Bassendean 1 1 1 1 1 3 1 1 1
Cockburn 1 1 1 1 1 1
Cottesloe 1 1 1 2 1 1 1
East Fremantle 1 1 3 1 1 1 1 3 3 1 1 1
Fremantle 1 1 1 1 1 1 1 1 1 3 1 1 1 1 1 2 1
Kwinana 1 1 3 3 1 3 2
Local Transport Strategies
L1 L2 L3 L4 L5 L6 L7 L8 L9 L10 L11 L12 L13 L14 L15 L16 L17 L18
Fremantle 1 1 1 1 1 1 1
Nedlands
Rockingham 1 1 1 1 1
South Perth 1 1 1 1 1 1
Subiaco 1 1 1 1 1
Local Bike Plans
L1 L2 L3 L4 L5 L6 L7 L8 L9 L10 L11 L12 L13 L14 L15 L16 L17 L18
Canning 1
Fremantle 1 1
Melville
Rockingham 1
Key
1 Document includes one or more statements that meet LUTI Criterion
2 Document includes one or more statements that work against the LUTI criterion
3 Document includes some statements that meet LUTI criterion and some that work against it

74
Local Planning Schemes
The LUTI Land use criteria that are most commonly supported in the local planning schemes
are:
• Land Use Configuration, LU1 Land use integrated with integrated transport 28 and
LU3 Greater diversity, vibrant mix of land uses within precincts; 29
• Density/intensity, LU 9 Highest residential density in close proximity to activities
(but ensure includes family housing types)
30
• Parking, LU13 car parking areas managed so pedestrian access, amenity and safety
not compromised
; and
31; and LU 18, Car-based retailing (drive-thru’) and light industry
located on periphery of town with good car access32
.
A significant difference between the state government documents and local planning schemes
is that the local documents pay more attention to parking, albeit not always in a supportive
way. For example, many of the local schemes are unsupportive of, or include measures that
support as well as measures that work against LU15, car parking behind buildings not
fronting street33 and LU16, Street Parking.34 Two of the parking criteria, LU 1335
car
parking areas managed so pedestrian access, amenity and safety not compromise and LU 18
Car-based retailing (drive-thru’) and light industry located on periphery of town with good
car access are broadly supported across many local planning schemes, and generally received
higher levels of support (see Table 16).
28 22 of 32 local planning schemes 29 18 of 32 local planning schemes 30 17 of 32 local planning schemes 31 20 of 32 local planning schemes 32 16 of 32 local planning schemes 33 3 schemes are supportive, 7 show a mix of supportive and unsupportive measures, and 7 are unsupportive 34 7 supportive, 8 unsupportive 35 20 of 32 local planning schemes

75
Similar gaps are present in the Local planning schemes to those identified in the state
documents. In the sub category of land use configuration, LU6-836, which focus on the
specifics of building orientation and activity in relation to the street, and LU 16-1737
Table 17
, which
are parking related criteria, are less well reflected in the local planning schemes than other
LUTI land use criteria. All the LUTI Land use criteria are positively mentioned in at least one
local planning scheme. Local planning schemes overall cover the parking related criteria
better than state government documents. The Cities of Swan, Fremantle and Bassendean
cover the most LUTI Land Use Criteria, (10 of 18 criteria, see ). South Perth local
planning scheme stands out in its coverage of parking; with positive support to 4 of 6 parking
criteria (see Table 17)
36 LU6, Buildings oriented to station/streets/paths; LU7, Active ground floor uses for surveillance;, LU8, Frontage development – human scale. 37 LU16 Street parking, LU17, short-term parking but limited commuter parking.

76
Table 18 Local Planning Schemes – Land use ratings Local Planning Schemes
L1 L2 L3 L4 L5 L6 L7 L8 L9 L10 L11 L12 L13 L14 L15 L16 L17 L18
Armadale 1 1 1 2 1 3 3
Bassendean 1 1 1 1 2 1 2 3 -2 1 2
Bayswater 2 3 3 -2 2 2 -3
Belmont 2 3 3 3 3 3 2 0 2 3
Cambridge -1 2
Canning 1 2 2 2 1 2 1 3 -3 -3
Claremont 2 3 2 3 -3 2 2 -2
Cockburn 1 1 3 1 2 1
Cottesloe 1 1 1 1 1
East Fremantle 1 3 2 1 2 3 3
Fremantle 2 1 1 2 1 2 1 3 3 3 1
Gosnells 1 1 1 1 1 2 1 3 1
Joondalup 1 1 1 1 1 1 1 1
Kalamunda 1 1 -1 2 2 -3
Kwinana 2 2 1 2 1 2 -1
Mandurah 1 1 2 2 1 1 1 1 2 3 -1 -1 1
Melville 1 3 2 1 2 2 1 2 1
Mosman Park 2 1 1 3 2 -1 -1 2 -1
Mundaring 1 1 1 1 1 1 1 2 -2 -1 2 1
Murray -1 1 1
Nedlands 1 1 2 1
Peppermint Grove 1 -3 1 -2
Perth 1 1 1 2 2
Rockingham 1 1 1 2 1 3 2 2 1
Serpentine-Jarrahdale 3 -1 2 3 -2 1
South Perth -1 2 2 -1 1 2 2 2 2 1
Stirling 1 1 2 2 3 3 1 1 3 1 -3 1
Subiaco 1 1 1 1 2 1 3 -1
Swan 1 1 1 2 1 2 1 1 3 1 -1 1 3
Victoria Park 1 1 1 2
Vincent 1 1 3 1
Wanneroo 1 1 1 1 1 3 1 2 1 1
Key
3 Strongly meets LUTI criterion
2 Meets LUTI criterion
1 Weakly meets LUTI criterion
0 Neither meets nor works against LUTI criterion
-1 Weakly works against LUTI criterion
-2 Works against LUTI criterion
-3 Strongly works against LUTI criterion
Where local planning schemes are supportive of land use criteria, they are most likely to be
only weakly supportive of them. In addition to the two parking criteria discussed above, LU
13 and LU 14, schemes were most likely to be supportive, or strongly supportive of LU 10,

77
Density/intensity, medium to high residential densities. Although there were only nine
schemes that were supportive of LU 4, land use configuration, greater diversity, vibrant mix
of land uses within buildings, 7 of these 9 were either supportive or strongly supportive.
Also, particular schemes, including Belmont, Bayswater and Claremont were more likely, in
general, to be supportive of strongly supportive of criteria where they were coded than others.
The content analysis of local planning schemes clearly reflects diversity in local planning
schemes in terms of their support for the LUTI land use criteria. There is no clear framework
of trend by which LUTI criteria are incorporated, yet all the criteria are covered in at least a
few schemes, suggesting that they can all be supported by local planning schemes, even
though in practice they are not.
Non statutory local government documents
The local planning strategies that were analysed had more consistent and broader coverage of
the LUTI Land Use criteria than the Local planning schemes. Overall, there are three areas of
strength in these strategies: Land use configuration: (LU1-4 but not 5-8)38, density/intensity39
and Proximity40
38 That is, LU1, Land use integrated with integrated transport: LU2, A robust urban form – Can adjust to changes in demand for transport and land use: LU3 Greater diversity, vibrant mix of land uses within precincts, LU4, Greater diversity, vibrant mix of land uses and within buildings
. Like the state government documents and, gaps were present in LUTI Land
use configuration criteria (LU5-8) that focus on the specifics of building orientation and
activity in relation to the street, and in parking (LU14-17) (see Table 19). Overall, the local
planning strategies have more in common with the state government non statutory documents
than they do with the local planning schemes.
39 LU9, Highest residential density in close proximity to activities (but ensure includes family housing types); LU10, Medium to high residential densities. 40 LU11, Compact cluster of related (compatible) activities (highly visited) in close proximity (walking distance), clustered around rail station/high frequency bus stop; LU12 More intensive/ high-medium density office, retail and other commercial uses (measured by high worker densities) within walking distance of transport facilities.
78
In terms of its representation of LUTI land use criteria, the Fremantle local planning strategy
is a stand out, with a positive mention for sixteen of the eighteen land use criteria. The cities
of Cockburn and Armadale positively mention all LUTI Density/ Intensity and Proximity
criteria in their local planning strategies. The local planning schemes are also more consistent
in reflecting support or strong support for particular criteria and less likely to be weakly
supportive, or unsupportive of them.
Local transport strategies and local bike plans were comparatively weak in representing LUTI
Land use criteria. An exception is that most reference LU1, Land use integrated with
integrated transport.

79
Table 1912 Non statutory local government documents – Land use ratings Local Planning Strategies L1 L2 L3 L4 L5 L6 L7 L8 L9 L10 L11 L12 L13 L14 L15 L16 L17 L18
Armadale 3 1 2 1 2 -1 2 -1
Bassendean 2 2 1 1 1 2 1 2 2
Cockburn 2 1 2 2 2 2
Cottesloe 1 2 1 -1 2 3 1
East Fremantle 3 1 2 2 2 1 2 2 2 2 2 1
Fremantle 1 1 2 2 2 2 2 1 2 2 2 1 2 3 2 -1 1
Kwinana 1 2 1 2 2 2 0
Local Transport Strategies
L1 L2 L3 L4 L5 L6 L7 L8 L9 L10 L11 L12 L13 L14 L15 L16 L17 L18
Fremantle 2 1 1 1 1 2 1
Nedlands
Rockingham 2 1 1 1 2
South Perth 3 2 1 1 2 2
Subiaco 1 2 2 1 2
Local Bike Plans
L1 L2 L3 L4 L5 L6 L7 L8 L9 L10 L11 L12 L13 L14 L15 L16 L17 L18
Canning 3
Fremantle 2 3
Melville
Rockingham 1
Key
3 Strongly meets LUTI criterion
2 Meets LUTI criterion
1 Weakly meets LUTI criterion
0 Neither meets nor works against LUTI criterion
-1 Weakly works against LUTI criterion
-2 Works against LUTI criterion
-3 Strongly works against LUTI criterion
For those local governments that had local planning strategies, a comparison of these non-
statutory documents was made with the relevant schemes. Given that it has already been
established that local transport strategies and local bike plans show minimal coverage of
LUTI land use criteria, these have not been included here. The comparison between local
planning strategies and local planning schemes is particularly interesting, as local planning
strategies are designed to inform the development of local planning schemes. Table 12
compares local planning strategies and local planning schemes for those local governments
that had them in terms of their representation of LUTI land use criteria.

80
Table 20 Land Use – Comparison of local planning strategies with local planning schemes L1 L2 L3 L4 L5 L6 L7 L8 L9 L10 L11 L12 L13 L14 L15 L16 L17 L18
Armadale Strategy 3 1 2 1 2 -1 2 -1
Armadale Scheme 1 1 1 2 1 3 3
Bassendean Strategy 2 2 1 1 1 2 1 2 2
Bassendean Scheme 1 1 1 1 2 1 2 3 -2 1 2
Cockburn Strategy 2 1 2 2 2 2
Cockburn Scheme 1 1 3 1 2 1
Cottesloe Strategy 1 2 1 -1 2 3 1
Cottesloe Scheme 1 1 1 1 1
East Fremantle Strategy 3 1 2 2 2 1 2 2 2 2 2 1
East Fremantle Scheme 1 3 2 1 2 3 3
Fremantle Strategy 1 1 2 2 2 2 2 1 2 2 2 1 2 3 2 -1 1
Fremantle Scheme 2 1 1 2 1 2 1 3 3 3 1
Kwinana Strategy 1 2 1 2 2 2 0
Kwinana Scheme 2 2 1 2 1 2 -1
Key
3 Strongly meets LUTI criterion
2 Meets LUTI criterion
1 Weakly meets LUTI criterion
0 Neither meets nor works against LUTI criterion
-1 Weakly works against LUTI criterion
-2 Works against LUTI criterion
-3 Strongly works against LUTI criterion
Like the comparison made between the local planning schemes and the local transport
strategies, planning strategies and bike plans for access, there is no clear correlation between
local planning strategies, and local planning schemes in individual local government in terms
of how they represent the LUTI land use criteria. A possible exception to this is the
Fremantle local planning strategy (which represents all but one of the LUTI land use criteria)
and the representation in the local planning scheme, which is also thorough, and correlates
reasonably well with the local planning strategy. This finding is a concern, given the role of
local planning strategies in informing the ongoing development of local planning schemes –
81
however perhaps in the future these links will become more consistent. Alternatively, if local
planning strategies actively inform the application of schemes, and the development decisions
made in them, perhaps the lack of coherent link between the two types of documents is less of
a concern. Again, this is an important are for further research.
People Places Criteria
People places criteria, were covered better in local government documents that state
government documents, as a whole. This is the opposite trend to that reflected in the Access
and Land use content analysis. Only half of the people places criteria could be traced through
state statutory and non statutory documents and local planning schemes. Those that stand out
as having the most thorough overall coverage are:
• Scale and Design: PP2 - respecting existing development (through retention or
sympathetic redevelopment)41; and PP3, respecting existing development (through
retention or sympathetic redevelopment)42
• Amenity: PP6 - High amenity precincts – a place you want to go to – a destination in
its own right
;
43; and PP7 - Community/neighbourly feel – mixed ages – family
friendly44
.
Those that were not covered well through the suite of statutory and non statutory state and
local documents were:
• Scale and Design: PP4 - Diversity of architectural designs; and
41 Covered state statutory and non statutory documents, 31 of 32 local planning schemes, 6 of 7 local planning strategies 42 Covered state statutory and non statutory documents, all local planning schemes, 6 of 7 local planning strategies. 43 Covered state statutory and non statutory documents, 30 of 32 local planning schemes, all local planning strategies, 1 of 5 local transport strategies. 44 Covered state statutory and non statutory documents, 28 of 33 local planning schemes, 6 of 7 local planning strategies
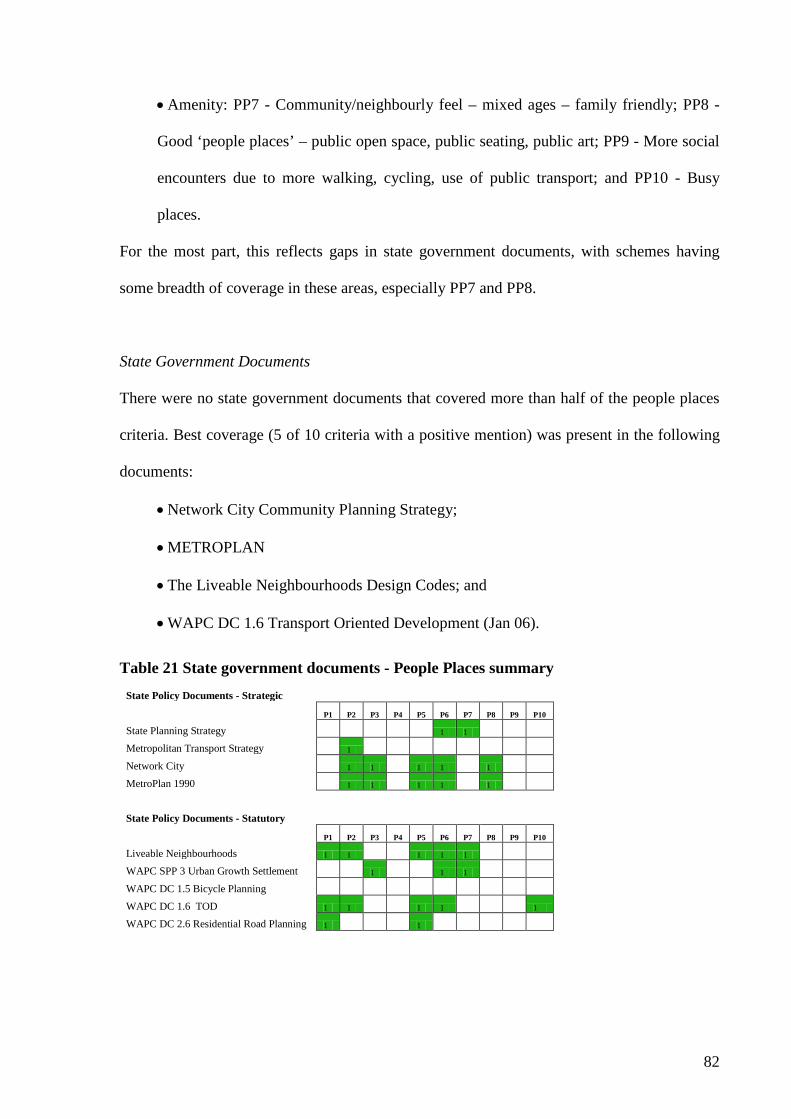
82
• Amenity: PP7 - Community/neighbourly feel – mixed ages – family friendly; PP8 -
Good ‘people places’ – public open space, public seating, public art; PP9 - More social
encounters due to more walking, cycling, use of public transport; and PP10 - Busy
places.
For the most part, this reflects gaps in state government documents, with schemes having
some breadth of coverage in these areas, especially PP7 and PP8.
State Government Documents
There were no state government documents that covered more than half of the people places
criteria. Best coverage (5 of 10 criteria with a positive mention) was present in the following
documents:
• Network City Community Planning Strategy;
• METROPLAN
• The Liveable Neighbourhoods Design Codes; and
• WAPC DC 1.6 Transport Oriented Development (Jan 06).
Table 21 State government documents - People Places summary State Policy Documents - Strategic P1 P2 P3 P4 P5 P6 P7 P8 P9 P10
State Planning Strategy 1 1
Metropolitan Transport Strategy 1
Network City 1 1 1 1 1
MetroPlan 1990 1 1 1 1 1
State Policy Documents - Statutory
P1 P2 P3 P4 P5 P6 P7 P8 P9 P10
Liveable Neighbourhoods 1 1 1 1 1
WAPC SPP 3 Urban Growth Settlement 1 1 1
WAPC DC 1.5 Bicycle Planning
WAPC DC 1.6 TOD 1 1 1 1 1
WAPC DC 2.6 Residential Road Planning 1 1

83
Key
1 Document includes one or more statements that meet LUTI Criterion
2 Document includes one or more statements that work against the LUTI criterion
3 Document includes some statements that meet LUTI criterion and some that work against it
There were 2 criteria for which there was a complete gap at the state level, PP4, Scale and
Design, diversity of architectural styles and PP9 Amenity, more social encounters due to
more walking, cycling, use of public transport. Two criteria were only represented at the state
level in statutory documents. PP1, Scale and Design, human scale – less demand for 70kph
scale advertising, more sense that cars are not the priority mode was reflected across 3 of the
5 statutory documents45. PP10, Amenity, Busy places was only reflected in WAPC DC 1.6,
Transport oriented development46. PP8, amenity, good ‘people places’ – public open space,
public seating, public art was only reflected the two overall Perth Strategic planning
documents, METROPLAN and Network City47
Table 22 State Government Documents – People places ratings
.
State Policy Documents - Strategic P1 P2 P3 P4 P5 P6 P7 P8 P9 P10
State Planning Strategy 2 1
Metropolitan Transport Strategy 1
Network City 1 3 1 2 3 1
MetroPlan 1990 2 3 1 2 2
State Policy Documents - Statutory
P1 P2 P3 P4 P5 P6 P7 P8 P9 P10
Liveable Neighbourhoods 2 2 3 3 2
WAPC SPP 3 Urban Growth Settlement 1 1 1
WAPC DC 1.5 Bicycle Planning
WAPC DC 1.6 TOD 1 3 3 2 1
WAPC DC 2.6 Residential Road Planning 3 1
45 Liveable Neighbourhoods Edition 2 (2000), WAPC DC 1.6, Transport Oriented Development and WAPC DC 2.6 Residential Road planning. 46 PP 9 in WAPC DC 1.5 Bicycle Planning and PP 10 in WAPC DC 1.6 Jan06 TOD 47 Network City Community Planning Strategy and the preceding METROPLAN
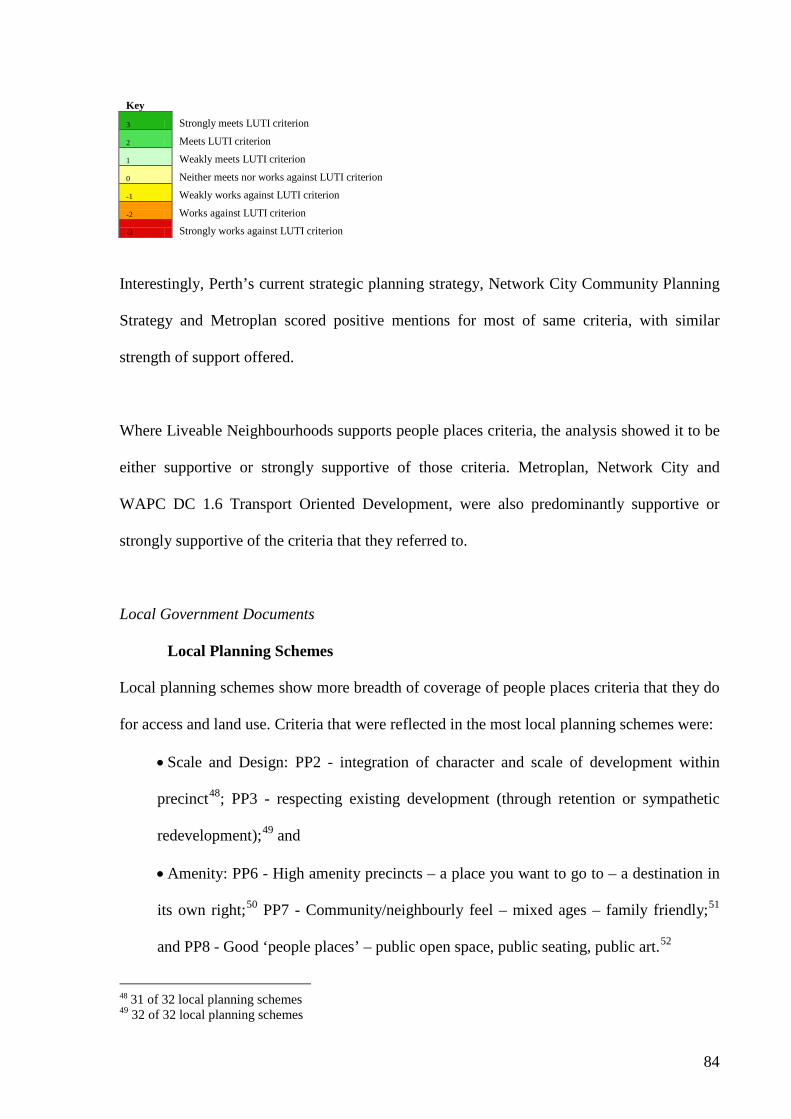
84
Key
3 Strongly meets LUTI criterion
2 Meets LUTI criterion
1 Weakly meets LUTI criterion
0 Neither meets nor works against LUTI criterion
-1 Weakly works against LUTI criterion
-2 Works against LUTI criterion
-3 Strongly works against LUTI criterion
Interestingly, Perth’s current strategic planning strategy, Network City Community Planning
Strategy and Metroplan scored positive mentions for most of same criteria, with similar
strength of support offered.
Where Liveable Neighbourhoods supports people places criteria, the analysis showed it to be
either supportive or strongly supportive of those criteria. Metroplan, Network City and
WAPC DC 1.6 Transport Oriented Development, were also predominantly supportive or
strongly supportive of the criteria that they referred to.
Local Government Documents
Local Planning Schemes
Local planning schemes show more breadth of coverage of people places criteria that they do
for access and land use. Criteria that were reflected in the most local planning schemes were:
• Scale and Design: PP2 - integration of character and scale of development within
precinct48; PP3 - respecting existing development (through retention or sympathetic
redevelopment);49
• Amenity: PP6 - High amenity precincts – a place you want to go to – a destination in
its own right;
and
50 PP7 - Community/neighbourly feel – mixed ages – family friendly;51
and PP8 - Good ‘people places’ – public open space, public seating, public art.52
48 31 of 32 local planning schemes
49 32 of 32 local planning schemes

85
Within this group, PP3, respecting existing development (through retention or sympathetic
redevelopment is by far the most prominent. Not only was it mentioned supportively in all
local planning schemes, 24 of 32 local government schemes were seen to be strongly
supportive of it. This may be of concern, as it indicates an overemphasis on maintaining the
status quo, which is out of balance with other people places criteria, which receive
comparatively less support. In Particular, there were six local governments that were coded as
unsupportive of PP4, Scale and Design, diversity of architectural styles, compared to 5 that
were supportive of this criterion. This is the only people places criteria where there was a
significant trend of lack of support. Considered together, it could be inferred that the focus on
respect for existing development styles goes along with a lack of support for diversity in
architectural styles, therefore, with this skewed emphasis, perhaps working against LUTI
overall.
50 30 of 32 local planning schemes 51 28 of 32 local planning schemes 52 29 of 32 local planning schemes

86
Table 133 Local planning scheme – People places summary Local Planning
Schemes
P1 P2 P3 P4 P5 P6 P7 P8 P9 P10
Armadale 1 1 1 1 1 1
Bassendean 1 1 1 1 1
Bayswater 1 1 1 1 1
Belmont 1 1 1 1 1 1 1
Cambridge 1 1 1 1 1 1
Canning 1 1 1 2 1 1 1
Claremont 2 1 1 1 1 1 1
Cockburn 1 1 1 1 1
Cottesloe 1 1 1 1 1
East Fremantle 1 1 1 1 1 1
Fremantle 1 1 1 1 1 1
Gosnells 1 1 1 1 1 1
Joondalup 1 1 1
Kalamunda 1 1 2 1 1
Kwinana 1 1 1 1 1
Mandurah 1 3 1 1 1 1 1
Melville 1 1 1 1 1 1 1
Mosman Park 1 1 1 2 3 1
Mundaring 1 1 1 1 1 1 1
Murray 1 1 1 1
Nedlands 1 1 2 1 1 1
Peppermint Grove 1 1 1 1
Perth 1 1 1 1 1
Rockingham 1 1 1 1 1
Serpentine-Jarrahdale 1 1 1 1 1 1
South Perth 1 1 1 1 1 1 1 1
Stirling 1 1 1 1 1 1 1
Subiaco 1 1 1 1 1 1 1
Swan 1 1 1 1 1
Victoria Park 1 1 2 1 1
Vincent 1 1 1 2 1 1 1
Wanneroo 1 1 1 1 1 1
The only complete gap in coverage for the local planning schemes was for PP5, Legible
design – is easily understood for residents and visitors53
53 0 of 32 local planning schemes
. Two criterion were poorly covered:
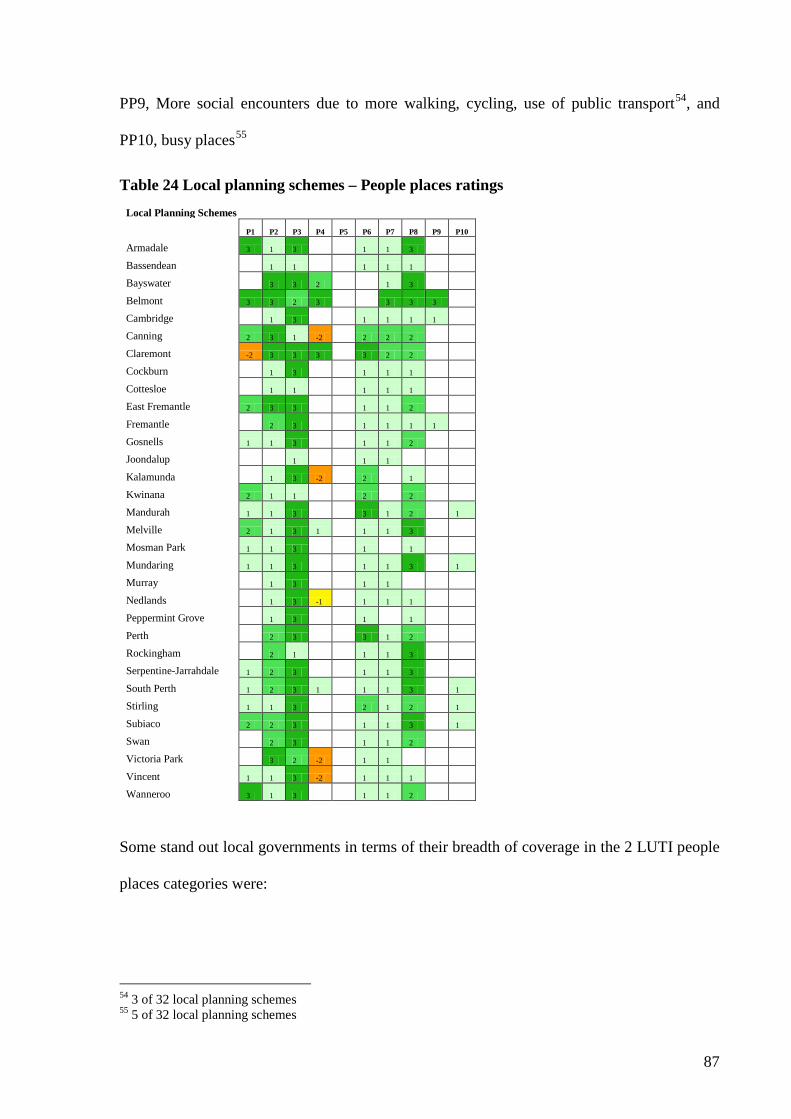
87
PP9, More social encounters due to more walking, cycling, use of public transport54, and
PP10, busy places55
Table 24 Local planning schemes – People places ratings
Local Planning Schemes P1 P2 P3 P4 P5 P6 P7 P8 P9 P10
Armadale 3 1 3 1 1 3
Bassendean 1 1 1 1 1
Bayswater 3 3 2 1 3
Belmont 3 3 2 3 3 3 3
Cambridge 1 3 1 1 1 1
Canning 2 3 1 -2 2 2 2
Claremont -2 3 3 3 3 2 2
Cockburn 1 3 1 1 1
Cottesloe 1 1 1 1 1
East Fremantle 2 3 3 1 1 2
Fremantle 2 3 1 1 1 1
Gosnells 1 1 3 1 1 2
Joondalup 1 1 1
Kalamunda 1 3 -2 2 1
Kwinana 2 1 1 2 2
Mandurah 1 1 3 3 1 2 1
Melville 2 1 3 1 1 1 3
Mosman Park 1 1 3 1 1
Mundaring 1 1 3 1 1 3 1
Murray 1 3 1 1
Nedlands 1 3 -1 1 1 1
Peppermint Grove 1 3 1 1
Perth 2 3 3 1 2
Rockingham 2 1 1 1 3
Serpentine-Jarrahdale 1 2 3 1 1 3
South Perth 1 2 3 1 1 1 3 1
Stirling 1 1 3 2 1 2 1
Subiaco 2 2 3 1 1 3 1
Swan 2 3 1 1 2
Victoria Park 3 2 -2 1 1
Vincent 1 1 3 -2 1 1 1
Wanneroo 3 1 3 1 1 2
Some stand out local governments in terms of their breadth of coverage in the 2 LUTI people
places categories were:
54 3 of 32 local planning schemes 55 5 of 32 local planning schemes
88
• Scale and Design, Melville and Belmont local planning schemes both positively
mentioned all scale and design criteria except PP5, Legible design – is easily
understood for residents and visitors, which was not coded for any LG Scheme.
• Amenity, Cambridge, Fremantle, Mandurah South Perth, Stirling and Subiaco all
positively mentioned 4 of 5 Amenity criteria. Cambridge was also either supportive or
strongly supportive of all the PP criteria that received a positive mention in its local
planning scheme.
There were six local governments that were coded as unsupportive of PP4, Scale and Design,
diversity of architectural styles, compared to 5 that were supportive of this criterion. This is
the only people places criteria where there was a significant trend of lack of support.
Other Local government documents
Like the local planning schemes, there is good overall coverage of people places criteria in
local planning strategies. Similar gaps are also present in Local planning strategies and local
planning schemes. – around PP5, PP9 and PP10 and additionally PP1. The Fremantle local
planning strategy is a stand out, with a positive mention for all of the people places criteria.
There is minimal representation of people places criteria in local transport strategies and bike
plans.

89
Table 25 Non statutory local government – People places ratings
Local Planning Strategies P1 P2 P3 P4 P5 P6 P7 P8 P9 P10
Armadale 1 1 1 1 1 1 1
Bassendean 1 1 1 1 1
Cockburn 1 1
Cottesloe 1 1 1 1 1
East Fremantle 1 1 1 1 1 1
Fremantle 1 1 1 1 1 1 1 1 1 1
Kwinana 1 1 1 1 1
Local Transport Strategies
P1 P2 P3 P4 P5 P6 P7 P8 P9 P10
Fremantle
Nedlands
Rockingham
South Perth 1 1
Subiaco 1
Local Bike Plans
P1 P2 P3 P4 P5 P6 P7 P8 P9 P10
Canning
Fremantle
Melville
Rockingham
For those local governments that had local planning strategies, a comparison of these non-
statutory documents was made with the relevant schemes. Given that it has already been
established that local transport strategies and local bike plans show minimal coverage of
LUTI people places criteria, these have not been included here. The comparison between
local planning strategies and local planning schemes is particularly interesting, as local
planning strategies are designed to inform the development of local planning schemes. Table
26 compares local planning strategies and local planning schemes for those local
governments that had them in terms of their representation of LUTI people places criteria.

90
The correspondence between local planning strategies and local planning schemes in terms of
their support for access and land use criteria was limited. However, the opposite is the case in
several of the local governments for people places. In Armadale, Bassendean and Cottesloe
and Kwinana the coverage of people places criteria is very similar between local planning
strategies and local planning schemes. For the remaining three local governments that had
both types of documents at the time of content analysis (Cockburn, East Fremantle,
Fremantle and Kwinana) there is significant cross over between the schemes and the
strategies. This result suggests support for people places criteria is much more internally
consistent, within these local governments than it is for access and land use.

91
Table 14 People Places – Comparison of Local planning strategies with local planning schemes P1 P2 P3 P4 P5 P6 P7 P8 P9 P10
Armadale Strategy 2 1 1 1 1 2 1
Armadale Scheme 3 1 3 1 1 3
Bassendean Strategy 2 1 2 1 2
Bassendean Scheme 1 1 1 1 1
Cockburn Strategy 1 1
Cockburn Scheme 1 3 1 1 1
Cottesloe Strategy 1 1 1 1 2
Cottesloe Scheme 1 1 1 1 1
East Fremantle Strategy 2 3 1 1 1 -1 2
East Fremantle Scheme 2 3 3 1 1 2
Fremantle Strategy 1 2 1 1 1 2 2 1 1 1
Fremantle Scheme 2 3 1 1 1 1
Kwinana Strategy 2 2 1 1 2
Kwinana Scheme 2 1 1 2 2
Key
3 Strongly meets LUTI criterion
2 Meets LUTI criterion
1 Weakly meets LUTI criterion
0 Neither meets nor works against LUTI criterion
-1 Weakly works against LUTI criterion
-2 Works against LUTI criterion
-3 Strongly works against LUTI criterion
Detailed analysis of local planning schemes against 5 key criteria
A number of additional criteria were examined to see if they were associated with differences
in how local planning schemes reflected LUTI criteria. These were:
• Location (inner, middle, outer)
• Population;
• Number of employees;
• Year in which the local Planning scheme was first drafted; and
• Membership to the sustainable transport coalition.
92
The reflection of LUTI criteria in local planning schemes was diverse, and subject is multiple
variables beyond these additional criteria that are yet to be explored. It is therefore not the
intent of this analysis to make clear or causal inferences from the data in relation to the
additional criteria above. However there are some interesting comments that can be made and
are worthy of further investigation in the course of this research project. The analysis is made
on a visual review of graphs mapping the number of criteria reflective positively, negatively
and ambiguously for each local government planning scheme against the categories above.
These graphs are contained in Appendix 7 to Appendix 9.
Overall, the results of this analysis demonstrate that Local Governments with more
employees, larger populations and more recently drafted planning schemes tend to refer
positively to more of the LUTI land use and access criteria. Perhaps counter-intuitively,
middle and outer local governments tend to refer to more land use and access criteria
positively than inner local governments. Local Governments were generally similar in terms
of there reflection of people places criteria. There was limited inference to be drawn from
membership to the sustainable transport coalition in terms of the number of LUTI criteria that
were positively reflected. However there were also many examples of outliers to this analysis
suggesting that there are several other factors at work in the development local planning
schemes and the relative breadth with which the LUTI criteria are covered.
Location
Overall, middle and outer local governments tend to reflect more of the LUTI access criteria
than inner local government planning schemes. Mandurah, an outer LGA reflects the most
LUTI access criteria, and several inner local governments reflect only one or two of the

93
access criteria. Similarly, the middle and outer local governments more consistently reflect
LUTI land use criteria positively. There are several local governments that are not well
reflected by this overall trend. For example, the inner LGA of Fremantle rates well both in
terms of access and land use criteria. Conversely, the outer LGA of Kwinana rates poorly in
terms of both land use and access criteria (see Figure 5.1 and 5.2). There is little difference in
reflection of the people places criteria by location of local government. (A full set of graphs
for location is contained in Appendix 6).
Figure 5.1
Number of positive, negative and mixed references to LUTI Access Critera (n=21) in Local Planning Schemes by LGA location (inner, middle, outer)
0
1
2
3
4
5
6
7
8
Clarem
ont (I
)Cott
esloe
(I)
East F
reman
tle(I)
Freman
tle(I)
Mosman
Park
(I)Ned
lands
(I)
Peppe
rmint
Grov
e (I)
Perth (
I)Sub
iaco (
I)
Victori
a Park
(I)Vinc
ent (I
)
Basse
ndea
n (M)
Baysw
ater (
M)Belm
ont (M
)
Cambri
dge (
M)Can
ning (
M)
Cockb
urn (M
)Melv
ille (M
)
South
Perth (
M) Stirl
ing (M
)
Armad
ale(O
)Gos
nells
(O)
Joon
dalup
(O)
Kalamun
da (O
)
Kwinana
(O)
Mandu
rah (O
)
Munda
ring (
O)Murr
ay (O
)
Rockin
gham
(O)
Serpen
tine-J
arrah
dale
(O)
Swan (O
)
Wan
neroo
(O)
LGA (I=innter, M=middle, O=outer)
posnegmix
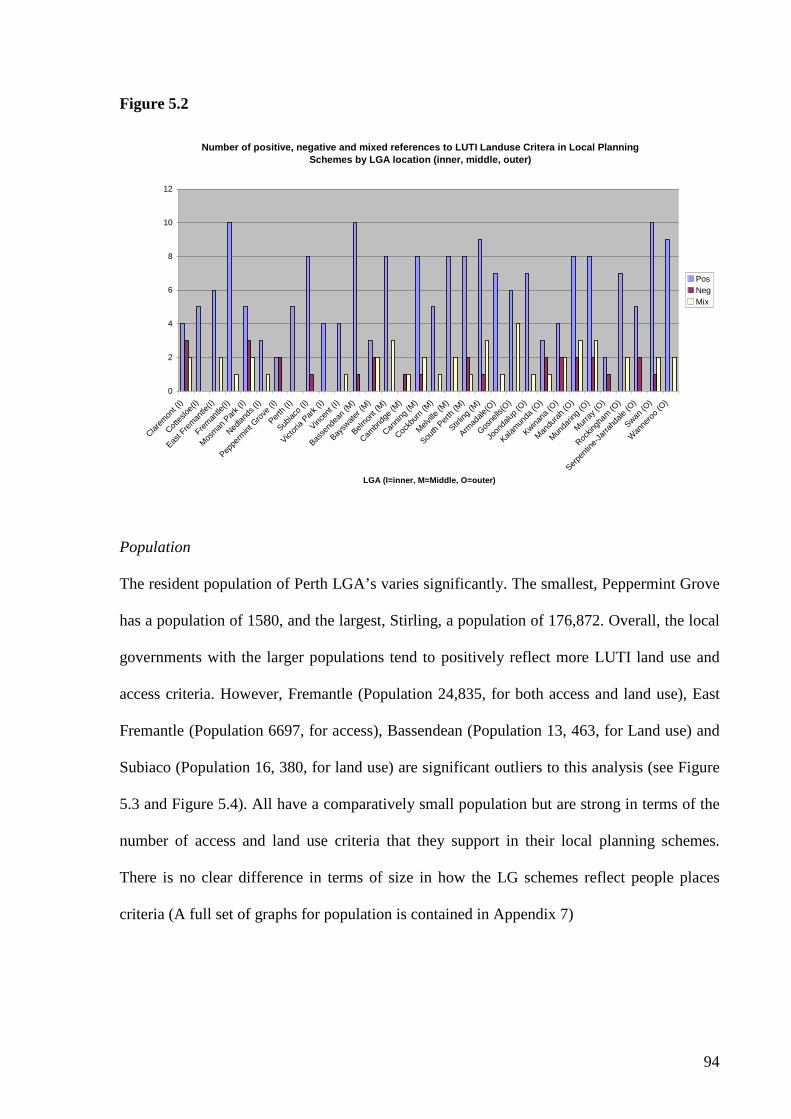
94
Figure 5.2
Number of positive, negative and mixed references to LUTI Landuse Critera in Local Planning Schemes by LGA location (inner, middle, outer)
0
2
4
6
8
10
12
Clarem
ont (I
)
Cottes
loe(I)
East F
reman
tle(I)
Freman
tle(I)
Mosman
Park
(I)
Nedlan
ds (I)
Peppe
rmint
Grov
e (I)
Perth (
I)
Subiac
o (I)
Victori
a Park
(I)
Vincen
t (I)
Basse
ndea
n (M)
Baysw
ater (
M)
Belmon
t (M)
Cambri
dge (
M)
Cannin
g (M)
Cockb
urn (M
)
Melville
(M)
South
Perth (
M)
Stirling
(M)
Armad
ale(O
)
Gosne
lls(O)
Joon
dalup
(O)
Kalamun
da (O
)
Kwinana
(O)
Mandu
rah (O
)
Munda
ring (
O)
Murray
(O)
Rockin
gham
(O)
Serpen
tine-J
arrah
dale
(O)
Swan (O
)
Wan
neroo
(O)
LGA (I=inner, M=Middle, O=outer)
PosNegMix
Population
The resident population of Perth LGA’s varies significantly. The smallest, Peppermint Grove
has a population of 1580, and the largest, Stirling, a population of 176,872. Overall, the local
governments with the larger populations tend to positively reflect more LUTI land use and
access criteria. However, Fremantle (Population 24,835, for both access and land use), East
Fremantle (Population 6697, for access), Bassendean (Population 13, 463, for Land use) and
Subiaco (Population 16, 380, for land use) are significant outliers to this analysis (see Figure
5.3 and Figure 5.4). All have a comparatively small population but are strong in terms of the
number of access and land use criteria that they support in their local planning schemes.
There is no clear difference in terms of size in how the LG schemes reflect people places
criteria (A full set of graphs for population is contained in Appendix 7)

95
Figure 5.3
Number of positve, negative, mixed reference to LUTI access critera by LGA population
0
1
2
3
4
5
6
7
8
Peppe
rmint
Grov
e (15
80)
East F
reman
tle (6
697)
Cottes
loe (7
256)
Mosman
Park
(825
1)
Clarem
ont (8
942)
Perth (
1157
3)
Murray
(119
69)
Serpen
tine-J
arrah
dale
(1288
9)
Basse
ndea
n (13
463)
Subiac
o (16
380)
Nedlan
ds (2
0335
)
Kwinana
(231
98)
Cambri
dge (
2375
3)
Freman
tle (2
4835
)
Vincen
t (268
76)
Victori
a Park
(279
55)
Belmon
t (303
31)
Munda
ring (
3509
7)
South
Perth (
3936
1)
Kalamun
da (4
9534
)
Armad
ale (5
0535
)
Baysw
ater (
5580
1)
Mandu
rah (5
5815
)
Cockb
urn (7
4472
)
Cannin
g (77
305)
Rockin
gham
(843
07)
Gosne
lls (91
579)
Melville
(930
03)
Swan (9
3279
)
Wan
neroo
(110
940)
Joon
dalup
(149
673)
Stirling
(176
872)
LGA (population)
posnegmix
Figure 2.4
Number of positive, negative, mixed reference to LUTI land use criteria by LGA population
0
2
4
6
8
10
12
Peppe
rmint
Grov
e (15
80)
East F
reman
tle (6
697)
Cottes
loe (7
256)
Mosman
Park
(825
1)
Clarem
ont (8
942)
Perth (
1157
3)
Murray
(119
69)
Serpen
tine-J
arrah
dale
(1288
9)
Basse
ndea
n (13
463)
Subiac
o (16
380)
Nedlan
ds (2
0335
)
Kwinana
(231
98)
Cambri
dge (
2375
3)
Freman
tle (2
4835
)
Vincen
t (268
76)
Victori
a Park
(279
55)
Belmon
t (303
31)
Munda
ring (
3509
7)
South
Perth (
3936
1)
Kalamun
da (4
9534
)
Armad
ale (5
0535
)
Baysw
ater (
5580
1)
Mandu
rah (5
5815
)
Cockb
urn (7
4472
)
Cannin
g (77
305)
Rockin
gham
(843
07)
Gosne
lls (91
579)
Melville
(930
03)
Swan (9
3279
)
Wan
neroo
(110
940)
Joon
dalup
(149
673)
Stirling
(176
872)
LGA (population)
PosNegMix
96
Number of Employees
The number of employees in each local government also varies considerably across the
metropolitan area. It ranges from 18 in Peppermint Grove, which is also smallest local
government area to 789 in Stirling, the largest local government area. While there is close
correspondence between number of employees and population of the LGA, there are some
anomalies – for example, Fremantle has more employees compared to its size that other local
governments. Similarly to the analysis for population, the number of access and land use
criteria that are reflected tends to be higher in LGA’s that have more employees.
Interestingly, Fremantle has comparatively high number of employees for its population
(number of employees, 422) and therefore sits within this trend rather than as an outlier, as it
was in the population set. Following the trend suggested by the population data above,
Bassendean (number of employees 112), East Fremantle (number of employees 45) and
Subiaco (number of employees, 133) have comparatively few employees, but comparatively
good reflection of the access and land use criteria. Again, there is little to be said about the
people places criteria with reference to number of employees (A full set of graphs for this
data is available in Appendix 8)
Year in which the local planning scheme was first drafted
The year in which the local planning scheme was first drafted varies between local
governments from 1983 to 2007. However, there is a requirement for local planning schemes
to be reviewed every five years, and they are periodically amended, so an old planning
scheme may contain several new measures. This was not specifically investigated, but needs
to be considered as context for this analysis.
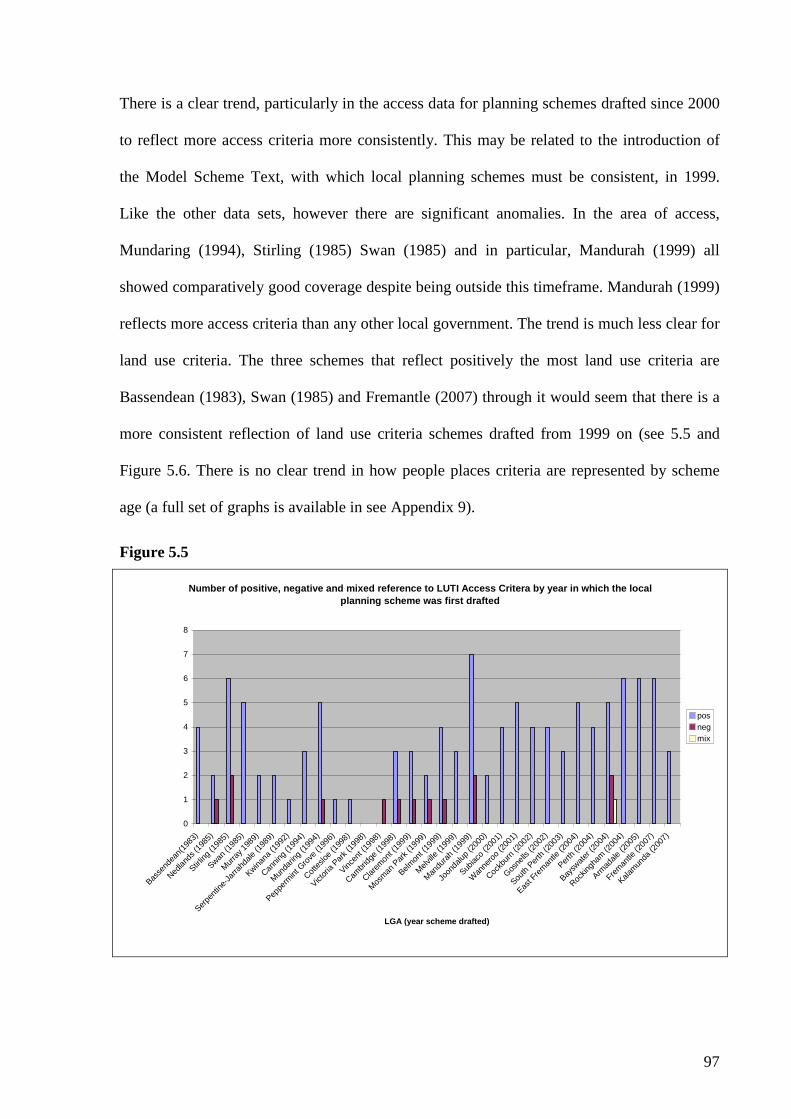
97
There is a clear trend, particularly in the access data for planning schemes drafted since 2000
to reflect more access criteria more consistently. This may be related to the introduction of
the Model Scheme Text, with which local planning schemes must be consistent, in 1999.
Like the other data sets, however there are significant anomalies. In the area of access,
Mundaring (1994), Stirling (1985) Swan (1985) and in particular, Mandurah (1999) all
showed comparatively good coverage despite being outside this timeframe. Mandurah (1999)
reflects more access criteria than any other local government. The trend is much less clear for
land use criteria. The three schemes that reflect positively the most land use criteria are
Bassendean (1983), Swan (1985) and Fremantle (2007) through it would seem that there is a
more consistent reflection of land use criteria schemes drafted from 1999 on (see 5.5 and
Figure 5.6. There is no clear trend in how people places criteria are represented by scheme
age (a full set of graphs is available in see Appendix 9).
Figure 5.5
Number of positive, negative and mixed reference to LUTI Access Critera by year in which the local planning scheme was first drafted
0
1
2
3
4
5
6
7
8
Basse
ndea
n(198
3)
Nedlan
ds (1
985)
Stirling
(198
5)
Swan (1
985)
Murray
1989
)
Serpen
tine-J
arrah
dale
(1989
)
Kwinana
(199
2)
Cannin
g (19
94)
Munda
ring (
1994
)
Peppe
rmint
Grov
e (19
96)
Cottes
loe (1
998)
Victori
a Park
(199
8)
Vincen
t (199
8)
Cambri
dge (
1998
)
Clarem
ont (1
999)
Mosman
Park
(199
9)
Belmon
t (199
9)
Melville
(199
9)
Mandu
rah (1
999)
Joon
dalup
(200
0)
Subiac
o (20
01)
Wan
neroo
(200
1)
Cockb
urn (2
002)
Gosne
lls (20
02)
South
Perth (
2003
)
East F
reman
tle (2
004)
Perth (
2004
)
Baysw
ater (
2004
)
Rockin
gham
(200
4)
Armad
ale (2
005)
Freman
tle (2
007)
Kalamun
da (2
007)
LGA (year scheme drafted)
posnegmix

98
Figure 5.6
Number of positive, negative and mixed reference to LUTI Land Use critera by year in which the local planning scheme was first drafted
0
2
4
6
8
10
12
Basse
ndea
n(198
3)
Nedlan
ds (1
985)
Stirling
(198
5)
Swan (1
985)
Murray
1989
)
Serpen
tine-J
arrah
dale
(1989
)
Kwinana
(199
2)
Cannin
g (19
94)
Munda
ring (
1994
)
Peppe
rmint
Grov
e (19
96)
Cottes
loe (1
998)
Victori
a Park
(199
8)
Vincen
t (199
8)
Cambri
dge (
1998
)
Clarem
ont (1
999)
Mosman
Park
(199
9)
Belmon
t (199
9)
Melville
(199
9)
Mandu
rah (1
999)
Joon
dalup
(200
0)
Subiac
o (20
01)
Wan
neroo
(200
1)
Cockb
urn (2
002)
Gosne
lls (20
02)
South
Perth (
2003
)
East F
reman
tle (2
004)
Perth (
2004
)
Baysw
ater (
2004
)
Rockin
gham
(200
4)
Armad
ale (2
005)
Freman
tle (2
007)
Kalamun
da (2
007)
LGA (year scheme drafted)
PosNegMix
Membership to the Sustainable Transport Coalition
There is no discernable association between STC membership and positive reference to
access criteria or people places criteria. Local governments who were STC members showed
more consistent reflection of more land use criteria than those that were not though this
cannot be seen as a causal factor (a full set of graphs is available in

99
Appendix 10),
Ambiguity or negative representation in state and local government policy
Overall, the content analysis reflected that for the most part, the LUTI criteria were either
reflected positively or not at all in documents. However there were a significant number of
documents that worked against the LUTI criteria, or had mixed messages with some
statements that worked for and some against the LUTI criteria.
Of the state government documents, WAPC DC 2.6 Residential Road Planning mixed both
positive and negative mentions for more criteria than any of the other documents. The content
analysis suggests that the policy is mixed in terms of its support for Access 5: Well designed
walkable catchments; Access 6: High quality pedestrian experience (and 6a arterial roads
have safe pedestrian facilities, on-road cycle lanes); and Access criteria 10: effective traffic
management. For example, the following statement was coded, under A10 as partly positive
and partly negative’
While the need to provide for the motor vehicle remains of fundamental importance
(negative), much greater priority must now be given to the creation of a safe, quiet and
useable neighbourhood environment where the motor vehicle is less dominant than in
many of our existing residential areas (positive) (WAPC, 1998).
Overall local government planning schemes were far more likely to have mixed, or negative
content in relation to the LUTI criteria. This was particularly the case in the area of Land
Use, and for the following criteria:
• Land Use configuration, LU3 - Greater diversity, vibrant mix of land uses within
precincts;
• Density and Intensity, LU10 - Medium to high residential densities;

100
• Parking, LU14 - Parking provided in shared structures rather than on individual sites;
and LU 15 - Car parking behind buildings not fronting street.
There were also particular local governments whose schemes reflected more negative or
ambiguous reference to the LUTI criteria. Bayswater includes 3 mixed and 4 negative scores,
Claremont, 2 mixed and 4 negative, Mandurah, 4 negative and 4 mixed, Mosman park, 5
negative and 3 mixed, Mundaring, 3 negative and 2 mixed, Stirling, 3 negative and 3 mixed
(see Appendix 4 Summary of Perth state and local policy document analysis by positive,
negative or mixed reference to LUTI Criteria).
Metroplan and Network City: changing representation of LUTI criteria in
Perth’s strategic planning documents over time.
Looking across the data in Appendix 5, Network city show much more breadth of coverage
across the LUTI criteria, particularly in the areas of Access and land use than Metroplan. The
strength with which criteria are mentioned is also much higher, with Network city far more
likely to support or strongly support the LUTI criteria than Metroplan. Therefore this
suggests a trend, at the state strategic level toward greater support for land use and transport
integration over time.
101
6 Discussion and scoping for stage two of the research project This working paper reports on the first stage of a research project to assess the capacity of the
planning and infrastructure institutions in the Greater Perth Metropolitan Area to deliver
sustainable and integrated land-use/transport outcomes. It began with a review of policy for
land use and transport integration in the Greater Perth Metropolitan region. The suite of
policy documents most relevant to land use and transport integration at the State government
level and within local governments was set out, and the methodology for content analysis of
these documents against a comprehensive set of LUTI principles described. The body of the
working paper has presented results and related discussion on the content analysis of local
and state government policy documents that was the focus of stage one of this research
project. The aim of this stage of the research was to produce a comprehensive position
statement about the degree to which, and in what way local and state government institutions
operating in the Greater Perth Metropolitan Region aspire to the integration of land use and
transport through their statutory and non-statutory policy documents.
This working paper is part of a broader research project that seeks to answer the following
questions:
1. What is the current capacity (using statutory and non-statutory powers) of state and local
public agencies to integrate land use and transport planning towards achieving
infrastructure/services for collective and active modes of transport and managing car
based travel?
2. What are the institutional constraints (rules, finance, structures, cultures etc) to delivery?
3. How can the capacity be improved?

102
The aim of producing a comprehensive position statement about the degree to which, and in
what way public institutions aspire to the delivery of sustainable transport through policy
documents is achieved through the response to the first research question above.
Addressing the research question
The primary research question addressed in this working paper, for the Greater Perth
Metropolitan Region, is:
What is the current capacity (using statutory and non-statutory powers) of state and
local public agencies to integrate land use and transport planning towards achieving
infrastructure/services for collective and active modes of transport?
It has been argued that that policy development usually occurs from the top down, with State
government policy legislation providing overarching direction, and local government
providing more operational detail (see discussion beginning on p. 11) This is reflected at least
partly by the outcomes of the content analysis – for example, local government planning
schemes are far more detailed than state government documents in the area of parking, and in
their incorporation of the LUTI people places criteria. However this was not reflected at all
within the content analysis in the area of access. Local governments have limited
responsibility for public transport provision, and state government documents were far more
detailed, and offered much broader coverage of access criteria overall. This is a significant
omission in the policy framework at a local level that may require redress to enable land use
and transport integration in Perth.
Overall, it was found that there was significant commitment to many of the principles that
enable the integration of land use and transport. This was particularly the case in non-
statutory policy at both the state government level and at the local government level within

103
local government where such policy has been developed. Statutory policy at the state
government level shows more consistent and broader coverage of the LUTI principles than
the statutory local planning schemes. In local planning schemes, the representation of LUTI
criteria is inconsistent and often patchy. Therefore, the statutory planning framework at the
local government level can be seen to currently reflect varied capacity to implement LUTI
across local government, and often, a limited capacity to support LUTI.
The comparison of Metroplan with Network City at the State government level, and also the
analysis of LUTI integration by scheme age across local governments suggest a trend toward
greater capacity for policy to support for LUTI over time, a positive trend. Several local
governments also show a strategic level commitment through their local planning strategies
and local transport plans, and these are also a more recent policy invention.
The brief analysis of particular local government characteristics – such as location,
population and number of employees suggests correlation between these factors and the
representation of access and land use criteria in particular. There are likely to be additional
local government specific factors that affect policy integration and implementation, some of
which may be uncovered in the second stage of this research project.
Progressing to stage two of the research
The aim of stage 2 of the research project is to identify institutional constraints (rules,
finance, structures, cultures etc) to delivery of LUTI. The content analysis of policy has
provided a good integration of the subject areas, and focus local government where this may
best be investigated. Finalisation of the research approach and methodology needs to occur
with reference to a detailed scoping of this aim.
104
Both strengths and gaps in vertical integration between state and local government were
identified by the content analysis. There were also identified strengths and weaknesses in
representation of the LUTI criteria at the state level, and local government level. The
particular differences across local governments are in terms of their representation of LUTI
are also useful in framing further research.
A detailed analysis of vertical integration between state and local government and horizontal
integration across state government policy, and across different LGA’s is provided in the
results section. Strengths and weaknesses in vertical integration, within state government
documents and within local government planning schemes are further summarised in Tables
28, 29 and 30. Notable local governments are identified in Table 27. These summaries form
the basis for identifying potential case study topics to proceed with in stage two of this
research project in Perth. They suggest several parameters by which case studies could be
defined and are summarised below. In places, a preliminary discussion of methodology is
also provided.
Case Study Option 1 – Exemplar local government in terms of Policy integration and breadth of coverage of LUTI The notable local government here is Fremantle. The City of Fremantle is the only local
government with the full suite of policy documents investigated at the local government level
through the content analysis: a Local planning scheme, local planning strategy, local transport
strategy, and a local bike plan. It is also the only local government were there is some
consistency between the local planning strategy and the local planning scheme in terms of
LUTI coverage. The Fremantle local planning scheme is supportive of 10 of 18 land use
criteria. Only two other local governments (Swan and Bassendean) are supportive of this
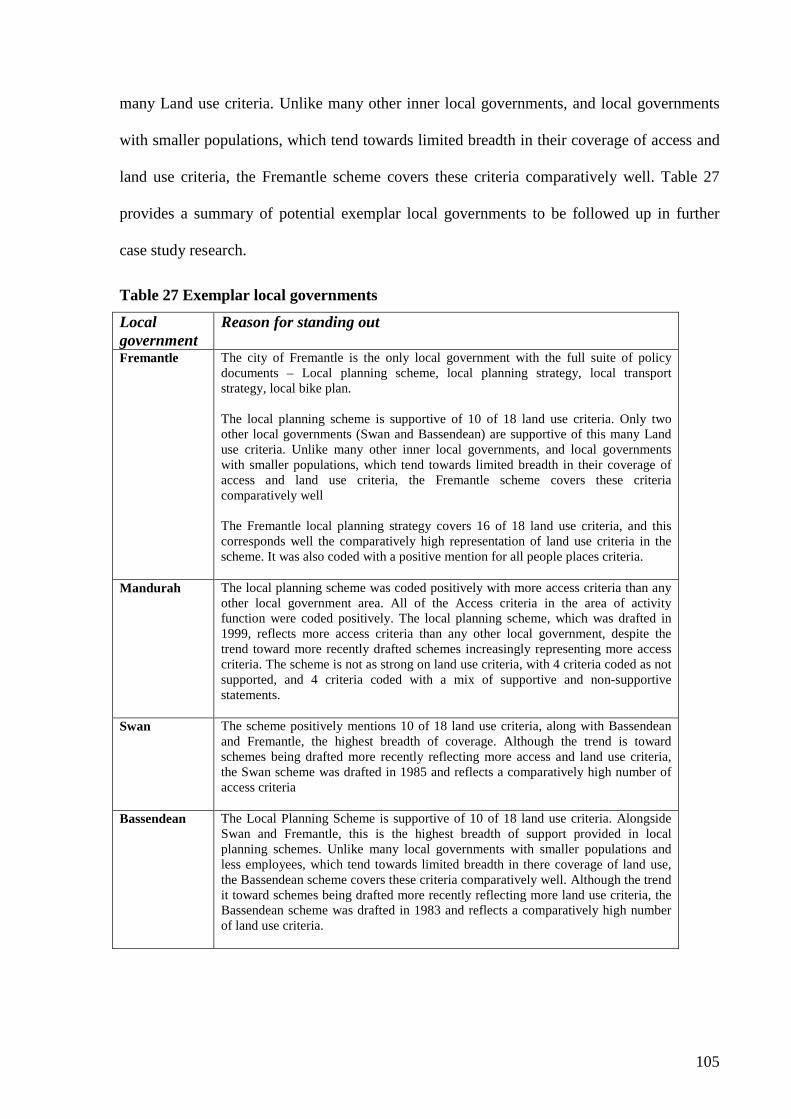
105
many Land use criteria. Unlike many other inner local governments, and local governments
with smaller populations, which tend towards limited breadth in their coverage of access and
land use criteria, the Fremantle scheme covers these criteria comparatively well. Table 27
provides a summary of potential exemplar local governments to be followed up in further
case study research.
Table 27 Exemplar local governments
Local government
Reason for standing out
Fremantle The city of Fremantle is the only local government with the full suite of policy documents – Local planning scheme, local planning strategy, local transport strategy, local bike plan. The local planning scheme is supportive of 10 of 18 land use criteria. Only two other local governments (Swan and Bassendean) are supportive of this many Land use criteria. Unlike many other inner local governments, and local governments with smaller populations, which tend towards limited breadth in their coverage of access and land use criteria, the Fremantle scheme covers these criteria comparatively well The Fremantle local planning strategy covers 16 of 18 land use criteria, and this corresponds well the comparatively high representation of land use criteria in the scheme. It was also coded with a positive mention for all people places criteria.
Mandurah The local planning scheme was coded positively with more access criteria than any other local government area. All of the Access criteria in the area of activity function were coded positively. The local planning scheme, which was drafted in 1999, reflects more access criteria than any other local government, despite the trend toward more recently drafted schemes increasingly representing more access criteria. The scheme is not as strong on land use criteria, with 4 criteria coded as not supported, and 4 criteria coded with a mix of supportive and non-supportive statements.
Swan The scheme positively mentions 10 of 18 land use criteria, along with Bassendean and Fremantle, the highest breadth of coverage. Although the trend is toward schemes being drafted more recently reflecting more access and land use criteria, the Swan scheme was drafted in 1985 and reflects a comparatively high number of access criteria
Bassendean The Local Planning Scheme is supportive of 10 of 18 land use criteria. Alongside Swan and Fremantle, this is the highest breadth of support provided in local planning schemes. Unlike many local governments with smaller populations and less employees, which tend towards limited breadth in there coverage of land use, the Bassendean scheme covers these criteria comparatively well. Although the trend it toward schemes being drafted more recently reflecting more land use criteria, the Bassendean scheme was drafted in 1983 and reflects a comparatively high number of land use criteria.

106
Case Study Option 2 - Lack of support for, or ambiguity in the representation of LUTI The issue of lack of support ambiguity in the coverage of LUTI criteria is interesting, as it
suggests mixed messages in the policy framework that may get in the way of actual
achievement of land use and transport integration, or perhaps, spatial variation within an
LGA in how LUTI might be achieved. Local government planning schemes were far more
likely to contain mixed messages in relation to LUTI than state government documents. It
may therefore be useful to do a case study of local government(s) that includes a significant
number of LUTI criteria for which there are mixed positive and negative reference. Potential
candidates for case study here include:
• Bayswater. The Bayswater local planning scheme includes 3 mixed (A1, LU13,
LU14) and 4 negative (A7, A9, LU10, LU15) codes;
• Claremont. The Claremont local planning scheme includes 2 mixed (LU3, LU14)
and 4 negative (A7, LU10, LU16, PP1) codes;
• Mandurah. The City of Mandurah Scheme includes 4 negative (A7, A9, LU15,
LU16) and 4 mixed (LU2, LU9, LU10 LU14) codes;
• Mosman Park. The Mosman Park Local Planning Scheme includes 5 negative
(A7, LU 12, LU 13, LU16, PP4) and 3 mixed (LU3, LU10, PP6) codes;
• Mundaring. The Mundaring Local Planning Scheme includes, 3 negative (A7,
LU16, LU17) and 3 mixed (LU3, LU10, LU14) codes; and
• Stirling. The Stirling Local Planning Scheme includes, 3 negative (A7, LU 8,
LU16) and 3 mixed (LU3, LU10, LU15) codes.
a. Local government that fall, in a positive way, outside the trend.
An in depth qualitative case study of local governments would be appropriate here, to
investigate:
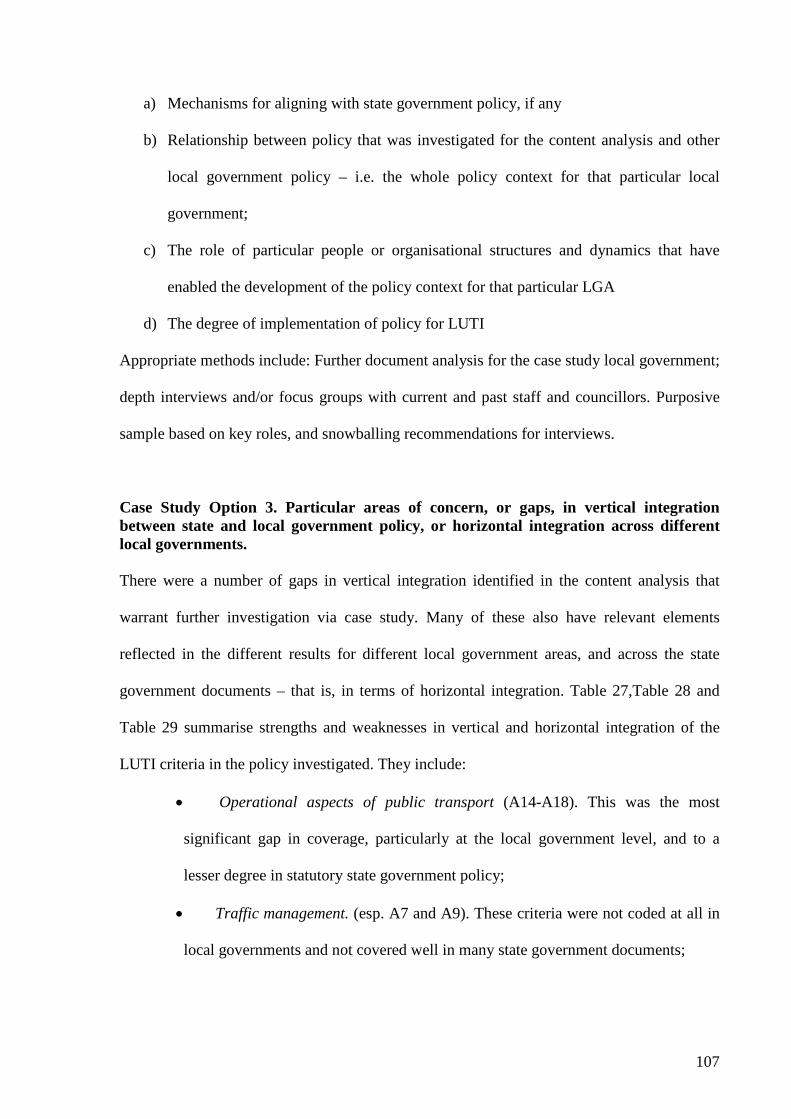
107
a) Mechanisms for aligning with state government policy, if any
b) Relationship between policy that was investigated for the content analysis and other
local government policy – i.e. the whole policy context for that particular local
government;
c) The role of particular people or organisational structures and dynamics that have
enabled the development of the policy context for that particular LGA
d) The degree of implementation of policy for LUTI
Appropriate methods include: Further document analysis for the case study local government;
depth interviews and/or focus groups with current and past staff and councillors. Purposive
sample based on key roles, and snowballing recommendations for interviews.
Case Study Option 3. Particular areas of concern, or gaps, in vertical integration between state and local government policy, or horizontal integration across different local governments. There were a number of gaps in vertical integration identified in the content analysis that
warrant further investigation via case study. Many of these also have relevant elements
reflected in the different results for different local government areas, and across the state
government documents – that is, in terms of horizontal integration. Table 27,Table 28 and
Table 29 summarise strengths and weaknesses in vertical and horizontal integration of the
LUTI criteria in the policy investigated. They include:
• Operational aspects of public transport (A14-A18). This was the most
significant gap in coverage, particularly at the local government level, and to a
lesser degree in statutory state government policy;
• Traffic management. (esp. A7 and A9). These criteria were not coded at all in
local governments and not covered well in many state government documents;
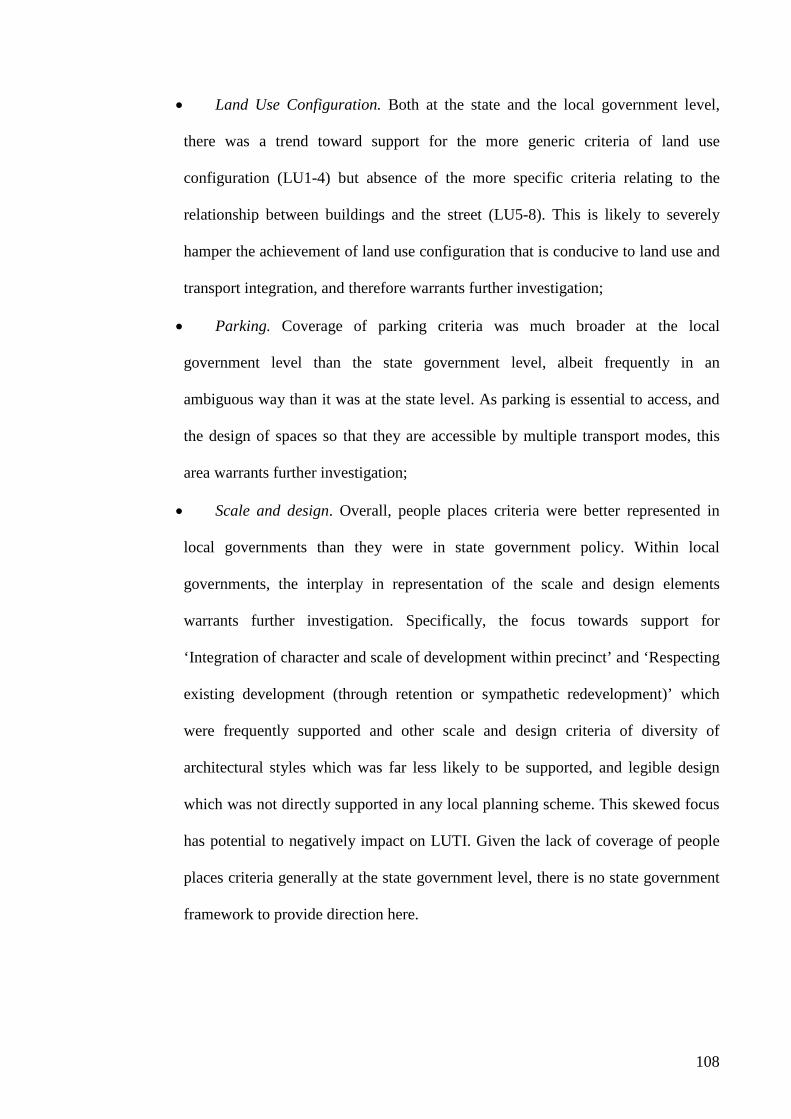
108
• Land Use Configuration. Both at the state and the local government level,
there was a trend toward support for the more generic criteria of land use
configuration (LU1-4) but absence of the more specific criteria relating to the
relationship between buildings and the street (LU5-8). This is likely to severely
hamper the achievement of land use configuration that is conducive to land use and
transport integration, and therefore warrants further investigation;
• Parking. Coverage of parking criteria was much broader at the local
government level than the state government level, albeit frequently in an
ambiguous way than it was at the state level. As parking is essential to access, and
the design of spaces so that they are accessible by multiple transport modes, this
area warrants further investigation;
• Scale and design. Overall, people places criteria were better represented in
local governments than they were in state government policy. Within local
governments, the interplay in representation of the scale and design elements
warrants further investigation. Specifically, the focus towards support for
‘Integration of character and scale of development within precinct’ and ‘Respecting
existing development (through retention or sympathetic redevelopment)’ which
were frequently supported and other scale and design criteria of diversity of
architectural styles which was far less likely to be supported, and legible design
which was not directly supported in any local planning scheme. This skewed focus
has potential to negatively impact on LUTI. Given the lack of coverage of people
places criteria generally at the state government level, there is no state government
framework to provide direction here.
109
Appropriate methods for this type of case study could include could include identification,
from the content analysis results, a limited subset of local governments that exemplify the
phenomena to be investigated and to undertake a detailed analysis of the policy and
legislative context for phenomena, including identifying roles and responsibly and the nature
of them at state and local level. The phenomena could also be investigated with exemplar
local governments through depth interviews and focus groups and in relation to the particular
policy and location context of that local government, with additional interviews with relevant
state government workers in relation to phenomena.
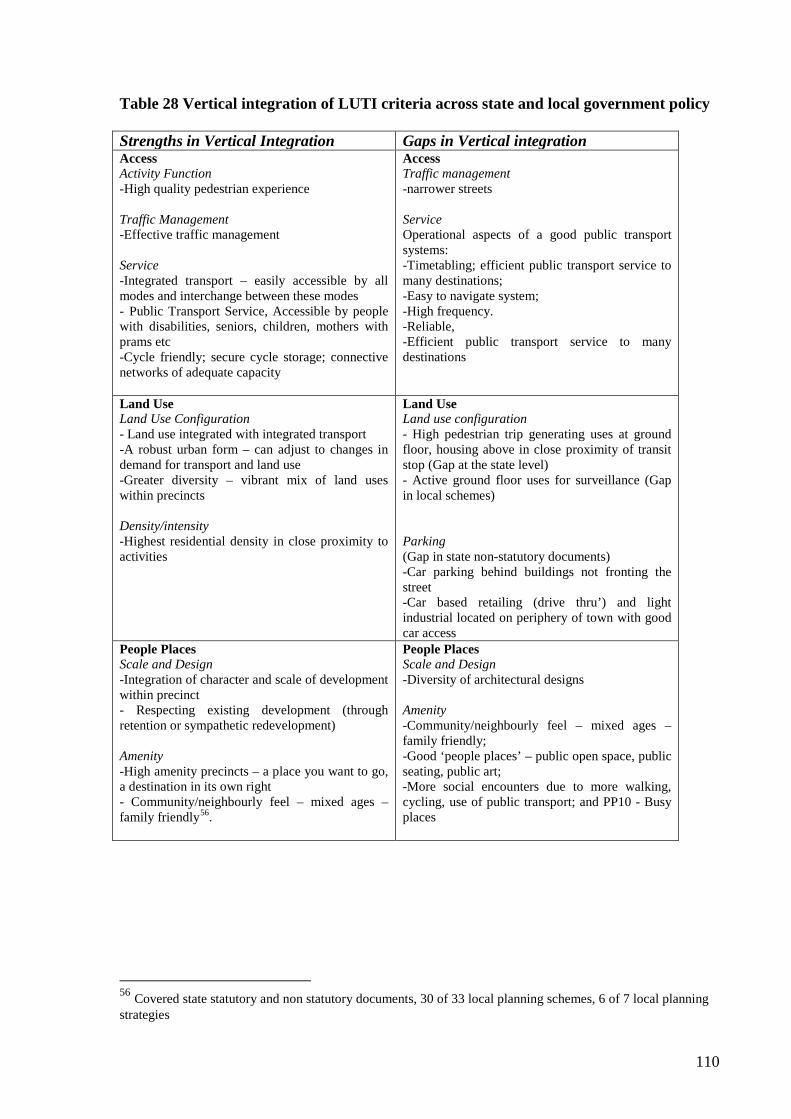
110
Table 28 Vertical integration of LUTI criteria across state and local government policy
Strengths in Vertical Integration Gaps in Vertical integration Access Activity Function -High quality pedestrian experience Traffic Management -Effective traffic management Service -Integrated transport – easily accessible by all modes and interchange between these modes - Public Transport Service, Accessible by people with disabilities, seniors, children, mothers with prams etc -Cycle friendly; secure cycle storage; connective networks of adequate capacity
Access Traffic management -narrower streets Service Operational aspects of a good public transport systems: -Timetabling; efficient public transport service to many destinations; -Easy to navigate system; -High frequency. -Reliable, -Efficient public transport service to many destinations
Land Use Land Use Configuration - Land use integrated with integrated transport -A robust urban form – can adjust to changes in demand for transport and land use -Greater diversity – vibrant mix of land uses within precincts Density/intensity -Highest residential density in close proximity to activities
Land Use Land use configuration - High pedestrian trip generating uses at ground floor, housing above in close proximity of transit stop (Gap at the state level) - Active ground floor uses for surveillance (Gap in local schemes) Parking (Gap in state non-statutory documents) -Car parking behind buildings not fronting the street -Car based retailing (drive thru’) and light industrial located on periphery of town with good car access
People Places Scale and Design -Integration of character and scale of development within precinct - Respecting existing development (through retention or sympathetic redevelopment) Amenity -High amenity precincts – a place you want to go, a destination in its own right - Community/neighbourly feel – mixed ages – family friendly56
.
People Places Scale and Design -Diversity of architectural designs Amenity -Community/neighbourly feel – mixed ages – family friendly; -Good ‘people places’ – public open space, public seating, public art; -More social encounters due to more walking, cycling, use of public transport; and PP10 - Busy places
56 Covered state statutory and non statutory documents, 30 of 33 local planning schemes, 6 of 7 local planning strategies

111
Table 159 Representation of LUTI Criteria at the State government level
Strengths in Representation Gaps in Representation Access The following criteria had significant support in statutory and non statutory documents. Activity Function -High quality pedestrian experience including arterial roads that have pedestrian facilities and on-road cycle lanes Service -Integrated transport – easily accessible by all modes and interchange between these modes - Cycle friendly; secure cycle storage; connective networks of adequate capacity
Access Traffic Management -Narrower streets (only positively coded once in one document) Service Operational aspects of a good public transport systems were virtually absent from state statutory documents: -Timetabling; efficient public transport service to many destinations; -Easy to navigate system; -High frequency. -Reliable, -Efficient public transport service to many destinations
Land Use Land Use Configuration -Land Use integrated with Integrated transport -A robust urban form – Can adjust to changes in demand for transport and land use. Density/Intensity -Highest residential density in close proximity to activities (but ensure includes family housing types) Proximity Compact cluster of related (compatible) activities (highly visited) in close proximity (walking distance), clustered around rail station/high frequency bus stop
Land Use Land Use configuration -High pedestrian trip generating uses at ground floor, housing above in close proximity of transit stop (not reflected at all in state government documents) Parking - Car parking behind buildings not fronting street; - Street parking; - Car-based retailing (drive-thru’) and light industry located on periphery of town with good car access (Only reflected in state statutory documents)
People Places Scale and Design - Integration of character and scale of development within precinct -Legible design – is easily understood for residents and visitors. Amenity - High amenity precincts – a place you want to go to – a destination in its own right
People Places There were not state government documents that covered more than half of the people places criteria. Complete gaps at the state level occurred in Scale and Design - Diversity of architectural styles Amenity, -More social encounters due to more walking, cycling, use of public transport

112
Table 30 Representation of LUTI Criteria at the Local government level
Strengths in Representation Gaps in Representation Access Close to half or more of the local planning schemes were positively coded with the following criteria. The Network - Choice of transport options in close proximity Traffic management - Effective Traffic Management Service -Public transport that is accessible by people with disabilities, seniors, children, mothers with prams etc.
Access The following criteria were not coded positively at all in local planning schemes. Traffic Management -lower traffic speeds -Narrower streets Service Operational aspects of a good public transport systems: -Timetabling; efficient public transport service to many destinations; -Easy to navigate system; -High frequency. -Reliable, -Efficient public transport service to many destinations
Land Use The following are identified as strengths in the local planning schemes – though in practice, many of the local planning schemes did not get coded positively for them. Land Use Configuration - Land use integrated with integrated transport - Greater diversity, vibrant mix of land uses within precincts Density/intensity -Medium to high residential densities -Highest residential density in close proximity to activities (but ensure includes family housing types). Parking - Car parking areas managed so pedestrian access, amenity and safety not compromised - Car-based retailing (drive-thru’) and light industry located on periphery of town with good car access
Land Use Land use configuration - High pedestrian trip generating uses at ground floor, housing above in close proximity of transit stop - Active ground floor uses for surveillance - Active ground floor uses for surveillance, - Frontage development – human scale.
People Places Scale and Design - Integration of character and scale of development within precinct - Respecting existing development (through retention or sympathetic redevelopment) Amenity: - High amenity precincts – a place you want to go to – a destination in its own right; - Community/neighbourly feel – mixed ages – family friendly; - Good ‘people places’ – public open space, public seating, public art.
People Places Scale and Design - Diversity of architectural styles - Legible design – is easily understood for residents and visitors Amenity - More social encounters due to more walking, cycling, use of public transport, - Busy places
113
7 Acknowledgements The research undertaken for this first stage of the project has spanned a considerable period of time, commencing in late 2006 with document collation. The authors would like to acknowledge the earlier inputs by previous research assistants: Jake Schapper, Roger Mellor, and more recently Courtney Babb.

114
8 References Appleyard D and Lintel M 1972 ‘The Environmental Quality of City Streets’ Journal of the American Planning Institute 38 (2): 84-101. Ball S 1993 ‘What is policy? Texts, trajectories and toolboxes’ Discourse: Studies in the Cultural Politics of Education 13(2): 10-17. Banister D 2005 ‘Overcoming barriers to the implementation of sustainable transport’ in P Reitveld & R Stough (eds.)Barriers to Sustainable Transport: institutions, regulations and sustainability Spon Press, Abingdon. Bertolini L & le Clercq F 2003 'Urban development without more mobility by car? Lessons from Amsterdam, a multimodal urban region.' Environment and Planning A, 35: 575-589. Bikewest 2008 Local Government Bicycle Plans – Guidelines for preparing bicycle plans. Government of Western Australia, Department of Planning and Infrastructure. Breheny M, Gurney A, Strike J 1996 ‘The Compact City and the Need to Travel: The implementation of UK Planning Policy Guidance’ in M Jenks, E Burton & K Williams The Compact City: A Sustainable Urban Form?, E & FN Spon Press, Abbington. Bunker R and Searle G 2009 ‘Theory and practice in metropolitan strategy: Situating recent Australian planning’ Urban Policy and Research 27(2): 101-116. Condon P 2008 Design Charettes for Sustainable Communities Washington DC, Island Press. Commonwealth of Australia 2008 The people of Western Australia: Statistics from the 2006 census Department of Immigration and Citizenship and Office of Multicultural Interests. URL: http://www.omi.wa.gov.au/omi_people.asp accessed 9/6/09. Curtis C 1998 Integrated Land Use & Transport Planning Policies: A review of selected initiatives outside Australia and their applicability to strategic land use planning in Perth. Western Australian Planning Commission, Perth, Western Australia. (ISBN:0 7309 9032 X) Curtis C 1999 ‘Turning Strategies into Actions: Integrated Land Use and Transport Planning in Western Australia’ Refereed Paper to the 23rd Australasian Transport Research Forum 1999 - Conference Proceedings 349-363. Curtis C 2005 ‘The Windscreen World of Land Use Transport Integration: Experiences from Perth, a Dispersed City’ Town Planning Review 76(4): 423-453 Curtis 2008 ‘Planning for Sustainability: The Implementation Challenge’ Transport Policy 15 (2):104-112 Curtis C & James B 2004, 'An Institutional Model for Land Use Transport Integration', Urban Policy and Research 22(3): 277-297. Curtis, C and Scheurer, J 2007 Multiple Accessibility: Developing a Tool for Evaluating Land Use-Transport Integration’ Paper presented to AESOP 2004 Congress, Grenoble, France, July 2004 and 19th EAROPH Congress, Melbourne, September 2004. [DPI] Department of Planning and Infrastructure nd. Building Networks. Department of Planning and Infrastructure, Perth.
115
[DPI] Department of Planning and Infrastructure 2001 Integrated Transport Planning Partnering Agreement Department of Planning and Infrastructure, Perth. [DOTARS] Department of Transport and the Regional Services 2003 National Charter of Integrated Land Use and Transport Planning, Department of Transport and the Regions, Canberra. [EMCT/OECD] European Conference of Transport Ministers & Organisation for Economic Co-operation and Development 2003 Implementing Sustainable Urban Travel Policies: National Reviews, OECD Publications Service, Paris. City of Gosnells 2007 Gosnells Strategic Plan 2007-2010 City of Gosnells, Perth. Gehl J 1987 Life Between Buildings - Using Public Space, Van Nostrand Reinhold Company, New York. Hedgcock D 2003 ‘The exercise of influence within the local planning system’ Australian Planner 40(3): 35-39. Jacobs A B 2001 Great Streets MIT Press, Cambridge Massachusetts. Kennedy C, Miller E, Shalaby H, MacLean, H and Coleman J 2005 ‘The four pillars of sustainable urban transportation’ Transport reviews 25(4):393-414 Ministry for Transportation and Ministry for Municipal Affairs 1995, Transit-Supportive Land Use Planning Guidelines, Ministry for Transportation and Ministry for Municipal Affairs, Ontario. North D 1990 Institutions, Institutional Change, and Economic Performance New York, Cambridge University Press. Neuendorf K 2005 The Content Analysis Guidebook Sage Publications Thousand Oak. Potter S & Skinner M J 2000 'On transport integration: a contribution to better understanding', Futures, 32: 257-287.
Radaelli, C 1995 'The role of knowledge in the policy process' Journal of European Public Policy 2(2): 159-183.
Rietveld P & Stough R (eds.) 2005, Barriers to Sustainable Transport: institutions, regulations and sustainability, Spon Press, Abingdon.
Richardson E 2002 'The Role of Local Government in Integrated Transport', Integrated Transport for Local Communities, Australian Road Research Board, Melbourne, Australia.
Schaeffer K H & Sclar E 1975, Access for All. Transportation and Urban Growth, Penguin Books, Baltimore, USA.
Stein L 2008 Principles of Planning Law South Melbourne Oxford University Press
Stemlar S 2001 An overview of content analysis. Practical Assessment, Research & Evaluation, 7(17) retrieved August 26, 2009 from http://PAREonline.net/getvn.asp?v=7&n=17
Tibbalds F 2001, Making People Friendly Places: Improving the public environment in towns and cities, Spon Press, London.
Ubbels B and Verhoef E 2005, Barriers to transport pricing, in P Reitveld and R Stough eds. Barriers to Sustainable Transport: institutions, regulations and sustainability Spon Press, Abingdon.

116
[WAPC] Western Australian Planning Commission (1999) Town Planning Amendment Regulations (1999) Model Scheme Text no.33 November 1999
[WAPC] Western Australian Planning Commission 2004, Network city: community planning strategy for Perth and Peel, WAPC, Perth.
[WAPC] Western Australian Planning Commission (2006) "Swan Valley Planning Legislation Amendment Act", Planning Bulletin Western Australia June 2006: 1-8.
Westerman H L 1998, Cities for Tomorrow: Integrating Land Use, Transport and the Environment. Better Practice Guide, Austroads Incorporated, Haymarket, New South Wales. Whyte W H 1980 The Social Life of Small Urban Spaces, Project for Public Spaces, Michigan. Yenken D 1995, 'Collaboration in Placemaking', in T Winkoff ed. Places not Spaces: Placemaking in Australia Envirobooks, Sydney.

117
9 Appendices
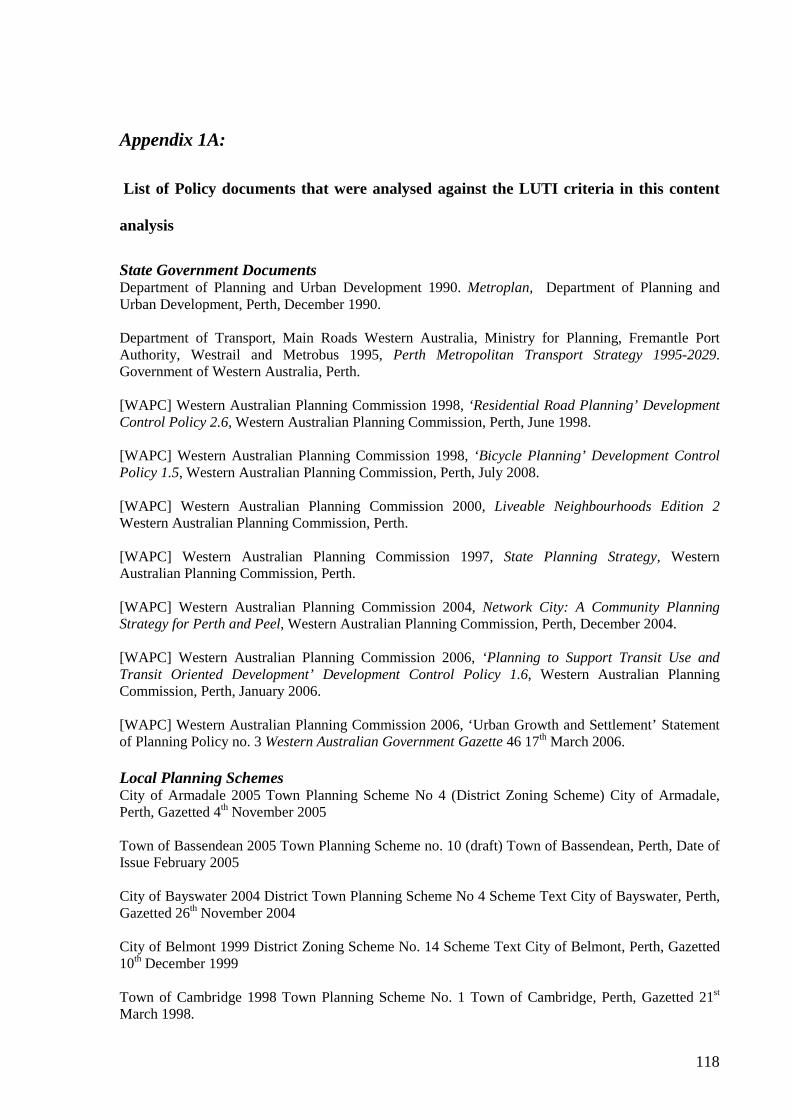
118
Appendix 1A:
List of Policy documents that were analysed against the LUTI criteria in this content
analysis
State Government Documents Department of Planning and Urban Development 1990. Metroplan, Department of Planning and Urban Development, Perth, December 1990. Department of Transport, Main Roads Western Australia, Ministry for Planning, Fremantle Port Authority, Westrail and Metrobus 1995, Perth Metropolitan Transport Strategy 1995-2029. Government of Western Australia, Perth. [WAPC] Western Australian Planning Commission 1998, ‘Residential Road Planning’ Development Control Policy 2.6, Western Australian Planning Commission, Perth, June 1998. [WAPC] Western Australian Planning Commission 1998, ‘Bicycle Planning’ Development Control Policy 1.5, Western Australian Planning Commission, Perth, July 2008. [WAPC] Western Australian Planning Commission 2000, Liveable Neighbourhoods Edition 2 Western Australian Planning Commission, Perth. [WAPC] Western Australian Planning Commission 1997, State Planning Strategy, Western Australian Planning Commission, Perth. [WAPC] Western Australian Planning Commission 2004, Network City: A Community Planning Strategy for Perth and Peel, Western Australian Planning Commission, Perth, December 2004. [WAPC] Western Australian Planning Commission 2006, ‘Planning to Support Transit Use and Transit Oriented Development’ Development Control Policy 1.6, Western Australian Planning Commission, Perth, January 2006. [WAPC] Western Australian Planning Commission 2006, ‘Urban Growth and Settlement’ Statement of Planning Policy no. 3 Western Australian Government Gazette 46 17th March 2006. Local Planning Schemes City of Armadale 2005 Town Planning Scheme No 4 (District Zoning Scheme) City of Armadale, Perth, Gazetted 4th November 2005 Town of Bassendean 2005 Town Planning Scheme no. 10 (draft) Town of Bassendean, Perth, Date of Issue February 2005 City of Bayswater 2004 District Town Planning Scheme No 4 Scheme Text City of Bayswater, Perth, Gazetted 26th November 2004 City of Belmont 1999 District Zoning Scheme No. 14 Scheme Text City of Belmont, Perth, Gazetted 10th December 1999 Town of Cambridge 1998 Town Planning Scheme No. 1 Town of Cambridge, Perth, Gazetted 21st March 1998.
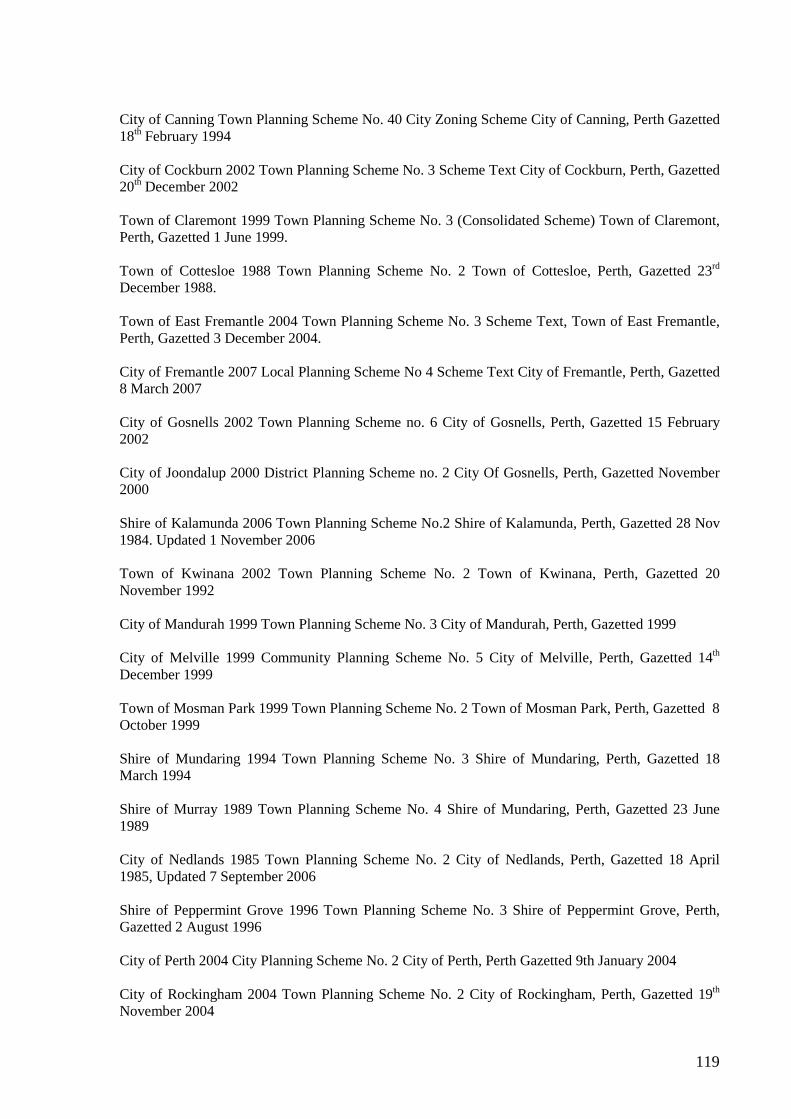
119
City of Canning Town Planning Scheme No. 40 City Zoning Scheme City of Canning, Perth Gazetted 18th February 1994 City of Cockburn 2002 Town Planning Scheme No. 3 Scheme Text City of Cockburn, Perth, Gazetted 20th December 2002 Town of Claremont 1999 Town Planning Scheme No. 3 (Consolidated Scheme) Town of Claremont, Perth, Gazetted 1 June 1999. Town of Cottesloe 1988 Town Planning Scheme No. 2 Town of Cottesloe, Perth, Gazetted 23rd December 1988. Town of East Fremantle 2004 Town Planning Scheme No. 3 Scheme Text, Town of East Fremantle, Perth, Gazetted 3 December 2004. City of Fremantle 2007 Local Planning Scheme No 4 Scheme Text City of Fremantle, Perth, Gazetted 8 March 2007 City of Gosnells 2002 Town Planning Scheme no. 6 City of Gosnells, Perth, Gazetted 15 February 2002 City of Joondalup 2000 District Planning Scheme no. 2 City Of Gosnells, Perth, Gazetted November 2000 Shire of Kalamunda 2006 Town Planning Scheme No.2 Shire of Kalamunda, Perth, Gazetted 28 Nov 1984. Updated 1 November 2006 Town of Kwinana 2002 Town Planning Scheme No. 2 Town of Kwinana, Perth, Gazetted 20 November 1992 City of Mandurah 1999 Town Planning Scheme No. 3 City of Mandurah, Perth, Gazetted 1999 City of Melville 1999 Community Planning Scheme No. 5 City of Melville, Perth, Gazetted 14th December 1999 Town of Mosman Park 1999 Town Planning Scheme No. 2 Town of Mosman Park, Perth, Gazetted 8 October 1999 Shire of Mundaring 1994 Town Planning Scheme No. 3 Shire of Mundaring, Perth, Gazetted 18 March 1994 Shire of Murray 1989 Town Planning Scheme No. 4 Shire of Mundaring, Perth, Gazetted 23 June 1989 City of Nedlands 1985 Town Planning Scheme No. 2 City of Nedlands, Perth, Gazetted 18 April 1985, Updated 7 September 2006 Shire of Peppermint Grove 1996 Town Planning Scheme No. 3 Shire of Peppermint Grove, Perth, Gazetted 2 August 1996 City of Perth 2004 City Planning Scheme No. 2 City of Perth, Perth Gazetted 9th January 2004 City of Rockingham 2004 Town Planning Scheme No. 2 City of Rockingham, Perth, Gazetted 19th November 2004

120
Shire of Serpentine-Jarrahdale 1989 Town Planning Scheme No 2 Shire of Serpentine-Jarrahdale, Perth Gazetted 4 August 1989 City of South Perth 2003 Town Planning Scheme No. 6 City of South Perth, Perth, Gazetted 29 April 2003 City of Stirling 1985 District Planning Scheme No. 2 City of Stirling, Perth, Gazetted 13 September 1985 City of Subiaco 2001 Town Planning Scheme No. 4 City of Subiaco, Perth, Gazetted 23 March 2001 City of Swan 1985 Town Planning Scheme No. 9 City of Swan, Perth, Gazetted 9th December 1985). Consolidated scheme text incorporating amendments gazetted up to 30 January 2006. Town of Victoria 1998 Park Town Planning Scheme No. 1 Scheme Text Town of Victoria Park, Perth, Gazetted 1998. Consolidated scheme text incorporating amendments gazetted up to 3 May 2005 Town of Vincent 1998 Town Planning Scheme No. 1 Town of Vincent, Perth, Gazetted 4th December 1998 City of Wanneroo 2001 District Planning Scheme City of Wanneroo, Perth, Gazetted 6th July 2001
121
Appendix 1B: Full suite of Policy Documents by Local Government from
which sample is drawn

1
Document Type
Local Government Strategic Plan
Plan of Principle activities
Local Planning Strategy
Local Planning Scheme
Policy Manual
Transport Strategy
Bicycle Plan
Environmental Strategy
Sustainability Plan Access Plan
Safety Plan
Other policies/ documents
Armadale 15/3/05* 28/10/05 4 /11/05 10/2007 Ad 16/1/06 14/10/05* 10/10/05* 19/8/04*
Bassendean 2005 2/05 18/3/83 12/2005 10/8/05* 1/03
30/12/04* 5/02
Bayswater, 3/2006 3/05 26/11/04
3/2007
28/5/02 25/1/05 25/1/05
23/6/05 4/02 10/06
2/9/05
Belmont, 14/7/05*
4/7/06* 10/12/99
8/2007 29/04/05 Ad 6/9/05
12/11/04* 8/9/06*
30/11/06*
Cambridge 2005 31/3/1998
9/2007 9/06 2/05 2004 (?)
1/05
Canning, 8/06 18/2/1994
10/2006 9 times 28/2/06
12/01 9/97
28/3/02
Claremont Ad20/6/06 26/7/04 1/6/1999
3/2007 1/7/05 9/01
Cockburn 6/10/06*
9/8/06* 8/2000 20/12/02
8/2007
19/9/06 15/3/05 14/7/05 17/9/02 8/12/05 17/9/02 8/6/06
(?) 17/1/04* 17/1/04*
Cottesloe 31/7/06 2000(?) 1/7/05
Late 2005
council adopted
23/12/88 7/2007 5/99
24/5/89 27/9/06
8/02 4/03 Ad27/8/01
East Fremantle 2006 6/7/04 6/2003 3/12/04 2/2007
16/3/99 3/6/03
18/5/00 2/2/06*
Fremantle 9/4/06 5/7/04 7/01 8/3/07 3/2007
23/10/00 18/11/91
18/7/88 6/6/00
27/1/99
21/6/99 12/04
24/6/04* 9/03 25/6/04 11/02
8/96 2/01 2005 6/00
11/02

2
Gosnells 2007 15/2/02 7/2007
10/5/05 22/08/06
11/5/04 7/12/04 24/3/06 9/11/01 27/08/02
12/03
Joondalup 24/6/03 28/11/00
8/2007
10/05 10/06
5/06 9/1/04* 4/8/05*
5/10/04 4/8/05
2/95
Kalamunda 21/6/06 5/12/00
28/11/84
Kwinana 21/3/06 9/03 20/11/1992
9/2007 27/09/06 Times 4
14/12/05* 22/10/04*
Mandurah 7/2/05* 21/71999 11/2006 4/11/02* 1/02
10/02 Times 4
Melville 21/4/06* 14/12/99 9/2007
5/5/05 5/5/05
25/8/05 2/3/04 5/7/06 24/6/02 23/7/07*
30/5/05* 5/05
Mosman Park 26/7/06
11/10/04 8/10/99 3/2007
Mundaring 27/4/04 18/3/94 8/2007 26/4/95 6/96 9/01
Murray 3/06 2004 23/6/89 10/2007 11/03
Nedlands 13/4/06 18/4/85 8/2007
12/3/02 2006
25/11/03 25/7/06 7/5/04 Unknown
12/05 11/00 12/00
Peppermint Grove
2/8/96 5/2005
Perth 6/1/05 9/1/2004 12/2007
28/4/98 ?
28/4/98 ?
27/4/01 26/11/02
20/5/91 26/11/02
? ?
20/4/04 11/05 17/5/02 5/06 12/04
19/9/03
Rockingham 4/04 19/11/04
4/2007 8/05 2005 Serpentine-Jarrahdale 2/03 4/8/89 4/04 8/04
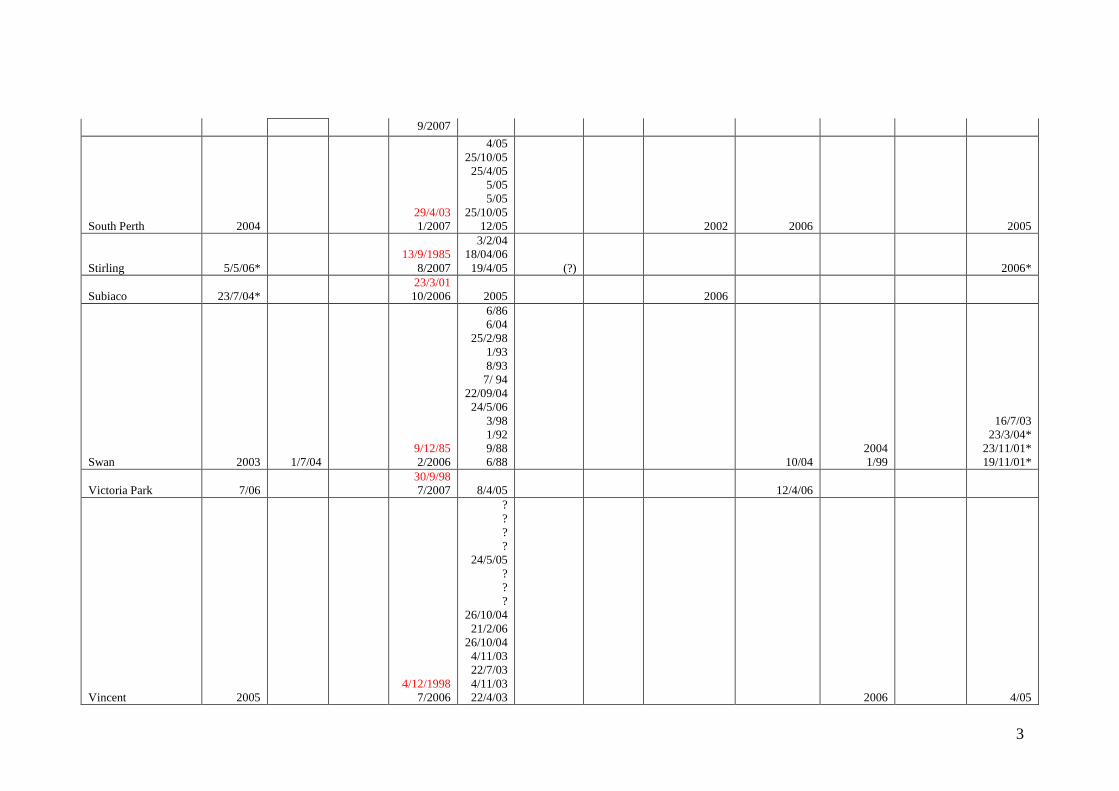
3
9/2007
South Perth 2004 29/4/03 1/2007
4/05 25/10/05
25/4/05 5/05 5/05
25/10/05 12/05 2002 2006 2005
Stirling 5/5/06* 13/9/1985
8/2007
3/2/04 18/04/06
19/4/05 (?) 2006*
Subiaco 23/7/04* 23/3/01 10/2006 2005 2006
Swan 2003 1/7/04 9/12/85 2/2006
6/86 6/04
25/2/98 1/93 8/93
7/ 94 22/09/04
24/5/06 3/98 1/92 9/88 6/88 10/04
2004 1/99
16/7/03 23/3/04*
23/11/01* 19/11/01*
Victoria Park 7/06 30/9/98 7/2007 8/4/05 12/4/06
Vincent 2005 4/12/1998
7/2006
? ? ? ?
24/5/05 ? ? ?
26/10/04 21/2/06
26/10/04 4/11/03 22/7/03 4/11/03 22/4/03 2006 4/05

4
The red date in the Local Planning Scheme column is the Gazetted date, while the black date is the last time that DPI received an amendment and electronically updated it. Amendments do not replace all content within the scheme.
13/9/05 7/10/03 26/8/03
Wanneroo 2006 6/7/2001
8/2006
27/6/06 14/12/04
27/6/06 1/9/04 7/6/05
14/12/04 9/8/05
14/12/04 9/06
14/12/04
2005 2005 2005

5
Appendix 2 LUTI Content Analysis Template
LUTI Considerations Local Government: DOCUMENT: Date
Policy Statement
Positive/ Negative
Page Comments Rating
A ACCESS: 1 The Network Interconnectedness to urban system 2 Balance of access - through-travel and travel to
3 Choice of transport options in close proximity 4 Activity function
Highly connected street network focussed on access to centres and transit stops
5 Well designed walkable catchments 6 High quality pedestrian experience 6a arterial roads have safe pedestrian facilities, on-road cycle lanes 7 Traffic
Management Lower traffic speeds,
8 Moderate traffic volumes, 9 Narrower streets 10 Effective traffic management 11 pedestrian priority 12 Service Integrated transport - easily accessible by all modes and interchange between these mode 13 In operational terms – timetabling;, , efficient public transport service to many destinations 14 In operational terms – easy to navigate system, 15 In operational terms – high frequency 16 In operational terms – reliable 17 In operational terms – efficient public transport service to many destinations 18 Safe, secure, convenient and comfortable stations, stops and interchanges 19 Accessible by people with disabilities, seniors, children, mothers with prams etc
20 Cycle friendly; secure cycle storage; connective networks of adequate capacity
21 Good business servicing opportunities LU LAND USE: 1 Land use
configuration Land use integrated with integrated transport
2 A robust urban form – Can adjust to changes in demand for transport and land use.
3 Greater diversity, vibrant mix of land uses within precincts

6
4 Greater diversity, vibrant mix of land uses and within buildings 5 High pedestrian trip generating uses at ground floor, housing above in close
proximity of transit stop;
6 Buildings oriented to station/streets/paths; 7 Active ground floor uses for surveillance; 8 Frontage development – human scale. 9 Density/Intensity
Highest residential density in close proximity to activities (but ensure includes family housing types);
10 Medium to high residential densities; 11 Proximity Compact cluster of related (compatible) activities (highly visited) in close proximity
(walking distance), clustered around rail station/high frequency bus stop;
12 More intensive/ high-medium density office, retail and other commercial uses (measured by high worker densities) within walking distance of transport facilities.
13 Parking car parking areas managed so pedestrian access, amenity and safety not compromised;
14 parking provided in shared structures rather than on individual sites; 15 car parking behind buildings not fronting street 16 Street parking 17 short-term parking but limited commuter parking; 18 Car-based retailing (drive-thru’) and light industry located on periphery of town with good
car access.
PP ‘PEOPLE PLACES’
1 Scale and Design human scale – less demand for 70kph scale advertising, more sense that cars are not the priority mode;
2 integration of character and scale of development within precinct; 3 respecting existing development (through retention or sympathetic redevelopment); 4 diversity of architectural styles; 5 Legible design – is easily understood for residents and visitors. 6 Amenity High amenity precincts – a place you want to go to – a destination in its own right. 7 Community/neighbourly feel – mixed ages – family friendly. 8 Good ‘people places’ – public open space, public seating, public art. 9 More social encounters due to more walking, cycling, use of public transport. 10 Busy places.

7
Appendix 3 Example Content Analysis – City of Fremantle Local Planning Scheme No. 4
LUTI Considerations Local Government: CITY OF FREMANTLE DOCUMENT: LOCAL PLANNING SCHEME No. 4 Date 8 MARCH 2007
Policy Statement Positive/ Negative
Page Comments Rating
A ACCESS: 1 The Network Interconnectedness to urban system 2 Balance of access -
through-travel and travel to
3 Choice of transport options in close proximity
(o) reduce reliance on, and the impact of, private motor vehicles,
positive 763 +1
4 Activity function
Highly connected street network focussed on access to centres and transit stops
5 Well designed walkable catchments 6 High quality pedestrian experience 6a arterial roads have safe pedestrian facilities,
on-road cycle lanes
7 Traffic Management Lower traffic speeds, 8 Moderate traffic volumes, 9 Narrower streets 10 Effective traffic management (m) promote management of regional traffic that contributes
positively to the community and landscape and minimises the impact of regional traffic flows, 6.5 O’Connor Industrial Interface Area 6.5.1 Purpose (e) To prevent, as far as practicable, the intrusion of commercial and industrial traffic into residential streets. 6.5.4 In considering applications for industrial and commercial buildings Council shall have regard to all of the following— design of vehicle ingress / egress to minimise traffi impacts including intrusion of commercial vehicles into adjoining residential streets, 10.2 Matters to be considered by the Council 10.2.1 The Council in considering an application for planning approval shall have due regard and
Positive Positive Positive
763 786 786
+1 +1 +1

8
may attach conditions relating to these, but not be limited to, such of the following matters as are in the opinion of the Council relevant to the use or development subject of the application— (x) whether the proposed means of access to and egress from the site are adequate and whether adequate provision has been made for the loading, unloading, manoeuvring and parking of vehicles, (y) the amount of traffic likely to be generated by the proposal, particularly in relation to the capacity of the road system in the locality and the probable effect on traffic flow and safety, (z) whether a road or right-of-way needs to be created or enlarged to service the proposed development, in which case the Council may require the dedication of such road or right-of way,
Positive 792 +1
11 pedestrian priority 12 Service Integrated transport - easily accessible by all
modes and interchange between these mode
(h) ensure that urban development can be adequately and efficiently serviced, (b) ensure the community has access to an adequate range of services and facilities, (q) encourage the use of public transport and promote Fremantle as a major public transport node,
Positive Positive Positive
763 763 763
+1 +1 +1
13 In operational terms – timetabling;, , efficient public transport service to many destinations
10.2 Matters to be considered by the Council 10.2.1 The Council in considering an application for planning approval shall have due regard and may attach conditions relating to these, but not be limited to, such of the following matters as are in the opinion of the Council relevant to the use or development subject of the application— (za) whether public transport services are necessary and, if so, whether they are available and adequate for the proposal,
Positive 792 +1
14 In operational terms – easy to navigate system,
15 In operational terms – high frequency 16 In operational terms – reliable 17 In operational terms – efficient public
transport service to many destinations
18 Safe, secure, convenient and comfortable stations, stops and interchanges
19 Accessible by people with disabilities, seniors, children, mothers with prams etc
(s) ensure universal access to buildings, spaces, services and facilities for all people,
Positive
764
+1
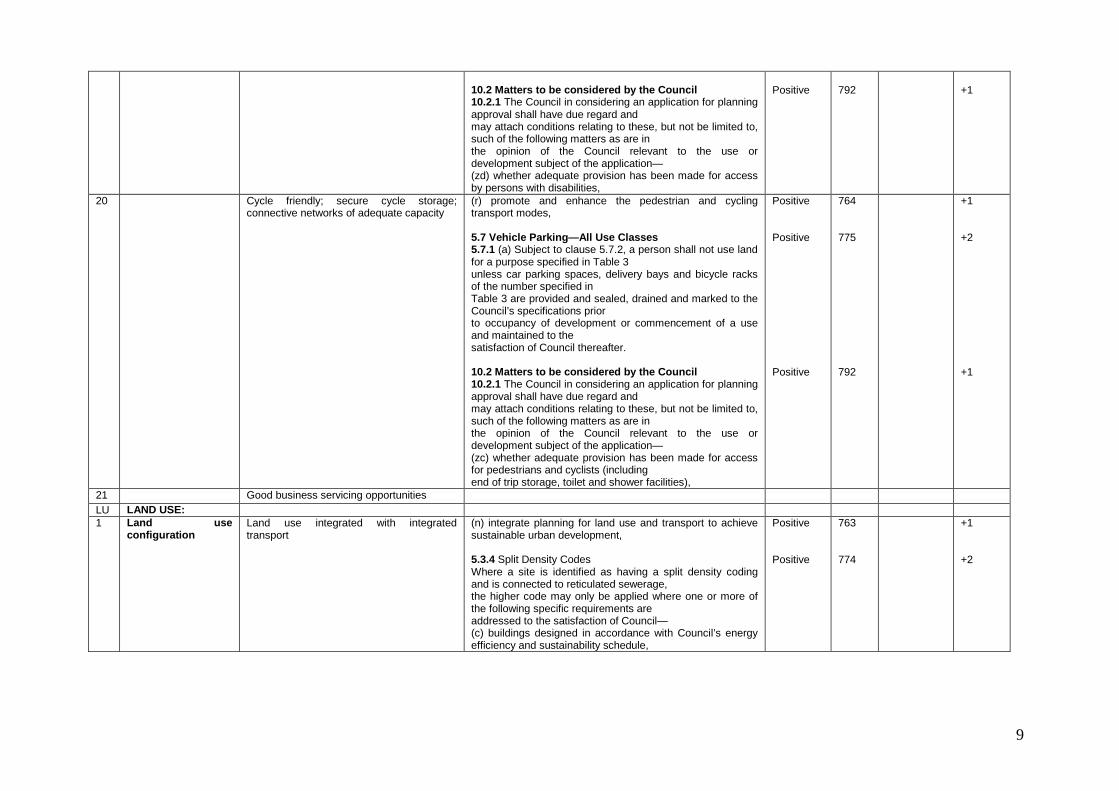
9
10.2 Matters to be considered by the Council 10.2.1 The Council in considering an application for planning approval shall have due regard and may attach conditions relating to these, but not be limited to, such of the following matters as are in the opinion of the Council relevant to the use or development subject of the application— (zd) whether adequate provision has been made for access by persons with disabilities,
Positive
792
+1
20 Cycle friendly; secure cycle storage; connective networks of adequate capacity
(r) promote and enhance the pedestrian and cycling transport modes, 5.7 Vehicle Parking—All Use Classes 5.7.1 (a) Subject to clause 5.7.2, a person shall not use land for a purpose specified in Table 3 unless car parking spaces, delivery bays and bicycle racks of the number specified in Table 3 are provided and sealed, drained and marked to the Council’s specifications prior to occupancy of development or commencement of a use and maintained to the satisfaction of Council thereafter. 10.2 Matters to be considered by the Council 10.2.1 The Council in considering an application for planning approval shall have due regard and may attach conditions relating to these, but not be limited to, such of the following matters as are in the opinion of the Council relevant to the use or development subject of the application— (zc) whether adequate provision has been made for access for pedestrians and cyclists (including end of trip storage, toilet and shower facilities),
Positive Positive Positive
764 775 792
+1 +2 +1
21 Good business servicing opportunities LU LAND USE: 1 Land use
configuration Land use integrated with integrated transport
(n) integrate planning for land use and transport to achieve sustainable urban development, 5.3.4 Split Density Codes Where a site is identified as having a split density coding and is connected to reticulated sewerage, the higher code may only be applied where one or more of the following specific requirements are addressed to the satisfaction of Council— (c) buildings designed in accordance with Council’s energy efficiency and sustainability schedule,
Positive Positive
763 774
+1 +2

10
2 A robust urban form – Can adjust to changes in demand for transport and land use.
(k) ensure urban form and development contribute to sustainability (environmental, social/cultural and economic),
Positive 763 +1
3 Greater diversity, vibrant mix of land uses within precincts
Development within the city centre zone shall— (i) provide for a full range of shopping, office, administrative, social, recreation, entertainment and community services, consistent with the region-serving role of the centre and including residential uses, and Development within the local centre zone shall— (i) provide for weekly and convenience retailing including small-scale shops, showrooms, cafes, restaurants, consulting rooms, entertainment, residential (at upper levels), recreation, open spaces, local offices, cottage industry, health, welfare and community facilities which serve the local community, consistent with the local—serving role of the centre, Development within the mixed use zone shall— (i) provide for a limited range of light, service and cottage industry, wholesaling, trade and professional services, small scale retailing of goods and services (ie. showrooms, cafes, restaurants, consulting rooms), small scale offices and administration, entertainment, residential at upper levels and recreation, Development within the commercial zone shall— (i) provide for the development of offices and associated commercial and larger scale uses, including showrooms, and warehouses and uses requiring outdoor displays, 5.4.3 Home Occupation, Home Business Application— (a) No person shall commence a home occupation or home business without first having applied for and received the planning approval of the Council. (b) A home occupation or home business approval is issued to the owner of the land and is not transferable. (c) On the sale of the property or change in ownership of the land subject of the home occupation or home business entitlement to this use ceases. 8.2 Permitted Development
Positive Positive Positive Positive Positive
768 768 769 769 774
+1 +1 +1 +1 +1

11
Except as otherwise provided in the Scheme, for the purposes of the Scheme the following development does not require the planning approval of the Council— (c) a home office,
Positive
788
+1
4 Greater diversity, vibrant mix of land uses and within buildings
5 High pedestrian trip generating uses at ground floor, housing above in close proximity of transit stop;
Development within the neighbourhood centre zone shall— (i) provide for the daily and convenience retailing, shops, café, office, administration and residential uses (at upper levels) which serve the local community and are located within and compatible with residential areas, 5.2.5 Residential density in the Local Centre, Neighbourhood Centre and Mixed Use zones may be increased up to R60, contingent on the ground floor development being restricted to non-residential uses and the residential uses being restricted to the first floor and above.
Positive 769 773
+1 +2
6 Buildings oriented to station/streets/paths; 7 Active ground floor uses for surveillance; 8 Frontage development – human scale. 9 Density/Intensity
Highest residential density in close proximity to activities (but ensure includes family housing types);
Development within the local centre zone shall (ii) encourage the provision of suitable and accessible services to residents of the locality, 6.5 O’Connor Industrial Interface Area 6.5.1 Purpose (c) To ensure the development of the South Street Local Centre as a vibrant community hub that serves the day-to-day needs of nearby residents.
Positive Positive
768 785
+1 +1
10 Medium to high residential densities; (c) provide greater housing choice to cater for a diverse and sustainable population, Development within the residential zone shall— (i) provide for residential uses at a range of densities with a variety of housing forms to meet the needs of different household types, while recognising the limitations on development necessary to protect local character, 5.2.4 Except in the Residential Development zone, where there is no Residential Design Code density applicable to land within the Scheme area, the provisions of clause 4.3 of the Residential Design Codes shall be applied as relevant.
Positive Positive Positive
763 768 773
+1 +1 +2
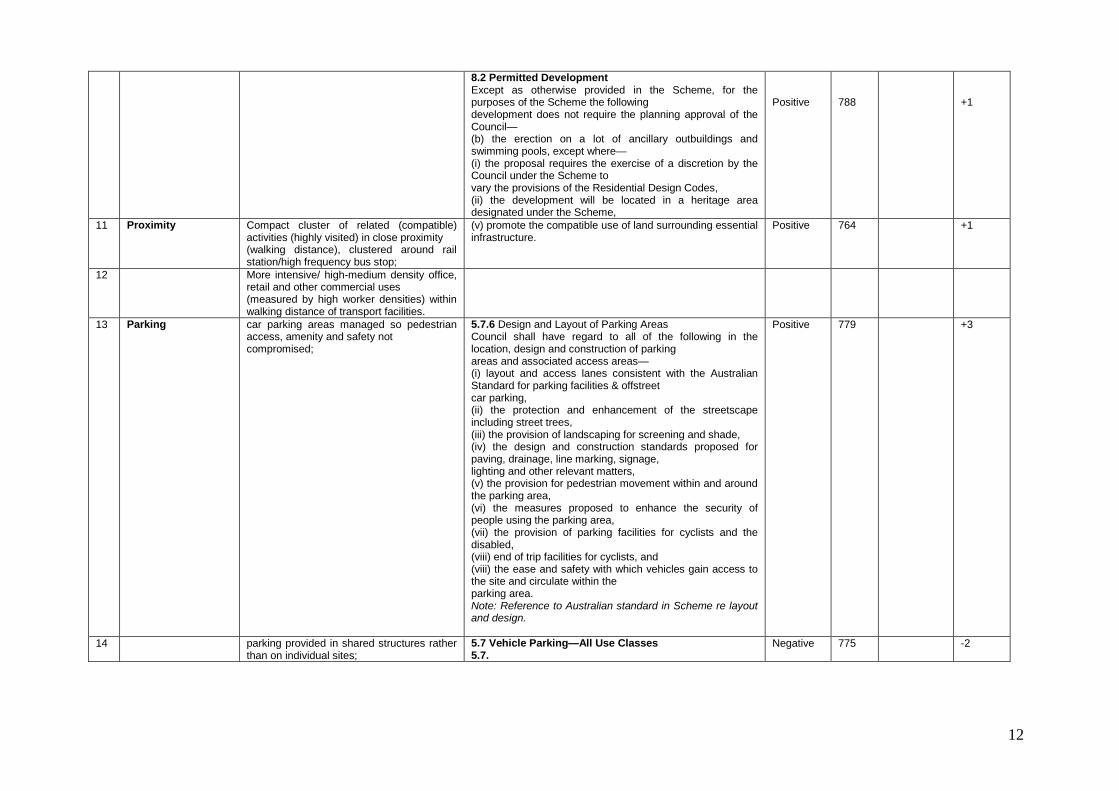
12
8.2 Permitted Development Except as otherwise provided in the Scheme, for the purposes of the Scheme the following development does not require the planning approval of the Council— (b) the erection on a lot of ancillary outbuildings and swimming pools, except where— (i) the proposal requires the exercise of a discretion by the Council under the Scheme to vary the provisions of the Residential Design Codes, (ii) the development will be located in a heritage area designated under the Scheme,
Positive
788
+1
11 Proximity Compact cluster of related (compatible) activities (highly visited) in close proximity (walking distance), clustered around rail station/high frequency bus stop;
(v) promote the compatible use of land surrounding essential infrastructure.
Positive 764 +1
12 More intensive/ high-medium density office, retail and other commercial uses (measured by high worker densities) within walking distance of transport facilities.
13 Parking car parking areas managed so pedestrian access, amenity and safety not compromised;
5.7.6 Design and Layout of Parking Areas Council shall have regard to all of the following in the location, design and construction of parking areas and associated access areas— (i) layout and access lanes consistent with the Australian Standard for parking facilities & offstreet car parking, (ii) the protection and enhancement of the streetscape including street trees, (iii) the provision of landscaping for screening and shade, (iv) the design and construction standards proposed for paving, drainage, line marking, signage, lighting and other relevant matters, (v) the provision for pedestrian movement within and around the parking area, (vi) the measures proposed to enhance the security of people using the parking area, (vii) the provision of parking facilities for cyclists and the disabled, (viii) end of trip facilities for cyclists, and (viii) the ease and safety with which vehicles gain access to the site and circulate within the parking area. Note: Reference to Australian standard in Scheme re layout and design.
Positive 779 +3
14 parking provided in shared structures rather than on individual sites;
5.7 Vehicle Parking—All Use Classes 5.7.
Negative
775
-2

13
(b) Where the floor area occupied by an existing use is increased, the parking requirement will be calculated on the basis of the floor area of the extension only or the area subject to the change of use of the site provided the existing number of car spaces is not reduced. (c) Where vehicle parking provisions are not prescribed for a particular use the requirement will be determined by the Council. Note requirement for sealing and draining of bays prior to occupancy. 5.7.3 Relaxation of Parking Requirements Council may— (a) Subject to the requirements of Schedule 12*, waive or reduce the standard parking requirement specified in Table 3 subject to the applicant satisfactorily justifying a reduction due to one or more of the following— (iii) any reduction in car parking demand due to the sharing of car spaces by multiple uses, either because of variation of car parking demand over time or because of efficiencies gained from the consolidation of shared car parking spaces, (iv) any car parking deficiency or surplus associated with the existing use of the land, (v) legal arrangements have been made in accordance with clause 5.7.4 for the parking or shared use of parking areas which are in the opinion of the Council satisfactory, (vi) any credit which should be allowed for a car parking demand deemed to have been provided in association with a use that existed before the change of parking requirement, (vi) the proposal involves the restoration of a heritage building or retention of a tree or trees worthy of preservation, (viii) any other relevant considerations. Note: *In some sub areas identified in Schedule 12 reduction of parking bays is not permitted. The requirements of Schedule 12 prevail over this clause. 5.7.4 Cash Payment in Lieu of Providing Car Parking Spaces The Council may require a cash payment in lieu of the provision of paved car parking spaces, subject to—
Positive Positive
778 778
+2 +3
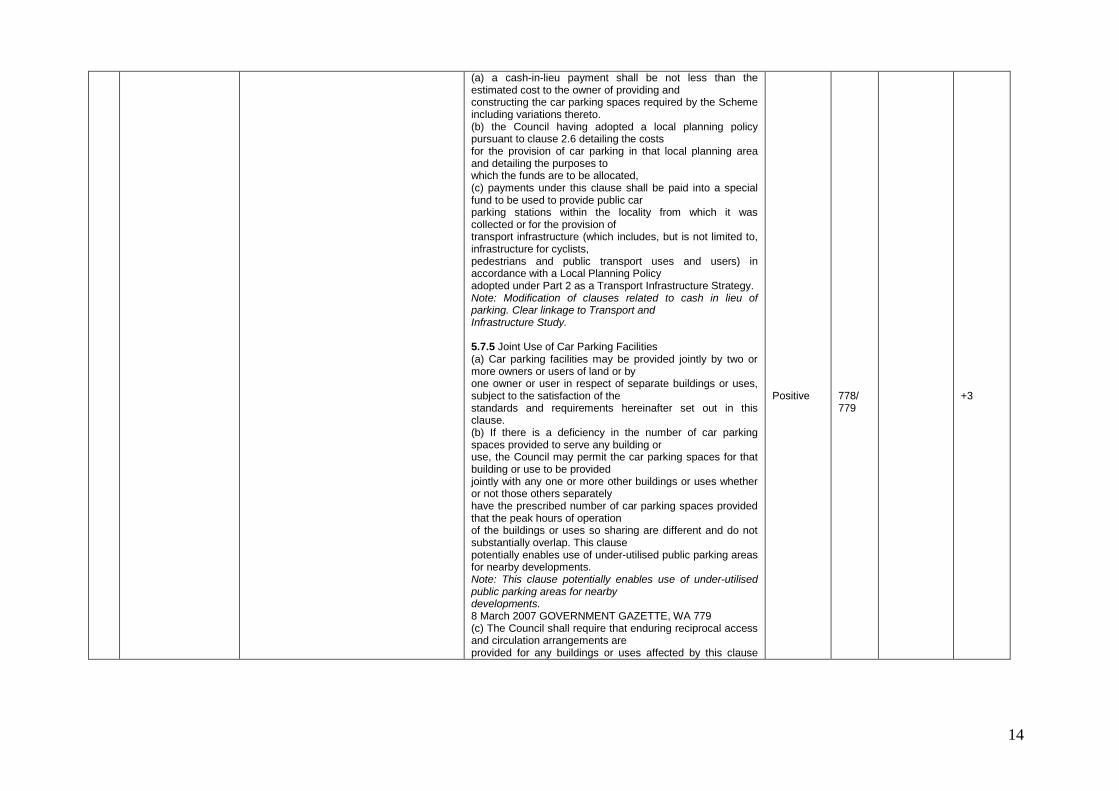
14
(a) a cash-in-lieu payment shall be not less than the estimated cost to the owner of providing and constructing the car parking spaces required by the Scheme including variations thereto. (b) the Council having adopted a local planning policy pursuant to clause 2.6 detailing the costs for the provision of car parking in that local planning area and detailing the purposes to which the funds are to be allocated, (c) payments under this clause shall be paid into a special fund to be used to provide public car parking stations within the locality from which it was collected or for the provision of transport infrastructure (which includes, but is not limited to, infrastructure for cyclists, pedestrians and public transport uses and users) in accordance with a Local Planning Policy adopted under Part 2 as a Transport Infrastructure Strategy. Note: Modification of clauses related to cash in lieu of parking. Clear linkage to Transport and Infrastructure Study. 5.7.5 Joint Use of Car Parking Facilities (a) Car parking facilities may be provided jointly by two or more owners or users of land or by one owner or user in respect of separate buildings or uses, subject to the satisfaction of the standards and requirements hereinafter set out in this clause. (b) If there is a deficiency in the number of car parking spaces provided to serve any building or use, the Council may permit the car parking spaces for that building or use to be provided jointly with any one or more other buildings or uses whether or not those others separately have the prescribed number of car parking spaces provided that the peak hours of operation of the buildings or uses so sharing are different and do not substantially overlap. This clause potentially enables use of under-utilised public parking areas for nearby developments. Note: This clause potentially enables use of under-utilised public parking areas for nearby developments. 8 March 2007 GOVERNMENT GAZETTE, WA 779 (c) The Council shall require that enduring reciprocal access and circulation arrangements are provided for any buildings or uses affected by this clause
Positive
778/ 779
+3
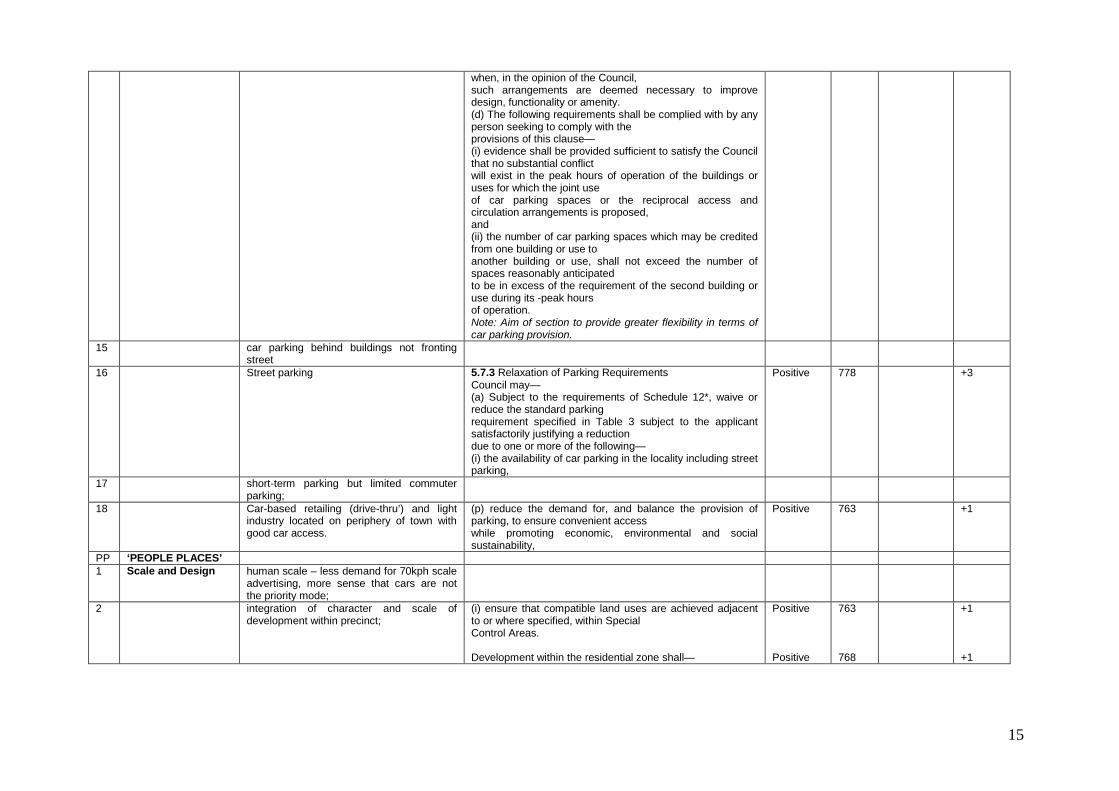
15
when, in the opinion of the Council, such arrangements are deemed necessary to improve design, functionality or amenity. (d) The following requirements shall be complied with by any person seeking to comply with the provisions of this clause— (i) evidence shall be provided sufficient to satisfy the Council that no substantial conflict will exist in the peak hours of operation of the buildings or uses for which the joint use of car parking spaces or the reciprocal access and circulation arrangements is proposed, and (ii) the number of car parking spaces which may be credited from one building or use to another building or use, shall not exceed the number of spaces reasonably anticipated to be in excess of the requirement of the second building or use during its -peak hours of operation. Note: Aim of section to provide greater flexibility in terms of car parking provision.
15 car parking behind buildings not fronting street
16 Street parking
5.7.3 Relaxation of Parking Requirements Council may— (a) Subject to the requirements of Schedule 12*, waive or reduce the standard parking requirement specified in Table 3 subject to the applicant satisfactorily justifying a reduction due to one or more of the following— (i) the availability of car parking in the locality including street parking,
Positive 778 +3
17 short-term parking but limited commuter parking;
18 Car-based retailing (drive-thru’) and light industry located on periphery of town with good car access.
(p) reduce the demand for, and balance the provision of parking, to ensure convenient access while promoting economic, environmental and social sustainability,
Positive 763 +1
PP ‘PEOPLE PLACES’ 1 Scale and Design human scale – less demand for 70kph scale
advertising, more sense that cars are not the priority mode;
2 integration of character and scale of development within precinct;
(i) ensure that compatible land uses are achieved adjacent to or where specified, within Special Control Areas. Development within the residential zone shall—
Positive Positive
763 768
+1 +1
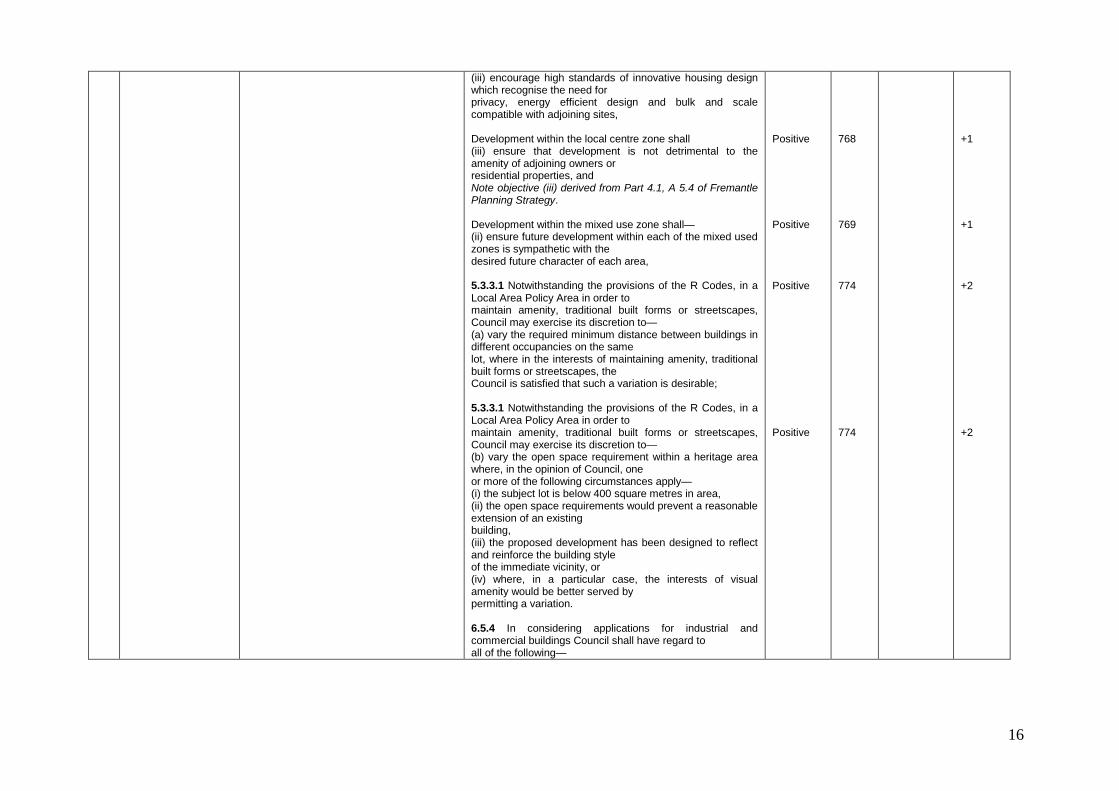
16
(iii) encourage high standards of innovative housing design which recognise the need for privacy, energy efficient design and bulk and scale compatible with adjoining sites, Development within the local centre zone shall (iii) ensure that development is not detrimental to the amenity of adjoining owners or residential properties, and Note objective (iii) derived from Part 4.1, A 5.4 of Fremantle Planning Strategy. Development within the mixed use zone shall— (ii) ensure future development within each of the mixed used zones is sympathetic with the desired future character of each area, 5.3.3.1 Notwithstanding the provisions of the R Codes, in a Local Area Policy Area in order to maintain amenity, traditional built forms or streetscapes, Council may exercise its discretion to— (a) vary the required minimum distance between buildings in different occupancies on the same lot, where in the interests of maintaining amenity, traditional built forms or streetscapes, the Council is satisfied that such a variation is desirable; 5.3.3.1 Notwithstanding the provisions of the R Codes, in a Local Area Policy Area in order to maintain amenity, traditional built forms or streetscapes, Council may exercise its discretion to— (b) vary the open space requirement within a heritage area where, in the opinion of Council, one or more of the following circumstances apply— (i) the subject lot is below 400 square metres in area, (ii) the open space requirements would prevent a reasonable extension of an existing building, (iii) the proposed development has been designed to reflect and reinforce the building style of the immediate vicinity, or (iv) where, in a particular case, the interests of visual amenity would be better served by permitting a variation. 6.5.4 In considering applications for industrial and commercial buildings Council shall have regard to all of the following—
Positive Positive Positive Positive
768 769 774 774
+1 +1 +2 +2

17
materials and finishes to complement the visual amenity o the area. 10.2 Matters to be considered by the Council 10.2.1 The Council in considering an application for planning approval shall have due regard and may attach conditions relating to these, but not be limited to, such of the following matters as are in the opinion of the Council relevant to the use or development subject of the application— (i) the compatibility of a use or development within its setting, (s) the way in which buildings relate to the street and adjoining lots, including their effects on landmarks, vistas, the landscape or the traditional streetscape, and on the privacy, daylight and sunlight available to private open space and buildings, (w) the relationship of the proposal to development on adjoining land or on other land in the locality including but not limited to, the likely effect of the height, bulk, scale, orientation and appearance of the proposal,
Positive Positive Positive
786 791 791
+1 +1 +1
3 respecting existing development (through retention or sympathetic redevelopment);
(f) protect and conserve Fremantle’s unique cultural heritage, (g) ensure all development complements and contributes to the community’s desired identity and character for Fremantle, Development within the residential zone shall— (ii) safeguard and enhance the amenity of residential areas and ensure that development, including alterations and additions, are sympathetic with the character of the area, Development within the residential zone shall— (v) conserve and enhance places of heritage significance the subject of or affected by the development, and Development within the residential zone shall— (vi) safeguard and enhance the amenity of residential areas by ensuring that land use is compatible with the character of the area. Development within the city centre zone shall—
Positive Positive Positive Positive Positive Positive
763 763 768 768 768 768
+1 +1 +1 +1 +1 +1
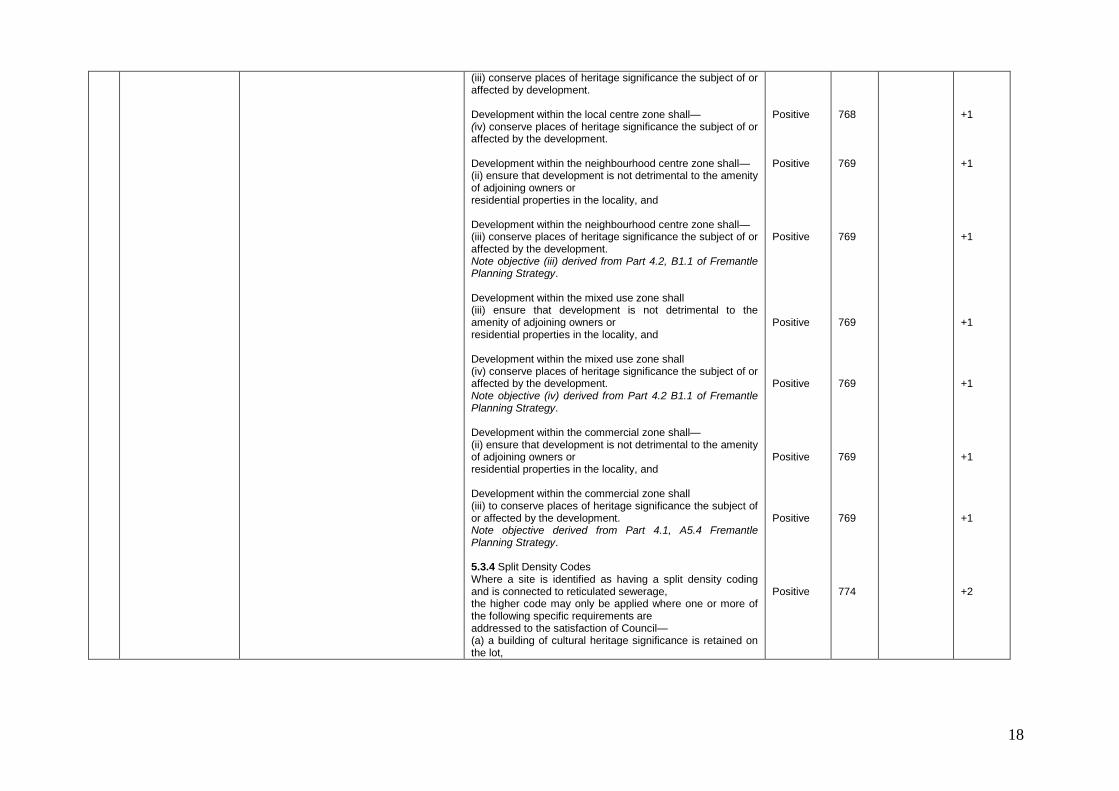
18
(iii) conserve places of heritage significance the subject of or affected by development. Development within the local centre zone shall— (iv) conserve places of heritage significance the subject of or affected by the development. Development within the neighbourhood centre zone shall— (ii) ensure that development is not detrimental to the amenity of adjoining owners or residential properties in the locality, and Development within the neighbourhood centre zone shall— (iii) conserve places of heritage significance the subject of or affected by the development. Note objective (iii) derived from Part 4.2, B1.1 of Fremantle Planning Strategy. Development within the mixed use zone shall (iii) ensure that development is not detrimental to the amenity of adjoining owners or residential properties in the locality, and Development within the mixed use zone shall (iv) conserve places of heritage significance the subject of or affected by the development. Note objective (iv) derived from Part 4.2 B1.1 of Fremantle Planning Strategy. Development within the commercial zone shall— (ii) ensure that development is not detrimental to the amenity of adjoining owners or residential properties in the locality, and Development within the commercial zone shall (iii) to conserve places of heritage significance the subject of or affected by the development. Note objective derived from Part 4.1, A5.4 Fremantle Planning Strategy. 5.3.4 Split Density Codes Where a site is identified as having a split density coding and is connected to reticulated sewerage, the higher code may only be applied where one or more of the following specific requirements are addressed to the satisfaction of Council— (a) a building of cultural heritage significance is retained on the lot,
Positive Positive Positive Positive Positive Positive Positive Positive
768 769 769 769 769 769 769 774
+1 +1 +1 +1 +1 +1 +1 +2
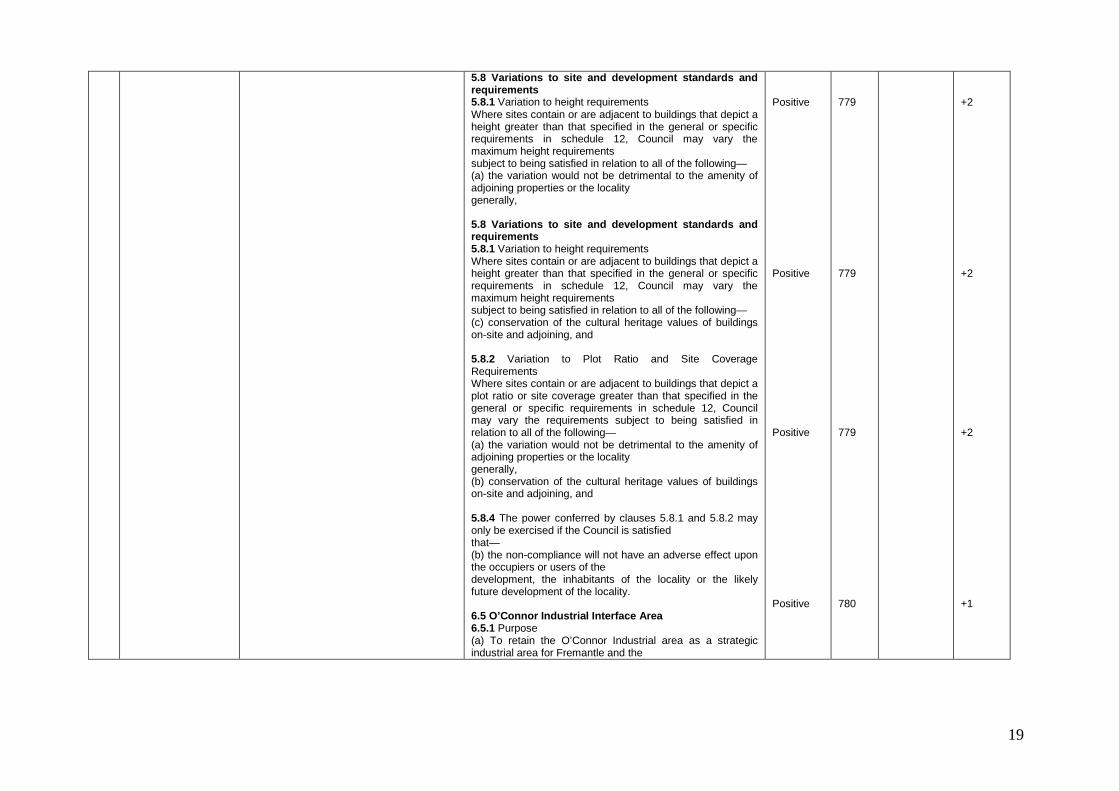
19
5.8 Variations to site and development standards and requirements 5.8.1 Variation to height requirements Where sites contain or are adjacent to buildings that depict a height greater than that specified in the general or specific requirements in schedule 12, Council may vary the maximum height requirements subject to being satisfied in relation to all of the following— (a) the variation would not be detrimental to the amenity of adjoining properties or the locality generally, 5.8 Variations to site and development standards and requirements 5.8.1 Variation to height requirements Where sites contain or are adjacent to buildings that depict a height greater than that specified in the general or specific requirements in schedule 12, Council may vary the maximum height requirements subject to being satisfied in relation to all of the following— (c) conservation of the cultural heritage values of buildings on-site and adjoining, and 5.8.2 Variation to Plot Ratio and Site Coverage Requirements Where sites contain or are adjacent to buildings that depict a plot ratio or site coverage greater than that specified in the general or specific requirements in schedule 12, Council may vary the requirements subject to being satisfied in relation to all of the following— (a) the variation would not be detrimental to the amenity of adjoining properties or the locality generally, (b) conservation of the cultural heritage values of buildings on-site and adjoining, and 5.8.4 The power conferred by clauses 5.8.1 and 5.8.2 may only be exercised if the Council is satisfied that— (b) the non-compliance will not have an adverse effect upon the occupiers or users of the development, the inhabitants of the locality or the likely future development of the locality. 6.5 O’Connor Industrial Interface Area 6.5.1 Purpose (a) To retain the O’Connor Industrial area as a strategic industrial area for Fremantle and the
Positive Positive Positive Positive
779 779 779 780
+2 +2 +2 +1

20
South-West metropolitan region and to ensure that development contributes to high standard of amenity and design as well as compatibility with adjacent residential uses. (b) To retain existing residential areas as predominantly low density residential, with access to suitable open space and protection of amenity from adjoining industrial uses. 7.1 Heritage List 7.1.1 The Council is to establish and maintain a Heritage List to identify those places within the Scheme area which are of cultural heritage significance and worthy of conservation under the provisions of the Scheme, together with a description of each place and the reasons for its entry. Note: The Municipal Heritage Inventory established under the previous town planning scheme is to comprise the heritage list under this scheme, in accordance with the provisions of clause 7.1.7. 10.2 Matters to be considered by the Council 10.2.1 The Council in considering an application for planning approval shall have due regard and may attach conditions relating to these, but not be limited to, such of the following matters as are in the opinion of the Council relevant to the use or development subject of the application— (h) the conservation of any place that has been entered in the Register within the meaning of the Heritage of Western Australia Act 1990, or which is included in the Heritage of Western Australia Act 1990, and the effect of the proposal on the character or appearance of the heritage area,
Positive Positive Positive
785 786 791
+1 +3 +1
4 diversity of architectural styles; 5 Legible design – is easily understood for
residents and visitors.
6 Amenity High amenity precincts – a place you want to go to – a destination in its own right.
(h) develop diverse and attractive local centres that provide a community focus for neighbourhood areas, (i) develop a diverse and attractive city centre that functions as a town centre and a regional centre, 10.2 Matters to be considered by the Council 10.2.1 The Council in considering an application for planning
Positive Positive
763 791
+1 +1
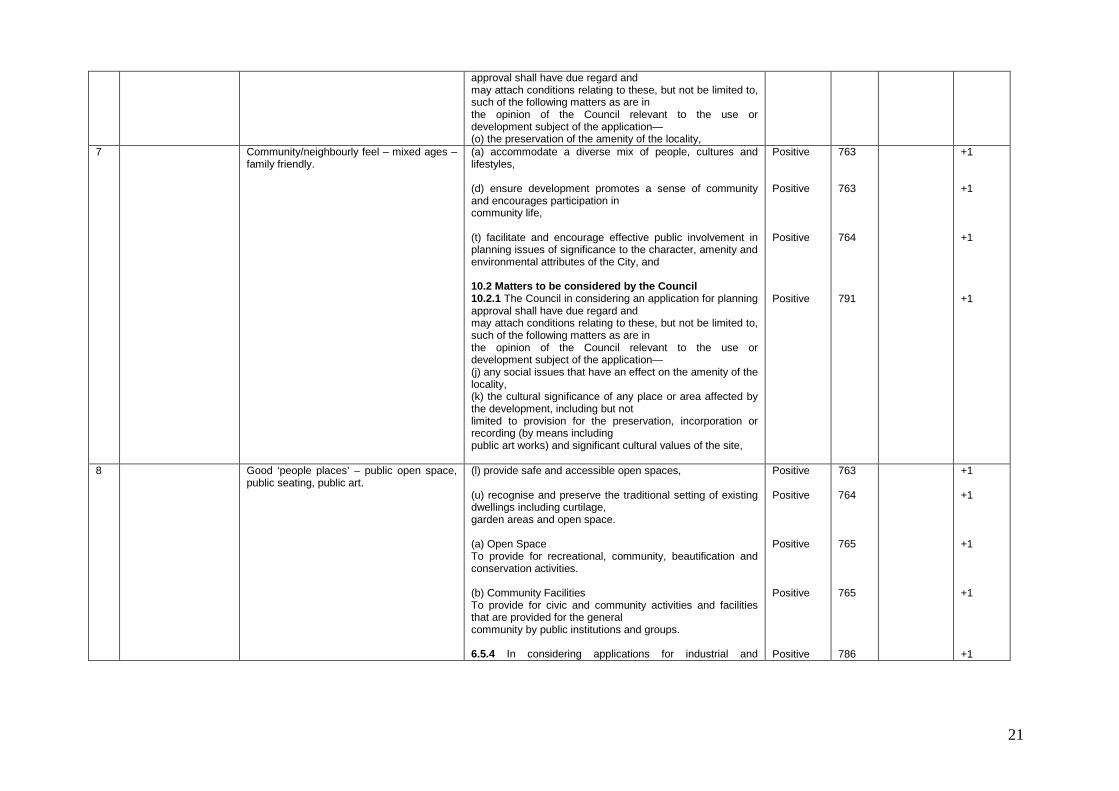
21
approval shall have due regard and may attach conditions relating to these, but not be limited to, such of the following matters as are in the opinion of the Council relevant to the use or development subject of the application— (o) the preservation of the amenity of the locality,
7 Community/neighbourly feel – mixed ages – family friendly.
(a) accommodate a diverse mix of people, cultures and lifestyles, (d) ensure development promotes a sense of community and encourages participation in community life, (t) facilitate and encourage effective public involvement in planning issues of significance to the character, amenity and environmental attributes of the City, and 10.2 Matters to be considered by the Council 10.2.1 The Council in considering an application for planning approval shall have due regard and may attach conditions relating to these, but not be limited to, such of the following matters as are in the opinion of the Council relevant to the use or development subject of the application— (j) any social issues that have an effect on the amenity of the locality, (k) the cultural significance of any place or area affected by the development, including but not limited to provision for the preservation, incorporation or recording (by means including public art works) and significant cultural values of the site,
Positive Positive Positive Positive
763 763 764 791
+1 +1 +1 +1
8 Good ‘people places’ – public open space, public seating, public art.
(l) provide safe and accessible open spaces, (u) recognise and preserve the traditional setting of existing dwellings including curtilage, garden areas and open space. (a) Open Space To provide for recreational, community, beautification and conservation activities. (b) Community Facilities To provide for civic and community activities and facilities that are provided for the general community by public institutions and groups. 6.5.4 In considering applications for industrial and
Positive Positive Positive Positive Positive
763 764 765 765 786
+1 +1 +1 +1 +1
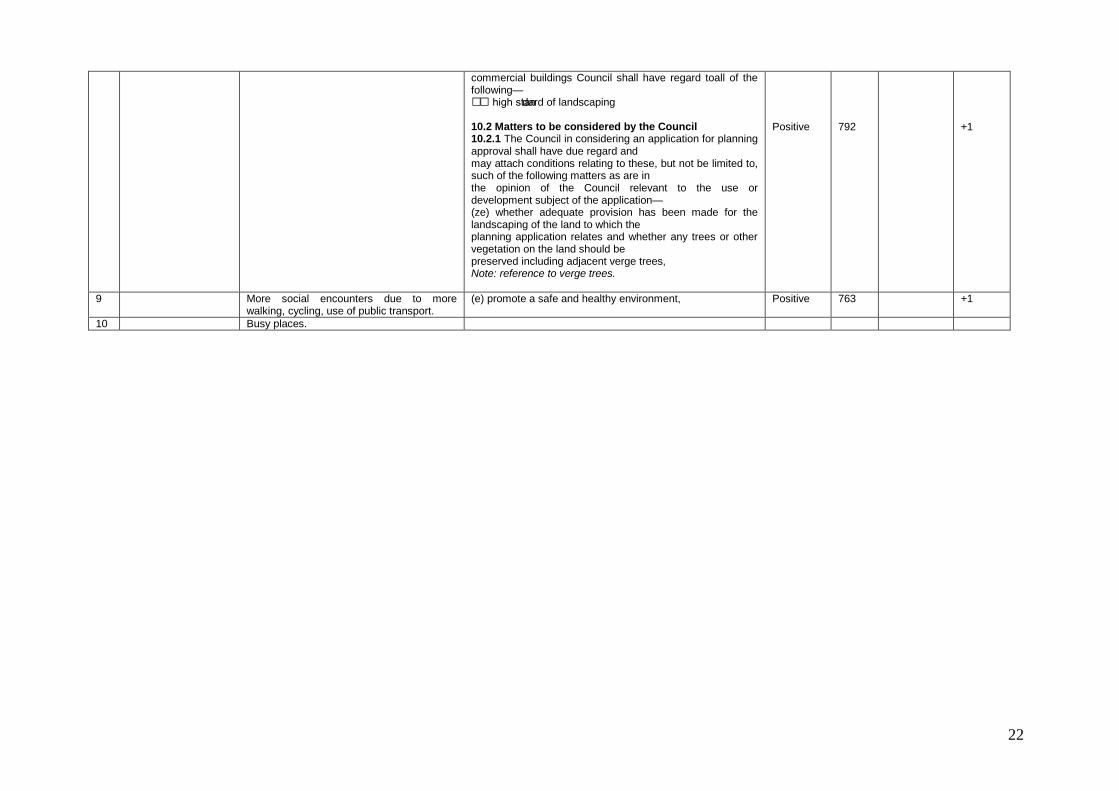
22
commercial buildings Council shall have regard toall of the following— high standard of landscaping 10.2 Matters to be considered by the Council 10.2.1 The Council in considering an application for planning approval shall have due regard and may attach conditions relating to these, but not be limited to, such of the following matters as are in the opinion of the Council relevant to the use or development subject of the application— (ze) whether adequate provision has been made for the landscaping of the land to which the planning application relates and whether any trees or other vegetation on the land should be preserved including adjacent verge trees, Note: reference to verge trees.
Positive
792
+1
9 More social encounters due to more walking, cycling, use of public transport.
(e) promote a safe and healthy environment, Positive 763 +1
10 Busy places.

23
Appendix 4: Local Government Profiles
(Source: http://www.councils.wa.gov.au/directory/council_websites/)
Local government
Location Population Number of Employees
Date local planning scheme was first drafted
Date of local planning strategy (if Present
Date of Local transport strategy (if Present
Date of Local Bike Plan (if present
Sustainable Transport Coalition Membership
Armadale Outer 50535 298 2005 2005 No Bassendean Middle 13463 112 1983 2008 Yes Bayswater Middle 55801 311 2004 No Belmont Middle 30331 175 1999 1999 No Cambridge Middle 23753 86 1998 No Canning Middle 77305 395 1994 2001 1999 No Claremont Inner 8942 42 1999 No Cockburn Middle 74472 330 2002 1999 Yes Cottesloe Inner 7256 38 1998 No East Fremantle Inner 6697 45 2004 2004 No Fremantle Inner 24835 422 2007 2007 2007 2003 No Gosnells Outer 91579 470 2002 No Joondalup Outer 149673 500 2000 No Kalamunda Outer 49534 176 2007 No Kwinana Outer 23198 103 1992 1992 No Mandurah Outer 55815 160 1999 Yes Melville Middle 93003 454 1999 1998 Yes Mosman Park Inner 8251 44 1999 No Mundaring Outer 35097 145 1994 No Murray Outer 11969 67 1989 No Nedlands Inner 20335 124 1985 2006 Yes Peppermint Grove Inner 1580 18 1996 No Perth Inner 11573 480 2004 Yes Rockingham Outer 84307 307 2004 2007 2007 No Serpentine-Jarrahdale Outer 12889 68 1989 No South Perth Outer 39361 206 2003 2006 Yes Stirling Middle 176872 789 1985 Yes Subiaco Inner 16380 133 2001 2007 Yes Swan Outer 93279 442 1985 Yes Victoria Park Inner 27955 137 1998 No Vincent Inner 26878 183 1998 No Wanneroo Outer 110940 490 2001 No

24
Appendix 5: Summary of Perth state and local policy document analysis by positive, negative or mixed reference to LUTI Criteria
State Policy Documents - Strategic A1 A2 A3 A4 A5 A6 A7 A8 A9 A10 A11 A12 A13 A14 A15 A16 A17 A18 A19 A20 A21 L1 L2 L3 L4 L5 L6 L7 L8 L9 L10 L11 L12 L13 L14 L15 L16 L17 L18 P1 P2 P3 P4 P5 P6 P7 P8 P9 P10
State Planning Strategy 1 1 1 1 1 1
Metropolitan Transport Strategy 1 1 1 1 1 1 1 1 1 1 1 1 1 1 1 1 1 1 1 1 1 1 1 1 1 1 1 1 1
Network City 1 1 1 1 1 1 1 1 1 1 1 1 1 1 1 1 1 1 1 1 1 1 1 1 1 1 1 1 1 1 1 1 1
MetroPlan 1990 1 3 1 1 1 1 1 1 1 1 3 1 1 1 2 1 1 1 1 1
State Policy Documents - Statutory
A1 A2 A3 A4 A5 A6 A7 A8 A9 A10 A11 A12 A13 A14 A15 A16 A17 A18 A19 A20 A21 L1 L2 L3 L4 L5 L6 L7 L8 L9 L10 L11 L12 L13 L14 L15 L16 L17 L18 P1 P2 P3 P4 P5 P6 P7 P8 P9 P10
Liveable Neighbourhoods 1 1 1 1 1 1 1 1 1 1 1 1 1 1 1 1 1 1 1 1 1 1 1 1 1 1 1 1 1 1 1
WAPC SPP 3 Urban Growth Settlement 1 1 1 1 1 1 1 1 1 1 1 1 1 1 1
WAPC DC 1.5 Bicycle Planning 3 1 1 1
WAPC DC 1.6 TOD 1 1 1 1 1 1 1 1 1 1 1 1 1 1 1 1 1 1 1 1 1 1 1
WAPC DC 2.6 Residential Road Planning 1 3 3 1 1 1 3 1 1 3 1 1 1 1 1
Local Planning Schemes
A1 A2 A3 A4 A5 A6 A7 A8 A9 A10 A11 A12 A13 A14 A15 A16 A17 A18 A19 A20 A21 L1 L2 L3 L4 L5 L6 L7 L8 L9 L10 L11 L12 L13 L14 L15 L16 L17 L18 P1 P2 P3 P4 P5 P6 P7 P8 P9 P10
Armadale 1 1 1 1 1 1 1 1 1 3 1 1 1 1 1 1 1 1 1
Bassendean 1 1 1 1 1 1 1 1 1 1 1 1 2 1 1 1 1 1 1 1
Bayswater 3 1 2 2 1 1 1 1 1 1 1 2 3 3 2 1 1 1 1 1
Belmont 1 1 2 1 1 1 1 1 1 3 1 3 3 1 1 1 1 1 1 1 1 1
Cambridge 1 1 2 1 2 3 1 1 1 1 1 1
Canning 1 1 1 1 1 1 1 1 1 1 3 3 2 1 1 1 2 1 1 1
Claremont 2 1 1 1 3 1 1 1 2 3 1 2 2 1 1 1 1 1 1
Cockburn 1 1 1 1 1 1 1 1 3 1 1 1 1 1 1
Cottesloe 1 1 1 1 1 1 1 1 1 1 1
East Fremantle 1 1 1 1 1 3 1 3 1 1 1 1 1 1 1 1 1 1
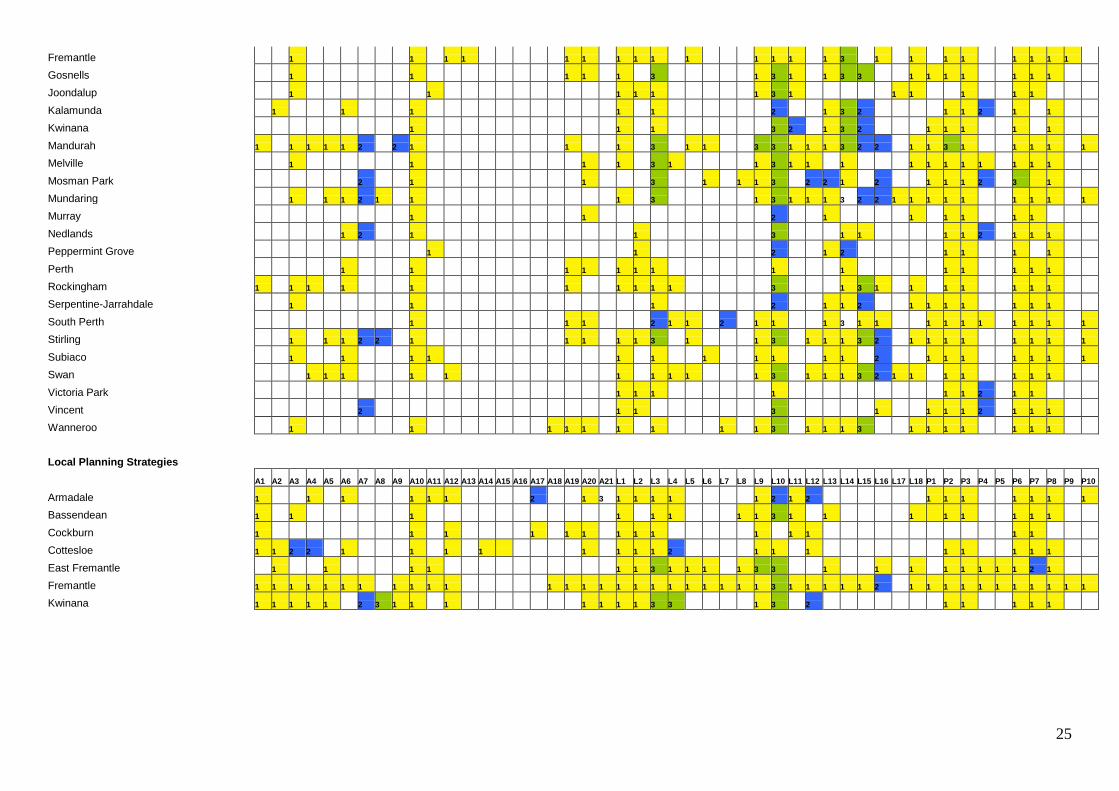
25
Fremantle 1 1 1 1 1 1 1 1 1 1 1 1 1 1 3 1 1 1 1 1 1 1 1
Gosnells 1 1 1 1 1 3 1 3 1 1 3 3 1 1 1 1 1 1 1
Joondalup 1 1 1 1 1 1 3 1 1 1 1 1 1
Kalamunda 1 1 1 1 1 2 1 3 2 1 1 2 1 1
Kwinana 1 1 1 3 2 1 3 2 1 1 1 1 1
Mandurah 1 1 1 1 1 2 2 1 1 1 3 1 1 3 3 1 1 1 3 2 2 1 1 3 1 1 1 1 1
Melville 1 1 1 1 3 1 1 3 1 1 1 1 1 1 1 1 1 1 1
Mosman Park 2 1 1 3 1 1 1 3 2 2 1 2 1 1 1 2 3 1
Mundaring 1 1 1 2 1 1 1 3 1 3 1 1 1 3 2 2 1 1 1 1 1 1 1 1 1
Murray 1 1 2 1 1 1 1 1 1
Nedlands 1 2 1 1 3 1 1 1 1 2 1 1 1
Peppermint Grove 1 1 2 1 2 1 1 1 1
Perth 1 1 1 1 1 1 1 1 1 1 1 1 1 1
Rockingham 1 1 1 1 1 1 1 1 1 1 3 1 3 1 1 1 1 1 1 1
Serpentine-Jarrahdale 1 1 1 2 1 1 2 1 1 1 1 1 1 1
South Perth 1 1 1 2 1 1 2 1 1 1 3 1 1 1 1 1 1 1 1 1 1
Stirling 1 1 1 2 2 1 1 1 1 1 3 1 1 3 1 1 1 3 2 1 1 1 1 1 1 1 1
Subiaco 1 1 1 1 1 1 1 1 1 1 1 2 1 1 1 1 1 1 1
Swan 1 1 1 1 1 1 1 1 1 1 3 1 1 1 3 2 1 1 1 1 1 1 1
Victoria Park 1 1 1 1 1 1 2 1 1
Vincent 2 1 1 3 1 1 1 1 2 1 1 1
Wanneroo 1 1 1 1 1 1 1 1 1 3 1 1 1 3 1 1 1 1 1 1 1
Local Planning Strategies
A1 A2 A3 A4 A5 A6 A7 A8 A9 A10 A11 A12 A13 A14 A15 A16 A17 A18 A19 A20 A21 L1 L2 L3 L4 L5 L6 L7 L8 L9 L10 L11 L12 L13 L14 L15 L16 L17 L18 P1 P2 P3 P4 P5 P6 P7 P8 P9 P10
Armadale 1 1 1 1 1 1 2 1 3 1 1 1 1 1 2 1 2 1 1 1 1 1 1 1
Bassendean 1 1 1 1 1 1 1 1 3 1 1 1 1 1 1 1 1
Cockburn 1 1 1 1 1 1 1 1 1 1 1 1 1 1
Cottesloe 1 1 2 2 1 1 1 1 1 1 1 1 2 1 1 1 1 1 1 1 1
East Fremantle 1 1 1 1 1 1 3 1 1 1 1 3 3 1 1 1 1 1 1 1 1 2 1
Fremantle 1 1 1 1 1 1 1 1 1 1 1 1 1 1 1 1 1 1 1 1 1 1 1 1 3 1 1 1 1 1 2 1 1 1 1 1 1 1 1 1 1 1
Kwinana 1 1 1 1 1 2 3 1 1 1 1 1 1 1 3 3 1 3 2 1 1 1 1 1

26
Local Transport Strategies
A1 A2 A3 A4 A5 A6 A7 A8 A9 A10 A11 A12 A13 A14 A15 A16 A17 A18 A19 A20 A21 L1 L2 L3 L4 L5 L6 L7 L8 L9 L10 L11 L12 L13 L14 L15 L16 L17 L18 P1 P2 P3 P4 P5 P6 P7 P8 P9 P10
Fremantle 1 1 1 1 1 1 1 1 1 1 1 1 1 1 1 1 1 1 1 1 1 1
Nedlands 1 1 1 1 1 1 1 1 1 1 1 1
Rockingham 1 1 2 1 1 1 1 1 1 3 1 1 1 1 1 1 1 1 1
South Perth 1 1 1 1 1 1 1 1 1 1 1 1 1 1 1 1 1 1 1 1 1 1 1 1 1 1
Subiaco 1 1 1 1 1 1 1 1 1 1 1 1 1 1 1 1 1 1 1
Local Bike Plans
A1 A2 A3 A4 A5 A6 A7 A8 A9 A10 A11 A12 A13 A14 A15 A16 A17 A18 A19 A20 A21 L1 L2 L3 L4 L5 L6 L7 L8 L9 L10 L11 L12 L13 L14 L15 L16 L17 L18 P1 P2 P3 P4 P5 P6 P7 P8 P9 P10
Canning 1 1 1 1 1
Fremantle 1 1 1 1 1 1
Melville 1 1
Rockingham 1 1 1
Key Document includes one or more statements that meet LUTI Criterion Document includes one or more statements that work against the LUTI criterion Document includes some statements that meet LUTI criterion and some that work against it

27
Appendix 6 Summary of Perth state and local policy document analysis by highest rating score for each LUTI criterion
State Policy Documents - Strategic
A1 A2 A3 A4 A5 A6 A7 A8 A9 A10 A11 A12 A13 A14 A15 A16 A17 A18 A19 A20 A21 L1 L2 L3 L4 L5 L6 L7 L8 L9 L10 L11 L12 L13 L14 L15 L16 L17 L18 P1 P2 P3 P4 P5 P6 P7 P8 P9 P10 State Planning Strategy 2 2 1 2 2 1 Metropolitan Transport Strategy 2 3 3 1 2 2 2 2 2 1 2 1 2 1 1 3 3 3 3 1 3 1 3 2 2 3 3 1 1 Network City 2 3 2 2 2 2 1 1 2 2 2 2 2 2 1 2 2 1 3 1 2 2 2 3 1 1 1 3 1 2 3 1 MetroPlan 1990 2 0 2 1 2 1 2 1 1 2 2 2 1 1 -1 2 3 1 2 2 State Policy Documents - Statutory A1 A2 A3 A4 A5 A6 A7 A8 A9 A10 A11 A12 A13 A14 A15 A16 A17 A18 A19 A20 A21 L1 L2 L3 L4 L5 L6 L7 L8 L9 L10 L11 L12 L13 L14 L15 L16 L17 L18 P1 P2 P3 P4 P5 P6 P7 P8 P9 P10 Liveable Neighbourhoods 3 2 1 3 3 3 3 2 2 2 1 1 2 2 3 3 2 2 2 3 3 3 1 1 3 2 2 2 3 3 2 WAPC SPP 3 Urban Growth Settlement 1 2 2 2 2 2 1 1 2 1 2 2 1 1 1 WAPC DC 1.5 Bicycle Planning 2 1 2 3 WAPC DC 1.6 TOD 3 3 3 3 3 2 3 3 3 3 3 3 3 2 3 2 1 2 1 3 3 2 1 WAPC DC 2.6 Residential Road Planning 3 2 1 2 2 1 1 2 1 1 1 1 1 3 1 Local Planning Schemes
A1 A2 A3 A4 A5 A6 A7 A8 A9 A10 A11 A12 A13 A14 A15 A16 A17 A18 A19 A20 A21 L1 L2 L3 L4 L5 L6 L7 L8 L9 L10 L11 L12 L13 L14 L15 L16 L17 L18 P1 P2 P3 P4 P5 P6 P7 P8 P9 P10 Armadale 1 3 1 1 1 3 1 1 1 2 1 3 3 3 1 3 1 1 3 Bassendean 1 1 1 2 1 1 1 1 2 1 2 3 -2 1 2 1 1 1 1 1 Bayswater 2 2 -2 -1 1 1 3 3 2 3 3 -2 2 2 -3 3 3 2 1 3 Belmont 2 1 -2 2 1 2 3 3 3 3 3 2 0 2 3 3 3 2 3 3 3 3 Cambridge 1 1 -2 1 -1 2 1 3 1 1 1 1 Canning 2 3 2 1 2 2 2 1 2 1 3 -3 -3 2 3 1 -2 2 2 2 Claremont -3 1 2 3 2 3 2 3 -3 2 2 -2 -2 3 3 3 3 2 2 Cockburn 1 1 1 1 1 1 3 1 2 1 1 3 1 1 1 Cottesloe 1 1 1 1 1 1 1 1 1 1 1 East Fremantle 1 1 1 1 1 1 3 2 1 2 3 3 2 3 3 1 1 2 Fremantle 1 1 1 1 1 2 2 1 1 2 1 2 1 3 3 3 1 2 3 1 1 1 1 Gosnells 1 1 3 2 1 1 1 1 1 2 1 3 1 1 1 3 1 1 2 Joondalup 1 1 1 1 1 1 1 1 1 1 1 1 1 Kalamunda 1 2 3 1 1 -1 2 2 -3 1 3 -2 2 1 Kwinana 1 2 2 1 2 1 2 -1 2 1 1 2 2 Mandurah 1 1 1 1 2 -1 -3 1 1 1 1 2 2 1 1 1 1 2 3 -1 -1 1 1 1 3 3 1 2 1 Melville 3 1 3 1 3 2 1 2 2 1 2 1 2 1 3 1 1 1 3 Mosman Park -1 1 1 2 1 1 3 2 -1 -1 2 -1 1 1 3 1 1 Mundaring 1 1 1 -1 1 1 1 1 1 1 1 1 1 2 -2 -1 2 1 1 1 3 1 1 3 1 Murray 1 1 -1 1 1 1 3 1 1 Nedlands 1 -1 1 1 1 2 1 1 3 -1 1 1 1 Peppermint Grove 1 1 -3 1 -2 1 3 1 1 Perth 2 1 1 1 1 1 1 2 2 2 3 3 1 2 Rockingham 1 1 2 2 1 1 1 1 1 2 1 3 2 2 1 2 1 1 1 3 Serpentine-Jarrahdale 1 1 3 -1 2 3 -2 1 1 2 3 1 1 3 South Perth 1 1 2 -1 2 2 -1 1 2 2 2 2 1 1 2 3 1 1 1 3 1 Stirling 1 1 3 -1 -1 1 1 1 1 1 2 2 3 3 1 1 3 1 -3 1 1 1 3 2 1 2 1 Subiaco 1 1 1 1 1 1 1 1 2 1 3 -1 2 2 3 1 1 3 1 Swan 1 1 1 1 1 1 1 1 2 1 2 1 1 3 1 -1 1 3 2 3 1 1 2 Victoria Park 1 1 1 2 3 2 -2 1 1 Vincent -1 1 1 3 1 1 1 3 -2 1 1 1

28
Wanneroo 1 1 1 1 2 1 1 1 1 1 3 1 2 1 1 3 1 3 1 1 2 Local Planning Strategies
A1 A2 A3 A4 A5 A6 A7 A8 A9 A10 A11 A12 A13 A14 A15 A16 A17 A18 A19 A20 A21 L1 L2 L3 L4 L5 L6 L7 L8 L9 L10 L11 L12 L13 L14 L15 L16 L17 L18 P1 P2 P3 P4 P5 P6 P7 P8 P9 P10 Armadale 2 1 1 1 2 2 -1 2 0 3 1 2 1 2 -1 2 -1 2 1 1 1 1 2 1 Bassendean 1 1 1 2 2 1 1 1 2 1 2 2 2 1 2 1 2 Cockburn 2 1 1 2 2 2 2 1 2 2 2 2 1 1 Cottesloe 1 1 -1 -1 1 2 1 1 1 1 2 1 -1 2 3 1 1 1 1 1 2 East Fremantle 2 1 2 2 3 1 2 2 2 1 2 2 2 2 2 1 2 3 1 1 1 -1 2 Fremantle 2 1 1 1 1 1 1 2 2 3 1 1 2 1 1 1 1 2 2 2 2 2 1 2 2 2 1 2 3 2 -1 1 1 2 1 1 1 2 2 1 1 1 Kwinana 1 2 1 2 1 -1 1 2 2 1 1 2 1 2 1 2 2 2 0 2 2 1 1 2 Local Transport Strategies
A1 A2 A3 A4 A5 A6 A7 A8 A9 A10 A11 A12 A13 A14 A15 A16 A17 A18 A19 A20 A21 L1 L2 L3 L4 L5 L6 L7 L8 L9 L10 L11 L12 L13 L14 L15 L16 L17 L18 P1 P2 P3 P4 P5 P6 P7 P8 P9 P10 Fremantle 1 3 2 2 2 1 1 2 2 2 2 1 3 3 3 2 1 1 1 1 2 1 Nedlands 1 2 2 1 2 2 2 1 1 2 1 1 Rockingham 2 1 -1 1 2 1 3 1 3 2 1 2 1 2 2 1 1 1 2 South Perth 1 2 1 3 1 3 2 2 3 2 2 2 3 3 2 1 3 1 3 2 1 1 2 2 1 1 Subiaco 3 1 2 1 2 2 1 2 1 1 2 2 1 1 2 2 1 2 1 Local Bike Plans A1 A2 A3 A4 A5 A6 A7 A8 A9 A10 A11 A12 A13 A14 A15 A16 A17 A18 A19 A20 A21 L1 L2 L3 L4 L5 L6 L7 L8 L9 L10 L11 L12 L13 L14 L15 L16 L17 L18 P1 P2 P3 P4 P5 P6 P7 P8 P9 P10 Canning 3 2 3 2 3 Fremantle 3 2 1 3 2 3 Melville 3 2 Rockingham 2 1 1
Key 3 Strongly meets LUTI criterion 2 Meets LUTI criterion 1 Weakly meets LUTI criterion
0 Neither meets nor works against LUTI criterion
-1 Weakly works against LUTI criterion -2 Works against LUTI criterion -3 Strongly works against LUTi criterion

29
Appendix 7 Representation of LUTI Criteria in local government planning
schemes by location
Number of positive, negative and mixed references to LUTI Access Critera (n=21) in Local Planning Schemes by LGA location (inner, middle, outer)
0
1
2
3
4
5
6
7
8
Clarem
ont (I
)Cott
esloe
(I)
East F
reman
tle(I)
Freman
tle(I)
Mosman
Park
(I)Ned
lands
(I)
Peppe
rmint
Grov
e (I)
Perth (
I)Sub
iaco (
I)
Victori
a Park
(I)Vinc
ent (I
)
Basse
ndea
n (M)
Baysw
ater (
M)Belm
ont (M
)
Cambri
dge (
M)Can
ning (
M)
Cockb
urn (M
)Melv
ille (M
)
South
Perth (
M) Stirl
ing (M
)
Armad
ale(O
)Gos
nells
(O)
Joon
dalup
(O)
Kalamun
da (O
)
Kwinana
(O)
Mandu
rah (O
)
Munda
ring (
O)Murr
ay (O
)
Rockin
gham
(O)
Serpen
tine-J
arrah
dale
(O)
Swan (O
)
Wan
neroo
(O)
LGA (I=innter, M=middle, O=outer)
posnegmix
Number of positive, negative and mixed references to LUTI Landuse Critera in Local Planning Schemes by LGA location (inner, middle, outer)
0
2
4
6
8
10
12
Clarem
ont (I
)
Cottes
loe(I)
East F
reman
tle(I)
Freman
tle(I)
Mosman
Park
(I)
Nedlan
ds (I)
Peppe
rmint
Grov
e (I)
Perth (
I)
Subiac
o (I)
Victori
a Park
(I)
Vincen
t (I)
Basse
ndea
n (M)
Baysw
ater (
M)
Belmon
t (M)
Cambri
dge (
M)
Cannin
g (M)
Cockb
urn (M
)
Melville
(M)
South
Perth (
M)
Stirling
(M)
Armad
ale(O
)
Gosne
lls(O)
Joon
dalup
(O)
Kalamun
da (O
)
Kwinana
(O)
Mandu
rah (O
)
Munda
ring (
O)
Murray
(O)
Rockin
gham
(O)
Serpen
tine-J
arrah
dale
(O)
Swan (O
)
Wan
neroo
(O)
LGA (I=inner, M=Middle, O=outer)
PosNegMix
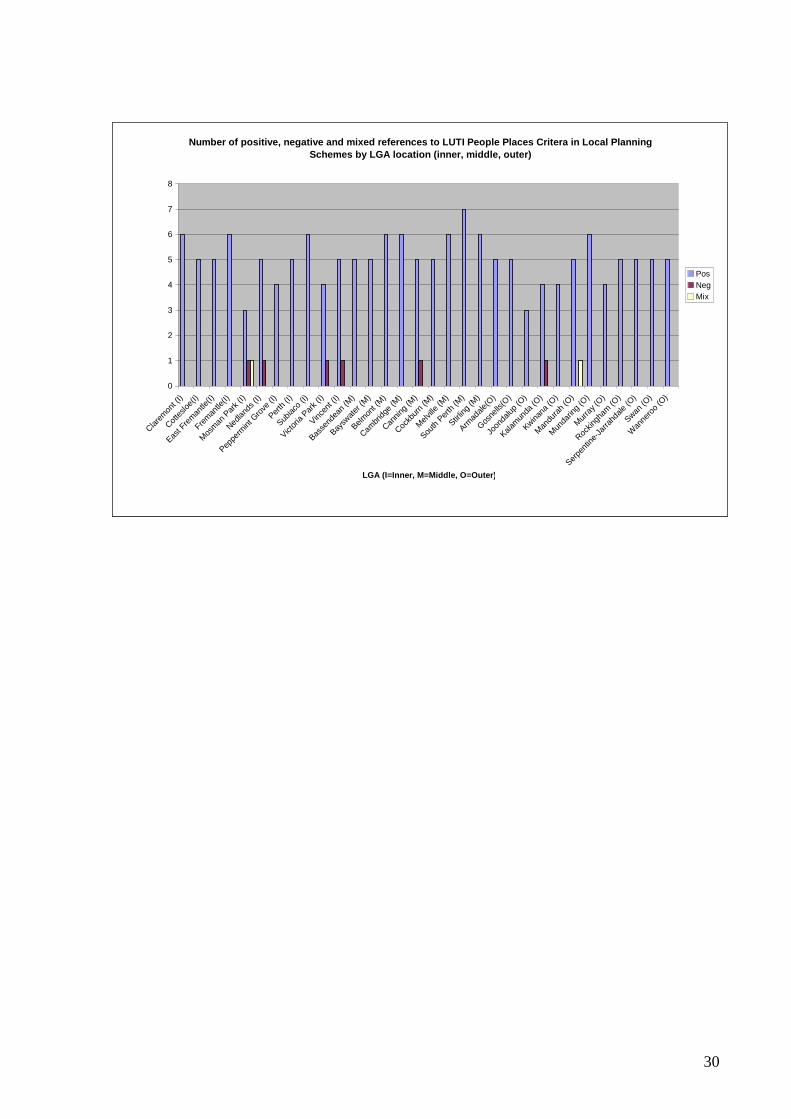
30
Number of positive, negative and mixed references to LUTI People Places Critera in Local Planning
Schemes by LGA location (inner, middle, outer)
0
1
2
3
4
5
6
7
8
Clarem
ont (I
)
Cottes
loe(I)
East F
reman
tle(I)
Freman
tle(I)
Mosman
Park
(I)
Nedlan
ds (I)
Peppe
rmint
Grov
e (I)
Perth (
I)
Subiac
o (I)
Victori
a Park
(I)
Vincen
t (I)
Basse
ndea
n (M)
Baysw
ater (
M)
Belmon
t (M)
Cambri
dge (
M)
Cannin
g (M)
Cockb
urn (M
)
Melville
(M)
South
Perth (
M)
Stirling
(M)
Armad
ale(O
)
Gosne
lls(O)
Joon
dalup
(O)
Kalamun
da (O
)
Kwinana
(O)
Mandu
rah (O
)
Munda
ring (
O)
Murray
(O)
Rockin
gham
(O)
Serpen
tine-J
arrah
dale
(O)
Swan (O
)
Wan
neroo
(O)
LGA (I=Inner, M=Middle, O=Outer)
PosNegMix

31
Appendix 8 Representation of LUTI criteria in local government planning
schemes by LGA population
Number of positve, negative, mixed reference to LUTI access critera by LGA population
0
1
2
3
4
5
6
7
8
Peppe
rmint
Grov
e (15
80)
East F
reman
tle (6
697)
Cottes
loe (7
256)
Mosman
Park
(825
1)
Clarem
ont (8
942)
Perth (
1157
3)
Murray
(119
69)
Serpen
tine-J
arrah
dale
(1288
9)
Basse
ndea
n (13
463)
Subiac
o (16
380)
Nedlan
ds (2
0335
)
Kwinana
(231
98)
Cambri
dge (
2375
3)
Freman
tle (2
4835
)
Vincen
t (268
76)
Victori
a Park
(279
55)
Belmon
t (303
31)
Munda
ring (
3509
7)
South
Perth (
3936
1)
Kalamun
da (4
9534
)
Armad
ale (5
0535
)
Baysw
ater (
5580
1)
Mandu
rah (5
5815
)
Cockb
urn (7
4472
)
Cannin
g (77
305)
Rockin
gham
(843
07)
Gosne
lls (91
579)
Melville
(930
03)
Swan (9
3279
)
Wan
neroo
(110
940)
Joon
dalup
(149
673)
Stirling
(176
872)
LGA (population)
posnegmix
Number of positive, negative, mixed reference to LUTI land use criteria by LGA population
0
2
4
6
8
10
12
Peppe
rmint
Grov
e (15
80)
East F
reman
tle (6
697)
Cottes
loe (7
256)
Mosman
Park
(825
1)
Clarem
ont (8
942)
Perth (
1157
3)
Murray
(119
69)
Serpen
tine-J
arrah
dale
(1288
9)
Basse
ndea
n (13
463)
Subiac
o (16
380)
Nedlan
ds (2
0335
)
Kwinana
(231
98)
Cambri
dge (
2375
3)
Freman
tle (2
4835
)
Vincen
t (268
76)
Victori
a Park
(279
55)
Belmon
t (303
31)
Munda
ring (
3509
7)
South
Perth (
3936
1)
Kalamun
da (4
9534
)
Armad
ale (5
0535
)
Baysw
ater (
5580
1)
Mandu
rah (5
5815
)
Cockb
urn (7
4472
)
Cannin
g (77
305)
Rockin
gham
(843
07)
Gosne
lls (91
579)
Melville
(930
03)
Swan (9
3279
)
Wan
neroo
(110
940)
Joon
dalup
(149
673)
Stirling
(176
872)
LGA (population)
PosNegMix
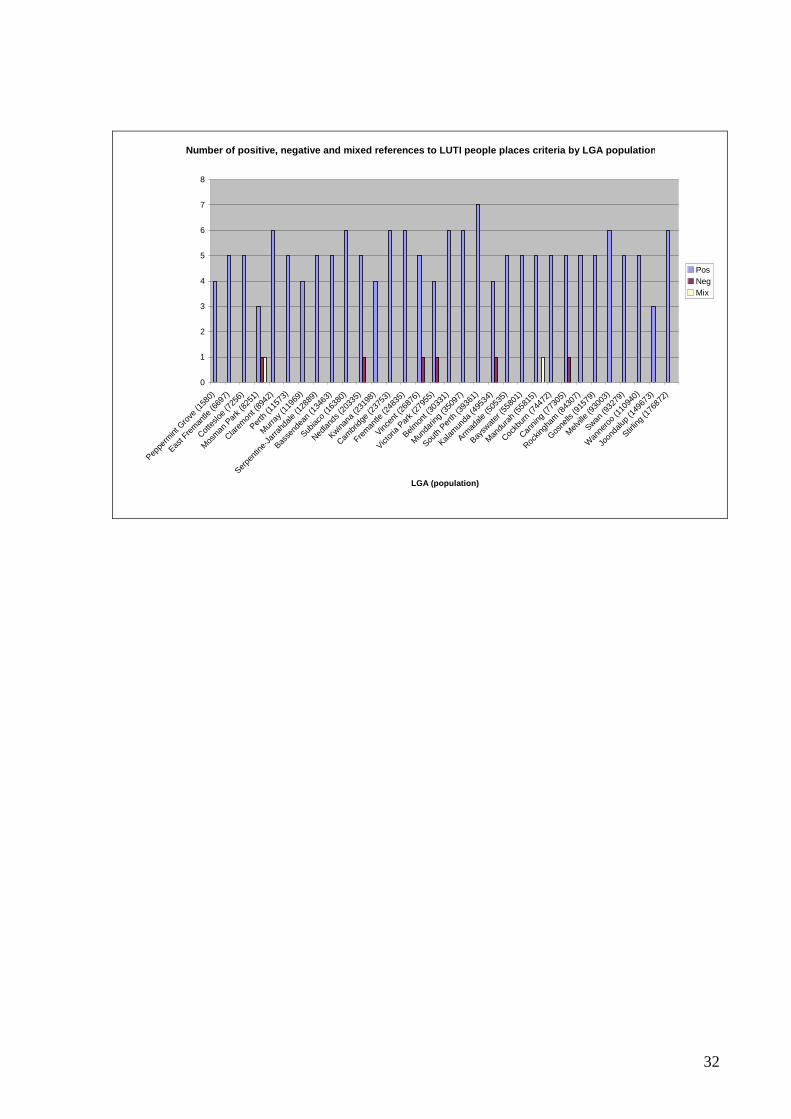
32
Number of positive, negative and mixed references to LUTI people places criteria by LGA population
0
1
2
3
4
5
6
7
8
Peppe
rmint
Grov
e (15
80)
East F
reman
tle (6
697)
Cottes
loe (7
256)
Mosman
Park
(825
1)
Clarem
ont (8
942)
Perth (
1157
3)
Murray
(119
69)
Serpen
tine-J
arrah
dale
(1288
9)
Basse
ndea
n (13
463)
Subiac
o (16
380)
Nedlan
ds (2
0335
)
Kwinana
(231
98)
Cambri
dge (
2375
3)
Freman
tle (2
4835
)
Vincen
t (268
76)
Victori
a Park
(279
55)
Belmon
t (303
31)
Munda
ring (
3509
7)
South
Perth (
3936
1)
Kalamun
da (4
9534
)
Armad
ale (5
0535
)
Baysw
ater (
5580
1)
Mandu
rah (5
5815
)
Cockb
urn (7
4472
)
Cannin
g (77
305)
Rockin
gham
(843
07)
Gosne
lls (91
579)
Melville
(930
03)
Swan (9
3279
)
Wan
neroo
(110
940)
Joon
dalup
(149
673)
Stirling
(176
872)
LGA (population)
PosNegMix

33
Appendix 9 Representation of LUTI Criteria in local government planning
schemes by number of employees
Number of positive, negative, and mixed references to LUTI access criteria by number of employees
0
1
2
3
4
5
6
7
8
Peppe
rmint
Grov
e (18
)
Cottes
loe (3
8)
Clarem
ont (4
2)
Mosman
Park
(44)
East F
reman
tle (4
5)
Murray
(67)
Serpen
tine-J
arrah
dale
(68)
Cambri
dge (
86)
Kwinana
(103
)
Basse
ndea
n (11
2)
Nedlan
ds (1
24)
Subiac
o (13
3)
Victori
a Park
(137
)
Munda
ring (
145)
Mandu
rah (1
60)
Belmon
t (175
)
Kalamun
da (1
76)
Vincen
t (183
)
South
Perth (
206)
Armad
ale (2
98)
Rockin
gham
(307
)
Baysw
ater(3
11)
Cockb
urn (3
30)
Cannin
g (39
5)
Freman
tle (4
22)
Swan (4
42)
Melville
(454
)
Gosne
lls (47
0)
Perth (
480)
Wan
neroo
(490
)
Joon
dalup
(500
)
Stirling
(789
)
LGA (number of employees)
posnegmix
Number of positive, negative and mixed references to LUTI land use criteria by number of employees
0
2
4
6
8
10
12
Peppe
rmint
Grov
e (18
)
Cottes
loe (3
8)
Clarem
ont (4
2)
Mosman
Park
(44)
East F
reman
tle (4
5)
Murray
(67)
Serpen
tine-J
arrah
dale
(68)
Cambri
dge (
86)
Kwinana
(103
)
Basse
ndea
n (11
2)
Nedlan
ds (1
24)
Subiac
o (13
3)
Victori
a Park
(137
)
Munda
ring (
145)
Mandu
rah (1
60)
Belmon
t (175
)
Kalamun
da (1
76)
Vincen
t (183
)
South
Perth (
206)
Armad
ale (2
98)
Rockin
gham
(307
)
Baysw
ater(3
11)
Cockb
urn (3
30)
Cannin
g (39
5)
Freman
tle (4
22)
Swan (4
42)
Melville
(454
)
Gosne
lls (47
0)
Perth (
480)
Wan
neroo
(490
)
Joon
dalup
(500
)
Stirling
(789
)
LGA (number of employees)
PosNegMix
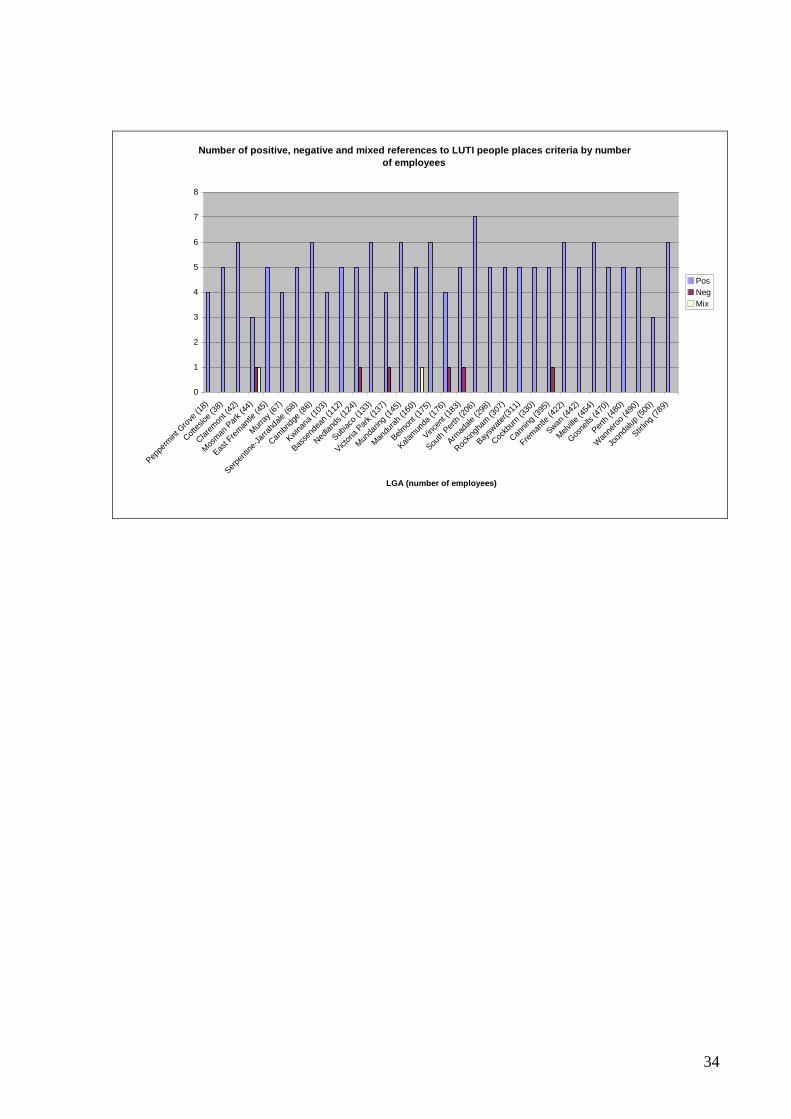
34
Number of positive, negative and mixed references to LUTI people places criteria by number of employees
0
1
2
3
4
5
6
7
8
Peppe
rmint
Grov
e (18
)
Cottes
loe (3
8)
Clarem
ont (4
2)
Mosman
Park
(44)
East F
reman
tle (4
5)
Murray
(67)
Serpen
tine-J
arrah
dale
(68)
Cambri
dge (
86)
Kwinana
(103
)
Basse
ndea
n (11
2)
Nedlan
ds (1
24)
Subiac
o (13
3)
Victori
a Park
(137
)
Munda
ring (
145)
Mandu
rah (1
60)
Belmon
t (175
)
Kalamun
da (1
76)
Vincen
t (183
)
South
Perth (
206)
Armad
ale (2
98)
Rockin
gham
(307
)
Baysw
ater(3
11)
Cockb
urn (3
30)
Cannin
g (39
5)
Freman
tle (4
22)
Swan (4
42)
Melville
(454
)
Gosne
lls (47
0)
Perth (
480)
Wan
neroo
(490
)
Joon
dalup
(500
)
Stirling
(789
)
LGA (number of employees)
PosNegMix

35
Appendix 10 Representation of LUTI Criteria in local government planning
schemes by year in which the local planning scheme was first drafted
Number of positive, negative and mixed reference to LUTI Access Critera by year in which the local planning scheme was first drafted
0
1
2
3
4
5
6
7
8
Basse
ndea
n(198
3)
Nedlan
ds (1
985)
Stirling
(198
5)
Swan (1
985)
Murray
1989
)
Serpen
tine-J
arrah
dale
(1989
)
Kwinana
(199
2)
Cannin
g (19
94)
Munda
ring (
1994
)
Peppe
rmint
Grov
e (19
96)
Cottes
loe (1
998)
Victori
a Park
(199
8)
Vincen
t (199
8)
Cambri
dge (
1998
)
Clarem
ont (1
999)
Mosman
Park
(199
9)
Belmon
t (199
9)
Melville
(199
9)
Mandu
rah (1
999)
Joon
dalup
(200
0)
Subiac
o (20
01)
Wan
neroo
(200
1)
Cockb
urn (2
002)
Gosne
lls (20
02)
South
Perth (
2003
)
East F
reman
tle (2
004)
Perth (
2004
)
Baysw
ater (
2004
)
Rockin
gham
(200
4)
Armad
ale (2
005)
Freman
tle (2
007)
Kalamun
da (2
007)
LGA (year scheme drafted)
posnegmix

36
Number of positive, negative and mixed reference to LUTI Land Use critera by year in which the local planning scheme was first drafted
0
2
4
6
8
10
12
Basse
ndea
n(198
3)
Nedlan
ds (1
985)
Stirling
(198
5)
Swan (1
985)
Murray
1989
)
Serpen
tine-J
arrah
dale
(1989
)
Kwinana
(199
2)
Cannin
g (19
94)
Munda
ring (
1994
)
Peppe
rmint
Grov
e (19
96)
Cottes
loe (1
998)
Victori
a Park
(199
8)
Vincen
t (199
8)
Cambri
dge (
1998
)
Clarem
ont (1
999)
Mosman
Park
(199
9)
Belmon
t (199
9)
Melville
(199
9)
Mandu
rah (1
999)
Joon
dalup
(200
0)
Subiac
o (20
01)
Wan
neroo
(200
1)
Cockb
urn (2
002)
Gosne
lls (20
02)
South
Perth (
2003
)
East F
reman
tle (2
004)
Perth (
2004
)
Baysw
ater (
2004
)
Rockin
gham
(200
4)
Armad
ale (2
005)
Freman
tle (2
007)
Kalamun
da (2
007)
LGA (year scheme drafted)
PosNegMix
Number of positive, negative and mixed reference to LUTI People places critera by year in which the local planning scheme was first drafted
0
1
2
3
4
5
6
7
8
Basse
ndea
n(198
3)
Nedlan
ds (1
985)
Stirling
(198
5)
Swan (1
985)
Murray
1989
)
Serpen
tine-J
arrah
dale
(1989
)
Kwinana
(199
2)
Cannin
g (19
94)
Munda
ring (
1994
)
Peppe
rmint
Grov
e (19
96)
Cottes
loe (1
998)
Victori
a Park
(199
8)
Vincen
t (199
8)
Cambri
dge (
1998
)
Clarem
ont (1
999)
Mosman
Park
(199
9)
Belmon
t (199
9)
Melville
(199
9)
Mandu
rah (1
999)
Joon
dalup
(200
0)
Subiac
o (20
01)
Wan
neroo
(200
1)
Cockb
urn (2
002)
Gosne
lls (20
02)
South
Perth (
2003
)
East F
reman
tle (2
004)
Perth (
2004
)
Baysw
ater (
2004
)
Rockin
gham
(200
4)
Armad
ale (2
005)
Freman
tle (2
007)
Kalamun
da (2
007)
LGA (year scheme drafted(
PosNegMix
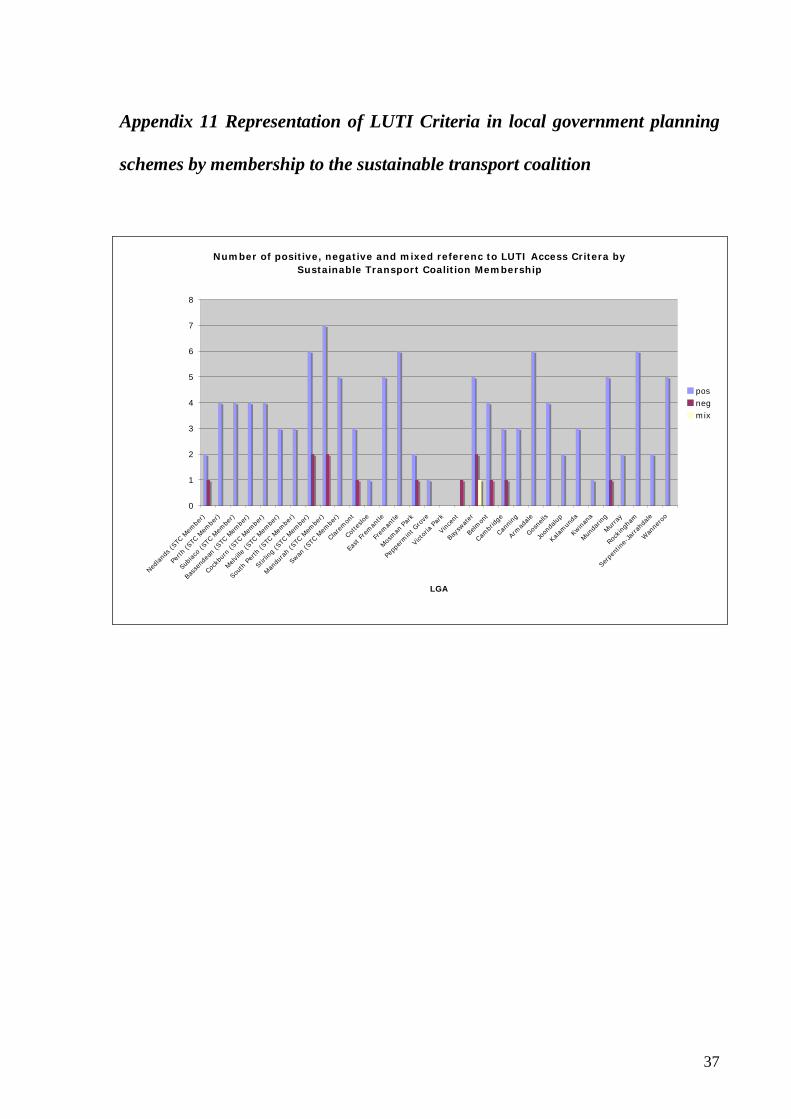
37
Appendix 11 Representation of LUTI Criteria in local government planning
schemes by membership to the sustainable transport coalition
Number of positive, negative and mixed referenc to LUTI Access Critera by Sustainable Transport Coalition Membership
0
1
2
3
4
5
6
7
8
Nedland
s (S
TC M
embe
r)
Perth
(STC
Mem
ber)
Subiac
o (S
TC M
embe
r)
Bass
ende
an (S
TC M
embe
r)
Cock
burn
(STC
Mem
ber)
Melvil
le (S
TC M
embe
r)
Sout
h Pe
rth (S
TC M
embe
r)
Stirling (S
TC M
embe
r)
Mandu
rah (S
TC M
embe
r)
Swan
(STC
Mem
ber)
Clar
emon
t
Cotte
sloe
East Fre
man
tle
Frem
antle
Mosman
Par
k
Pepp
erm
int G
rove
Victor
ia Par
k
Vinc
ent
Bays
water
Belm
ont
Cambr
idge
Cann
ing
Armad
ale
Gosne
lls
Joon
dalup
Kalamun
da
Kwinan
a
Munda
ring
Murra
y
Rock
ingh
am
Serp
entin
e-Ja
rrahd
ale
Wan
nero
o
LGA
posnegmix

38
Number of positive, negative and mixed references to LUTI Land use criteria by sustainable transport coalition membership
0
2
4
6
8
10
12
Nedland
s (S
TC M
embe
r)
Perth
(STC
Mem
ber)
Subiac
o (S
TC M
embe
r)
Bass
ende
an (S
TC M
embe
r)
Cock
burn
(STC
Mem
ber)
Melvil
le (S
TC M
embe
r)
Sout
h Pe
rth (S
TC M
embe
r)
Stirling (S
TC M
embe
r)
Mandu
rah (S
TC M
embe
r)
Swan
(STC
Mem
ber)
Clar
emon
t
Cotte
sloe
East Fre
man
tle
Frem
antle
Mosman
Par
k
Pepp
erm
int G
rove
Victor
ia Par
k
Vinc
ent
Bays
water
Belm
ont
Cambr
idge
Cann
ing
Armad
ale
Gosne
lls
Joon
dalup
Kalamun
da
Kwinan
a
Munda
ring
Murra
y
Rock
ingh
am
Serp
entin
e-Ja
rrahd
ale
Wan
nero
o
LGA
PosNegMix
Number of positive negative and mixed references to people places criteria by sustainable transport coalition membership
0
1
2
3
4
5
6
7
8
Nedland
s (S
TC M
embe
r)
Perth
(STC
Mem
ber)
Subiac
o (S
TC M
embe
r)
Bass
ende
an (S
TC M
embe
r)
Cock
burn
(STC
Mem
ber)
Melvil
le (S
TC M
embe
r)
Sout
h Pe
rth (S
TC M
embe
r)
Stirling (S
TC M
embe
r)
Mandu
rah (S
TC M
embe
r)
Swan
(STC
Mem
ber)
Clar
emon
t
Cotte
sloe
East Fre
man
tle
Frem
antle
Mosman
Par
k
Pepp
erm
int G
rove
Victor
ia Par
k
Vinc
ent
Bays
water
Belm
ont
Cambr
idge
Cann
ing
Armad
ale
Gosne
lls
Joon
dalup
Kalamun
da
Kwinan
a
Munda
ring
Murra
y
Rock
ingh
am
Serp
entin
e-Ja
rrahd
ale
Wan
nero
o
LGA
PosNegMix