working paper - hans-böckler-stiftung - hans-böckler ... · working paper hans-böckler-straße...
TRANSCRIPT

Working Paper
Hans-Böckler-Straße 39 D-40476 Düsseldorf Germany Phone: +49-211-7778-331 [email protected] http://www.imk-boeckler.de
The Impact of Financialization on Income Distribution in the USA and Germany: A Proposal for a New Adjusted Wage Share
Petra Duenhaupt
June 2011
7/2011
The Impact of Financialization on Income Distribution in the USA and Germany: A Proposal
for a New Adjusted Wage Share
Petra Duenhaupt*•
Over the recent decades, the USA has witnessed major changes in corporate governance partly due to an overall increase in financialization. The most pronounced development is the escalation of management salaries caused by the rise of stock options. On theoretical grounds, this trend was fostered by advances in the economic discipline of agency theory. In practice, changes in tax laws contributed to promoting the change. Empirical evidence shows that income concentration has increased at the top. This paper contributes to the ongoing debate about income shares by introducing a new adjusted wage share. Arguing that top incomes are closer to profits than to wages, top incomes are removed from the calculation of the indicator. The presented evidence shows that the wage share and the adjusted wage share start to diverge by the end of the 1980s, exactly at the time when the compensation practices of corporations changed considerably. Although shareholder value orientation has increased in Germany as well, business owners are still at the top of the income hierarchy. Therefore, the adjustment of the German wage income share for top management salaries shows only minor discrepancies, which, however, are in the same direction as in the US.
*PhD Student at the Macroeconomic Policy Institute (IMK) at Hans Boeckler Foundation,
Duesseldorf and Carl von Ossietzky University Oldenburg, Germany.
•This paper was presented at the 14th conference of the Research Network Macroeconomics and Macroeconomic Policies ‘Stabilising an Unequal Economy? Public Debt, Financial Regulation, and Income Distribution’, 29 – 30 October 2010, in Berlin. I am grateful to the participants for helpful comments, especially to Eckhard Hein. A condensed version of this paper will be published as ”Financialisation, Corporate Governance and Income Distribution in the USA and Germany: Introducing an Adjusted Wage Share Indicator” in the conference book.
1
“[Stockholders], anxious to obtain short-term profits, are more and more able to impose their will on managers, using financial directorates to establish the rules under which managers operate and to shape their policies regarding hiring, employment, and wages.” (Bourdieu 1998)
1. Introduction
‘Financialization’, in its broadest sense, can be defined as an:
“(…) increasing importance of financial markets, financial motives, financial institutions, and financial elites in the operation of the economy and its governing institutions, both at the national and international level” (Epstein 2005: 1).
The phenomenon of financialization has its origins in the USA and spread all over
then. While there is no exact definition of the term, there are certain developments
that are summarized under the label, as for instance: finance via capital markets
rather than banks (Philips 2002), the (re)emergence of a ‘rentier’ class
(Duménil/Lévy 2002; Epstein/Jayadev 2005), financial trading linked to new
financial instruments (Philips 1996) and the supremacy of profit-making via financial
rather than real channels (Krippner 2005). Financialization became also visible on
the corporate level – the rise of the shareholder value movement, on which this
article elaborates.
Throughout the recent decades, the USA has witnessed major changes in corporate
governance. Before 1980, corporate governance – meaning the strategy by which
companies are directed and controlled – was relatively passive. Then, the 1980s were
characterized by a large wave of mergers, takeovers and restructuring. In the 1990s,
the activity of corporate governance changed again. Corporations reorganized
themselves to move toward shareholder value orientation and to react to the
increasing influence of capital markets (Holmstrom/Kaplan 2003). Under the
pretence of ‘creating shareholder value’, managers restructured corporations, reduced
labor costs through downsizing and wage cuts, and long-term growth strategies were
replaced by short-term planning horizons. Moreover, the rise in unemployment
weakened labor’s bargaining position; not only by undermining the collective
bargaining power but also by the fear of redundancies (Glyn 2006). The strategic
orientation of ‘retain and invest’ was substituted by ’downsize and distribute’
(Lazonick/O’Sullivan 2000). As some authors argue, the most pronounced
development is the escalation of management salaries caused by the rise of stock
options (e.g. Jensen/Murphy/Wruck 2004). By introducing variable remuneration
2
schemes, management interests were aligned with the interest of financial investors,
i.e. shareholders. On theoretical grounds, this trend was fostered by advances on the
economic discipline of agency theory. In practice, changes in tax laws contributed to
promoting the change. However, this development encouraged a short-term focus,
which in turn manifests itself in an increase in dividend payments and stock
buybacks in order to boost share prices (Crotty 2002). Even Rappaport, one of the
first proponents of shareholder-value orientation, critically observed:
“Most CEOs champion the goal of maximizing shareholder value but without embracing the essential determinant of value-risk-adjusted long-term cash flows. Instead, they are obsessed with Wall Street’s earnings-expectations machine and short-term share price.” (Rappaport 2005: 72)
Yet what are the distributional consequences of these developments? From a
theoretical point of view, it is implied that shareholders’ rising demand for dividends
will be passed on to workers, and hence result in a decline in the share of income
accruing to wages in national income (Boyer 2000). While rentier shares increased
indeed in all OECD countries (Power/Epstein/Abrena 2003; Epstein/Jayadev 2005),
the labor share in national income decreased since the early 1980s in continental
Europe but was only on a mild downward trend in the US (Bentolila/Saint-Paul
1999). The same applies to the US corporate sector: For non-financial corporations’
labor share in value added, there has not been a clear downward trend. The same
holds true for the financial sector, albeit the labour income share was lower
throughout than in the non-financial sector. Hence, in the US, financialization has
manifested itself only in a rising weight of finance, and the sectoral shift has
contributed to the mild downward trend of the wage share for the economy as a
whole. In the case of Germany, a shift towards the financial sector has not occurred;
the falling wage share of the non-financial sector has dominated the falling wage
share of the corporate sector (Dünhaupt, forthcoming).
Another phenomenon that could be observed is the rising wage dispersion in the US.
As highlighted by Krugman (2002) the pay of CEOs in large American corporations
was always a multiple of the ordinary workers wage, but has nowadays reached an
extraordinary level. This observation is confirmed by the study of Dew-Becker and
Gordon (2005), who found that over the period 1966–2001, only the top 10 percent
of the income distribution, to which CEOs apparently belong to, have benefited from
the gains in US growth. This might be a potential answer to the question of why the
3
wage share was more stable in the US than in Continental Europe: in national
accounts, stock options are counted as compensation of employees.
In this paper it is argued that the predominance of shareholder value orientation
coupled with rising management salaries contributed to a decrease of labor’s share in
national income. In fact, the decrease in the labor share is regarded as part of the
process of financialization, which is not always visible but will be made explicit
here.
In the following, three questions are considered. First, why is the share of wages in
national income more stable in the USA than in Germany, although financialization
and neo-liberalism are more prevalent in the US? Second, is there a link between this
development and changes in corporate governance, i.e. an increase in shareholder
value orientation and hence executive remuneration practices? Finally, does the wage
share look differently if top income shares are removed?
In order to address these questions, the paper is structured as follows. In a first step,
agency theory, which can be considered as the theoretical justification for the
escalation in stock options, is presented and critically discussed. The second part
continues with a discussion of stock options and the development of CEO payment
in the USA and Germany. While in the past management remuneration was detached
from company performance, the introduction of stock options not only aligned
management interests with those of shareholders, but also resulted in skyrocketing
salaries. The next section continues with a critical discussion of the wage share.
Although it can be considered as a rough indicator for the distribution of national
income between labor and capital, it may be misleading because not only do workers
nowadays receive capital income themselves in the form of interest and dividends
but also, and more importantly, is income in the form of stock options counted as
wage income. Hence, the wage share can be a misleading indicator when it comes to
the question of distribution of income to different social groups or classes. In order to
remove part of these distortions, finally, a new adjusted wage share is presented by
removing top management salaries and stock options from the wage share. The last
section presents the main conclusions.
2. Principal Agent Conflict
Berle and Means already discussed the problem of the separation of ownership and
control in the corporate form of organization in 1932. The authors identified an
important agency problem: they were concerned that managers rather manage in
4
their own interest than of those of the shareholders, who represent the owners.
Agency theorists adopted this idea, to which the surge in management remuneration
can be traced back. The basic idea goes as follows: one party, the agent, acts on
behalf of another party, the principal. It is assumed that both parties have different
goals and risk preferences. The principal has difficulties to examine the agents’
doings, i.e. to make sure that the agents’ behavior is appropriate. This conflict is
referred to as the agency problem. Moreover, there is the possibility that both parties
have different attitudes towards risk, and therefore have a conflict when it comes to
actions. Hence, there is the problem of risk sharing. Agency theorists present this
relationship by using the metaphor of a contract and try to solve the aforementioned
problems (Eisenhardt 1989). Jensen and Meckling (1976) brought foreword the
premise that if a contract is outcome based it is more likely that the agent acts in the
interest of the principal.
The relationship between the principal and the agent perfectly fits the conflict arising
between shareholders and managers, as managers are supposed to act in the best
interest of shareholders. Remuneration schemes were constructed that align the
interest of self-interested managers with those of shareholders by linking the pay
directly to the stock price in order to mitigate agency problems. It is assumed that
stock options give managers a greater incentive to act in the interest of shareholders
(Hall/Murphy 2003) and to encourage more risk taking, as managers are rather risk
averse to avoid failure and dismissal (Rappaport 2005).
Apart from the incentive aspect, there were also changes in regulation and taxation
that contributed to an increase in stock option based remuneration. Since 1992,
public companies are required to announce top executive compensation and its
relation to the companies’ performance, i.e. stock performance. The requirement
enhanced stock-based compensation, as it is easier to defend in public. In 1993, a law
was passed that promotes performance based compensation by limiting the tax
deductibility of management compensation at $1m if it is not performance based
(Holmstrom/Kaplan 2001)1. In general, under current US accounting rules, options
are not treated as an expense on company’s financial statements (Hall/Murphy 2003).
Before the increasing interest in shareholder value orientation, management was
rather loyal to the corporation than to the shareholders. Before 1980, there was no
alignment between managers and shareholders interests; performance based
1 Whether or not these changes in regulation and tax rules had indeed an influence on the increase in options is a controversial issue. For a discussion compare Hall/Murphy (2003) p. 62.
5
compensation was negligible. In times of excess capacity, managers tended to waste
free cash flow through unnecessary diversification and investment programs
(Jensen/Murphy/Wruck 2004). A takeover and merger boom characterized the
1980s. Through leveraged acquisitions, buyouts, hostile takeovers and stock
buybacks, free cash flow was absorbed by interest payments that came along with
debt service requirements (Holmstrom/Kaplan 2001). The merger and takeover boom
came to an end by the late 1980s. The decline was fostered by anti-takeover
legislation and jurisprudence, the collapse of the high yield bond market and a credit
crunch (Holmstrom/Kaplan 2001). At the same time, shareholder activism started to
increase. According to Hall and Murphy (2003), representatives of shareholders as
for instance the United Shareholders Association, the Council of Institutional
Investors and a variety of state pension funds criticized the fact that management
remuneration was detached from companies’ performance. This criticism was
stressed further by academic research presenting evidence that managers indeed were
neither rewarded for good performance nor penalized for failure. As a result,
companies granted more stock options to executives.
Ironically, the recent past showed that the system of incentive based compensation
has its limits as it probably exacerbates, not reduces, agency problems
(Jensen/Murphy/Wruck 2004). Managers are self-interested, “obsessed with
earnings” (Rappaport 2005: 69) and short-term performance rather than to focus on
the long-term prospects of the company. In order to meet earning expectations, long-
term investments are put off, which in turn reduces the company’s earnings potential
and value. Managers also tend to decide in ways that decrease total firm value and
total social value by increasing shareholder value (Jensen/Murphy/Wruck 2004).
Stock-based incentives encouraged fraud and resulted in accounting scandals by
managers who reported high earnings that increased stock prices (Hall/Murphy
2003).
3. Stock options and CEO pay
Employee stock options provide employees with the right to buy a share of their
company’s stock at a set price (the strike or exercise price), within a specified time
period. The strike price is usually equal to the market price on the date the option is
granted. In general, employee stock options cannot be exercised immediately
because of a minimum waiting period, which is also called the “vesting period”, of
usually 3 years. In case the employee leaves the company before the vesting period

6
has passed, options lapse. Employee stock options are non-tradable and expire within
10 years. The aforementioned limitation ensures that the options tie employee
compensation to firm outcome until the options are exercised. Usually, the company
issues a new share when the employee purchases the stock (i.e. exercises the option).
“Cashless exercise programs” are a prevalent procedure; the employee receives the
value of the spread between the market price and the strike price in cash or in
company shares and pays nothing (Hall/Murphy 2003).
Hall and Murphy (2003) find a tremendous increase in CEO pay, driven by an
escalation in grants of stock options. From 1992 to 2000, the average real pay for
CEOs of S&P 500 firms grew remarkably by 320 percent from $3.5m to $14.7m, and
decreased to $9.4m in 2002. According to the authors, the rise in CEO payment is
mainly caused by an increase in stock options which grew nine-fold compared to
other components that only tripled during the same period. Jensen, Murphy and
Wruck (2004) analyze the composition and level of CEO pay in S&P 500 firms from
1992 to 2002, showing that the composition of average remuneration changed
considerably.2 In 1992, base salary made up 38 percent, compared to stock options
that accounted for only 24 percent. By 2000, base salary decreased to only 17
percent, whereas stock options made up almost 50 percent. Although the total pay
diminished slightly by 2002, options still accounted for almost half of CEO
remuneration. In a similar study, Bebchuk and Grinstein (2005) analyze the growth
in executive pay between 1993 and 2003. The results show that neither changes in
market capitalization nor changes in industry mix during the period under
investigation can be accountable for the growth in pay levels.
Although remuneration of German managing boards grew at a similar pace, the
levels and the composition differ. A study conducted by Schmidt and Schwalbach
(2007) shows that from 1987 to 2005, the average pay in DAX 30 firms increased by
445 percent; and from 1994 to 2005 by 331 percent. In 2008, the average pay was
!2.3m (21 percent less than in 2007), of which base salary was accountable for 34
percent (25 percent in 2007), 47 percent bonuses (56 percent in 2007) and 19 percent
stock options (the same in 2007) (Friedl et al. 2009). Interestingly, growth rates of
management remuneration and stock prices were in line until 2001 when they started
to diverge. Hence, there is an asymmetric reward structure for managers: the pay
2 Average pay levels (in 2002-constant dollars) taken from the ExecuComp database for S&P 500 CEOs. Average pay is composed of salaries, bonuses, benefits, stock options (valued on date of grant using ExecuComp’s modified Black-Scholes formula), stock grants, and other components.

7
increases with rising equity prices, but does not react on falling prices. Therefore,
Schmidt and Schwalbach (2007) criticize the fact that remuneration is detached from
performance.
The results suggest that stock options are much more important in the US compared
to Germany. This is not very surprising given the fact that stock options were not
introduced before 1998 when German legislation allowed the grant of options as part
of management compensation (Bernhard 1999). Even though German firms do not
rely as much on stock options as their US counterparts, they do as well rely heavily
on short-term performance indicators.
Before presenting wage shares adjusted for the increase in CEO pay levels and
thereby the rise in stock options, the next section discusses problems associated with
the measurement of wage shares, with a special focus on how to handle changes in
the composition of income.
4. The main issues regarding the wage share
In general, factor shares are calculated from aggregates in national accounts. The
standard strategy is to calculate the labor share of national income by taking the
share of employee compensation divided by either national income or GDP. The
capital share, in turn, is assumed to be the residual. Recently, the simple calculation
has received some criticism. While in the past, the long-term stability of factor shares
was referred to as one of the “stylized facts” of growth by Nicholas Kaldor (1961:
178), “a bit of a miracle” by John M. Keynes (1939: 48) and “a mirage“ by Robert
Solow (1958: 619), lately, the long-term development of the labor income share has
become a puzzle to economists, as it appears not to be constant over time. While
some studies try to examine the determinants for the decrease in the labor share (e.g.
Blanchard/Giavazzi (2003), EU-Commission (2007), Guscina (2006), Harrison
(2002), IMF (2007) and Tytelle/Jaumotte (2007)), others suggest that measurement
issues may distort the picture. Gomme and Rupert (2004) argue that the falling share
of labor in the US is just an artifact of mismeasurement. According to the authors,
the “historic lows” in the early 2000s appear only in certain time series. In the same
vein, Krueger (1999) and Glyn (2009) present differences in labor shares depending
on the chosen numerator or denominator. For example, measuring labor’s share of
GDP at market prices rather than factor costs lowers the result, because it adds
indirect taxes to non-labor income. Since indirect taxes do not characterize a return
to capital, it is more meaningful to measure labor’s share of GDP at factor cost.

8
Moreover, economists have stressed the fact that the distinction of factor shares as
representatives of class income shares, i.e. distinguishing between capitalists’ and
workers’ income shares, is not as simple as postulated by classical economists for
two reasons: First, wage differentials have increased substantially in recent years.
Labor shares include all form of wage income, from the low-paid worker to the high
paid company director. Second, people receive income from different sources, i.e.
workers do not only receive income in the form of wages and salaries but also capital
income in the form of dividends, rents and interest payments (see, for instance,
Palley 2006, 2010, Lavoie 2009, Atkinson 2009). These two facts give the
impression that the lines have been blurred.
However, in regard to the second point, one should keep in mind the persistent levels
of inequality in the US when it comes to the distribution of wealth, and hence income
from wealth. According to a recent study by Wolff (2010), in 2007 the richest 1
percent of US households held about half of all outstanding corporate equity.
Moreover, despite the fact that 49 percent of households owned stock shares either
directly or indirectly through mutual funds, trusts, or various pension accounts, the
richest 10 percent of households accounted for 81 percent of the total value of these
stocks, somewhat less than its 89 percent share of directly owned stocks and mutual
funds. In Germany, stock ownership in household portfolios appears to be of minor
importance. In 2009, only 13.6 percent held stock shares, of which 3.8 percent
directly, 7.7 indirectly and 2.1 percent held both (DAI 2010). Combined with the fact
that in 2007 the richest 10 percent of German households owned more than 60
percent, and the richest 1 percent 23 percent of total wealth, in contrast to the fact
that 2/3 of German households owned none or only little net assets (Frick/Grabka
2009), stock ownership is highly concentrated and exclusive to the rich households.
Therefore, even if “labor and capital no longer divide so neatly into mutually
exclusive categories” (Krueger 1999: 50), wealth is still highly concentrated and thus
contributes to income inequality, because only a small group of households derive
income from capital.
Similar to the aforementioned controversy, the question arises how variable
remuneration, i.e. stock options and bonus payments are treated in national accounts.
This is even more important given the strong surge in stock options in the US, as
outlined in Section 3.

9
Stock options are counted as compensation of employees in national accounts, given
that “employees receive ESO [employee stock options] from the employer because
of their work – like a bonus for their performance” (Kuhn 2003: 3). It is further
argued that ESOs “are no gifts for the employees and consequently have to be seen
as part of remuneration” (Kuhn 2003: 3). However, according to Glyn (2009: 112),
“many of those at the top of the pay distribution are more akin to entrepreneurs, employed by shareholders and rewarded with stock options which are literally an entitlement based on future profits and which reduce the future returns to the other shareholders”.
This argument resembles the one put forward by Krueger (1999: 46):
“Because corporate officers control the firm’s capital and in many cases include the owners of the firm, one could argue that much of their compensation should be classified as capital income.”
Even from a theoretical point of view matters are not clear-cut. Given that stock
options are generated from a new emission of shares, they rather represent a capital
transfer than compensation of employees, because they are not an actual cost for a
firm (Kuhn 2003). In addition, stock options could be regarded as some kind of
capital gain and hence correspond to capital income rather than compensation
(Eurostat undated; Australian Bureau of Statistics 2002). Taken the aforementioned
arguments against the treatment of stock options as part of employee compensation
together with the fact that from a distributional point of view corporate executives
hold a position closer to capital than to labor, as their interests are aligned with the
shareholders via variable remuneration schemes, this implies to adjust the wage share
accordingly.
5. A proposal for creating a new “adjusted” wage share
This section provides an attempt at constructing wage shares adjusted for the very
high manager incomes for the US and Germany, respectively. The calculation
follows the examples of Buchele and Christiansen (2007), Glyn (2009) and Atkinson
(2009) in taking top wage income shares constructed from tax return statistics and
subtracting them from the income share of labor.
Buchele and Christiansen (2007) obtained their “adjusted” wage share for the US by
subtracting the top 0.5 percent share of wages, taken from Piketty and Saez (2003),
from the NIPA labor’s share. The resulting wage share peaks at around 71 percent in
the early 1970s and declines by more than 10 percentage points by 2005. Andrew
Glyn (2009) performed a similar calculation in 2009. Based on the same data set, he

10
removed the top 1 percent wage share from the original labor share and concludes
“the share of the ‘bottom 99%’ of US labor has fallen much more sharply over the
past couple of decades than labor’s share as a whole” (Glyn 2009: 112). Atkinson
(2009) calculated “adjusted” wage shares for the bottom 90 and 50 percent of wages
for the time period 1954 to 2006 for the UK.3 The calculation clearly indicates that
the share of the bottom 50 percent decreased since 1975, while the ordinary wage
share was relatively stable over time. All these studies highlight the impact of
increasing wage dispersion, and hence imply a need to calculate adjusted labor
shares in order to derive meaningful conclusions.
In the following calculations, data for the wage shares are taken directly from
National Accounts as published by National Statistical Offices; data for the
adjustment of the wage shares are taken from Piketty and Saez (2003) for the USA
and from Bach, Corneo and Steiner (2009) for Germany.4
In the case of the USA, three types of calculations are presented. In a first step, the
composition of top income shares is shown, based on the data from Piketty and Saez
(2003). The respective share of top wage income is then removed from the share of
wages in national income. Although it is not obvious to which group of top income
fractiles CEOs belong to, this study exemplifies the impact by taking the top 0.1
percent incomes.5
The labor share in national income does, besides employment in the business sector,
also include employment by not-for-profit institutions, government employment and
direct employment by households. None of these generate profits and stock options,
and top management salaries are also of minor importance. To render a more
accurate picture of the distributional effects of stock options and top management
salaries, a new adjusted wage share for the business sector is calculated in the third
step. Given the assumption that none of the top incomes are gained in the non-
business sector, the procedure of subtracting the top wage incomes for the economy
as a whole from the business sector wages seems to be legitimate. Unfortunately, a
distinction between financial and non-financial corporations is not possible, due to
data limitations.
Figure 1 displays the top 0.1 percent income share and its composition for the USA,
1960 till 2007. A number of interesting facts emerge. First, the share of income 3 In contrast to Piketty and Saez (2003), the Atkinson’s (2009) data set relates to individual data, not tax units. 4 More information about the data set is given in Appendix A. 5 Calculations for the top 0.5 percent and top 0.01 percent can be found in Appendix B.

11
accruing to the richest 0.1 percent households increased slowly until the 1980s when
it started to accelerate. Over the 1980-2007 period, the share rose my more than 6
percentage points. While in 1980, the richest 0.1 percent households held about 2
percent of total income, by 2007, the share was around 8 percent. Second, it can be
inferred that this increase is due to rising salaries, because the contribution of the
share of wages increased from 1.1 percent in 1980 to 3.6 percent in 2007. Moreover,
the share of wages peaked in 2000 before the collapse of the new economy stock
market boom, leading to the assumption that the increase in wages was largely
caused by stock options, which obviously depend on stock market fluctuations.
Third, the results show that since the mid 1980s, business income contributed to the
rising share of top-incomes as well, reflecting the fact that high professionals and
entrepreneurs have seen their share of income rise too.
Figure 1: The top 0.1 percent income share in national income and its composition, USA, 1960-2007
Source: Piketty and Saez (2003); author’s calculations.
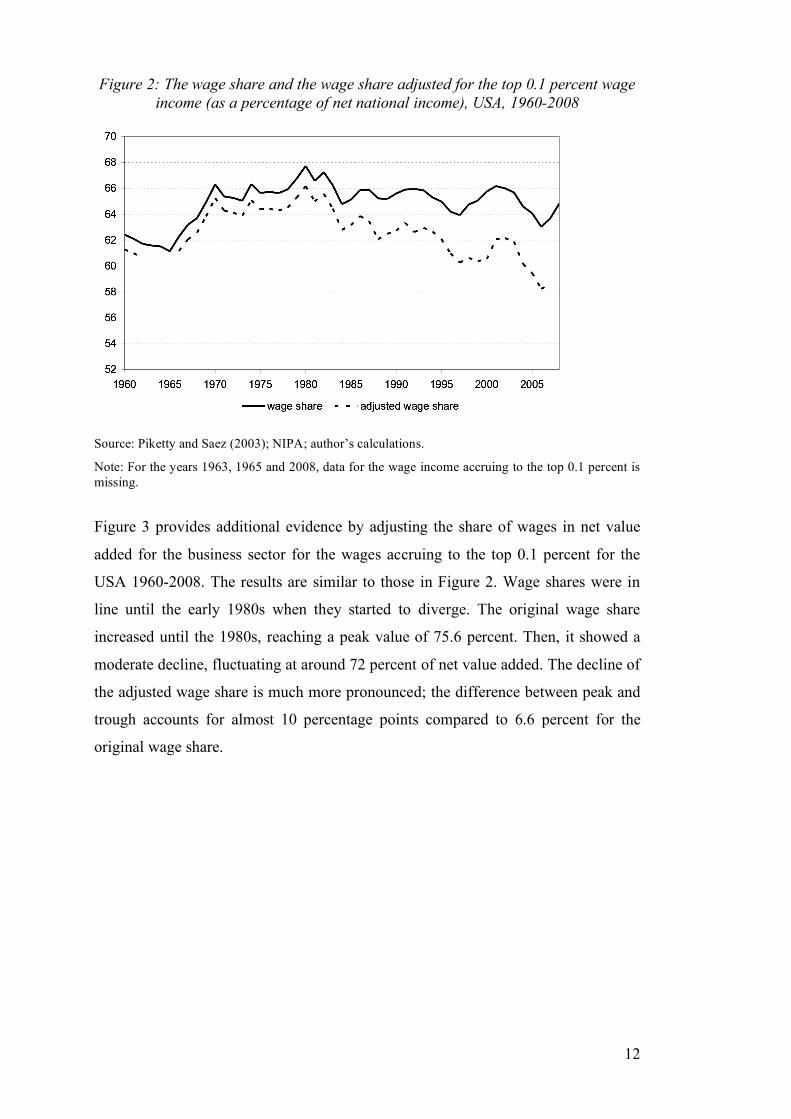
Figure 2 shows the impact of subtracting the wages accruing to the top 0.1 percent
from the labor share of net national income for the USA 1960-2008. Indeed, our
adjusted wage share shows the implied pronounced downward trend since the 1980s,
while the original wage share taken from the national accounts only shows a
moderate decline. For our adjusted wage share, the difference between the peak in
1980 and the trough in 2006 amounts to almost 8 percentage points, whereas for the
original wage share it reaches only 4.7 percentage points.
12
Figure 2: The wage share and the wage share adjusted for the top 0.1 percent wage income (as a percentage of net national income), USA, 1960-2008
Source: Piketty and Saez (2003); NIPA; author’s calculations.
Note: For the years 1963, 1965 and 2008, data for the wage income accruing to the top 0.1 percent is missing.
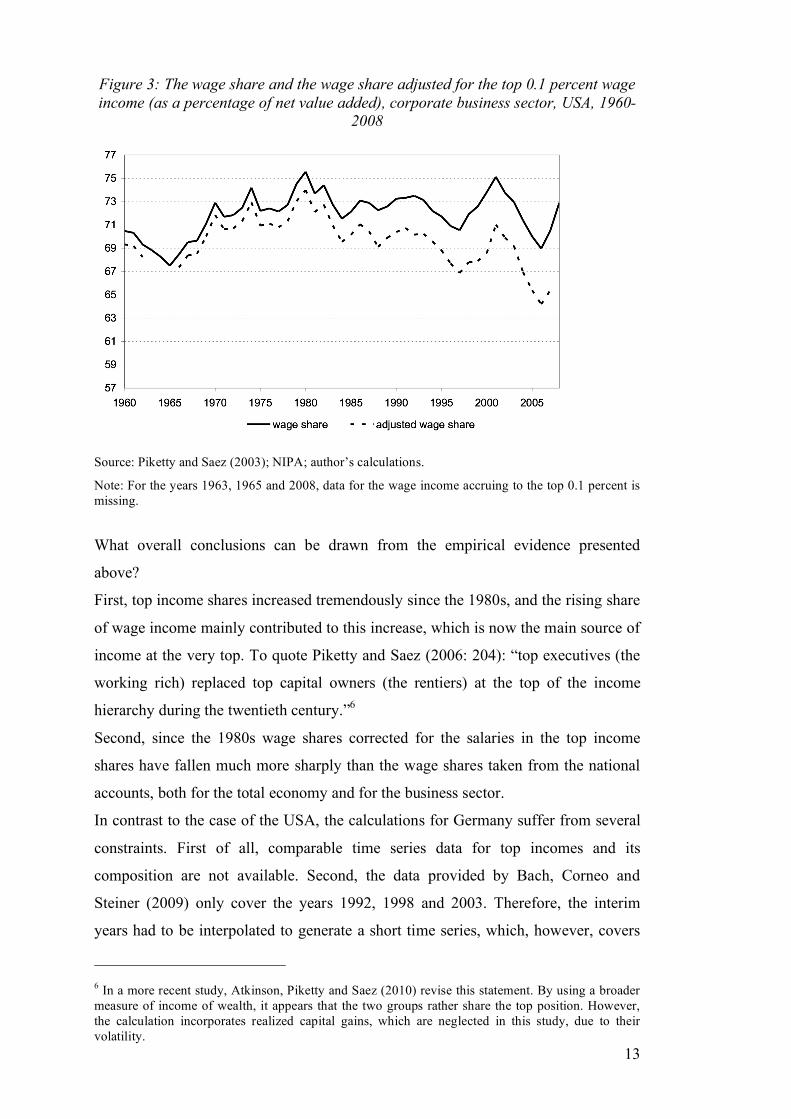
Figure 3 provides additional evidence by adjusting the share of wages in net value
added for the business sector for the wages accruing to the top 0.1 percent for the
USA 1960-2008. The results are similar to those in Figure 2. Wage shares were in
line until the early 1980s when they started to diverge. The original wage share
increased until the 1980s, reaching a peak value of 75.6 percent. Then, it showed a
moderate decline, fluctuating at around 72 percent of net value added. The decline of
the adjusted wage share is much more pronounced; the difference between peak and
trough accounts for almost 10 percentage points compared to 6.6 percent for the
original wage share.
13
Figure 3: The wage share and the wage share adjusted for the top 0.1 percent wage income (as a percentage of net value added), corporate business sector, USA, 1960-
2008
Source: Piketty and Saez (2003); NIPA; author’s calculations.
Note: For the years 1963, 1965 and 2008, data for the wage income accruing to the top 0.1 percent is missing.
What overall conclusions can be drawn from the empirical evidence presented
above?
First, top income shares increased tremendously since the 1980s, and the rising share
of wage income mainly contributed to this increase, which is now the main source of
income at the very top. To quote Piketty and Saez (2006: 204): “top executives (the
working rich) replaced top capital owners (the rentiers) at the top of the income
hierarchy during the twentieth century.”6
Second, since the 1980s wage shares corrected for the salaries in the top income
shares have fallen much more sharply than the wage shares taken from the national
accounts, both for the total economy and for the business sector.
In contrast to the case of the USA, the calculations for Germany suffer from several
constraints. First of all, comparable time series data for top incomes and its
composition are not available. Second, the data provided by Bach, Corneo and
Steiner (2009) only cover the years 1992, 1998 and 2003. Therefore, the interim
years had to be interpolated to generate a short time series, which, however, covers
6 In a more recent study, Atkinson, Piketty and Saez (2010) revise this statement. By using a broader measure of income of wealth, it appears that the two groups rather share the top position. However, the calculation incorporates realized capital gains, which are neglected in this study, due to their volatility.

14
the initial period of financialization and increasing shareholder value orientation in
Germany (van Treeck/Hein/Dünhaupt 2007).
Although limitations of data prevent a detailed comparison between the cases of
Germany and the USA, some interesting trends can be presented nonetheless.
Figure 4 provides information about the German top 0.1 percent income share and its
composition, 1992, 1998 and 2003. During the observation period, the share of the
top 0.1 percent in gross market income slightly decreased from 4.19 percent in 1992
to 4.12 percent in 2003. In 1992, the composition of the top 0.1 income share was as
follows: 15 percent wage income, 21 percent capital income, and business activity
accounted for the bulk with 64.1 percent. By 2003, the composition changed. The
contribution of wage income increased to 22.4 percent, business income decreased to
58.5 percent and capital income accounted for 19.2 percent. Overall the top incomes
in Germany mainly derive from business activities. In contrast to the USA, the
contribution of wage income is still small, but rapidly increasing.
Why is the composition of the top income share so different from the US? Dell
(2007) suggests that the treatment of capital income is more favorable in terms of
taxes compared to other countries. Moreover, Bach, Corneo and Steiner (2007)
emphasize the still comparatively low remuneration of German CEOs by
international standards. According to the authors, the larger size of US firms, the
common use of stock options as well as the presence of trade union members in
German supervisory boards might be potential answers. Bach, Corneo and Steiner
also highlight the fact that the vast majority of German firms are unincorporated,
irrespective of firm size. This fact helps explain the importance of income derived
from business activity for the highest income fractiles and might be caused by
differences in the German system with regard to tax rules, legal framework and the
financial system.

15
Figure 4: The top 0.1 percent income share in gross market income1 and its composition, Germany, 1992, 1998 and 2003
1Income from business activity, wage income, capital income, exclusive public and private pensions; measured at the individual level.
Source: Bach, Corneo and Steiner (2009); author’s calculations
Figure 5: The wage share and the wage share adjusted for the top 0.1 percent wage income (as a percentage of net national income), Germany, 1992-2003
Source: Statistical Office Germany, Bach, Corneo and Steiner (2009); author’s calculations
Note: Our “adjusted” wage share is constructed by taking the three data points from figure 4; the missing years are interpolated.
Figure 5 contrasts the evolution of the original wage share (as a percentage of net
national income) with the wage share adjusted for wage income accruing to the top
16
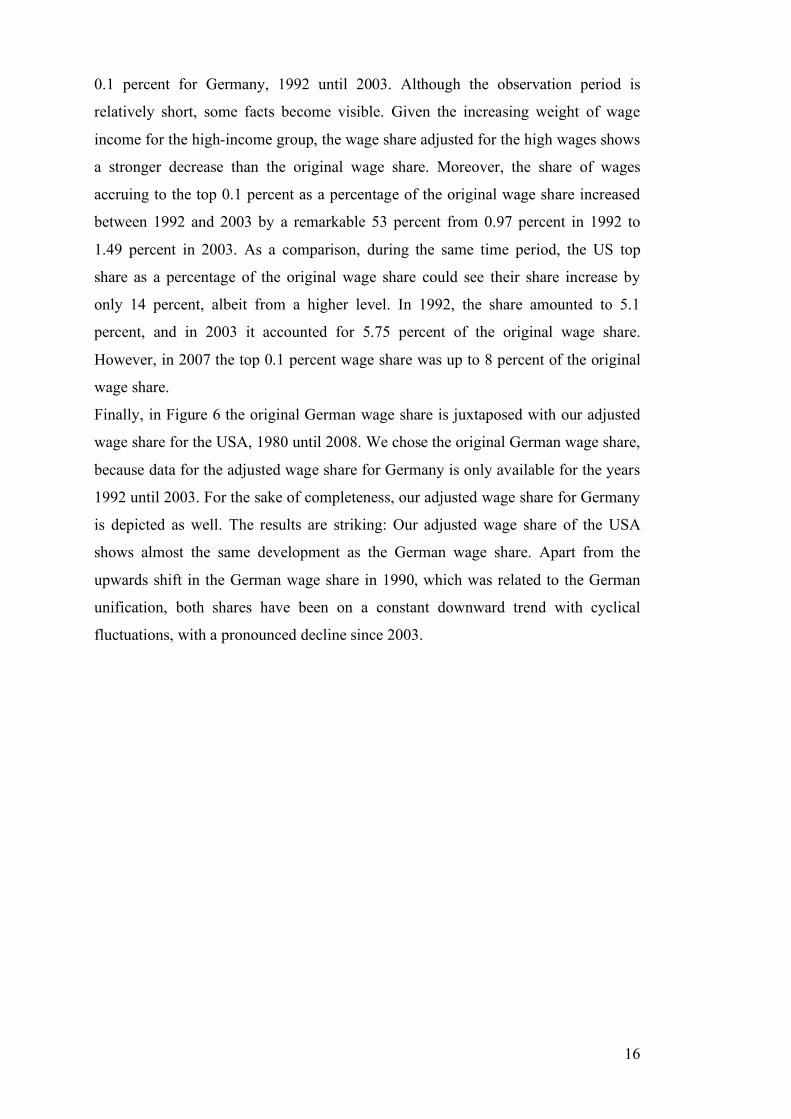
0.1 percent for Germany, 1992 until 2003. Although the observation period is
relatively short, some facts become visible. Given the increasing weight of wage
income for the high-income group, the wage share adjusted for the high wages shows
a stronger decrease than the original wage share. Moreover, the share of wages
accruing to the top 0.1 percent as a percentage of the original wage share increased
between 1992 and 2003 by a remarkable 53 percent from 0.97 percent in 1992 to
1.49 percent in 2003. As a comparison, during the same time period, the US top
share as a percentage of the original wage share could see their share increase by
only 14 percent, albeit from a higher level. In 1992, the share amounted to 5.1
percent, and in 2003 it accounted for 5.75 percent of the original wage share.
However, in 2007 the top 0.1 percent wage share was up to 8 percent of the original
wage share.
Finally, in Figure 6 the original German wage share is juxtaposed with our adjusted
wage share for the USA, 1980 until 2008. We chose the original German wage share,
because data for the adjusted wage share for Germany is only available for the years
1992 until 2003. For the sake of completeness, our adjusted wage share for Germany
is depicted as well. The results are striking: Our adjusted wage share of the USA
shows almost the same development as the German wage share. Apart from the
upwards shift in the German wage share in 1990, which was related to the German
unification, both shares have been on a constant downward trend with cyclical
fluctuations, with a pronounced decline since 2003.
17
Figure 6: The "adjusted wage share" for the USA and Germany and the original wage share for Germany, 1980-2008
Source: NIPA; Piketty and Saez (2003); Statistical Office Germany; Bach, Corneo and Steiner (2009); authors’ calculations
6. Conclusion
The fundamental changes in the global economy in the last 30 years have been
accompanied by pronounced changes in corporate governance. The underlying
substance of this change has been the increasing importance of financialization; the
mechanisms which have driven this change in corporate governance have been the
increasing importance of shareholder value orientation coupled with incentive-based
management compensation, with the result that managers have shifted their attention
towards short-term objectives and stock prices. In the USA, these shifts have led to a
dramatic rise in top income shares, driven by skyrocketing top income wages. An
explosion in grants of stock options, in turn, mainly caused the increase in top wages.
The relative stability of the labor share in national income in the US no longer
appears to be puzzling if one takes the above findings into account. In this paper it
was argued that stock options are closer to capital income than to wage income,
given the proximity of CEOs position to capital owners rather than to workers. Given
this assumption, top income shares were removed from the labor share of income for
the total economy as well as for the business sector. The result is striking: Since the
1980s, our adjusted US labor income share has fallen much more sharply than the
labor income share taken from the national accounts. Therefore, the period of
financialization (Krippner 2005) has been characterized by two types of
redistribution: First, there has been an increase in the rentier income share at the

18
expense of the wage share, as taken from the national accounts and thus including
top management salaries, as shown in Dünhaupt (forthcoming). Second, top
management salaries have increased relative to workers’ incomes further weakening
the development of our adjusted wage share.
Limitations of available data prevented an extensive comparison of the development
in Germany with the one in the USA. However, some trends could still be observed.
The share of top management salaries in national income has increased in Germany
too, albeit from a much lower level than in the USA. Therefore, the adjustment of the
German wage income share for top management salaries only showed minor
discrepancies, which, however, were in the same direction as in the USA. Thus,
Germany has also been facing similar redistribution tendencies of financialization as
the USA, an increase in the rentier income share as shown in Dünhaupt
(forthcoming) and an increase in top management salaries in the wage share as
measured by the national accounts.

19
References Atkinson, A.B. (2009): Factor Shares: the principal problem of political economy?
in: Oxford Review of Economic Policy, 25(1), 3-16.
Atkinson, A.B., Piketty, T., Saez, E. (2010): Top incomes in the long run of history, in: Journal of Economic Literature, forthcoming, manuscript version: http://elsa.berkeley.edu/~saez/atkinson-piketty-saezJEL10.
Australian Bureau of Statistics (2002): Treatment of stock options in the national accounts: Summary of views expressed by the EDG, paper presented for the OECD meeting of national accounts experts, Chateau de la Muette, Paris, October 8-11.
Bach, S., Corneo, G., Steiner, V. (2007): From bottom to top: The entire distribution of market income in Germany, 1992-2001, DIW Discussion Paper No. 683.
Bach, S., Corneo, G., Steiner, V. (2009): From bottom to top: the entire income distribution in Germany, 1992-2003, in: Review of Income and Wealth, 55(2), 303-330.
Bebchuk, L., Grinstein, Y. (2005): The growth of executive pay, in: Oxford Review of Economic Policy, 21(2), 283-303.
Bentolila, S., Saint-Paul, G. (1999): Explaining movements in the labour share, CEMFI Working Paper No. 9905.
Berle, A., Means, G. (1932): The Modern Corporation and Private Property. New York, NY: MacMillan.
Bernhardt W. (1999): Stock options for or against shareholder value? - New compensation plans for top management and the interests of the shareholders, in: Corporate Governance: An International Review, (7), 123–135.
Blanchard, O., Giavazzi, F. (2003): Macroeconomic effects of regulation and deregulation in goods and labor markets, in: Quarterly Journal of Economics, 118(3), 879-907.
Bourdieu, P. (1998): The essence of neoliberalism, Le Monde diplomatique, December 1998.
Boyer, R. (2000): Is a finance-led growth regime a viable alternative to fordism? A preliminary analysis, in: Economy and Society, 29(1), 111-145.
Buchele, R., Christiansen, J. (2007): Globalization and the declining share of labor income in the United States, Paper prepared for the 28th International Working Party on Labor Market Segmentation, Aix-en-Provence, France, July 5-7, 2007.
Crotty, J. (2002): The effects of increased product market competition and changes in financial markets on the performance of nonfinancial corporations in the neoliberal era, PERI Working Paper Number 44.
DAI (Deutsches Aktieninstitut) (2010): Zahl der Aktionäre und Aktienfondsanleger: Stabilisierung im Jahr 2009, DAI-Kurzstudie 1/2010.
Dell, F. (2007): Top Incomes in Germany throughout the Twentieth Century, 1891-1998, in: Atkinson, A.B.; Piketty, T. (eds.): Top Incomes over the Twentieth Century – A contrast between Continental European and English-Speaking Countries, Oxford: Oxford University Press.
20
Dew-Becker, I., Gordon, R. (2005): Where Did the Productivity Growth Go? Inflation Dynamics and the Distribution of Income, NBER Working Paper, No. 11842.
Duménil, G., Lévy, D. (2002): Neoliberalism: The crime and the beneficiary, Review, XXV, 393-400.
Dünhaupt, P.: Financialization and the rentier income share – evidence from the USA and Germany, in: International Review of Applied Economics, forthcoming.
Eisenhardt, K. (1989): Agency Theory: An Assessment and Review, in: The Academy of Manamgement Review, 14(1), 57-74.
Epstein, G. (ed.) (2005): Financialization and the World Economy, Cheltenham: Edward Elgar.
Epstein, G., Jayadev, A. (2005): The rise of rentier incomes in OECD countries: Financialization, central bank policy and labor solidarity, in: Epstein, G. (ed.): Financialization and the World Economy, Cheltenham: Edward Elgar.
EU-Commission (2007): The labour income share in the European Union, Employment in Europe, Chapter 5, 237-272.
Eurostat (undated): Employee Stock Options, paper for the Advisory Expert Group on National Accounts, unpublished draft.
Frick, J., Grabka, M. (2009): Gestiegene Vermögensungleichheit in Deutschland, DIW Wochenbericht 4/2009, 54-67.
Friedl, G., Hocker, U., Döscher, T., Hölz, C. (2009): Studie zur Vergütung der Vorstände in den DAX 30-Unternehmen im Geschäftsjahr 2008.
Glyn, A. (2006): Capitalism Unleashed. Finance Globalization and Welfare, Oxford: Oxford University Press.
Glyn, A. (2009): Functional Distribution and Inequality, in: Salverda, W; Nolan, B. and Smeeding, T.M. (eds): The Oxford Handbook of Economy Inequality, Oxford: Oxford University Press, 101-126.
Gomme, P., Rupert, P. (2004): Measuring Labor’s Share of Income, Federal Reserve Bank of Cleveland Policy Discussion Paper No. 7; November 2004.
Guscina, A. (2006): Effects of globalization on labor's share in national income, IMF Working Paper 06/294.
Hall, B.J., Murphy, K.J. (2003): The trouble with stock options, in: Journal of Economic Perspectives, 17(3), 49-70.
Harrison, A. (2002): Has globalization eroded labor's share? Some cross-country evidence, Mimeo UC Berkeley.
Holmstrom, B.; Kaplan, S. (2001): Corporate Governance and Merger Activity in the United States: Making Sense of the 1980s and 1990s, in: The Journal of Economic Perspectives, 15(2), 121-144.
Holmstrom, B., Kaplan, S. (2003): The State of U.S. Corporate Governance – What’s right and what’s wrong? ECGI Working Paper Series in Finance, Finance Working Paper No. 23/2003.
21
IMF (2007): The globalization of labor, World Economic Outlook (April), Chapter 5, IMF, Washington D.C.
Jensen, M.C.; Meckling, W. (1976): Theory of the firm – managerial behavior, agency costs and ownership structure, in: Journal of Financial Economics, 3(4), 305-60.
Jensen, M.C., Murphy, K.J., Wruck, E. (2004): Remuneration: where we’ve been, how we got to here, what are the problems, and how to fix them. ECGI Working Paper Series in Finance Working Paper Series, No. 44-2004, 2004
Kaldor, M. (1961): Capital Accumulation and Economic Growth, in: F.A. Lutz (ed.): The Theory of Capital, London: Macmillan, 177-222.
Keynes, J.M. (1939): Relative movements in real wages and output, in: Economic Journal, 49(1), 917-949.
Krippner, G. (2005): The financialization of the American economy, Socio-Economic Review, (3), 173-208.
Krueger, A. (1999): Measuring Labor’s Share, in: American Economic Review, 89(2), 45-51.
Krugman, P. (2002): For richer, The New York Times, October 20, 2002.
Kuhn, M. (2003): Treatment of Employee Stock Options in National Accounts, Statistisches Bundesamt, Germany, April 2003.
Lavoie, M. (2009): Cadrisme within a Kaleckian Model of Growth and Distribution, in: Review of Political Economy, 21(3), 369-391.
Lazonick, W., O’Sullivan, M. (2000): Maximizing shareholder value: a new ideology for corporate governance, in: Economy and Society, 29(1), 13-35.
Palley, T. (2006): Class Conflict and the Cambridge Theory of Income Distribution, in: Hein, E.; Heise, A.; Truger, A. (eds.): Wages, Employment, Distribution and Growth. International Perspectives, Basingstoke: Palgrave Macmillan, 1-16.
Palley, T. (2010): Managerial Pay (Cadrisme) and the Post Keynesian Growth Model, IMK Working Paper 9/2010.
Phillips, K. (1996): Arrogant Capital: Washington, Wall Street, and the Frustration of American Politics, New York: Little, Brown and Company.
Phillips, K. (2002): Wealth and Democracy: A Political History of the American Rich, New York: Broadway Books.
Piketty, T., Saez, E. (2003): Income inequality in the United States, 1913-1998, in: Quarterly Journal of Economics, 118(1), 1-39, tables and figures updated to 2008 in Excel format, http://www.econ.berkeley.edu/~saez/TabFig2008.xls.
Piketty, T., Saez, E. (2006): The evolution of top incomes: A historical and international perspective, in: American Economic Review, Paper and Proceedings, 96(2), 200-205.
Power, D., Epstein, G., Abrena, M. (2003): Trends in rentier incomes in OECD countries: Estimates, data and methods, PERI Working Paper Number 58a.
Rappaport, A. (2005): The economics of short-term performance obsession, in: Financial Analysts Journal, 61(3), 65-79.
22
Schmidt, R., Schwalbach, J. (2007): Zu Höhe und Dynamik der Vorstandsvergütung in Deutschland, in: ZfB, 77, Special Issue 1, 111-122.
Solow, R. (1958): A skeptical note on the constancy of relative shares, in: American Economic Review, 48(4), 618-631.
Tytelle, F., Jaumotte, I. (2007): How has the globalization of labor affected the labor income share in advanced countries? IMF Working Paper 07/298.
Van Treeck, T., Hein, E., Dünhaupt, P. (2007): Finanzsystem und wirtschaftliche Entwicklung: neuere Tendenzen in den USA und in Deutschland, IMK Studies 5/2007, Duesseldorf: Macroeconomic Policy Institute (IMK) at Hans Boeckler Foundation.
Wolff, E. (2010): Recent Trends in Household Wealth in The United States: Rising Debt and the Middle-Class Squeeze – an Update to 2007, Levy Economics Institute of Bard College Working Paper No. 589.
23
Appendix A: Information about the data and sources
Figure Sources Description
Top fractile income shares
Piketty/Saez (2003) Table A1
Figure 1, 7 and 10
Income composition by sources of income and by fractile of total income
Piketty/Saez (2003) Table A7
The data series constructed by Piketty and Saez rely on tax return statistics. The series are constructed for tax units and not individuals. However, according to the authors, the time series pattern for individuals should be very similar to that based on tax units. The shares of income are estimated by dividing the income amounts accruing to each fractile by total personal income computed from National Income Accounts.
Wage share National Income and Product Accouts (NIPA) Table 1.12 and 1.7.5
Figure 2, 8 and 11
Top wage income share Piketty/Saez (2003) Table B2
Figure 3, 9 and 12 Wage Share National Income and Product Accounts (NIPA) Table 1.14
Top wage income shares, constructed by Piketty and Saez, are based on published tables from the Internal Revenue Service that classify tax returns by size of salaries and wages. Fractiles are defined relative to the total number of tax units with positive wage and salaries estimated as the number of part-time and full time workers from National Income Accounts less the number of wives who are employees. The sum of total wages in the economy used to compute shares is obtained from the National Income Accounts.
Distribution of gross market income
Bach/Corneo/Steiner (2009) Table 3
Figure 4, 13 and 15
Composition of top market incomes by income component
Bach/Corneo/Steiner (2009) Table 6
Wage share Statistical Office Germany Figure 5, 14 and 16
Top wage income share Bach/Corneo/Steiner (2009)
Bach, Corneo and Steiner (2009) merge information from two sources, i.e. the German Socio-Economic Panel and the official income tax statistic. The authors analyze the evolution of gross market income at the individual level for the entire population aged 20 or older. They chose gross market income, arguing that it is closely related to national income. Moreover, the difference between total wage income in their integrated database and the national accounts appears to be little.
24
Appendix B
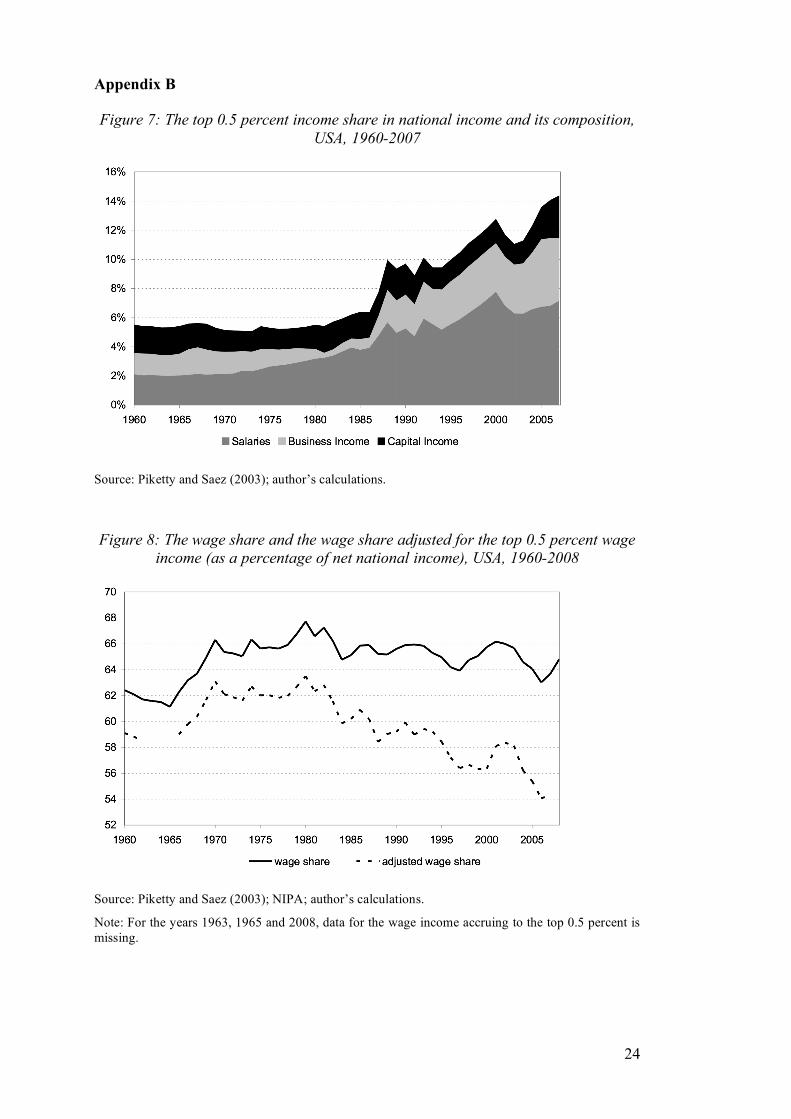
Figure 7: The top 0.5 percent income share in national income and its composition, USA, 1960-2007
Source: Piketty and Saez (2003); author’s calculations.
Figure 8: The wage share and the wage share adjusted for the top 0.5 percent wage income (as a percentage of net national income), USA, 1960-2008
Source: Piketty and Saez (2003); NIPA; author’s calculations.
Note: For the years 1963, 1965 and 2008, data for the wage income accruing to the top 0.5 percent is missing.

25
Figure 9: The wage share and the wage share adjusted for the top 0.5 percent wage income (as a percentage of net value added), corporate business sector, USA, 1960-
2008
Source: Piketty and Saez (2003); NIPA; author’s calculations.
Note: For the years 1963, 1965 and 2008, data for the wage income accruing to the top 0.5 percent is missing.
Figure 10: The top 0.01 percent income share in national income and its composition, USA, 1960-2007
Source: Piketty and Saez (2003); author’s calculations.

26
Figure 11: The wage share and the wage share adjusted for the top 0.01 percent wage income (as a percentage of net national income), USA, 1960-2008
Source: Piketty and Saez (2003); NIPA; author’s calculations.
Note: For the years 1963, 1965 and 2008, data for the wage income accruing to the top 0.01 percent is missing.
Figure 12: The wage share and the wage share adjusted for the top 0.01 percent wage income (as a percentage of net value added), corporate business sector, USA,
1960-2008
Source: Piketty and Saez (2003); NIPA; author’s calculations.
Note: For the years 1963, 1965 and 2008, data for the wage income accruing to the top 0.01 percent is missing.
27
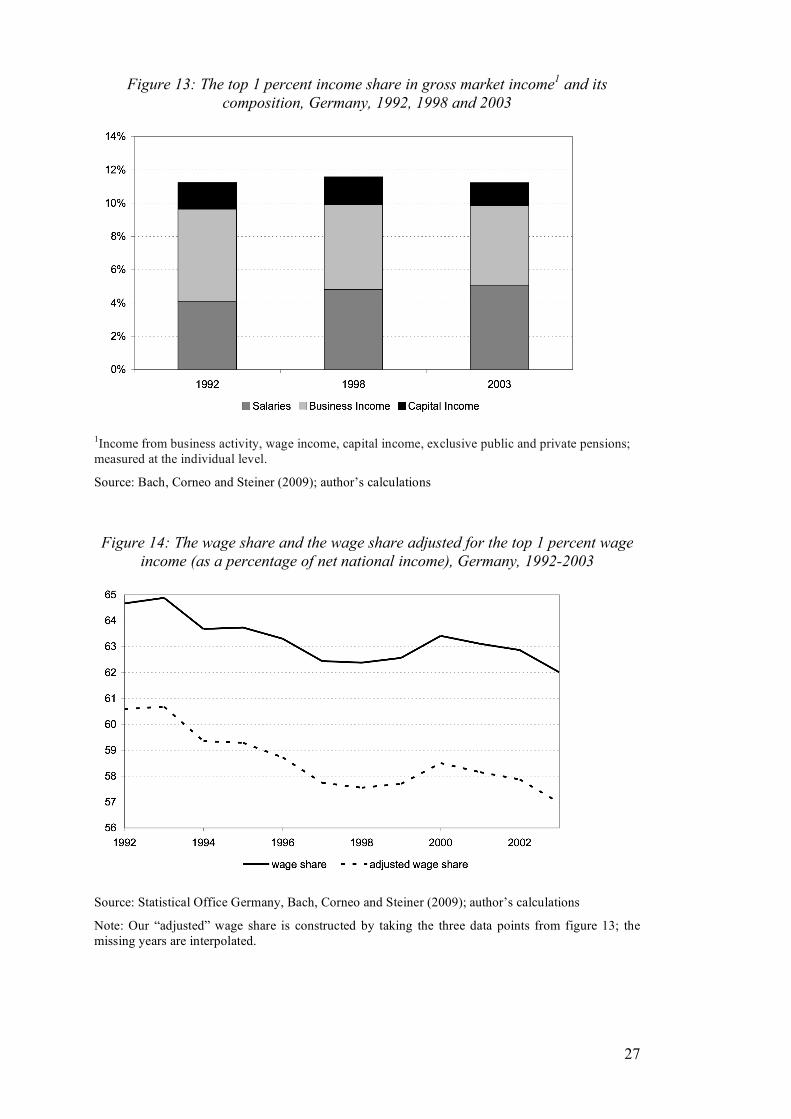
Figure 13: The top 1 percent income share in gross market income1 and its composition, Germany, 1992, 1998 and 2003
1Income from business activity, wage income, capital income, exclusive public and private pensions; measured at the individual level.
Source: Bach, Corneo and Steiner (2009); author’s calculations
Figure 14: The wage share and the wage share adjusted for the top 1 percent wage income (as a percentage of net national income), Germany, 1992-2003
Source: Statistical Office Germany, Bach, Corneo and Steiner (2009); author’s calculations
Note: Our “adjusted” wage share is constructed by taking the three data points from figure 13; the missing years are interpolated.
28
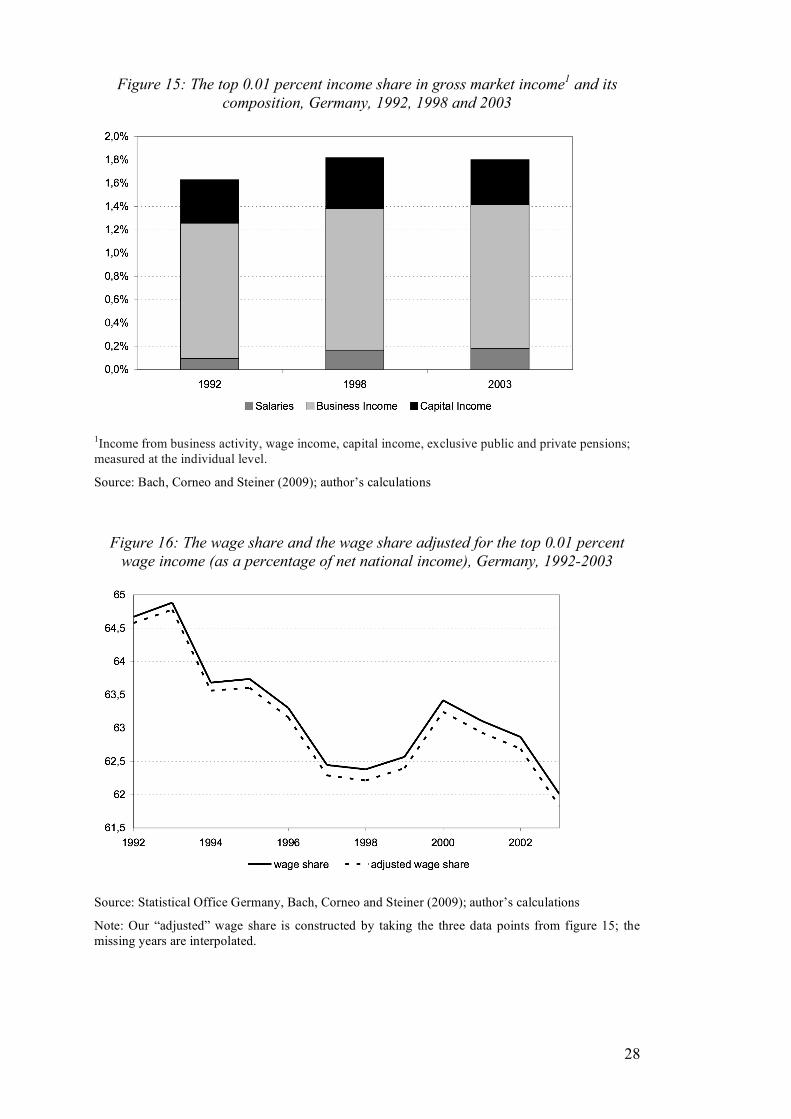
Figure 15: The top 0.01 percent income share in gross market income1 and its composition, Germany, 1992, 1998 and 2003
1Income from business activity, wage income, capital income, exclusive public and private pensions; measured at the individual level.
Source: Bach, Corneo and Steiner (2009); author’s calculations
Figure 16: The wage share and the wage share adjusted for the top 0.01 percent wage income (as a percentage of net national income), Germany, 1992-2003
Source: Statistical Office Germany, Bach, Corneo and Steiner (2009); author’s calculations
Note: Our “adjusted” wage share is constructed by taking the three data points from figure 15; the missing years are interpolated.

Publisher: Hans-Böckler-Stiftung, Hans-Böckler-Str. 39, 40476 Düsseldorf, Germany Phone: +49-211-7778-331, [email protected], http://www.imk-boeckler.de IMK Working Paper is an online publication series available at: http://www.boeckler.de/cps/rde/xchg/hbs/hs.xls/31939.html ISSN: 1861-2199 The views expressed in this paper do not necessarily reflect those of the IMK or the Hans-Böckler-Foundation. All rights reserved. Reproduction for educational and non-commercial purposes is permitted provided that the source is acknowledged.