workforce planning regions an opportunity for alignment and innovation
TRANSCRIPT

WORKFORCE PLANNING REGIONSAn opportunity for alignment and innovation

What economists say about regions• Businesses choose to cluster and grow based on competitive advantage
• Accessibility to resources• People
• Can I find and recruit the talent from close enough that people will come to work for me?• Is the infrastructure in place to create a skilled workforce nearby?• What is the cost to recruit and retain talent based on the other companies within the commute area?
• Materials – raw materials, processed materials• Are the materials I need readily available in my vicinity?• If not, am I close enough to reliable transportation to get what I need when I need it?
• Similar industries• Can gain efficiencies by locating near my upstream and downstream supply chain?• Are there other companies similar to mine close by, creating more opportunities and synergies?
• Regions are about growing competitive advantage, economies and jobs

Workforce Regions are also a requirement
What is the opportunity?economies are regional – businesses recruit talent and people commute
across boundariesintended to align economic development and workforce strategies a way to create synergies and leverage resources
New emphasis on regions as a driver of innovation - anticipate some DOL funding opportunities will be tied to workforce regions.
Requirement: must have regions identified in our state plan in order to receive WIOA Title I funds. Regional plans must be submitted by locals.

Local Areas and Regions
WIA created Local Workforce
Development Areas (WDAs)• Identified by Local Elected Officials• One workforce development board per area
WIOA created Workforce Regions• Governor identifies regions, based on data• All local areas become regions
• Some regions may consist of just one local area• Some regions may contain two or more local areas• Some regions could contain local areas across state boundaries
Regions do not change the authority of or allocations to local workforce areas

ProcessDate Activity
Oct 2014
Gov. asks for a “data driven recommendation” re: workforce regions in consultation with WDCs, LEOs and others.
Feb Local Governance & Sector (LG&S) Subcommittee starts data review and process discussions
April NPRMs require states regions policy and lists possible factors to identify regions. LG&S continues working on process. Develops a letter and webinar to solicit input.
June WTECB asks WDCs & LEOs which factors to use for identifying regions and suggestions for possible regions. WDCs and LEOS list same factors as NPRMs. Eleven areas ask to be identified as regions.
July Regions Task Force (6 WDCs, labor, business, Governor’s Office, and staff) unanimously recommend factors to identify regions. LG&S unanimously agrees, Steering Committee agrees with one “no” vote. WTECB unanimously agrees.
Aug Regions policy finalized after public comment. Staff works on suggested regions based on policy.
Sept September 8 Steering Committee cancelled. Staff presents map to WTECB on Sept 17. Thirty day public vetting process begins. WTECB asks locals to respond to the suggested map by Oct 17.
Oct Oct 21 WTECB recommends regions to Governor. He has 15 days to respond. Regions built into state plan and regional guidance.
Nov First draft of state plan due for review by WTECB on 11/19.
What we learned from local input and taskforce• Strong agreement on economic factors to identify regions
Labor marketsEconomic development areasIndustry concentration/sectors
• 11 of 12 areas asked to be identified as a region• Strong emphasis on existing regional collaborations • Interest in cross state collaborations• Concerns about loss of flexibility and the planning process
Staff’s task – consider the feedback, the requirements of the policy and the Governor’s expectation to make a data driven decision and develop a map for further consultation.

Factors used to identify regions
• Factors applied from the policy• Labor Sheds (population centers and commute patterns) • Economic Development Regions• Industry Concentration/Location Quotients
NOTE: Governor’s Office asked for consideration of alignment with Governor’s sectors
• Additional local factors• Locally identified sectors • Locally initiated regional planning efforts• Geographic boundaries
• NOTE: Regions must consist of complete, contiguous WDAs

Clallam
Jefferson
GraysHarbor
Mason
Kitsap
Thurston
Lewis
Pacific
Okanogan
Chelan
Douglas
FerryStevens
PendOreille
Lincoln
Spokane
Whitman
Grant Adams
Walla Walla
Columbia
Garfield
Asotin
King
Snohomish
Pierce Kittitas
Yakima
Skamania
Skagit
Cowlitz
Clark
Wahkiakum
Klickitat
Whatcom
Benton
Franklin
San Juan
Island
Olympic WDA
PacMtn WDA
NWWDA
SWWDA
South Central WDA
North CentralWDA
Benton Franklin
WDA
Eastern WDA Spokane
WDA
Workforce Snohomish
WDA
SeaKing WDA
Workforce Central WDA
Washington’s WorkforceDevelopment Areas (WDAs)-
Building Blocks of Workforce Planning Regions
REGIONS NOT CHANGE WDA BOUNDARIES

Labor Sheds - Population Centers (MSAs)
`
Clallam
Jefferson
GraysHarbor
Mason
Kitsap
Lewis
Pacific
Okanogan
Chelan Douglas
FerryStevens
PendOreille
Lincoln
Spokane
Whitman
Grant Adams
Walla Walla
Columbia
Garfield
Asotin
Kittitas
Yakima
Skamania
Skagit
Cowlitz
Clark
Wahkiakum
Klickitat
Benton
Franklin
San Juan
Island
Bellingham MSA 201,140
Yakima MSA 243,231
Spokane MSA
471,221
Snohomish
King
Pierce
Kennewick-Pasco-Richland MSA 253,340
Whatcom
Longview MSA 201,140
Wenatchee MSA 110,884
Seattle-Tacoma-Bellevue
MSA3,439,809
Olympia MSA
252,264
Bremerton-Silverdale
251,133
Mt. Vernon-Anacortes 116,901
Washington Multnomah
Columbia
Part of Portland-Vancouver-Beaverton
MSA 2,226,009 SOURCE: Office of Management and Budget analysis of census data
Seattle-Tacoma-Olympia
Combined Statistical Area
4,199,312

Bonner
Kootenai
Benewah
Latah
Nez Perce
Washington Multnomah
ClatsopColumbia
Sherman
Gilliam
Umatilla
Clallam
Jefferson
GraysHarbor
Mason
Kitsap
Thurston
Lewis
Pacific
Okanogan
Chelan
Douglas
FerryStevens
PendOreille
Lincoln
Spokane
Whitman
Grant Adams
Walla Walla
Columbia
Garfield
Asotin
King
Snohomish
Pierce Kittitas
Yakima
Skamania
Skagit
Cowlitz
Clark
Wahkiakum
Klickitat
Benton
Franklin
San Juan
Island
Olympic WDA
PacMtn WDA
NWWDA
SWWWDA
South Central WDA
North CentralWDA
Benton Franklin
WDA
Eastern WDA Spokane
WDA
Workforce Snohomish
WDA
SeaKing WDA
Workforce Central WDA
Whatcom
34%
11%
17%
6%10 %
44%
8%
6%
5%
8%
5% 5%
25%
14%
14%
Labor Sheds – WDA to WDA Commute Patterns 5% or moreSource: the US Census
Longitudinal Employment and
Household Dynamics (LEHD)
Commute Flows Between WDAs
##%
KEY:
25 % 7 %
5 %
16%
6%
6%
19%
9%
43%
5%
Interstate Commute Flows between Counties ##%
Morrow
Wallowa
Boundary
Hood River

Clallam
Jefferson
GraysHarbor
Mason
Kitsap
Thurston
Lewis
Pacific
Okanogan
Chelan
Douglas
FerryStevens
PendOreille
Lincoln
Spokane
Whitman
Grant Adams
Walla Walla
Columbia
Garfield
Asotin
King
Snohomish
Pierce Kittitas
Yakima
Skamania
Skagit
Cowlitz
Clark
Wahkiakum
Klickitat
Whatcom
Benton
Franklin
San Juan
Island
Olympic WDA
PacMtn WDA
NWWDA
South Central WDA
North CentralWDA
Benton Franklin
WDA
Eastern WDA Spokane
WDA
Workforce Snohomish
WDA
SeaKing WDA
Workforce Central WDA
SWWDA
Federal EconomicDevelopmentDistricts Source: EconomicDevelopment Administration
Cowlitz-Wahkiakum
Peninsula
Columbia-Pacific (COLPAC)
SouthEast Washington
Tri County
Benton-Franklin
North Central
Multnomah
Greater Portland Inc.Clark, Skamania, Columbia, Washington, Yamhill, Multnomah, Clackamas
Mid-Columbia (MCEDD)Skamania, Klickitat, Hood River, Wasco, Sherman
Greater Spokane
Central Puget
Sound

Sectors
Governor Identified Sectors
• Aerospace• Information and Communication
Technology• Maritime• Agriculture• Life Sciences• Clean Tech
Locally Identified Sectors
• Aerospace• Information Technology• Maritime• Agriculture• Food Processing• Construction• Energy, Utilities, Waste Management• Professional Services• Finance• Manufacturing (prioritized by all)• Healthcare (prioritized by all by Pac Mtn)

Examples of Regional Collaborations• Green Jobs Grant (King, Kitsap, Pierce, Snohomish WDCs)• Homelessness Initiatives (King, Pierce, Snohomish WDCs)• Green Jobs Grant (King, Snohomish, Spokane WDCs)• WorkStart (King, Northwest WDC)• JBLM Veterans Initiatives (King, Pierce, Snohomish, Pac Mtn)• Camo2Commerce (Pierce, PacMtn)• Housing and Employment Navigator Program (Pierce, Northwest, South
Central WDCs), • Enhanced Ammonia Refrigeration Course – (Parts of North Central and South
Central WDAs)• Hanford (South Central, Benton Franklin)• Air Washington (Statewide)• Work Readiness Washington (Statewide)

Effort to Formalize Regional Planning
Clallam
Jefferson
GraysHarbor
Mason
Kitsap
Thurston
Lewis
Pacific
Okanogan
Chelan
Douglas
FerryStevens
PendOreille
Lincoln
Spokane
Whitman
Grant Adams
Walla Walla
Columbia
Garfield
Asotin
King
Snohomish
Pierce Kittitas
Yakima
Skamania
Skagit
Cowlitz
Clark
Wahkiakum
Klickitat
Whatcom
Benton
Franklin
San Juan
Island
Olympic WDA
PacMtn WDA
NWWDA
SWWDA
South Central WDA
North CentralWDA
Benton Franklin
WDA
Eastern WDA Spokane
WDA
Workforce Snohomish
WDA
SeaKing WDA
Workforce Central WDA
East Cascades Workforce
Planning Region 2015
Columbia-Willamette Workforce
Collaborative since 2010 Source: Locally developed materials

POSSIBLE WORKFORCE PLANNING REGIONSWhat the data suggested

Clallam
Jefferson
Grays Harbor
Mason
LewisPacific
Snohomish
Pierce
Skagit
Whatcom
Olympic WDA
PacMtn WDA
NWWDA
SeaKing WDA
Kitsap –
Thurston labor force ~114K
Workforce Snohomish WDA
Workforce Central WDA
San Juan
Island
Seattle – Tacoma – Bellevue
MSA
Olympia MSA
Bremerton-Silverdale
MSA
Mt. Vernon-Anacortes MSA
Are Olympic, PacMtn & NWWDA part of the labor shed?• Parts of these Local Areas are in the Combined
Statistical Area• 100K+ more people commute in and out of the
MSA• 39K+ between Olympic and Snohomish/
King/Pierce• 35K+ between NWWDA and Snohomish/
King/Pierce• 24K+ between PacMtn and Snohomish/
King/Pierce
Puget Sound
12,00
012,000
Snohomish/King/Pierce Labor ShedMore than 300,000 people commute within the Seattle-Tacoma-Bellevue MSA• 174K+ between King and Snohomish• 130K+ between Pierce and King• 225K+ from Snohomish and Pierce into King
96,5
00
128,
500
35,0
0046
,000
9,00
06,
000
5,000
8,00
0 6,00
0
3,50
0
5,500
7,80
0
6,000
4,000
3,000
22,000
4,000
Source: US Census Longitudinal Employment and Household Dynamics (LEHD)
Clallam
Jefferson
Grays Harbor
Mason
LewisPacific
Snohomish
Pierce
Skagit
Whatcom
Olympic WDA
PacMtn WDA
NWWDA
SeaKing WDA
Thurston
Workforce Snohomish WDA
Workforce Central WDA
San Juan
Island
Kitsap
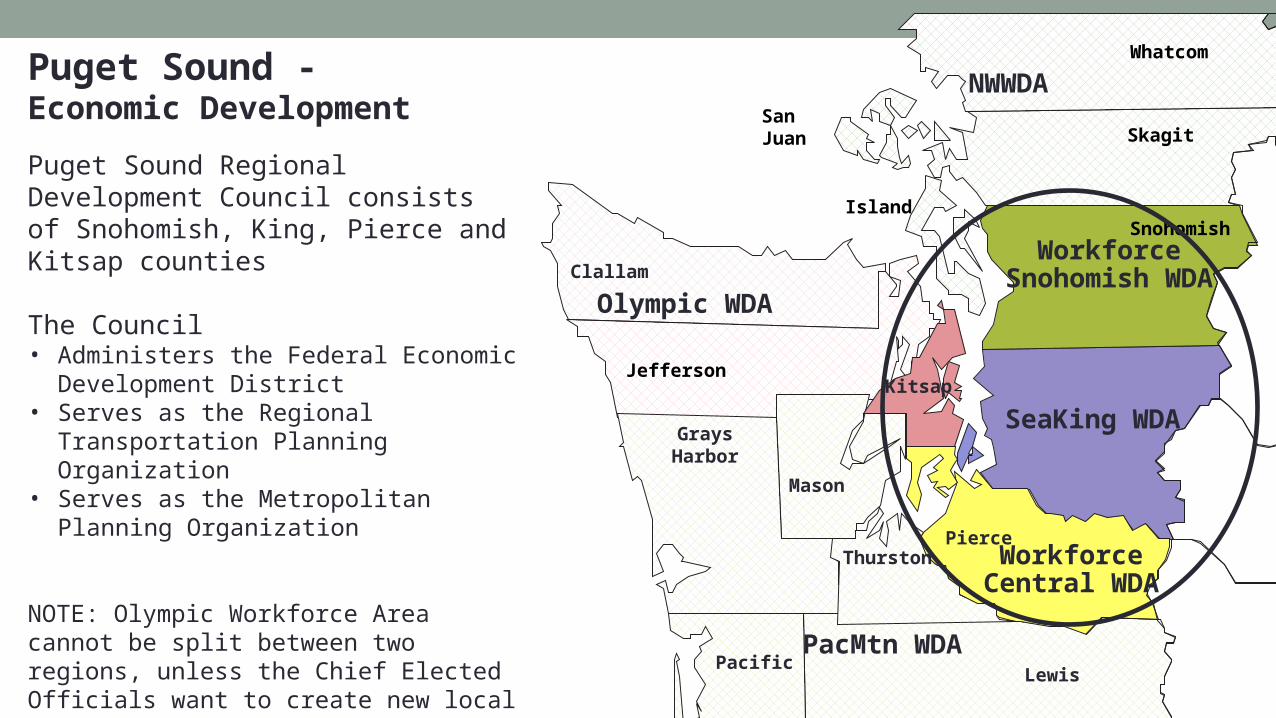
Puget Sound - Economic Development
Puget Sound Regional Development Council consists of Snohomish, King, Pierce and Kitsap counties
The Council• Administers the Federal Economic
Development District• Serves as the Regional Transportation
Planning Organization• Serves as the Metropolitan Planning
Organization
NOTE: Olympic Workforce Area cannot be split between two regions, unless the Chief Elected Officials want to create new local areas

Local Area Snohomish King Pierce Olympic
Aerospace LQ 5.3 LQ 1.18
Locally Prioritized
Locally Prioritized
Locally Prioritized
Information and Communi-cation Technology
LQ 1.9
Locally Prioritized
Locally Prioritized
Locally Prioritized
Life Sciences LQ 1.31 LQ 1.17
Maritime LQ 1.03 LQ 9.87, 1.25 & 1.23
Locally Prioritized
Locally Prioritized
Locally Prioritized
Construction Locally Prioritized
Locally Prioritized
Locally Prioritized
Trade & Transportation
Locally Prioritized
Locally Prioritized
Locally Prioritized
Clallam
Jefferson
Grays Harbor
Mason
LewisPacific
Snohomish
Pierce
Skagit
Whatcom
Olympic WDA
PacMtn WDA
NWWDA
SeaKing WDA
Thurston
Workforce Snohomish WDA
Workforce Central WDA
San Juan
Island
Kitsap
Puget Sound - Sectors

Clallam (employment 25K+)
Jefferson (employment < 10K)
Grays Harbor
Mason
LewisPacific
Snohomish
Pierce
Skagit
Whatcom
Olympic WDA
PacMtn WDA
NWWDA
SeaKing WDA
Thurston
Workforce Snohomish WDA
Workforce Central WDA
San Juan
Island
Kitsap (employer
76K)
• Consisting of Snohomish, King, Pierce and Olympic Local Areas based on Labor Sheds Economic Development Regions Sector Opportunities
• Do not include NWWDA or PacMtn The region would be too large NWWDA & PacMtn share fewer
similarities with Snohomish, King, Pierce and the most populous part of Olympic
PUGET SOUND REGION
King

Washington
Clackamas
Multnomah
ClatsopColumbia
Hood
Columbia-Willamette Region
Clark County is part of the Portland MSA• 57K+ people commute into Portland MSA from
SWWDC • 12K+ commute from Portland MSA into SWWDA• This is the 2nd most signification commute pattern
in the state, after the Puget Sound
SWWDC is part of Greater Portland Inc. economic development strategy
SWWDC formed the Columbia-Willamette Workforce Collaborative with Portland and Clackamas WDBs. They work together on four sector strategies: Manufacturing, Healthcare, Clean Tech, High Tech
Lewis
Pacific
Skamania
Cowlitz
Clark
WahkiakumSWWWDA
41,0
00
5,50
0
4,00
0
3,50
0
8,500
8,000
2,000
2,00
0
65,000
Source: US Census Longitudinal Employment and Household Dynamics (LEHD)
20,000 31,0
00
45,000
26,000
60,0
00
2,00
0

Bonner
Kootenai
Benewah
Latah
Nez Perce
FerryStevens
PendOreille
Lincoln
Spokane
Whitman
Walla Walla
Columbia
Garfield
Asotin
Eastern WDA Spokane
WDA
BoundarySpokane Region
Spokane is the 2nd largest MSA in Washington• Over 470,000 people are in the MSA• Relatively few people commute between
Spokane and surrounding WDAs• Spokane is its own economic development
region • Spokane is its own transportation and
metropolitan planning organization• Spokane only shares a few sector priorities
with its neighbors
4,000
5,50
0
8,000
Source: US Census Longitudinal Employment and Household Dynamics (LEHD)

Clallam
Jefferson
GraysHarbor
Mason
Kitsap
Thurston
Lewis
Pacific
Okanogan
Chelan
Douglas
FerryStevens
PendOreille
Lincoln
Spokane
Whitman
Grant Adams
Walla Walla
Columbia
Garfield
Asotin
King
Snohomish
Pierce Kittitas
Yakima
Skamania
Skagit
Cowlitz
Clark
Wahkiakum
Klickitat
Whatcom
Benton
Franklin
San Juan
Island
Olympic WDA
PacMtn WDA
NWWDA
SWWDA
South Central WDA
North CentralWDA
Benton Franklin
WDA
Eastern WDA Spokane
WDA
Workforce Snohomish
WDA
SeaKing WDA
Workforce Central WDA
8.38
6.76
5.92
1.11
7.3
7.952.83
9.56
6.72
2.51
2.0
5.35 3.52
1.96
1.36
1.72
1.066.08
1.285.33
1.701.4
East Cascades Region
North Central, South Central, Eastern and Benton Franklin• Agriculture – strong
concentration

Clallam
Jefferson
GraysHarbor
Mason
Kitsap
Thurston
Lewis
Pacific
Okanogan
Chelan
Douglas
FerryStevens
PendOreille
Lincoln
Spokane
Whitman
Grant Adams
Walla Walla
Columbia
Garfield
Asotin
King
Snohomish
Pierce Kittitas
Yakima
Skamania
Skagit
Cowlitz
Clark
Wahkiakum
Klickitat
Whatcom
Benton
Franklin
San Juan
Island
Olympic WDA
PacMtn WDA
NWWDA
SWWWDA
South Central WDA
North CentralWDA
Benton Franklin
WDA
Eastern WDA Spokane
WDA
Workforce Snohomish
WDA
SeaKing WDA
Workforce Central WDA
Source: ESD Survey of Workforce Development Councils
East Cascades Region
North Central, South Central, Eastern and Benton Franklin• Agriculture – strong
concentration, as well as local prioritization and a focus on food processing in 3 WDAs.

Clallam
Jefferson
GraysHarbor
Mason
Kitsap
Thurston
Lewis
Pacific
Okanogan
Chelan
Douglas
FerryStevens
PendOreille
Lincoln
Spokane
Whitman
Grant Adams
Walla Walla
Columbia
Garfield
Asotin
King
Snohomish
Pierce Kittitas
Yakima
Skamania
Skagit
Cowlitz
Clark
Wahkiakum
Klickitat
Whatcom
Benton
Franklin
San Juan
Island
Olympic WDA
PacMtn WDA
NWWDA
SWWWDA
South Central WDA
North CentralWDA
Benton Franklin
WDA
Eastern WDA Spokane
WDA
Workforce Snohomish
WDA
SeaKing WDA
Workforce Central WDA
2.241.37
2.19
1.43
1.09
1.35
1.38
1.28
4.32
4.321.47
1.45
1.44
1.31
1.35
1.09
Source: Bureau of Labor Statistics, 2014 Washington State Quarterly Census of Employment and Wage records
East Cascades Region
North Central, South Central, Eastern and Benton Franklin• Agriculture – strong
concentration, as well as local prioritization and a focus on food processing in 3 WDAs.• Clean Tech – Also a strength in the region

Clallam
Jefferson
GraysHarbor
Mason
Kitsap
Thurston
Lewis
Pacific
Okanogan
Chelan
Douglas
FerryStevens
PendOreille
Lincoln
Spokane
Whitman
Grant Adams
Walla Walla
Columbia
Garfield
Asotin
King
Snohomish
Pierce Kittitas
Yakima
Skamania
Skagit
Cowlitz
Clark
Wahkiakum
Klickitat
Whatcom
Benton
Franklin
San Juan
Island
Olympic WDA
PacMtn WDA
NWWDA
SWWWDA
South Central WDA
North CentralWDA
Benton Franklin
WDA
Eastern WDA Spokane
WDA
Workforce Snohomish
WDA
SeaKing WDA
Workforce Central WDA
East Cascades Region
North Central, South Central, Eastern and Benton Franklin• Agriculture – strong
concentration, as well as local prioritization and a focus on food processing in 3 WDAs.• Clean Tech – Also a strength in the region• Energy and Utilities – also a focus in several parts of the region

Clallam
Jefferson
GraysHarbor
Mason
Kitsap
Thurston
Lewis
Pacific
Okanogan
Chelan
Douglas
FerryStevens
PendOreille
Lincoln
Spokane
Whitman
Grant Adams
Walla Walla
Columbia
Garfield
Asotin
King
Snohomish
Pierce Kittitas
Yakima
Skamania
Skagit
Cowlitz
Clark
Wahkiakum
Klickitat
Whatcom
Benton
Franklin
San Juan
Island
Olympic WDA
PacMtn WDA
NWWDA
SWWWDA
South Central WDA
North CentralWDA
Benton Franklin
WDA
Eastern WDA Spokane
WDA
Workforce Snohomish
WDA
SeaKing WDA
Workforce Central WDA
East Cascades Region
North Central, South Central, Eastern and Benton Franklin• Agriculture – strong
concentration, as well as local prioritization and a focus on food processing in 3 WDAs.• Clean Tech – Also a strength in the region• Energy and Utilities – also a focus in several parts of the region• As well as Trade, Warehousing and Transportation

Local Regional Planning Efforts
Clallam
Jefferson
GraysHarbor
Mason
Kitsap
Thurston
Lewis
Pacific
Okanogan
Chelan
Douglas
FerryStevens
PendOreille
Lincoln
Spokane
Whitman
Grant Adams
Walla Walla
Columbia
Garfield
Asotin
King
Snohomish
Pierce Kittitas
Yakima
Skamania
Skagit
Cowlitz
Clark
Wahkiakum
Klickitat
Whatcom
Benton
Franklin
San Juan
Island
Olympic WDA
PacMtn WDA
NWWDA
South Central WDA
North CentralWDA
Benton Franklin
WDA
Eastern WDA Spokane
WDA
Workforce Snohomish
WDA
SeaKing WDA
Workforce Central WDA
East Cascades Workforce
Planning Region 2015
Source: Locally developed materials

Washington Multnomah
Clallam
Jefferson
GraysHarbor
Mason
Kitsap
Thurston
Lewis
Pacific
Okanogan
Chelan
Douglas
FerryStevens
PendOreille
Lincoln
Spokane
Whitman
Grant Adams
Walla Walla
Columbia
Garfield
Asotin
King
Snohomish
Pierce Kittitas
Yakima
Skamania
Skagit
Cowlitz
Clark
Wahkiakum
Klickitat
Whatcom
Benton
Franklin
San Juan
Island
Olympic WDA
South Central WDA
North CentralWDA
Benton Franklin
WDA
Eastern WDA
Workforce Snohomish
WDA
SeaKing WDA
Suggested Workforce Planning Regions
1
4
3
52 Spokane
WDA
6
NWWDA
Workforce Central WDA
Pac Mtn WDA

Addressing local concerns• Planning requirements
• Local areas have a history of working together, but that is not the same as regional planning• Quality regional planning comes with practice and time
• Start from a strengths approach – allow locals in multi-area regions to focus on those aspects of regional planning most likely to create success, and take the time needed to work on the rest
• Expect incremental/phased implementation• Allow room for error and learning opportunities as long as progress is being made• Do not expect WDCs in a region to resolve issues that are WDC specific. It is still a state
responsibility to assure each local area is in compliance.
• Do not add more process than necessary• Recognize that collaboration takes resources – offer additional funding to multi-area
regions?