workforce investment act program year 2014 annual report ... · workforce investment act program...
TRANSCRIPT

WIA Annual Report December 2015 Page 1 of 37
Workforce Investment Act Program Year 2014 Annual Report Narrative

WIA Annual Report December 2015 Page 2 of 37
“The field of knowledge is the common property of all mankind.”
-Thomas Jefferson to Henry Dearborn

WIA Annual Report December 2015 Page 3 of 37
TABLE OF CONTENTS
Introduction Status of State Evaluation Activities Activities Funded by the State’s Discretionary Funds Participants in the Workforce Investment System Rapid Response Activities Approved Waivers Customer Satisfaction Data Performance Data

WIA Annual Report December 2015 Page 4 of 37
Introduction
The Commonwealth of Virginia’s grant recipient and fiscal agent for the federal Workforce Investment Act funds, the Virginia
Community College System (VCCS), is pleased to submit its Program Year 2014 WIA Annual Report.
Program Year 2014 (PY14) has been a year of state legislative action, managing over $44 million in discretionary grants and preparing for the WIOA implementation. Some of the highlights include: The Virginia General Assembly approved an amendment on March 17, 2015 which established that All Local Workforce Development Areas (LWDAs) are required to ensure that at least 40% of their formula-allocated expenditures in a program year are expended on allowable training costs in the WIOA Title I Adult and Dislocated Worker programs. The amendment specifically states: Each local workforce development board shall allocate a minimum of 40 percent of WIOA Adult and Dislocated Worker funds to training services as defined under § 134(c)(3)(D) of the WIOA that lead to recognize postsecondary education and workforce credentials aligned with in-demand industry sectors or occupations in the local area or region. If LWDAs do not meet the required training expenditure requirements, there will be sanctions that increase in severity for each year of noncompliance. Sanctions may include but are not limited to - corrective action plans, ineligibility to receive state-issued awards, additional WIOA incentives or sub-awards. This amendment is effective July 1, 2015 and is located in the Code of Virginia, Chapter 4.2 section 2.2-2472.2 VCCS is now managing approximately $44 million in discretionary grants that include the following: Disability Employment Initiative Round IV; Workforce Data Quality Initiative Round Two; Veterans Services Demonstration Project; Job Driven National Emergency Grant/Dislocated Worker Grant; Dislocated Worker Training National Emergency Grant/Dislocated Worker Grant; Workforce Innovation Fund-Financial Success Network; National Governor's Association-Connecting Postsecondary Education & The Workforce; and the Supplemental Nutrition Assistance Program Employment & Training. Of the $44 million, The Commonwealth was successful in receiving three grant awards in PY14. In October 2014, the VCCS was awarded the Workforce Investment Act, Workforce Innovation funds in the amount of $11,196,152 by
the U.S. Department of Labor, Employment and Training Administration to implement the Working Families Success Network Model.
This Model will be implemented with six One Stop Center sites in Virginia for 1800 participants. The focus of this award is to provide
workforce and education services resulting in career advancement: education and training, employability skills, job placement; income
and work support: access to student financial aid, public benefits, free tax preparation; and financial services and asset building: financial
education, financial coaching.

WIA Annual Report December 2015 Page 5 of 37
In April 2015, the Virginia Department of Social Services (VDSS) was awarded the Supplemental Nutrition Assistance Program (SNAP)
Employment & Training grant project in the amount of $22,329,952 by the U.S. Department of Agriculture. The VCCS is a sub-
recipient to the VDSS for this grant. The focus of this grant is to pilot an effort to test existing and new employment and training
initiatives that will increase the number of SNAP work registrants who obtain unsubsidized employment, increase earned income, and
reduce reliance on public assistance. The VCCS will partner with agencies to deliver services to 3,760 participants who will receive
career and employment services in targeted industry sectors with the goal of each earning at least one industry-recognized credential.
In August 2014, the VCCS was awarded $170,000 by the National Governor’s Association Center for Best Practices for the
Commonwealth of Virginia to participate in the Center’s policy academy on Connecting Post-Secondary Education & the
Workforce. The focus of the academy is to help participating states and territories make progress in four integrated
components: Articulate and implement a strong vision connecting the education and training systems with the needs of the economy so
more Americans achieve the “new minimum” of a postsecondary degree or certificate with labor market value to gain access to the
middle class and beyond; integrate and use education and workforce data to inform policy, track progress, and measure success; build
industry and education partnerships to get results; and modify the use of resources and incentives to support the attainment of the
integrated vision.
In preparation for the WIOA implementation, the Commonwealth of Virginia approved an amendment authorizing the development of
a Combined State Plan pursuant to the WIOA.
In addition, a state WIOA Implementation team has been created (formulated) to help develop the State Combined Plan. This team is
comprised of partners from various agencies including the Department of Aging and Rehabilitative Services, Virginia Employment
Commission, Department of Education, Virginia Department of Labor of Industry, and representation from the Local Workforce
Development Boards (LWDBs).
Overall, the Commonwealth of Virginia has had a successful PY14 in meeting performance measures, receiving grants and
implementing WIA Title I programs.
WIA Annual Report December 2015 Page 6 of 37
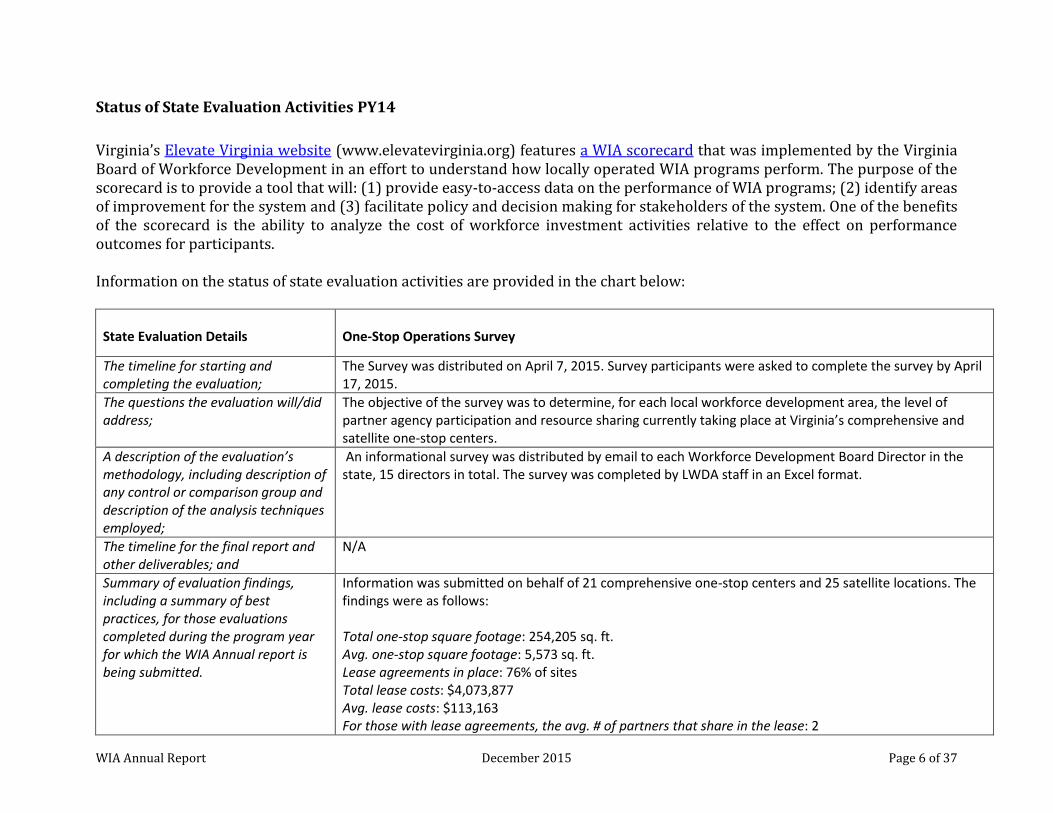
Status of State Evaluation Activities PY14
Virginia’s Elevate Virginia website (www.elevatevirginia.org) features a WIA scorecard that was implemented by the Virginia Board of Workforce Development in an effort to understand how locally operated WIA programs perform. The purpose of the scorecard is to provide a tool that will: (1) provide easy-to-access data on the performance of WIA programs; (2) identify areas of improvement for the system and (3) facilitate policy and decision making for stakeholders of the system. One of the benefits of the scorecard is the ability to analyze the cost of workforce investment activities relative to the effect on performance outcomes for participants. Information on the status of state evaluation activities are provided in the chart below:
State Evaluation Details
One-Stop Operations Survey
The timeline for starting and completing the evaluation;
The Survey was distributed on April 7, 2015. Survey participants were asked to complete the survey by April 17, 2015.
The questions the evaluation will/did address;
The objective of the survey was to determine, for each local workforce development area, the level of partner agency participation and resource sharing currently taking place at Virginia’s comprehensive and satellite one-stop centers.
A description of the evaluation’s methodology, including description of any control or comparison group and description of the analysis techniques employed;
An informational survey was distributed by email to each Workforce Development Board Director in the state, 15 directors in total. The survey was completed by LWDA staff in an Excel format.
The timeline for the final report and other deliverables; and
N/A
Summary of evaluation findings, including a summary of best practices, for those evaluations completed during the program year for which the WIA Annual report is being submitted.
Information was submitted on behalf of 21 comprehensive one-stop centers and 25 satellite locations. The findings were as follows: Total one-stop square footage: 254,205 sq. ft. Avg. one-stop square footage: 5,573 sq. ft. Lease agreements in place: 76% of sites Total lease costs: $4,073,877 Avg. lease costs: $113,163 For those with lease agreements, the avg. # of partners that share in the lease: 2

WIA Annual Report December 2015 Page 7 of 37
Cost-sharing agreements in place: 54% Resource Rooms present: 43 of 46 sites Resource Room avg. square footage: 1,091 sq. ft. Avg. annual cost for the Resource Room (22 sites reporting): $44,676 Avg. # of case managers on-site: 6 (5.9) Avg. case management costs: $252,738 Avg. # of WIA case managers on-site: 3 (2.8) Avg. WIA case management costs: $133,613
Uniform Reporting Virginia hereby assures that all required elements are reported uniformly so that a state-by-state comparison can be made. Activities Funded by the State’s Discretionary Funds Virginia utilized discretionary funds for the following initiatives:
Incentive awards for most improved and exemplary performance were provided to twelve local workforce areas.
The Virginia Board of Workforce Development competitively-awarded statewide WIA funds to four local workforce
areas to support projects emphasizing local coordination. With the goal of increasing the region’s level of credential
attainment, New River/ Mount Rogers Workforce Investment Board established Small Learning Communities within its
rural service area by offering four portable Roving Computer Labs (RCLs) which serve as remote one-stop resource
rooms to participants, including local and regional businesses. Northern Virginia Workforce Investment Board
supported a Veterans’ Job Developer position responsible for placing veterans into meaningful employment and
developing relationships with regional employers. In response to the growing accommodation and food services
industries in Northern Virginia, Alexandria/ Arlington Workforce Investment Board enrolled a cohort of formerly
homeless individuals in a training program to earn a ServSafe credential which would qualify them for a variety of
culinary job opportunities. West Piedmont Workforce Investment Board developed a program emphasizing youth
exposure to Career Pathways and businesses within the region through career exploration opportunities including
introduction of students to Career Pathways relevant to local industries, and enhancement of interviewing skills
through interviewstream.com.
A Credential Incentive Pilot program was offered to provide incentives to seven colleges across five regions delivering
noncredit workforce training that leads to student attainment of industry-recognized credentials. In addition to

WIA Annual Report December 2015 Page 8 of 37
geographic diversity, colleges selected in the pilot demonstrated a capacity to provide workforce training through
noncredit instruction and direct connections to industries with regional labor demands that intersected with college
service regions and course offerings.
Allocations were provided to local workforce development areas for WIOA transition activities consistent with TEGL
12-14 Allowable Uses and Funding Limits of WIA Program Year 2014 Funds for WIOA Transition Activities.
Participants in the Workforce Investment System This section provides information on participants in the workforce investment system. More than 100,400 individuals received
universal/core services through a Virginia Workforce Center during the report period. Specific details on participants in the
workforce investment system are available in the performance data section. As noted by DOL in recent state of the state letters,
Virginia either met or exceeded all negotiated performance levels for PY 2014. Despite the ongoing impact of the weak economic
climate in many local areas, on average 78% of adults and dislocated workers served were placed into employment and 90%
maintained employment retention.
Virginia is pleased to share examples of the many success stories for career-seekers and business customers who were served
by the workforce system.
Dislocated Worker Success Story
Finding Meaningful Careers in Unexpected Places
Thomas McNinch of Fredericksburg first visited Michelle Beverage, a Germanna Community College adult career coach, at the Fredericksburg Workforce Center in February of last year. Disappointed at the lack of opportunities to put his B.S. in geography to good use, McNinch was interested in increasing his skills to pursue a meaningful career. After being out of work for a 10-month period, McNinch felt like he had hit a
wall when it came to his options and decided it was time for a change.

WIA Annual Report December 2015 Page 9 of 37
“Searching for a new career was a daunting task,” McNinch said. “Applying for positions via the internet was like sending your resume into a black hole. Applying in person and making contact with the hiring person proved just as difficult. After months of ‘We’ll be in touch,’ and, ‘Good luck in your career endeavors,’ I decided to contact Germanna’s Center for Workforce and came in contact with Michelle Beverage and Stephanie Crowe (outreach specialist) who provided the information and connections that worked for me.” Michelle Beverage had the extensive coaching experience to provide him with the tools and resources needed to put him on the path to success. She encouraged him to utilize his eligibility for On Ramp funding to enroll with Germanna’s partnering organization, CDS Tractor Trailer Training, to earn his Commercial Driver’s License (CDL). A month after enrolling, McNinch graduated with his CDL and two weeks after that, found full-time employment with benefits including health care, 401(k), and paid vacation and holidays. The team at CDS also proved helpful to Thomas in tailoring his desired job with the right companies. Germanna Community College staff are honored to have provided McNinch the educational resources and career coaching services he found beneficial on his path to success. STEM Youth Success Story Opportunity Inc. Youth Goes from Virginia Beach STEM Program to Princeton
Myesha Jemison has never been one to settle on a single hobby or interest. “I like to engage in different things to have a well-rounded platform of knowledge,” says the 18-year-old Bayside High School Health Sciences Academy senior. Jemison has experience volunteering at hospitals, holding leadership positions in various organizations, and most recently participating in Opportunity Inc.’s Virginia Beach STEM Program. The purpose of this program is to expose students to STEM careers via internship opportunities, robotics competitions and dual enrollment credits. Yet, the common theme that glues all of her experience together is her passion to help other people.

WIA Annual Report December 2015 Page 10 of 37
“Having explored medicine in my volunteer experience and learning more about engineering through the STEM program, I realized that I definitely want to work in the field of global medicine,” says Myesha. After figuring out what she wanted to do, Jemison was faced with the question – how will she pay for it? “One day, I was watching the news and saw that a local girl won the Bill Gates Millennium Scholarship. I thought, ‘I can do that!’ After an intensive application process, Jemison was notified in May that she is a Gates Millennium Scholar which means she earned a good-through-graduation scholarship to use at the college of her choice. She said she’d never cried so many joyful tears. Myesha is now attending Princeton University where she’s studying computer science. She plans to become a global infectious disease physician. “The STEM program really gave me a glimpse of college academics through the STEM college classes I was enrolled in to get ahead,” says Myesha. “I thank Opportunity Inc. for this chance to spread my wings.” Youth Success Story Eastern Shore Brothers Discover Pathways to Lifelong Careers
The old saying that good things usually come in threes frequently applies but, in the case of the Hernandez brothers, the good thing actually came in twos. Chris and Alex Hernandez participated in the Eastern Shore Community College (ESCC) Workforce Investment Act (WIA) Youth program while students at Arcadia High School, with the goal of making a successful transition to employment and further education. Chris and Alex moved with their mother from California and enrolled at Arcadia High School, a location where they could flourish and pursue their dreams. Due to limited family income and other factors, Chris became the first brother to
enter the WIA program and to begin work with the ESCC career coach, Faye Wilfong. Chris enrolled in the welding program and there discovered his career niche in life. Chris mastered basic and then advanced skills as well as numerous certifications required for employment in the field.

WIA Annual Report December 2015 Page 11 of 37
With assistance from the career coach and financial backing from the WIA program, Chris also enrolled in an ESCC night welding class, furthering his welding skills and enhancing work contacts. During this time, he also obtained part-time employment to help with family and personal expenses. In addition to his welding program, Chris enrolled in college prep courses in math and science and maintained excellent grades. After graduation, Chris was offered employment with Liebherr, a nationally known manufacturing company. There he immediately put his welding skills to work and, within months of his employment, was selected for their elite apprenticeship program. Chris completed his apprenticeship in October 2014. Alex, the younger brother, enrolled in the WIA program during his junior year. He chose the building trades program with an eye toward becoming a building contractor. Alex also included college prep classes in his high school program and maintained excellent grades. After talking with the Marine recruiter during his junior year, Alex decided that his future lay with the military. After completing basic training, Alex transferred to another training post where he received his assignment for refueling jets. He is still hopeful that, at some point, he will be using those building trades’ skills he earned in high school. WIA and the career coaching program provided the support and financial aid which enabled both of these young men to pursue their dreams successfully. Their personal initiative and the outstanding training they received in high school formed a basis for their success in life. Veteran Success Story Virginia Program Helps Veterans Land Great Jobs
William Lee, a retired Army Veteran, was referred to the SkillSource Group, Inc.’s Northern Virginia Jobs for Veterans (J4VETS) program in November 2013 after he was laid off as a Senior Program Manager. Mr. Lee immediately expressed interest in enrolling in a Project Management Professional (PMP) preparation course with Global Knowledge, which he completed in January 2014. Mr. Lee obtained his PMP certification after sitting for the exam just one time in April 2014. Mr. Lee needed additional assistance with his employment search and his J4VETS Case Manager referred him to the SkillSource Veterans’ Job Developer, funded through the United Way of the National Capital Area’s Veterans’ Employment Initiative. Soon after, Mr. Lee was employed by TASC, Inc. as a Director of Capture

WIA Annual Report December 2015 Page 12 of 37
Management. He started his new position in June 2014, and is very grateful to the SkillSource Veterans’ Job Developer and the J4VETS program for helping him to obtain his certification and his new employment. “The entire J4VETS Program commits to helping the Vet. I felt as if the entire organization was working for my benefit. From assistance in obtaining training to actually finding job leads, J4VETS was there for me,” Lee stated. Lee has offered to serve as a Mentor for the Northern Virginia Technology Council’s (in partnership with Mitre Corporation) next “Vetworking” cohort to help fellow veterans with their transition into civilian life and employment goals. Todd Rowley, the chairman of the Northern Virginia Workforce Area #11, noted, “As the most populous local workforce area in the Commonwealth of Virginia, the Northern Virginia Workforce Area is honored to offer outstanding workforce services to veterans seeking employment in our region. Our veterans’ employment efforts are closely aligned with outstanding organizations such as the Fairfax County Chamber of Commerce and the Northern Virginia Technology Council, each of which is responding to their member’s interest in hiring veterans for a wide range of employment opportunities. In my mind, there is no better way to serve a veteran who has served our nation than to guide their employment search, resulting in permanent, well-compensated employment.” Learn more about the J4Vets Program here: http://www.myskillsource.org/page/id/24/veterans Rapid Response Activities
Rapid Response Annual Report Information 2014-2015 The Dislocated Worker Unit (DWU) has increased efficiency by implementing virtual employee needs assessments and
automated reporting tools to track Virginia’s Rapid Response activities. As a result of increased data collection, this report
includes services provided to those employers who filed a Worker Adjustment and retraining Notification (WARN) and those
who did not (Non‐WARN). The charts below provide a comparison to the previous years.
PY12 PY13 PY14 WARN Notices 78 59 59 Number of workers affected
8172 5597 6498
Average number of workers per event
105 95 110
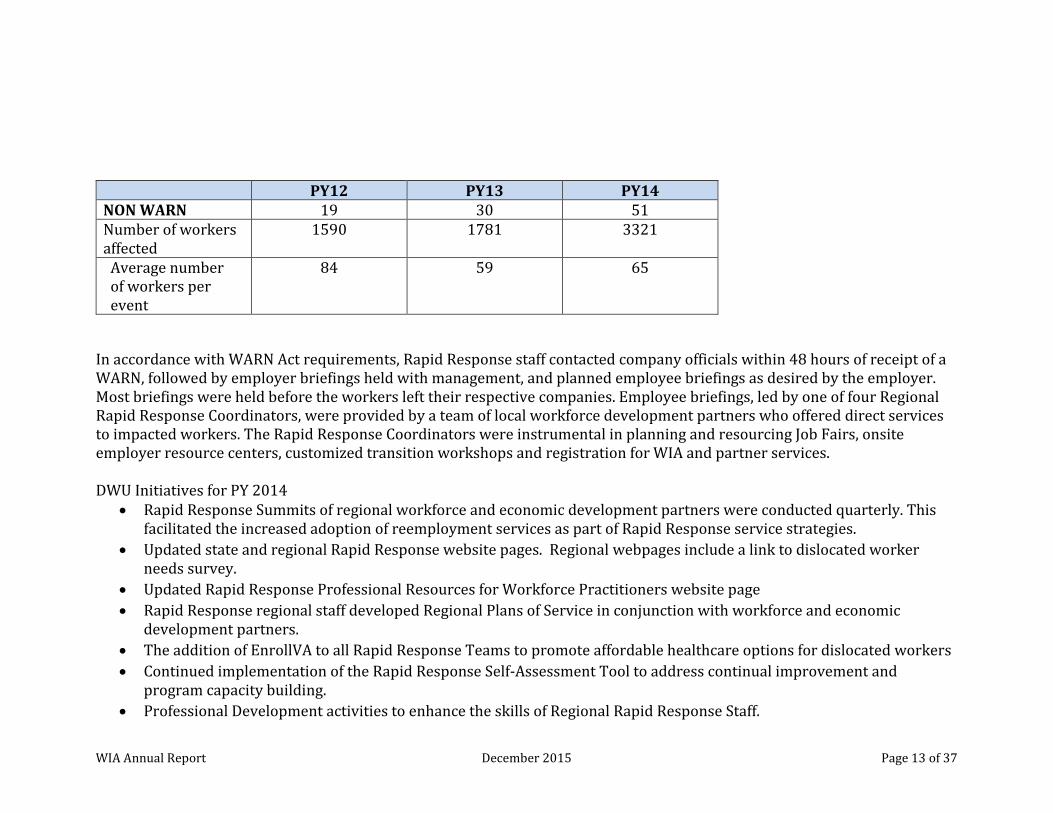
WIA Annual Report December 2015 Page 13 of 37
PY12 PY13 PY14 NON WARN 19 30 51 Number of workers affected
1590 1781 3321
Average number of workers per event
84 59 65
In accordance with WARN Act requirements, Rapid Response staff contacted company officials within 48 hours of receipt of a WARN, followed by employer briefings held with management, and planned employee briefings as desired by the employer. Most briefings were held before the workers left their respective companies. Employee briefings, led by one of four Regional Rapid Response Coordinators, were provided by a team of local workforce development partners who offered direct services to impacted workers. The Rapid Response Coordinators were instrumental in planning and resourcing Job Fairs, onsite employer resource centers, customized transition workshops and registration for WIA and partner services. DWU Initiatives for PY 2014
Rapid Response Summits of regional workforce and economic development partners were conducted quarterly. This facilitated the increased adoption of reemployment services as part of Rapid Response service strategies.
Updated state and regional Rapid Response website pages. Regional webpages include a link to dislocated worker needs survey.
Updated Rapid Response Professional Resources for Workforce Practitioners website page
Rapid Response regional staff developed Regional Plans of Service in conjunction with workforce and economic development partners.
The addition of EnrollVA to all Rapid Response Teams to promote affordable healthcare options for dislocated workers
Continued implementation of the Rapid Response Self‐Assessment Tool to address continual improvement and program capacity building.
Professional Development activities to enhance the skills of Regional Rapid Response Staff.

WIA Annual Report December 2015 Page 14 of 37
Approved Waivers The summary below provides a listing of the seven (7) waivers for which Virginia has received approval, information on how the waivers have changed the activities of the state and local areas, and how activities carried out under the waivers have directly or indirectly affected state and local area performance outcomes.
Waiver Description Impact on State and Local Areas
and Activities Impact on Performance
Waiver of WIA Section 133(b)(4) to increase the allowable transfer amount between adult and dislocated worker funding streams allocated to a local area. (Transfer authority up to 50%)
Allows the state to be flexible and responsive in meeting unique needs based on changes in local and regional economic conditions.
This increased flexibility has a positive impact on adult employment and wage rates.
Waiver to permit the State to replace the performance measure at WIA Section 136(b) with the common measures.
State and local areas have successfully implemented common measures.
VA met or exceeded all measures in PY14.
Waiver of WIA section 123 requirements to competitively select providers of youth program elements which applies to section 129(c)(2)(D),(G), and (I); and 20 CFR 664.410(a)(4), (7), and (8),(9), and (10).
Allows local areas to be flexible and responsive in meeting unique needs based on local and regional resources and available partnerships.
This increased flexibility has a positive impact on all youth measures.
Waiver of the provision at 20CFR Part 663.530 that prescribes a time limit on the period of initial eligibility for training providers.
The waiver has resulted in an increased and robust set of eligible providers than otherwise would be eligible.
Positive impact can be seen in terms of credential attainment rates.
Waiver of WIA Section 134(a) to permit local areas to use a portion of local funds for incumbent worker training. (Up to 20% of dislocated worker funds, only where part of layoff aversion strategy).
To date, no training has been delivered with this waiver. The state expects at minimum one local workforce area to implement this training option in PY 2014.
N/A
Waiver of WIA Section 134(a)(1)(A) to permit up to 20% the funds reserved for rapid response activities to be used for incumbent worker training. (Incumbent worker training as part of a layoff aversion strategy and activities to assist local workforce areas in the provision of employment and training services and employer services).
Virginia has not identified statewide activities that would fully comply with the parameters outlined by ETA. However, the state continues to review potential statewide activities as a part of the statewide layoff aversion strategy.
N/A

WIA Annual Report December 2015 Page 15 of 37
Waiver of the prohibition at 20CFR 664.510 on the use of Individual Training Accounts for older and out-of-school youth.
The majority of youth served under WIA are currently being trained with traditional youth strategies.
The impact of the waiver on eligible youth performance is under evaluation.

WIA Annual Report December 2015 Page 16 of 37
PROGRAM YEAR 2014 ANNUAL REPORT TABLES
TABLE A – WORKFORCE INVESTMENT ACT CUSTOMER SATISFACTION DATA (Waived)
TABLE B – Adult Program Results
Reported Information Negotiated Performance Level Actual Performance Level
Entered Employment Rate 77.0 72.0 1,436
1,995 Employment Retention
Rate 87.0 86.8 1,717
1,978 Six Month Average
Earnings $12,000 $10,581 $17,045,457
1611 Employment and Credential Rate
63.0 61.6 935
1,519
TABLE C – Outcomes for Adult Special Populations
Reported Information
Public Assistance Recipients Receiving Intensive or Training
Services
Veterans Individuals with Disabilities
Older Individuals
Entered Employment
Rate
72.0
890
73.1
147
56.7
85
61.8
126
1,236
201
150
204
Employment Retention
Rate
85.8
951
85.3
122
88.6
70
86.0
129
1,108
143
79
150
Six Months Average Earnings
$9677
$8,593,256
$13,984
$1,566,198
$10,870
$652,202
$9,628
$1,145,786
888
112
60
11956.

WIA Annual Report December 2015 Page 17 of 37
Table D – Other Outcome Information by Service Level for the Adult Program
Reported Information
Individuals Who Only Received Core Services
Individuals Who Only Received Core and Intensive Services
Individuals Who Received Training Services
Entered Employment
Rate
56.9
66
68.4
576
76.6
794
116
842
1,037
Employment Retention
Rate
83.3
95
84.9
617
88.4
1,005
114
727
1,137
Six Months Average Earnings
$9,108
$828,836
$9,648
$5,634,256
$11,306
$10,582,365
91
584
936
Table E – Dislocated Worker Program Results
Reported Information Negotiated Performance Level Actual Performance Level
Entered Employment Rate 83.0 83.8 2,001
2,388 Employment Retention
Rate 93.0 93.5 1,930
2,065 Six Month Average
Earnings $18,000 $16,346 $29,553,332
1,808 Employment and Credential Rate
65.0 65.4 887
1,356

WIA Annual Report December 2015 Page 18 of 37
Table F – Outcomes for Dislocated Worker Special Populations
Reported Information
Veterans Individuals with Disabilities
Older Individuals Displaced Homemakers
Entered Employment
Rate
81.6
320
76.4
81
77.6
373
59.1
13
392
106
481
22
Employment Retention
Rate
92.0
242
91.2
52
91.1
359
100.0
7
263
57
394
7
Six Months Average Earnings
$23,661
$5,276,429
$27,029
$1,243,318
$16,969
$5,735,513
$10,537
$73,759
223
46
338
7
Table G – Outcome Information by Service Level for Dislocated Worker Program
Reported Information
Individuals Who Only Received Core Services
Individuals Who Only Received Core and Intensive Services
Individuals Who Received Training Services
Entered Employment
Rate
75.5
40
82.4
842
85.2
1,119
53
1,022
1,313
Employment Retention
Rate
90.6
48
93.5
823
93.6
1,059
53
880
1,132
Six Months Average Earnings
$16,670
$783,481
$15,051
$11,619,033
$17,342
$17,150,818
47
772
989

WIA Annual Report December 2015 Page 19 of 37
Table H.1 - Youth (14 – 21) Program Results
Reported Information Negotiated Performance Level Actual Performance Level
Placement in Employment
or Education
63.0
67.0
809
1,208
Attainment of Degree or
Certificate
65.0
78.3
932
1,190
Literacy-Numeracy Gains
57.0
63.3
292
461
Table H.1.A. – Outcomes for Youth Special Populations
Reported Information
Public Assistance Recipients
Veterans Individuals with Disabilities
Out-of-school Youth
Placement in Employment or Education Rate
66.8
457
100.0
2
59.1
178
70.5
296
684
2
301
420
Attainment of Degree or Certificate Rate
77.7
508
100.0
2
84.9
259
70.3
246
654
2
305
350
Literacy-Numeracy Gains
63.6
164
100.0
1
54.7
35
63.3
292
258
1
65
461

WIA Annual Report December 2015 Page 20 of 37
Table L – Other Reported Information
Reported Information
12 Month Employment
Retention Rate
12 Months Earnings Increase (Adults) or 12
Months Earnings Replacement
(Dislocated Workers)
Placements in Non-Traditional
Employment
Wages at Entry into Employment for Those
Individuals Who Entered Unsubsidized
Employment
Entry Into Unsubsidized Employment Related to the Training Received of Those Who Completed
Training Services
Adults 86.9
1,838 $4,214
$8,356,871 7.7
111 $4,793
$6,388,748 50.4
400
2,114 1,983 1,436 1,333 794
Dislocated Workers
92.8
1,989 97.0
$29,612,515 9.7
193 $7,997
$15,289,945 41.8
468
2,141 $30,454,022 2,001 1,912 1,119
Older Youth
83.4
281 $4,223
$1,288,001 6.2
15 $2,785
$623,828
337 305 241 224
Table M – Participation Levels
Reported Information Total Participants Served Total Exiters
Total Adult Customers 108,596 101,526
Total Adults (self-service only) 100,432 96,363
WIA Adults 105,250 99,330
WIA Dislocated Workers 3,404 2,221
Total Youth (14 – 21) 2,748 1,373
Younger Youth (14-18) 1,798 926
Older Youth (19-21) 950 447
Out-of-School Youth 1,140 536
In-School Youth 1,608 837

WIA Annual Report December 2015 Page 21 of 37
TABLE N – Cost of Program Activities
Program Activity Total Federal Spending
Local Adults $12,657,500
Local Dislocated Workers $8,059,155
Local Youth $11,177,932
Rapid Response (Up to 25%) WIA Section 134(a)(2)(B)
$2,511,903
Statewide Required Activities (Up to 15%) WIA Section 134(a)(2)(B)
$2,472,142
Statewide Allowable Activities WIA Section 134(a)(3)
Program Activity Description
(A)(i) Admin by State of Sect 134 Activities (VWC & Gov’s Office)
$29,086
(A)(ii) Capacity Building & Technical Assistance
$0
(A)(iii) Research & Demonstrations
$0
(A)(iv) Incumbent Worker Training
$0
(A)(v) Identification of Eligible Training Providers
$0
(A)(vi) Displaced homemaker program
$0
(A)(viii) Other activities the State determines necessary
$46,948
Total of All Federal Spending Listed Above
$36,954,665

WIA Annual Report December 2015 Page 22 of 37
Table O – Local Performance
Local Area Name:
Southwestern Virginia
Total Participants Served
Adults 4,878
Dislocated Workers 79
Older Youth (19 -21) 70
Younger Youth (14-18) 128
ETA Assigned # 51040
Total Exiters
Adults 4,473
Dislocated Workers 38
Older Youth (19 -21) 26
Younger Youth (14-18) 65
Reported Information Negotiated Performance Levels Actual Performance Level
Entered Employment Rates
Adults 74 75
Dislocated Workers 81 85
Older Youth 85
Retention Rates
Adults 85 93
Dislocated Workers 90 100
Older Youth 100
Younger Youth 67
Six Months Average Earnings Adults $11,800 $12,212
Dislocated Workers $15,600 $15,150
Six Month Earnings Increase Older Youth $5,437
Credential/Diploma Rates
Adult 73
Dislocated Workers 74
Older Youth 50
Younger Youth 91
Skill Attainment Rate Younger Youth 39
Placement in Employment or Education Youth (14 – 21) 60 68
Attainment of Degree or Certificate Youth (14 – 21) 56 83
Literacy-Numeracy Gains Youth (14 – 21) 53 74
Description of Other State Indicators of Performance (WIA Section 136(d)(1)
Employment and Credential Rate Adults 61 73
Employment and Credential Rate Dislocated Workers 65 74
Career Readiness Certificate Attainment Adults, Dislocated Workers, Youth age 19 & Older
25 64.4
Overall Status of Local Performance Not Met Met Exceeded
0 1 11

WIA Annual Report December 2015 Page 23 of 37
Table O – Local Performance
Local Area Name:
New River / Mt. Rogers
Total Participants Served
Adults 8,207
Dislocated Workers 335
Older Youth (19 -21) 86
Younger Youth (14-18) 141
ETA Assigned #: 51045
Total Exiters
Adults 7,848
Dislocated Workers 132
Older Youth (19 -21) 41
Younger Youth (14-18) 79
Reported Information Negotiated Performance Levels Actual Performance Level
Entered Employment Rates
Adults 75 83
Dislocated Workers 81 89
Older Youth 100
Retention Rates
Adults 84 89
Dislocated Workers 90 95
Older Youth 94
Younger Youth 77
Six Months Average Earnings Adults $10,000 $9,635
Dislocated Workers $14,250 $13,358
Six Months Earning Increase Older Youth $4,999
Credential/Diploma Rate
Adults 60
Dislocated Workers 74
Older Youth 39
Younger Youth 96
Skill Attainment Rate Younger Youth 46
Placement in Employment or Education Youth (14 – 21) 62 89
Attainment of Degree or Certificate Youth (14 – 21) 62 87
Literacy-Numeracy Gains Youth (14 – 21) 57 77
Description of Other State Indicators of Performance (WIA Section 136(d)(1)
Employment and Credential Rate Adults 62 60
Employment and Credential Rate Dislocated Workers 66 76
Career Readiness Certificate Attainment Adults, Dislocated Workers, Youth age 19 & Older
25 27.1
Overall Status of Local Performance Not Met Met Exceeded
0 2 10

WIA Annual Report December 2015 Page 24 of 37
Table O – Local Performance
Local Area Name:
Western Virginia Workforce Development Board
Total Participants Served
Adults 6,313
Dislocated Workers 193
Older Youth (19 -21) 60
Younger Youth (14-18) 91
ETA Assigned #: 51095
Total Exiters
Adults 5,856
Dislocated Workers 104
Older Youth (19 -21) 24
Younger Youth (14-18) 33
Reported Information Negotiated Performance Levels Actual Performance Level
Entered Employment Rates
Adults 75 86
Dislocated Workers 87 93
Older Youth 75
Retention Rates
Adults 86 91
Dislocated Workers 92 94
Older Youth 91
Younger Youth 56
Six Months Average Earnings Adults $10,000 $9,860
Dislocated Workers $15,500 $14,830
Six Months Earning Increase Older Youth $3,916
Credential/Diploma Rate
Adults 86
Dislocated Workers 75
Older Youth 67
Younger Youth 77
Skill Attainment Rate Younger Youth 36
Placement in Employment or Education Youth (14 – 21) 64 67
Attainment of Degree or Certificate Youth (14 – 21) 67 81
Literacy-Numeracy Gains Youth (14 – 21) 55 68
Description of Other State Indicators of Performance (WIA Section 136(d)(1)
Employment and Credential Rate Adults 65 86
Employment and Credential Rate Dislocated Workers 70 76
Career Readiness Certificate Attainment Adults, Dislocated Workers, Youth age 19 & Older
25 27.1
Overall Status of Local Performance Not Met Met Exceeded
0 2 10

WIA Annual Report December 2015 Page 25 of 37
Table O – Local Performance
Local Area Name:
Shenandoah Valley Workforce Investment Board
Total Participants Served
Adults 8,499
Dislocated Workers 164
Older Youth (19 -21) 70
Younger Youth (14-18) 64
ETA Assigned #: 51120
Total Exiters
Adults 7,953
Dislocated Workers 101
Older Youth (19 -21) 14
Younger Youth (14-18) 32
Reported Information Negotiated Performance Levels Actual Performance Level
Entered Employment Rates
Adults 74 80
Dislocated Workers 79 82
Older Youth 77
Retention Rates
Adults 87 85
Dislocated Workers 93 96
Older Youth 93
Younger Youth 76
Six Months Average Earnings Adults $9,340 $10,449
Dislocated Workers $12,500 $13,857
Six Months Earnings Increase Older Youth $4,215
Credential/Diploma Rate
Adults 64
Dislocated Workers 69
Older Youth 31
Younger Youth 75
Skill Attainment Rate Younger Youth 0
Placement in Employment or Education Youth (14 – 21) 48 71
Attainment of Degree or Certificate Youth (14 – 21) 51 65
Literacy-Numeracy Gains Youth (14 – 21) 53 58
Description of Other State Indicators of Performance (WIA Section 136(d)(1)
Employment and Credential Rate Adults 58 64
Employment and Credential Rate Dislocated Workers 62 70
Career Readiness Certificate Attainment Adults, Dislocated Workers, Youth age 19 & Older
25 32.4
Overall Status of Local Performance Not Met Met Exceeded
0 1 11

WIA Annual Report December 2015 Page 26 of 37
Table O – Local Performance
Local Area Name:
Piedmont Workforce Network
Total Participants Served
Adults 3,632
Dislocated Workers 134
Older Youth (19 -21) 60
Younger Youth (14-18) 54
ETA Assigned #: 51055
Total Exiters
Adults 3,475
Dislocated Workers 101
Older Youth (19 -21) 31
Younger Youth (14-18) 44
Reported Information Negotiated Performance Levels Actual Performance Level
Entered Employment Rates
Adults 73 85
Dislocated Workers 80 86
Older Youth 80
Retention Rates
Adults 86 90
Dislocated Workers 92 94
Older Youth 80
Younger Youth 63
Six Months Average Earnings Adults $10,250 $8,385
Dislocated Workers $14,000 $17,663
Six Months Earnings Increase Older Youth $3,288
Credential/Diploma Rate
Adults 63
Dislocated Workers 70
Older Youth 53
Younger Youth 87
Skill Attainment Rate Younger Youth 25
Placement in Employment or Education Youth (14 – 21) 60 72
Attainment of Degree or Certificate Youth (14 – 21) 52 77
Literacy-Numeracy Gains Youth (14 – 21) 52 58
Description of Other State Indicators of Performance (WIA Section 136(d)(1)
Employment and Credential Rate Adults 56 63
Employment and Credential Rate Dislocated Workers 57 70
Career Readiness Certificate Attainment Adults, Dislocated Workers, Youth age 19 & Older
25 40.8
Overall Status of Local Performance Not Met Met Exceeded
0 1 11

WIA Annual Report December 2015 Page 27 of 37
Table O – Local Performance
Local Area Name:
Region 2000 Workforce Investment Board
Total Participants Served
Adults 4,386
Dislocated Workers 50
Older Youth (19 -21) 38
Younger Youth (14-18) 44
ETA Assigned #: 51110
Total Exiters
Adults 3,998
Dislocated Workers 25
Older Youth (19 -21) 24
Younger Youth (14-18) 21
Reported Information Negotiated Performance Levels Actual Performance Level
Entered Employment Rates
Adults 77 81
Dislocated Workers 82 85
Older Youth 76
Retention Rates
Adults 87 83
Dislocated Workers 92 93
Older Youth 77
Younger Youth 65
Six Months Average Earnings Adults $12,000 $9,213
Dislocated Workers $15,100 $12,303
Six Months Earning Increase Older Youth $3,525
Credential/Diploma Rate
Adults 57
Dislocated Workers 25
Older Youth 41
Younger Youth 69
Skill Attainment Rate Younger Youth 100
Placement in Employment or Education Youth (14 – 21) 62 69
Attainment of Degree or Certificate Youth (14 – 21) 63 60
Literacy-Numeracy Gains Youth (14 – 21) 54 54
Description of Other State Indicators of Performance (WIA Section 136(d)(1)
Employment and Credential Rate Adults 63 57
Employment and Credential Rate Dislocated Workers 67 25
Career Readiness Certificate Attainment Adults, Dislocated Workers, Youth age 19 & Older
25 27.4
Overall Status of Local Performance Not Met Met Exceeded
2 4 6

WIA Annual Report December 2015 Page 28 of 37
Table O – Local Performance
Local Area Name:
South Central Workforce Investment Board
Total Participants Served
Adults 2,221
Dislocated Workers 209
Older Youth (19 -21) 28
Younger Youth (14-18) 103
ETA Assigned #: 51115
Total Exiters Adults 2,122
Dislocated Workers 144
Older Youth (19 -21) 9
Younger Youth (14-18) 53
Reported Information Negotiated Performance Levels Actual Performance Level
Entered Employment Rates
Adults 71 70
Dislocated Workers 82 84
Older Youth 64
Retention Rates
Adults 86 92
Dislocated Workers 89 96
Older Youth 80
Younger Youth 68
Six Months Average Earnings Adults $10,735 $9,391
Dislocated Workers $13,780 $12,260
Six Months Earnings Increase Older Youth $5,141
Credential/Diploma Rate
Adults 47
Dislocated Workers 50
Older Youth 36
Younger Youth 83
Skill Attainment Rate Younger Youth 81
Placement in Employment or Education Youth (14-21) 51 59
Attainment of Degree or Certificate Youth (14-21) 62 82
Literacy-Numeracy Gains Youth (14-21) 53 57
Description of Other State Indicators of Performance (WIA Section 136(d)(1)
Employment and Credential Rate Adults 40 47
Employment and Credential Rate Dislocated Workers 54 50
Career Readiness Certificate Attainment Adults, Dislocated Workers, Youth age 19 & Older
25 38
Overall Status of Local Performance Not Met Met Exceeded
0 3 9

WIA Annual Report December 2015 Page 29 of 37
Table O – Local Performance
Local Area Name:
Capital Region Workforce Partnership
Total Participants Served
Adults 10,617
Dislocated Workers 461
Older Youth (19 -21) 36
Younger Youth (14-18) 184
ETA Assigned #: 51125
Total Exiters
Adults 9,927
Dislocated Workers 340
Older Youth (19 -21) 24
Younger Youth (14-18) 121
Reported Information Negotiated Performance Levels Actual Performance Level
Entered Employment Rates
Adults 65 62
Dislocated Workers 81 83
Older Youth 47
Retention Rates
Adults 82 84
Dislocated Workers 90 92
Older Youth 87
Younger Youth 63
Six Months Average Earnings Adults $10,500 $9,882
Dislocated Workers $17,000 $15,095
Six Months Earnings Increase Older Youth $3,074
Credential/Diploma Rate
Adults 51
Dislocated Workers 64
Older Youth 13
Younger Youth 83
Skill Attainment Rate Younger Youth 39
Placement in Employment or Education Youth (14 – 21) 50 58
Attainment of Degree or Certificate Youth (14 – 21) 50 84
Literacy-Numeracy Gains Youth (14 – 21) 40 58
Description of Other State Indicators of Performance (WIA Section 136(d)(1)
Employment and Credential Rate Adults 58 51
Employment and Credential Rate Dislocated Workers 62 64
Career Readiness Certificate Attainment Adults, Dislocated Workers, Youth age 19 & Older
25 44
Overall Status of Local Performance Not Met Met Exceeded
0 4 8

WIA Annual Report December 2015 Page 30 of 37
Table O – Local Performance
Local Area Name:
Northern Virginia Workforce Investment Board
Total Participants Served
Adults 5,751
Dislocated Workers 479
Older Youth (19 -21) 176
Younger Youth (14-18) 139
ETA Assigned #: 51010
Total Exiters
Adults 5,547
Dislocated Workers 335
Older Youth (19 -21) 62
Younger Youth (14-18) 41
Reported Information Negotiated Performance Levels Actual Performance Level
Entered Employment Rates
Adults 75.2 66
Dislocated Workers 78.2 86
Older Youth 63
Retention Rates
Adults 79.2 87
Dislocated Workers 85.3 92
Older Youth 87
Younger Youth 63
Six Months Average Earnings Adults $13,400 $13,746
Dislocated Workers $17,500 $26,928
Six Months Earnings Increase Older Youth $3,700
Credential/Diploma Rate
Adults 70
Dislocated Workers 78
Older Youth 36
Younger Youth 86
Skill Attainment Rate Younger Youth 32
Placement in Employment or Education Youth (14 – 21) 57.2 66
Attainment of Degree or Certificate Youth (14 – 21) 53.2 75
Literacy-Numeracy Gains Youth (14 – 21) 53 54
Description of Other State Indicators of Performance (WIA Section 136(d)(1)
Employment and Credential Rate Adults 61 70
Employment and Credential Rate Dislocated Workers 65 78
Career Readiness Certificate Attainment Adults, Dislocated Workers, Youth age 19 & Older
25 54.8
Overall Status of Local Performance Not Met Met Exceeded
0 1 11

WIA Annual Report December 2015 Page 31 of 37
Table O – Local Performance
Local Area Name:
Alexandria / Arlington Workforce Investment Board
Total Participants Served
Adults 8,085
Dislocated Workers 117
Older Youth (19 -21) 24
Younger Youth (14-18) 32
ETA Assigned #: 51005
Total Exiters
Adults 8,045
Dislocated Workers 62
Older Youth (19 -21) 18
Younger Youth (14-18) 25
Reported Information Negotiated Performance Levels Actual Performance Level
Entered Employment Rates
Adults 77 81
Dislocated Workers 77 84
Older Youth 73
Retention Rates
Adults 87 79
Dislocated Workers 87 96
Older Youth 85
Younger Youth 74
Six Months Average Earnings Adults $13,200 $10,469
Dislocated Workers $16,200 $19,534
Six Months Earnings Increase Older Youth $4,754
Credential/Diploma Rate
Adults 70
Dislocated Workers 77
Older Youth 20
Younger Youth 94
Skill Attainment Rate Younger Youth 100
Placement in Employment or Education Youth (14 – 21) 63 85
Attainment of Degree or Certificate Youth (14 – 21) 65 74
Literacy-Numeracy Gains Youth (14 – 21) 57 64
Description of Other State Indicators of Performance (WIA Section 136(d)(1)
Employment and Credential Rate Adults 60 70
Employment and Credential Rate Dislocated Workers 60 77
Career Readiness Certificate Attainment Adults, Dislocated Workers, Youth age 19 & Older
25 22.9
Overall Status of Local Performance Not Met Met Exceeded
2 1 9

WIA Annual Report December 2015 Page 32 of 37
Table O – Local Performance
Local Area Name:
Bay Consortium Workforce Investment Board
Total Participants Served
Adults 6,791
Dislocated Workers 193
Older Youth (19 -21) 81
Younger Youth (14-18) 83
ETA Assigned #: 51070
Total Exiters
Adults 6,362
Dislocated Workers 141
Older Youth (19 -21) 50
Younger Youth (14-18) 41
Reported Information Negotiated Performance Levels Actual Performance Level
Entered Employment Rates
Adults 77 73
Dislocated Workers 83 81
Older Youth 64
Retention Rates
Adults 87 88
Dislocated Workers 93 91
Older Youth 79
Younger Youth 85
Six Months Average Earnings Adults $10,950 $10,147
Dislocated Workers $16,500 $18,191
Six Months Earnings Increase Older Youth $3,538
Credential/Diploma Rate
Adults 52
Dislocated Workers 59
Older Youth 58
Younger Youth 63
Skill Attainment Rate Younger Youth 53
Placement in Employment or Education Youth (14 – 21) 63 76
Attainment of Degree or Certificate Youth (14 – 21) 65 87
Literacy-Numeracy Gains Youth (14 – 21) 57 49
Description of Other State Indicators of Performance (WIA Section 136(d)(1)
Employment and Credential Rate Adults 60 52
Employment and Credential Rate Dislocated Workers 60 59
Career Readiness Certificate Attainment Adults, Dislocated Workers, Youth age 19 & Older
25 27.5
Overall Status of Local Performance Not Met Met Exceeded
0 7 5

WIA Annual Report December 2015 Page 33 of 37
Table O – Local Performance
Local Area Name:
Greater Peninsula Workforce Investment Board
Total Participants Served
Adults 7,664
Dislocated Workers 103
Older Youth (19 -21) 71
Younger Youth (14-18) 111
ETA Assigned # 51020
Total Exiters
Adults 7,140
Dislocated Workers 66
Older Youth (19 -21) 52
Younger Youth (14-18) 59
Reported Information Negotiated Performance Levels Actual Performance Level
Entered Employment Rates
Adults 67 64
Dislocated Workers 75 84
Older Youth 56
Retention Rates
Adults 73 87
Dislocated Workers 78 94
Older Youth 93
Younger Youth 69
Six Months Average Earnings Adults $9,200 $10,602
Dislocated Workers $11,500 $16,773
Six Months Earnings Increase Older Youth $3,235
Credential/Diploma Rate
Adults 59
Dislocated Workers 80
Older Youth 55
Younger Youth 93
Skill Attainment Rate Younger Youth 68
Placement in Employment or Education Youth (14 – 21) 57 60
Attainment of Degree or Certificate Youth (14 – 21) 55 74
Literacy-Numeracy Gains Youth (14 – 21) 57 69
Description of Other State Indicators of Performance (WIA Section 136(d)(1)
Employment and Credential Rate Adults 50 59
Employment and Credential Rate Dislocated Workers 51 80
Career Readiness Certificate Attainment Adults, Dislocated Workers, Youth age 19 & Older
25 71.4
Overall Status of Local Performance Not Met Met Exceeded
0 1 11

WIA Annual Report December 2015 Page 34 of 37
Table O – Local Performance
Local Area Name:
Crater Regional Workforce Investment Group
Total Participants Served
Adults 6,043
Dislocated Workers 85
Older Youth (19 -21) 22
Younger Youth (14-18) 95
ETA Assigned #: 51100
Total Exiters
Adults 5,665
Dislocated Workers 47
Older Youth (19 -21) 16
Younger Youth (14-18) 48
Reported Information Negotiated Performance Levels Actual Performance Level
Entered Employment Rates
Adults 70 77
Dislocated Workers 75 97
Older Youth 100
Retention Rates
Adults 76 92
Dislocated Workers 77 94
Older Youth 78
Younger Youth 68
Six Months Average Earnings Adults $10,000 $10,647
Dislocated Workers $14,000 $14,891
Six Months Earnings Increase Older Youth $7,825
Credential/Diploma Rate
Adults 48
Dislocated Workers 79
Older Youth 0
Younger Youth 87
Skill Attainment Rate Younger Youth 100
Placement in Employment or Education Youth (14 – 21) 60 67
Attainment of Degree or Certificate Youth (14 – 21) 55 69
Literacy-Numeracy Gains Youth (14 – 21) 52 47
Description of Other State Indicators of Performance (WIA Section 136(d)(1)
Employment and Credential Rate Adults 55 48
Employment and Credential Rate Dislocated Workers 67 77
Career Readiness Certificate Attainment Adults, Dislocated Workers, Youth age 19 & Older
25 67.0
Overall Status of Local Performance Not Met Met Exceeded
0 2 10

WIA Annual Report December 2015 Page 35 of 37
Table O – Local Performance
Local Area Name:
Opportunity Inc.
Total Participants Served
Adults 17,071
Dislocated Workers 186
Older Youth (19 -21) 70
Younger Youth (14-18) 312
ETA Assigned #: 51035
Total Exiters
Adults 16,406
Dislocated Workers 117
Older Youth (19 -21) 31
Younger Youth (14-18) 154
Reported Information Negotiated Performance Levels Actual Performance Level
Entered Employment Rates
Adults 65.82 73
Dislocated Workers 67.73 78
Older Youth 43
Retention Rates
Adults 75.01 86
Dislocated Workers 80.21 93
Older Youth 89
Younger Youth 70
Six Months Average Earnings Adults $10,418 $11,496
Dislocated Workers $13,554 $18,699
Six Months Earnings Increase Older Youth 61
Credential/Diploma Rate
Adults 59
Dislocated Workers 13
Older Youth 97
Younger Youth 95
Skill Attainment Rate 63
Placement in Employment or Education Youth (14 – 21) 48.98 63
Attainment of Degree or Certificate Youth (14 – 21) 48.98 90
Literacy-Numeracy Gains Youth (14 – 21) 53.02 74
Description of Other State Indicators of Performance (WIA Section 136(d)(1)
Employment and Credential Rate Adults 50 61
Employment and Credential Rate Dislocated Workers 51.02 59
Career Readiness Certificate Attainment Adults, Dislocated Workers, Youth age 19 & Older
25 9.3
Overall Status of Local Performance Not Met Met Exceeded
1 0 11

WIA Annual Report December 2015 Page 36 of 37
Table O – Local Performance
Local Area Name:
Region 17 West Piedmont
Total Participants Served
Adults 5,091
Dislocated Workers 223
Older Youth (19 -21) 58
Younger Youth (14-18) 217
ETA Assigned #: 51105
Total Exiters
Adults 4,512
Dislocated Workers 168
Older Youth (19 -21) 25
Younger Youth (14-18) 110
Reported Information Negotiated Performance Levels Actual Performance Level
Entered Employment Rates
Adults 77 81
Dislocated Workers 82 81
Older Youth 85
Retention Rates
Adults 83 86
Dislocated Workers 92 94
Older Youth 86
Younger Youth 71
Six Months Average Earnings Adults $9,300 $9,033
Dislocated Workers $12,741 $10,755
Six Months Earnings Increase Older Youth $4,260
Credential/Diploma Rate
Adults 73
Dislocated Workers 53
Older Youth 41
Younger Youth 70
Skill Attainment Rate Younger Youth 41
Placement in Employment or Education Youth (14 – 21) 63 57
Attainment of Degree or Certificate Youth (14 – 21) 65 66
Literacy-Numeracy Gains Youth (14 – 21) 57 83
Description of Other State Indicators of Performance (WIA Section 136(d)(1)
Employment and Credential Rate Adults 63 73
Employment and Credential Rate Dislocated Workers 67 53
Career Readiness Certificate Attainment Adults, Dislocated Workers, Youth age 19 & Older
25 26.3
Overall Status of Local Performance Not Met Met Exceeded
1 4 7
WIA Annual Report December 2015 Page 37 of 37
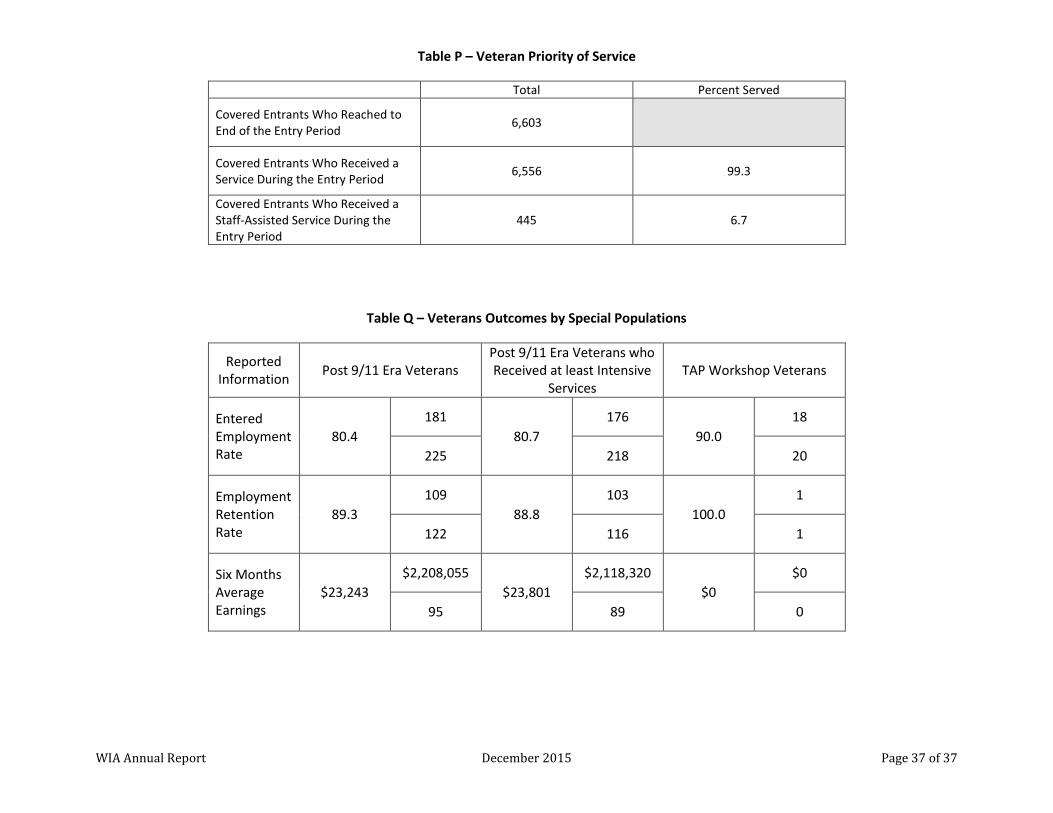
Table P – Veteran Priority of Service
Total Percent Served
Covered Entrants Who Reached to End of the Entry Period
6,603
Covered Entrants Who Received a Service During the Entry Period
6,556 99.3
Covered Entrants Who Received a Staff-Assisted Service During the Entry Period
445 6.7
Table Q – Veterans Outcomes by Special Populations
Reported Information
Post 9/11 Era Veterans Post 9/11 Era Veterans who Received at least Intensive
Services TAP Workshop Veterans
Entered Employment Rate
80.4
181
80.7
176
90.0
18
225 218 20
Employment Retention Rate
89.3
109
88.8
103
100.0
1
122 116 1
Six Months Average Earnings
$23,243
$2,208,055
$23,801
$2,118,320
$0
$0
95 89 0