workforce investment act and related workforce · pdf fileworkforce investment act and related...
TRANSCRIPT

WORKFORCE INVESTMENT ACT AND RELATED WORKFORCE PROGRAMS
PROGRAM YEAR
2014-2015
SUBMITTED: DECEMBER 15, 2015 CAREERSOURCEFLORIDA.COM
ii
TABLE OF CONTENTS
INTRODUCTION ....................................................................................................................... 5
Collaborate, Innovate, Lead ................................................................................................. 5
Outcome-oriented Goals and Planning ............................................................................... 5
Aligning Priorities ................................................................................................................. 6
Governance ........................................................................................................................... 7
2014-2015 Highlights ...........................................................................................................10
ENHANCING ACCESS FOR FLORIDA’S BUSINESSES AND JOB SEEKERS ......................12
Career Centers: Meeting Customers’ Needs .....................................................................12
Communications Tools .......................................................................................................13
Employ Florida Marketplace: Online Workforce Services and Virtual Career Center ..........14
CAREERSOURCE FLORIDA PRIORITIES, INITIATIVES AND STATE-LEVEL ACTIVITIES .16
Business and Workforce Development..............................................................................16
STATE WORKFORCE PERFORMANCE .................................................................................23
Accountability and Continuous Improvement ...................................................................23
WIA Performance Measures................................................................................................26
Local Performance ..............................................................................................................27
Customer Satisfaction Surveys ..........................................................................................28
STATE EVALUATION ACTIVITIES AND INCENTIVE POLICY ...............................................29
Overall Description and Background .................................................................................29
Florida Education and Training Placement Information Program (FETPIP) .........................29
State Longitudinal Measures — “Tier Measures” ...............................................................29
Regional Performance Reviews .........................................................................................30
State Incentive Policy .........................................................................................................31
State Performance Improvement Plan (PIP) Policy ............................................................31
COST OF WORKFORCE INVESTMENT ACTIVITIES .............................................................31
Expenditure Levels ..............................................................................................................31
State-Level Discretionary Funding .....................................................................................32
Cost of Program Activities Relative to Effect .......................................................................32
Use of Individual Training Accounts ...................................................................................34
Federal Waivers ...................................................................................................................35
WORKFORCE INVESTMENT ACT PROGRAMS AND INITIATIVES ......................................37
Labor Market Information ...................................................................................................38
Rapid Response Funding for Regional Workforce Boards ..............................................40
Youth Programs and Initiatives ..........................................................................................41
Reemployment Services .....................................................................................................43
iii
National Emergency Grant (NEG) .......................................................................................44
Veterans’ Programs and Initiatives ....................................................................................45
Military Family Employment Advocacy Program ..............................................................47
Wagner-Peyser Programs ...................................................................................................48
Targeted Populations ..........................................................................................................50
Welfare Transition and Supplemental Nutrition Assistance Program .............................55
State-Level Programs ..........................................................................................................58
LOOKING AHEAD ...................................................................................................................60
APPENDIX OF TABLES ..........................................................................................................61
iv
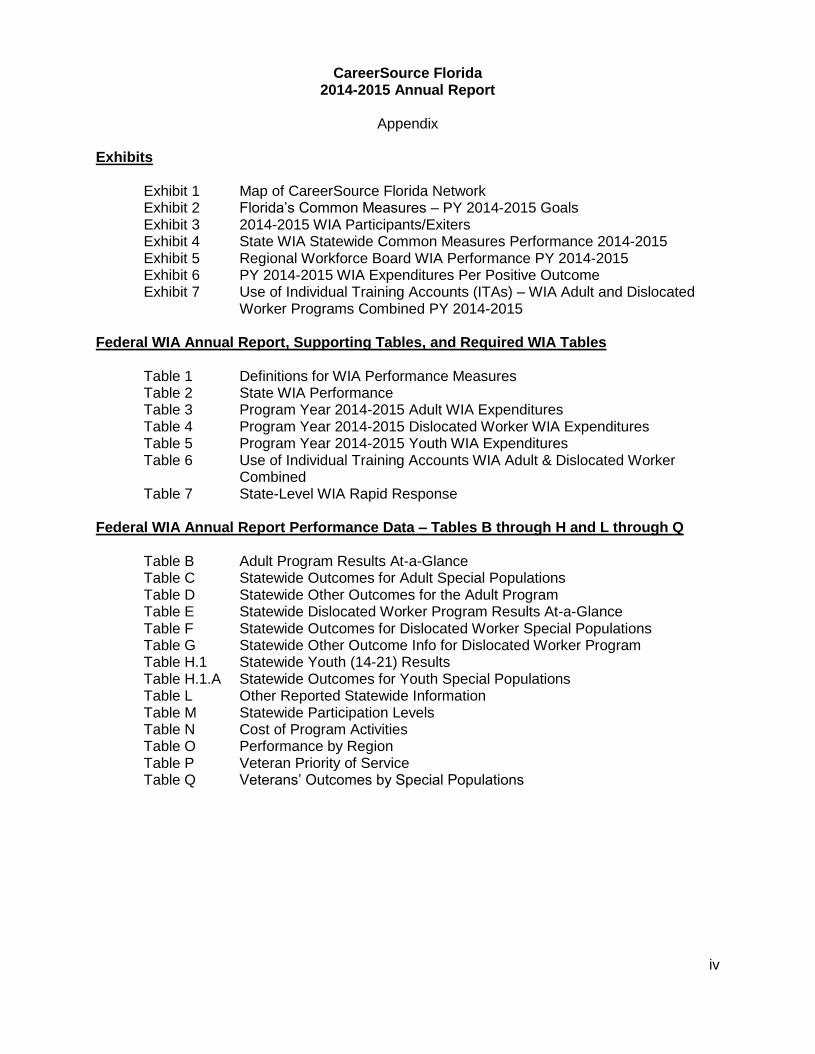
CareerSource Florida 2014-2015 Annual Report
Appendix
Exhibits
Exhibit 1 Map of CareerSource Florida Network Exhibit 2 Florida’s Common Measures – PY 2014-2015 Goals Exhibit 3 2014-2015 WIA Participants/Exiters Exhibit 4 State WIA Statewide Common Measures Performance 2014-2015 Exhibit 5 Regional Workforce Board WIA Performance PY 2014-2015 Exhibit 6 PY 2014-2015 WIA Expenditures Per Positive Outcome Exhibit 7 Use of Individual Training Accounts (ITAs) – WIA Adult and Dislocated
Worker Programs Combined PY 2014-2015 Federal WIA Annual Report, Supporting Tables, and Required WIA Tables
Table 1 Definitions for WIA Performance Measures Table 2 State WIA Performance Table 3 Program Year 2014-2015 Adult WIA Expenditures Table 4 Program Year 2014-2015 Dislocated Worker WIA Expenditures Table 5 Program Year 2014-2015 Youth WIA Expenditures Table 6 Use of Individual Training Accounts WIA Adult & Dislocated Worker
Combined Table 7 State-Level WIA Rapid Response
Federal WIA Annual Report Performance Data – Tables B through H and L through Q
Table B Adult Program Results At-a-Glance Table C Statewide Outcomes for Adult Special Populations Table D Statewide Other Outcomes for the Adult Program Table E Statewide Dislocated Worker Program Results At-a-Glance Table F Statewide Outcomes for Dislocated Worker Special Populations Table G Statewide Other Outcome Info for Dislocated Worker Program Table H.1 Statewide Youth (14-21) Results Table H.1.A Statewide Outcomes for Youth Special Populations Table L Other Reported Statewide Information Table M Statewide Participation Levels Table N Cost of Program Activities Table O Performance by Region Table P Veteran Priority of Service Table Q Veterans’ Outcomes by Special Populations
5
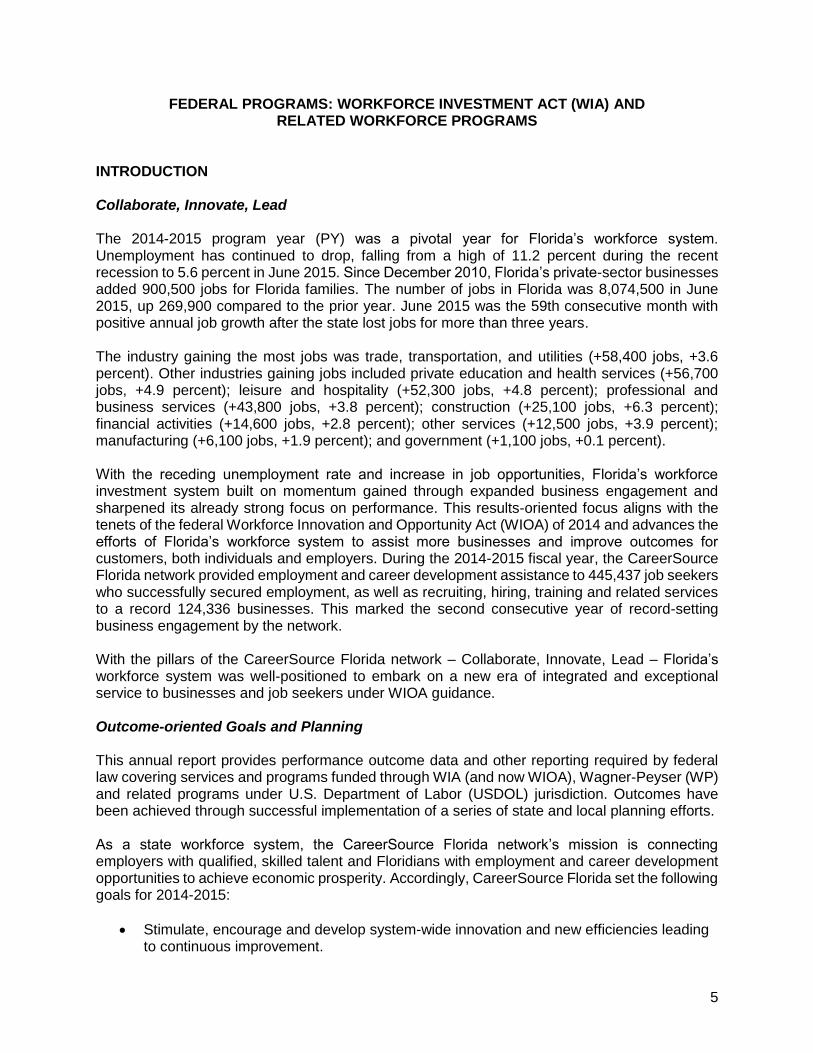
FEDERAL PROGRAMS: WORKFORCE INVESTMENT ACT (WIA) AND RELATED WORKFORCE PROGRAMS
INTRODUCTION Collaborate, Innovate, Lead The 2014-2015 program year (PY) was a pivotal year for Florida’s workforce system. Unemployment has continued to drop, falling from a high of 11.2 percent during the recent recession to 5.6 percent in June 2015. Since December 2010, Florida’s private-sector businesses added 900,500 jobs for Florida families. The number of jobs in Florida was 8,074,500 in June 2015, up 269,900 compared to the prior year. June 2015 was the 59th consecutive month with positive annual job growth after the state lost jobs for more than three years. The industry gaining the most jobs was trade, transportation, and utilities (+58,400 jobs, +3.6 percent). Other industries gaining jobs included private education and health services (+56,700 jobs, +4.9 percent); leisure and hospitality (+52,300 jobs, +4.8 percent); professional and business services (+43,800 jobs, +3.8 percent); construction (+25,100 jobs, +6.3 percent); financial activities (+14,600 jobs, +2.8 percent); other services (+12,500 jobs, +3.9 percent); manufacturing (+6,100 jobs, +1.9 percent); and government (+1,100 jobs, +0.1 percent). With the receding unemployment rate and increase in job opportunities, Florida’s workforce investment system built on momentum gained through expanded business engagement and sharpened its already strong focus on performance. This results-oriented focus aligns with the tenets of the federal Workforce Innovation and Opportunity Act (WIOA) of 2014 and advances the efforts of Florida’s workforce system to assist more businesses and improve outcomes for customers, both individuals and employers. During the 2014-2015 fiscal year, the CareerSource Florida network provided employment and career development assistance to 445,437 job seekers who successfully secured employment, as well as recruiting, hiring, training and related services to a record 124,336 businesses. This marked the second consecutive year of record-setting business engagement by the network. With the pillars of the CareerSource Florida network – Collaborate, Innovate, Lead – Florida’s workforce system was well-positioned to embark on a new era of integrated and exceptional service to businesses and job seekers under WIOA guidance. Outcome-oriented Goals and Planning This annual report provides performance outcome data and other reporting required by federal law covering services and programs funded through WIA (and now WIOA), Wagner-Peyser (WP) and related programs under U.S. Department of Labor (USDOL) jurisdiction. Outcomes have been achieved through successful implementation of a series of state and local planning efforts. As a state workforce system, the CareerSource Florida network’s mission is connecting employers with qualified, skilled talent and Floridians with employment and career development opportunities to achieve economic prosperity. Accordingly, CareerSource Florida set the following goals for 2014-2015:
Stimulate, encourage and develop system-wide innovation and new efficiencies leading to continuous improvement.
6
Develop and implement practical performance-based strategies and policies based upon enhanced market intelligence and improved forecasting capabilities.
Increase awareness, knowledge and use of the CareerSource Florida network and its programs and services to core constituencies and key partners.
In setting these strategic goals, CareerSource Florida followed the 2010-2015 Statewide Strategic Plan for Workforce Development, Creating the Strategies for Today’s Needs and Tomorrow’s Talent, which has provided a guide for workforce strategies and investment over the past five years. Strategic goals under the state plan, which are included in Florida’s Five-Year Integrated Strategic Plan to USDOL, are as follows:
World-class service to Florida’s target industry clusters.
World-class service to Florida’s infrastructure innovators.
Top national and state leadership for demand-driven solutions.
An aligned, responsive, jointly engaged talent supply system.
Outstanding business communications and intelligence for performance and accountability.
Dedicated commitment to change management and transformation. Aligning Priorities The CareerSource Florida board approved the following priority initiatives for Fiscal Year (FY) 2014-2015, aligned with the goals in both plans as well as the tenets of WIOA: Marketplace Intelligence Initiatives: CareerSource Florida will form a statewide Florida Healthcare Workforce Leadership Council (FHWL) that will serve as the primary point of contact for statewide healthcare industry-specific labor market intelligence and may be used by the state’s regional workforce boards to facilitate policy and strategy development. The FHWL Council will be formed and functioning with the final Charter, Guiding Principles, Identification of Potential Steps to enable Financial Sustainability and Labor Market Intelligence Partnership Agreement finalized by December 31, 2015. [Contract signed 2-05-15] Additionally, CareerSource Florida will create and implement an Advanced Manufacturing Marketplace Intelligence Partnership Agreement with the Center for Advanced Manufacturing Education. The resulting Florida Advanced Manufacturing Workforce Leadership Council, consisting of manufacturers from Florida’s 12 Regional Manufacturers Associations (RMAs), is serving as a primary point of contact for statewide industry-specific labor market intelligence. Once gathered, this data will be used by the state’s workforce network to facilitate policy and strategy development and develop an essential feedback loop to ensure Florida’s workforce network has a specific understanding of and is responsive to the talent needs of this sector.
Strategic Integration Initiative: CareerSource Florida, as the only business-led organization in the state directly charged with improving labor market outcomes, is the recipient of a vast array of business-based, market-tested intelligence from around the State of Florida and the U.S. Some of this knowledge, coupled with the intelligence gained through board investments in pilot projects, is applicable to work done internally by CareerSource Florida and its associated local boards, educators and training providers, economic developers and state policy-makers in the development of policy and in support of market-informed decision-making. Through the Strategic Integration Initiative, CareerSource Florida will produce and disseminate via a Market Intelligence Portal critical labor market intelligence – in a user-friendly interface – to the CareerSource Florida
7
network, educators and training providers, and to economic development partners to enable improved decision-making.
Performance Funding Model Initiative: CareerSource Florida and the Florida Department of Economic Opportunity (DEO) will design and build a Performance Funding Model based on performance concepts identified by the CareerSource Florida Board of Directors with related metrics identified by the regional workforce boards. The Performance Funding Model will provide the CareerSource Florida network with a customized, long-term performance funding mechanism to identify and measure network performance and reward regions for meeting performance targets, for demonstrating continuous improvement and for achieving excellence.
Workforce Innovation and Opportunity Act Implementation: With the passage of WIOA, several new duties and responsibilities have been added to Florida’s workforce development system, each requiring a methodical and focused approach in order to determine the best recommendations possible for full and complete implementation. CareerSource Florida was charged with leading a task force of state agency, business and education partners who began evaluating new requirements of WIOA to provide specific recommendations to the State Board for policy consideration, the Governor for decision and action, and the Legislature for statutory consideration using a time schedule that allows each organization responsible for WIOA implementation to effectively prepare for implementation. Additional information on implementation of these goals and objectives is contained later in this report. Worth noting is that Florida is well-positioned for WIOA implementation, having benefited for the past several years from a business-focused workforce system that engages with multiple core partners. The new law both codifies and compels improvements in relationships with businesses and core partners. Further, it requires the expansion of these partnerships to create a truly inclusive workforce system in which all Floridians have the opportunity to maximize their potential for self-sufficiency. Governance
In Florida, the primary roles in WIA-related governance and service delivery in PY 2014-2015 were as follows:
State Workforce Investment Board (WIA Section 111): CareerSource Florida is the statewide policy and investment board of business and government leaders charged with guiding workforce development for the State of Florida. CareerSource Florida provides oversight and policy direction for talent development programs administered by DEO, Florida’s 24 regional workforce boards and their nearly 100 career centers. Britt Sikes serves as the CareerSource Florida Board Chairman, having been appointed to the position in February 2015 by Governor Rick Scott. Chris Hart IV serves as President and CEO. For more information, please visit careersourceflorida.com. Created as a not-for-profit corporation, CareerSource Florida’s board of directors includes the Governor, members of the Florida Legislature and leaders in business and industry, government, labor, economic development, education, youth and community-based organizations including the following state agencies: the Department of Children and Families (DCF), DEO, Department of Education (DOE), Department of Elder Affairs and the Department of Juvenile Justice. State-level Administrative/Fiscal Agency (WIA Sections 132, 303, etc.): DEO is the governor’s agency for workforce support and training, economic development, and community development. DEO partners with CareerSource Florida and the state’s 24 regional workforce boards to
8
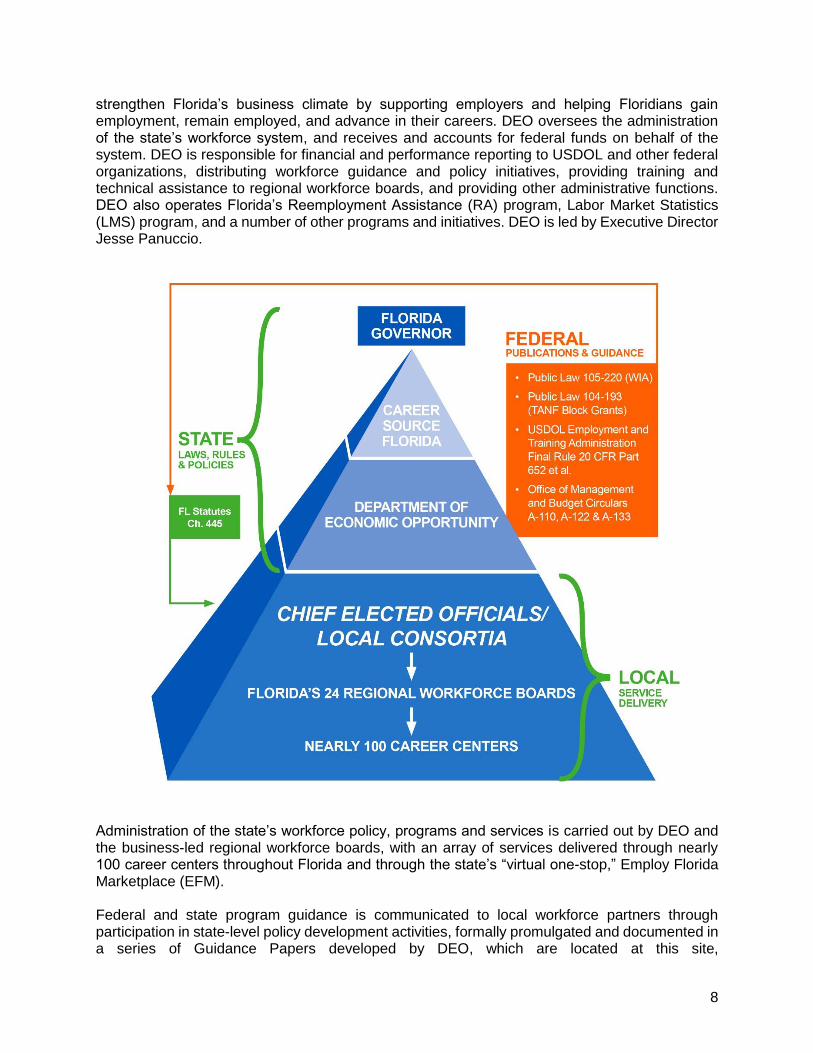
strengthen Florida’s business climate by supporting employers and helping Floridians gain employment, remain employed, and advance in their careers. DEO oversees the administration of the state’s workforce system, and receives and accounts for federal funds on behalf of the system. DEO is responsible for financial and performance reporting to USDOL and other federal organizations, distributing workforce guidance and policy initiatives, providing training and technical assistance to regional workforce boards, and providing other administrative functions. DEO also operates Florida’s Reemployment Assistance (RA) program, Labor Market Statistics (LMS) program, and a number of other programs and initiatives. DEO is led by Executive Director Jesse Panuccio.
Administration of the state’s workforce policy, programs and services is carried out by DEO and the business-led regional workforce boards, with an array of services delivered through nearly 100 career centers throughout Florida and through the state’s “virtual one-stop,” Employ Florida Marketplace (EFM). Federal and state program guidance is communicated to local workforce partners through participation in state-level policy development activities, formally promulgated and documented in a series of Guidance Papers developed by DEO, which are located at this site,
9
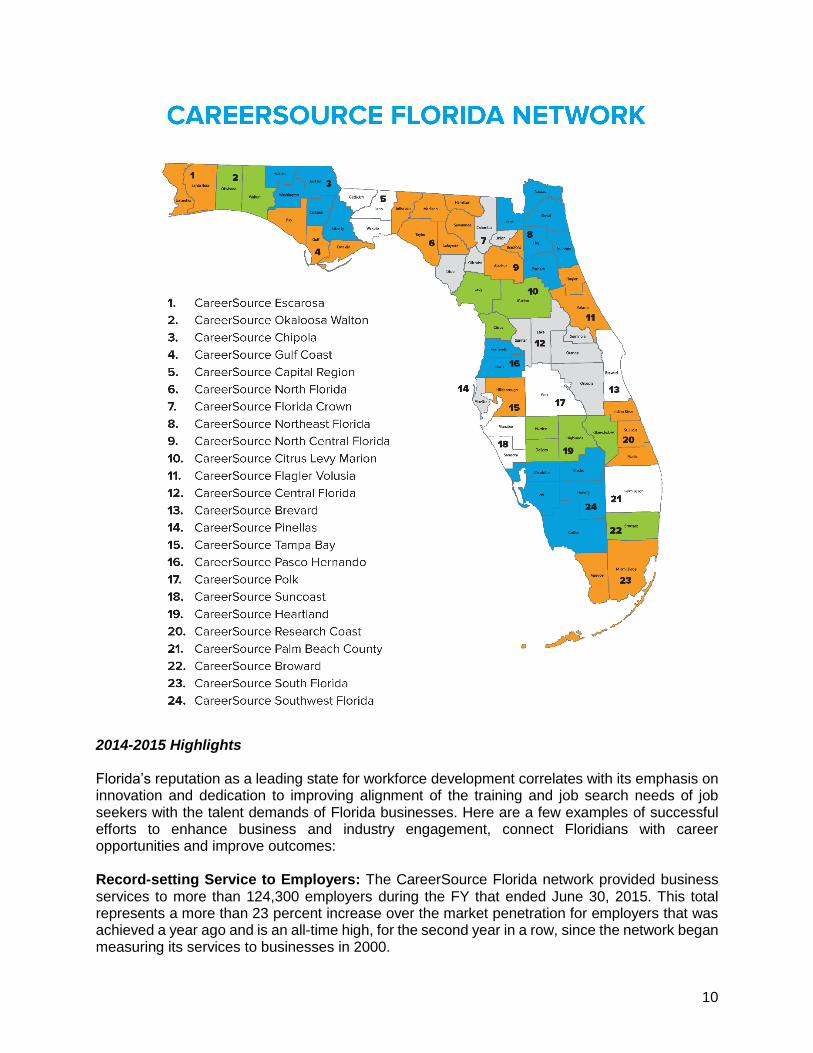
www.floridajobs.org/workforce-board-resources/policy-and-guidance/guidance-papers. State and local partners vet these policy documents prior to final issuance. DEO and the regional workforce boards have an executed Grantee-Sub-grantee Agreement that sets forth programmatic and administrative responsibilities to ensure compliance with all federal and state laws, regulations and any special state requirements. Local Workforce Investment Boards (WIA Section 117): Florida’s 24 regional workforce boards and the areas they serve are shown in Exhibit 1. Also known as local or regional boards, they provide a coordinated and comprehensive delivery of local workforce services. Local boards include private business owners, economic development and education representatives, community and state agency representatives, and locally elected officials. Together, they represent the diversity of businesses, organizations, and trades operating in the region. The local board’s active involvement is key to the provision of essential data relating to in-demand skills, available jobs, expanding career fields, and the identification and development of programs that best meet the needs of local employers and job seekers. Local boards focus on strategic planning, policy development, and oversight of the local workforce investment system within their respective regions. Statewide, local boards oversee nearly 100 career centers that offer job training, education, and employment services designed to connect employers with skilled talent and Florida’s job seekers with employment and career development opportunities. Local flexibility is another key component of Florida’s workforce system. While each regional workforce board has performance measures and contracts to provide accountability, choices of initiatives and programs implemented are under the local board’s authority. This flexibility allows local programs to address the economic development, business and workforce needs of each particular region of the state. One-Stop Delivery System (WIA Section 121): Florida’s network of nearly 100 career centers, part of the American Job Centers network, may be found at employflorida.com. CareerSource Florida and DEO, at the state level, and regional workforce boards, at the local level, are where business influences workforce policy and investment in collaboration with public-sector leadership. By working closely with stakeholders in business, education and economic development, CareerSource Florida and its state and local partners can develop and deliver effective, market-relevant workforce solutions that drive economic growth and sustainability.
Exhibit 1
On November 20, 2014, the CareerSource Florida Board of Directors approved a request from Okeechobee County for a voluntary redesignation from CareerSource Research Coast (Region 20) to CareerSource Heartland (Region 19). Following the board’s action, the county was redesignated by Governor Rick Scott and the redesignation was formally approved by USDOL, taking effect July 1, 2015. The following map reflects the resulting alignment of counties within Florida’s local workforce development boards.
10
2014-2015 Highlights Florida’s reputation as a leading state for workforce development correlates with its emphasis on innovation and dedication to improving alignment of the training and job search needs of job seekers with the talent demands of Florida businesses. Here are a few examples of successful efforts to enhance business and industry engagement, connect Floridians with career opportunities and improve outcomes: Record-setting Service to Employers: The CareerSource Florida network provided business services to more than 124,300 employers during the FY that ended June 30, 2015. This total represents a more than 23 percent increase over the market penetration for employers that was achieved a year ago and is an all-time high, for the second year in a row, since the network began measuring its services to businesses in 2000.
11
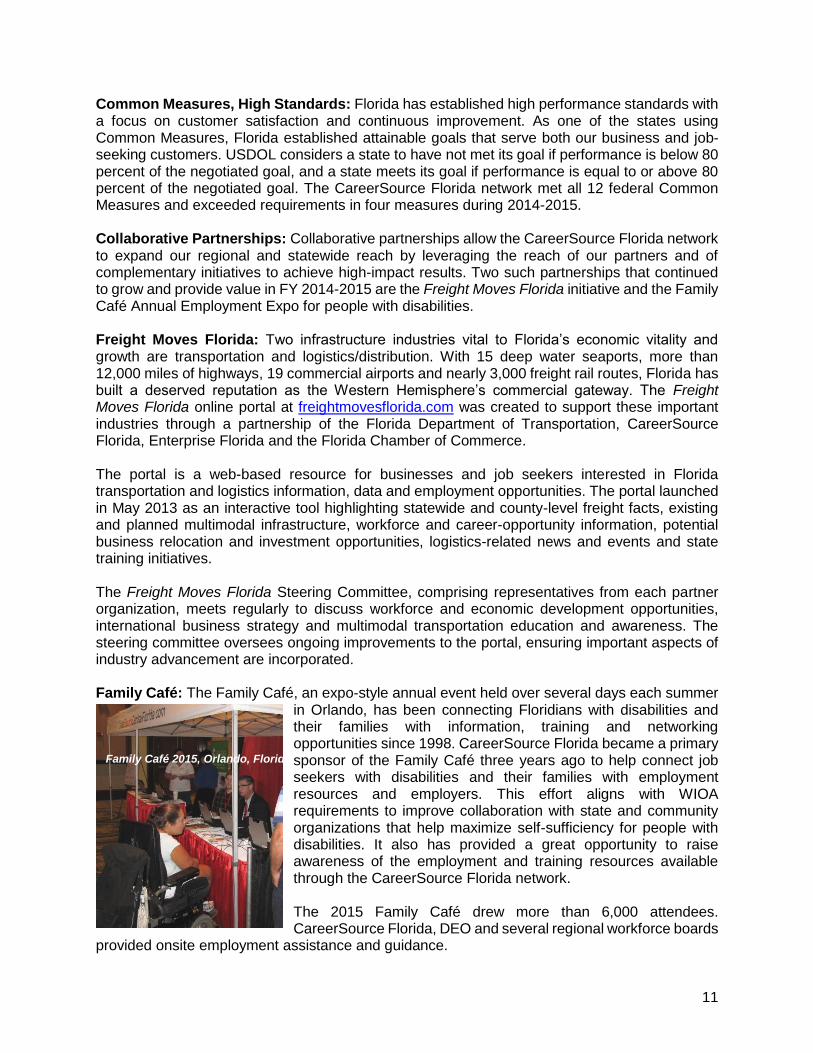
Common Measures, High Standards: Florida has established high performance standards with a focus on customer satisfaction and continuous improvement. As one of the states using Common Measures, Florida established attainable goals that serve both our business and job-seeking customers. USDOL considers a state to have not met its goal if performance is below 80 percent of the negotiated goal, and a state meets its goal if performance is equal to or above 80 percent of the negotiated goal. The CareerSource Florida network met all 12 federal Common Measures and exceeded requirements in four measures during 2014-2015. Collaborative Partnerships: Collaborative partnerships allow the CareerSource Florida network to expand our regional and statewide reach by leveraging the reach of our partners and of complementary initiatives to achieve high-impact results. Two such partnerships that continued to grow and provide value in FY 2014-2015 are the Freight Moves Florida initiative and the Family Café Annual Employment Expo for people with disabilities. Freight Moves Florida: Two infrastructure industries vital to Florida’s economic vitality and growth are transportation and logistics/distribution. With 15 deep water seaports, more than 12,000 miles of highways, 19 commercial airports and nearly 3,000 freight rail routes, Florida has built a deserved reputation as the Western Hemisphere’s commercial gateway. The Freight Moves Florida online portal at freightmovesflorida.com was created to support these important industries through a partnership of the Florida Department of Transportation, CareerSource Florida, Enterprise Florida and the Florida Chamber of Commerce. The portal is a web-based resource for businesses and job seekers interested in Florida transportation and logistics information, data and employment opportunities. The portal launched in May 2013 as an interactive tool highlighting statewide and county-level freight facts, existing and planned multimodal infrastructure, workforce and career-opportunity information, potential business relocation and investment opportunities, logistics-related news and events and state training initiatives. The Freight Moves Florida Steering Committee, comprising representatives from each partner organization, meets regularly to discuss workforce and economic development opportunities, international business strategy and multimodal transportation education and awareness. The steering committee oversees ongoing improvements to the portal, ensuring important aspects of industry advancement are incorporated. Family Café: The Family Café, an expo-style annual event held over several days each summer
in Orlando, has been connecting Floridians with disabilities and their families with information, training and networking opportunities since 1998. CareerSource Florida became a primary sponsor of the Family Café three years ago to help connect job seekers with disabilities and their families with employment resources and employers. This effort aligns with WIOA requirements to improve collaboration with state and community organizations that help maximize self-sufficiency for people with disabilities. It also has provided a great opportunity to raise awareness of the employment and training resources available through the CareerSource Florida network. The 2015 Family Café drew more than 6,000 attendees. CareerSource Florida, DEO and several regional workforce boards
provided onsite employment assistance and guidance.
Family Café 2015, Orlando, Florida
12
Professional Development: Florida’s Workforce Professional Development Summit for front-line staff, managers and executives within the CareerSource Florida network provides a critical opportunity to learn and reinforce best practices and innovative approaches to serving the businesses and citizens of Florida. An annual event since 2009, the three-day summit also provides an opportunity to recognize “Workforce Champions” from throughout the system – individuals who exemplify leadership in their daily interactions with businesses, job seekers and colleagues. October 2014’s summit saw extraordinary engagement from throughout the system, with all 24 local workforce development boards participating – 835 attendees at a training cost per person of $130. The summit, developed with input from the Florida Workforce Development Association, CareerSource Florida, DEO, DOE, local workforce development boards, service providers and other partners, included 83 workshops and 20 sponsor showcases. The training workshops covered more than 25 subject areas, from Case Management to Communications to Information Technology. Priority Service for Veterans: Florida is home to the third-highest population of military veterans in the nation. Providing employment and training services to this talented, skilled population is a high priority for the CareerSource Florida network. The CareerSource Florida network provides and engages in several events year-round, both at the state and local levels, aimed at connecting veteran job seekers and employers, including the annual Paychecks for Patriots career fairs statewide, detailed later in this report. In 2014-2015, 24,937 veterans, or 57 percent of those assisted by Florida’s workforce system, were reported to have entered employment.
ENHANCING ACCESS FOR FLORIDA’S BUSINESSES AND JOB SEEKERS
Career Centers: Meeting Customers’ Needs Florida’s career center system was initially established to bring workforce and welfare transition programs together to simplify and improve access for employers seeking qualified workers and training for new or existing employees as well as for job seekers. WIA mandated participation by nearly a dozen agencies that determine eligibility for and provide:
Job placement and training for job seekers and laid-off workers.
Reemployment Assistance.
Vocational Rehabilitation Services.
Transitional Services to assist in moving from welfare to work.
Veterans Employment & Training.
Services for Migrant and Seasonal Farmworkers (MSFW). Over time, many of Florida’s career centers have expanded their services and programs and have invited other partners to co-locate both physically and through website linkages. Some regions have created “satellite” career centers that are strategically located within other community partners’ facilities such as at local chambers, libraries and community-based organizations. These partnerships and co-locations have become increasingly important in laying the foundation for implementing the new federal WIOA, which emphasizes regional and community partnerships and close collaboration with core partners to improve employment outcomes. All of Florida’s career centers are affiliated with each other using the CareerSource Florida affiliate brand. Several regional workforce boards deploy mobile career centers to provide services to Florida businesses and workers in support of special events or in areas where access can be challenging.
13
With major emphasis on providing on-site services at employer sites and direct service delivery in rural communities and other locations throughout the regions, the use of mobile career centers continues to serve as a cost-effective and customer-friendly service solution. The mobile career centers also have played an integral role in the delivery of services and assistance during hurricanes and other disaster events. WIOA emphasizes the importance of serving the business customer. The CareerSource Florida network is a key resource for businesses seeking qualified workers and grants for customized training for new or existing employees. All 24 regional workforce boards have established dedicated business services teams and, in several cases, designated career centers in business districts to help local employers recruit, train and retain workers. Communications Tools Increasingly, digital communication and social media are replacing traditional outreach tools and media as effective and efficient methods of educating and informing current and potential customers and partners. While still employing traditional outreach tactics such as print and radio advertising, CareerSource Florida is following the growing trend of using digital platforms to reach both employers and job seekers. The CareerSource Florida website serves as an important communications tool for accessing information about statewide initiatives, the latest news, policy updates and board actions, state
board meetings and workforce system successes. CareerSource Florida also employs integrated communications tactics including several social media accounts and paid and earned media to inform Florida’s job seekers, workers and businesses as well as board members, state and local partners and various stakeholders. CareerSource Florida’s social media presence on platforms including Facebook and Twitter has been recognized by regional offices of the USDOL Employment & Training Administration as a best practice. Additional CareerSource Florida tools include timely and relevant updates on workforce system issues and news, frequent electronic
messages from the President/CEO of CareerSource Florida to the CareerSource Florida Board, DEO and regional workforce boards; The Chairman’s Corner quarterly e-newsletter written by the CareerSource Florida Board Chair; regularly scheduled and special legislative updates; and news releases and special alerts as warranted. CareerSource Florida invests in statewide advertising and outreach to help businesses and job seekers locate and connect with the resources and services available through the state workforce development system. The 2014-2015 statewide advertising plan aimed to build upon the growing brand awareness of the CareerSource Florida network. Through strategic advertising placements, copy and design, and a strong call to action, workers and employers are encouraged to visit careersourceflorida.com to access the CareerSource Florida network’s services and resources. In particular, the plan emphasized informing employers of the resources, services and access to skilled talent available via the CareerSource Florida network. Digital placements via social media
14
and “banner” ads on relevant websites are two of the means by which CareerSource Florida seeks to harness technology to support traditional advertising like print publications and radio programming. Employ Florida Marketplace: Online Workforce Services and Virtual Career Center
In today’s technology-driven marketplace, job seekers and businesses need access to workforce services 24 hours a day, seven days a week. The Employ Florida Marketplace website at employflorida.com is Florida’s virtual job-matching tool, providing access at no charge to great employment opportunities, resume-building resources and many other services to help connect businesses, job seekers and Floridians looking to grow in their careers.
Since Employ Florida launched in 2005, 190,470 employers have registered on the site and nearly 2.5 million resumes have been posted. Employ Florida provides businesses valuable information on training grants as well as links to labor market information and talent tools available at both the state and local levels. Florida’s job seekers are able to search for employment opportunities from numerous job and corporate websites as well as those placed directly on Employ Florida by businesses or through regional workforce boards and/or career centers, making Employ Florida the most comprehensive source for current Florida job openings. Both employers and job seekers can locate Florida’s workforce services and resources anywhere via Employ Florida or by calling the toll-free Employ Florida Helpdesk, staffed by DEO, at 866-FLA-2345. Employ Florida is consistently upgraded to maintain relevancy and to incorporate improved technology. The use of micro-portals, powered by Employ Florida, that provide specialized and targeted job matching adds value for both employers and job seekers with specific interests and needs. To date, CareerSource Florida and DEO, in collaboration with regional workforce boards and other partners, maintain dedicated entry points with customized job-search information and resources for Florida veterans, job seekers age 50 and older, those interested in green jobs, and people with disabilities. The current lineup of permanent micro-portals created to address targeted job seekers includes:
Employ Florida Vets Portal Employ Florida Vets at veterans.employflorida.com was developed through a series of focus groups with Florida veterans. The portal translates a veteran’s Military Occupational Specialty Code (a code that represents the employment classification for the specialty/job that the military veteran performed while on active duty) into an equivalent civilian job title.
15
Employ Florida Vets was chosen by the Florida Department of Veterans Affairs (FDVA) as the destination for employment inquiries made via its website and mobile app. Other portal highlights include:
Information and advice about writing résumés and finding apprenticeships and jobs ideally suited to their military experience.
Information about the Florida law that gives veterans hiring preference when they apply for public-sector jobs.
Information for Florida businesses and organizations about tax incentives available for hiring veterans.
A centralized jobs posting site for employers seeking veterans with specialized skills.
During PY 2014-2015, there were approximately 40,000 visits to the portal, reflecting the significance of this resource to veterans. Employ Florida Silver Edition Portal
Created to assist job seekers 50 and older as well as employers seeking seasoned, experienced workers, the statewide Employ Florida Marketplace Silver Edition at silver.employflorida.com was initially launched as a regional pilot project. The micro-portal was developed through a collaborative process engaging CareerSource Florida, DEO, regional workforce boards, the Florida Department of Elder Affairs and community-based organizations, among others. The portal is designed to help job seekers 50 and older
search for the right job, with access to a wide range of job training and job placement programs and services, while also helping employers identify the best job candidates. Employ Florida Green Jobs Portal Florida averages about 240 days of year-round sunshine and receives 85 percent of the maximum solar resource available in the U.S. Not surprisingly, the Sunshine State took an early lead in production of solar power nationally. The Employ Florida Green Jobs portal at greenjobs.employflorida.com was created to provide online career resources for individuals who seek information on jobs in the energy industry focused on renewable energy, energy efficiency and conservation due to the expected growth of this sector. The portal provides multiple resources, including information about various initiatives that support conservation and renewable energy use.
16
Florida Abilities Work Portal The Florida Abilities Work portal at abilitieswork.employflorida.com is a tool for employers and job seekers with disabilities. The micro-portal is housed on the EFM website with a logo button for ease of access. The portal was specifically designed to provide resources to persons with disabilities and to assist employers who are interested in hiring. The 2014 Florida Legislature
appropriated funding for a help desk that is staffed by DOEs Division of Vocational Rehabilitation. The portal was developed in response to the Governor’s Commission on Jobs for Floridians with Disabilities. In its first report to the governor, one of the recommendations was for a single point of contact for employers seeking to hire persons with disabilities. EFM seemed like a natural fit and the Florida Abilities Work portal was
conceived. This was a collaborative process with input from the Agency for Persons with Disabilities, DOE Divisions of Vocational Rehabilitation and Blind Services, and the Florida Developmental Disabilities Council to name a few. Focus groups convened around the state, allowing input from stakeholder groups such as employers, field staff, customers and family members, and a communications group, comprising representatives from partner agencies, also met during development to ensure a consistent message.
CAREERSOURCE FLORIDA PRIORITIES, INITIATIVES AND STATE-LEVEL
ACTIVITIES Business and Workforce Development There are three major objectives of focus in CareerSource Florida’s Business and Workforce Development unit as follows: Redefining Customer Service Standards for Business Talent Support Continuous improvement is a key value of the CareerSource Florida network. CareerSource Florida is evaluating and redefining all standards and measures (as well as removing any deemed unnecessary) in customer service. This effort enables Florida business, especially those in key target sectors aligned to the state and regional economic development priorities, to fully benefit from CareerSource Florida-administered training grant programs as well as facilitate seamless access to tools and services across partner/organization programs. CareerSource Florida is continuing to build on its Salesforce-based Customer Relationship Management platform to improve business services. Creating a Total Talent Delivery System / Expanded Business Engagement 3.0 The umbrella of business support and training services available throughout the CareerSource Florida network enables Florida to be better positioned to respond to short-term and long-term talent needs of existing and new-to-Florida companies. Our goal is facilitate a seamless, external-focused talent solution strategy for Florida business.
17
Using the market segmentation framework and planning tools in the CareerSource Florida Professional Business Development Tool Kit developed, in part, through the USDOL Expanding Business Engagement grant, helps ensure that businesses of all sizes in all sectors are identified for proactive talent support strategies. CareerSource Florida’s Business and Workforce Development Unit will continue to lead network-wide webinars for all business liaisons/account managers who interface with business on talent needs. A strategic outreach plan associated with Florida’s Human Resources professionals will be developed to maximize marketing opportunities. Further, under-utilized sources of talent (e.g., special population groups) are consistently being marketed to Florida businesses. Implementing Sector Strategies The State Board of Directors is continuing its focus on sector strategies for healthcare and advanced manufacturing – two key sectors of importance in Florida’s economy. These sector initiatives build on a continuous effort to obtain essential business feedback from employers so our entire network can be responsive to their talent needs. The need for market-relevant business intelligence remains important due to rapid economic and competitiveness changes that directly correlate to a skilled talent pipeline. Advanced Manufacturing Marketplace Business Intelligence Research and Sector Strategy Approach Services: This three-year initiative, begun in 2014, will result in the promotion of business growth by better connecting Florida’s advanced manufacturers to existing public and private resources essential for increased competitiveness and profitability, which includes among those resources, leveraging the workforce and talent development assets within the state. The Manufacturers Association of Florida’s (MAF) Center for Advanced Manufacturing Excellence (CAME) serves as the Advanced Manufacturing Workforce Leadership Council and coordinates with its 12 RMAs. Both the Council and the RMAs, comprising Florida industry, drive business-led improvements in talent delivery. The purpose of the initiative is to:
Promote advanced manufacturing business growth.
Better connect Florida's advanced manufacturers to existing public and private resources.
Leverage the workforce and talent development assets within the state.
Create a new sector strategy approach for advanced manufacturing.
Create an essential business feedback loop to ensure a robust Florida workforce network.
Develop solutions for the advanced manufacturing talent delivery system.
Establish how the USDOL and other selected grants have impacted the talent pipeline in the last 3-5 years.
The first year of the three-year initiative resulted in the following:
A Florida Advanced Manufacturing Workforce Leadership Council was established within CAME.
Manufacturing focus groups were held in 12 regions.
Two problem-solving sessions with manufacturers and partnering organizations.
Research was conducted to define the advanced manufacturing sector, identify core occupations, evaluate data points for the sector and how they are used for decision making.
Preparation of a plan to analyze USDOL and other key manufacturing investments in Florida.
18
Preparation of a Year-end Summary of activities and findings with proposed action for subsequent year(s).
Details on this project can be found at mafcenter.org. Healthcare Business Intelligence Research and Sector Strategy Approach Services: Florida’s Healthcare Workforce Initiative resulted in the formation of a Statewide Florida Healthcare Workforce Leadership Council (FHWL) in 2014-2015. The Council serves as the primary point of contact for statewide healthcare industry-specific labor market intelligence and is used by the state’s workforce network to facilitate policy and strategy development. The FHWL resulted in a new sector strategy approach for healthcare to develop and continue an essential business feedback loop to ensure Florida’s workforce network has a deep understanding of and is responsive to the talent needs of the state. Common issues and needs of employers are identified and coordinated solutions developed for the healthcare talent delivery system. Professional and State Advisory Resource Groups have been established as a source for information and data essential to enable healthcare workforce policy and strategy development. In addition, the initiation of Regional Councils is underway to consider issues specific to Florida’s unique cultures that exist at the local level. The purpose of the initiative is to:
Identify gaps in healthcare workforce supply and demand data, and design a collection system to effectively analyze data at the state and regional level.
Develop strategies for recruitment and retention of healthcare workers, including critical need areas across all health professions.
Identify emerging workforce roles, such as in healthcare informatics, and develop a method to educate the current workforce regarding value-based care.
Additional information on Florida’s Healthcare Workforce Initiative may be found at: FLHealthcareWorkforce.org. Sector Partnership National Emergency (NEG) Grant: With the award of a nearly $7 million Sector Partnership NEG, CareerSource Florida and DEO will build on Florida’s sector strategies approach by providing intensive services and training to program participants in 10 local workforce development boards so they may obtain industry-recognized credentials and ultimately employment. Quick Response Training Grant Program: Florida’s Quick Response Training (QRT) Program, established in 1993, provides state-level funding for customized training to new or expanding businesses. During 2014-2015, Florida continued to enhance the application process for businesses to quickly respond to training objectives in demand-driven areas. In FY 2014-2015, CareerSource Florida awarded 50 QRT grants totaling nearly $11.7 million to support the skills upgrade training for new and 7,465 existing full-time employees. On average, trainees’ wages increased by more than 36 percent within a year of completing QRT-supported training. Florida businesses received customized training at an average cost per trainee of $1,564. Extensive outreach activities were focused on counties, particularly rural counties that have never had a company benefit from QRT training assistance. For every $1 of QRT funds invested in training, companies matched $9.
19
Additionally, the Florida Legislature provided funding for the purpose of developing and launching a strategic marketing and business outreach plan for Florida’s nationally recognized QRT Program. The marketing plan was developed to identify a long-term vision and strategic objectives for QRT as well as recommendations for marketing and advertising tools and tactics to enhance the program’s competitive position. Market research was conducted to gain a greater understanding of the needs of business customers; key influencers including, but not limited to, economic developers, site selection consultants, workforce development professionals, education and training partners and stakeholders, and public policy leaders. The resulting plan provides a clear and concise roadmap for CareerSource Florida’s current and future investments in the marketing and promotion of QRT among businesses, including Florida small businesses, and key influencers. Through this project, CareerSource Florida also began implementation of recommended marketing strategies for messaging to internal and external audiences, development of an education and marketing tool kit for partners, marketing and brand-building materials such as brochures, digital outreach including website enhancements and social media outreach, and advertisements and media placements to support the program’s strategic marketing and business outreach objectives. A significant first-year outcome of this three-year marketing and outreach plan was the re-branding of the QRT program to FloridaFlex, a new name and logo to emphasize the program’s enhancements and increased flexibility. Incumbent Worker Training Grant Program: Established in 1999, Incumbent Worker Training (IWT) grants provide funding for customized training including skills-upgrade training to existing for-profit businesses. Through these grants, Florida effectively retains businesses and enhances competitiveness by supporting skills-upgrade training for existing full-time employees. In FY 2014-2015, CareerSource Florida awarded 115 IWT grants totaling more than $3.1 million to help companies train and retain more than 7,000 full-time employees. Trainees’ wages have increased more than 11 percent on average within 15 months of completing IWT-supported training. Florida’s IWT program is funded at $2 million annually. Funding priority is given to businesses that are small, or located in rural, enterprise zone, brownfield or inner-city areas, and those businesses in a targeted industry. Extensive outreach through presentations and workshops have been conducted to ensure that as many small businesses as possible are aware of the benefits of the IWT program. IWT is very popular and continues to meet a critical need for Florida’s businesses. Since its inception, more than $100 million in requests for IWT funding have been received and, due to limited funding, 58 percent of the requests have resulted in awards. For every $1 of IWT funds invested in training, companies matched $7.39.
20
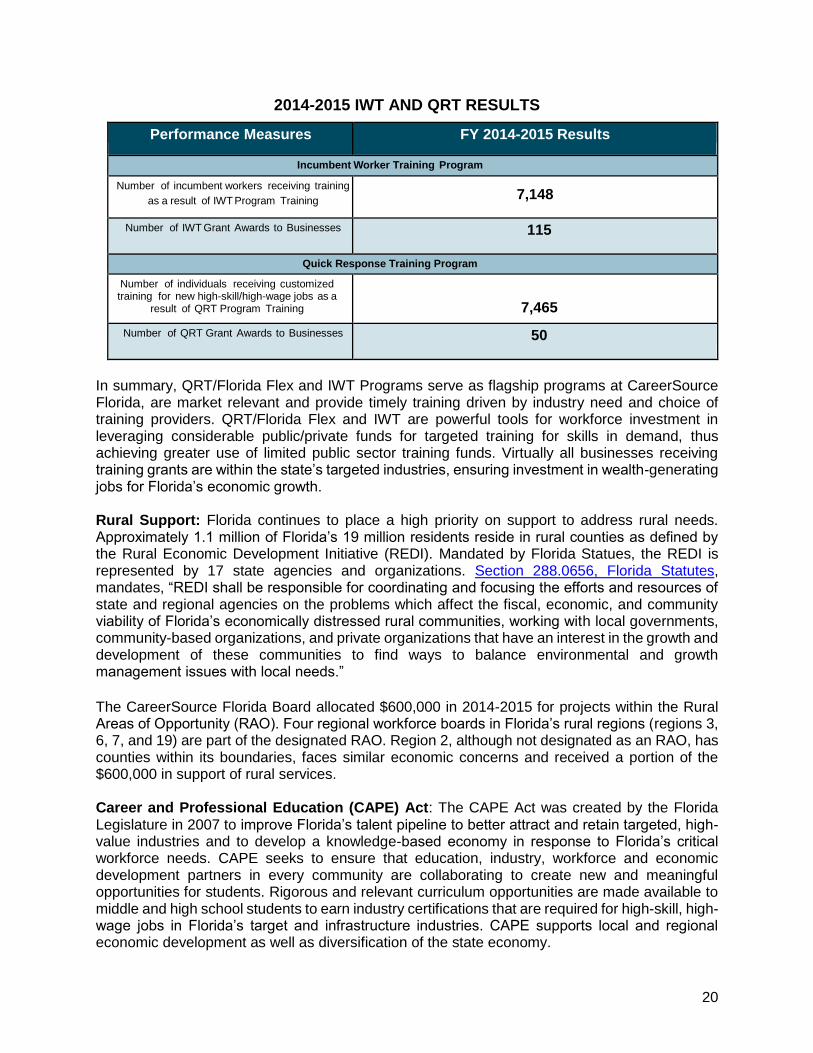
2014-2015 IWT AND QRT RESULTS
Performance Measures FY 2014-2015 Results
Incumbent Worker Training Program
Number of incumbent workers receiving training
as a result of IWT Program Training
7,148
Number of IWT Grant Awards to Businesses 115
Quick Response Training Program
Number of individuals receiving customized training for new high-skill/high-wage jobs as a
result of QRT Program Training
7,465
Number of QRT Grant Awards to Businesses 50
In summary, QRT/Florida Flex and IWT Programs serve as flagship programs at CareerSource Florida, are market relevant and provide timely training driven by industry need and choice of training providers. QRT/Florida Flex and IWT are powerful tools for workforce investment in leveraging considerable public/private funds for targeted training for skills in demand, thus achieving greater use of limited public sector training funds. Virtually all businesses receiving training grants are within the state’s targeted industries, ensuring investment in wealth-generating jobs for Florida’s economic growth. Rural Support: Florida continues to place a high priority on support to address rural needs. Approximately 1.1 million of Florida’s 19 million residents reside in rural counties as defined by the Rural Economic Development Initiative (REDI). Mandated by Florida Statues, the REDI is represented by 17 state agencies and organizations. Section 288.0656, Florida Statutes, mandates, “REDI shall be responsible for coordinating and focusing the efforts and resources of state and regional agencies on the problems which affect the fiscal, economic, and community viability of Florida’s economically distressed rural communities, working with local governments, community-based organizations, and private organizations that have an interest in the growth and development of these communities to find ways to balance environmental and growth management issues with local needs.”
The CareerSource Florida Board allocated $600,000 in 2014-2015 for projects within the Rural Areas of Opportunity (RAO). Four regional workforce boards in Florida’s rural regions (regions 3, 6, 7, and 19) are part of the designated RAO. Region 2, although not designated as an RAO, has counties within its boundaries, faces similar economic concerns and received a portion of the $600,000 in support of rural services. Career and Professional Education (CAPE) Act: The CAPE Act was created by the Florida Legislature in 2007 to improve Florida’s talent pipeline to better attract and retain targeted, high-value industries and to develop a knowledge-based economy in response to Florida’s critical workforce needs. CAPE seeks to ensure that education, industry, workforce and economic development partners in every community are collaborating to create new and meaningful opportunities for students. Rigorous and relevant curriculum opportunities are made available to middle and high school students to earn industry certifications that are required for high-skill, high-wage jobs in Florida’s target and infrastructure industries. CAPE supports local and regional economic development as well as diversification of the state economy.
21
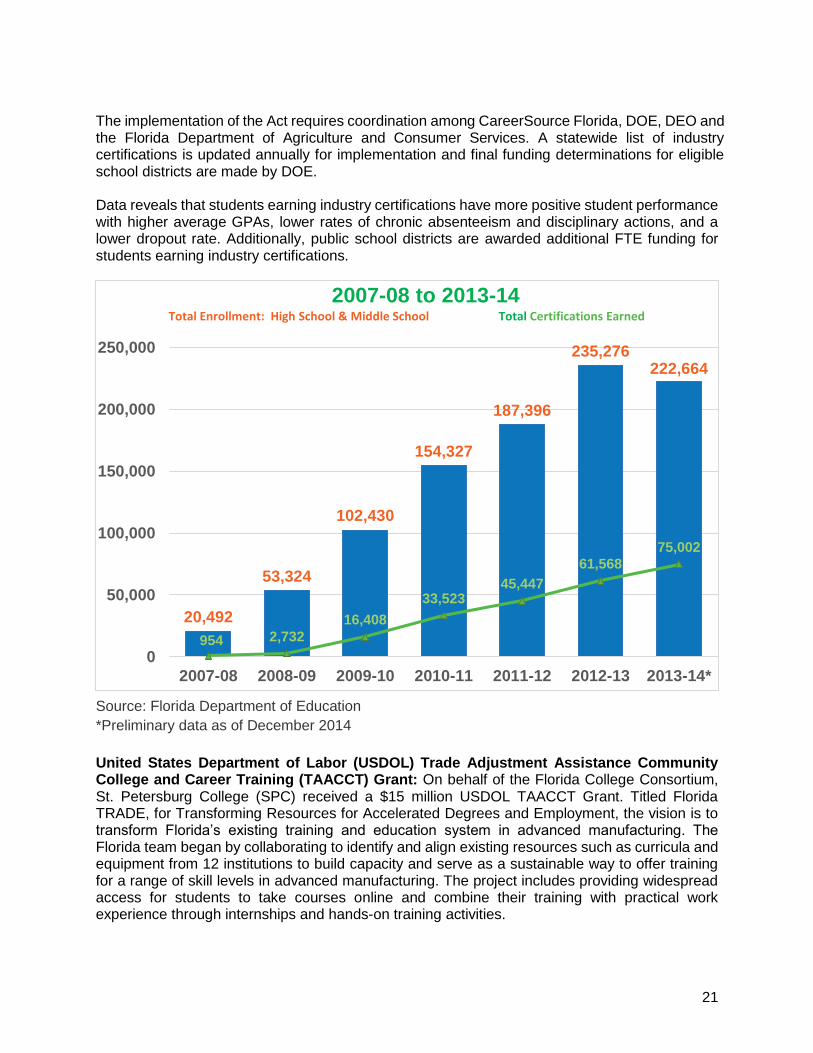
The implementation of the Act requires coordination among CareerSource Florida, DOE, DEO and the Florida Department of Agriculture and Consumer Services. A statewide list of industry certifications is updated annually for implementation and final funding determinations for eligible school districts are made by DOE. Data reveals that students earning industry certifications have more positive student performance with higher average GPAs, lower rates of chronic absenteeism and disciplinary actions, and a lower dropout rate. Additionally, public school districts are awarded additional FTE funding for students earning industry certifications.
Source: Florida Department of Education
*Preliminary data as of December 2014
United States Department of Labor (USDOL) Trade Adjustment Assistance Community College and Career Training (TAACCT) Grant: On behalf of the Florida College Consortium, St. Petersburg College (SPC) received a $15 million USDOL TAACCT Grant. Titled Florida TRADE, for Transforming Resources for Accelerated Degrees and Employment, the vision is to transform Florida’s existing training and education system in advanced manufacturing. The Florida team began by collaborating to identify and align existing resources such as curricula and equipment from 12 institutions to build capacity and serve as a sustainable way to offer training for a range of skill levels in advanced manufacturing. The project includes providing widespread access for students to take courses online and combine their training with practical work experience through internships and hands-on training activities.
20,492
53,324
102,430
154,327
187,396
235,276222,664
954 2,732
16,408
33,52345,447
61,568
75,002
0
50,000
100,000
150,000
200,000
250,000
2007-08 2008-09 2009-10 2010-11 2011-12 2012-13 2013-14*
2007-08 to 2013-14Total Enrollment: High School & Middle School Total Certifications Earned
22
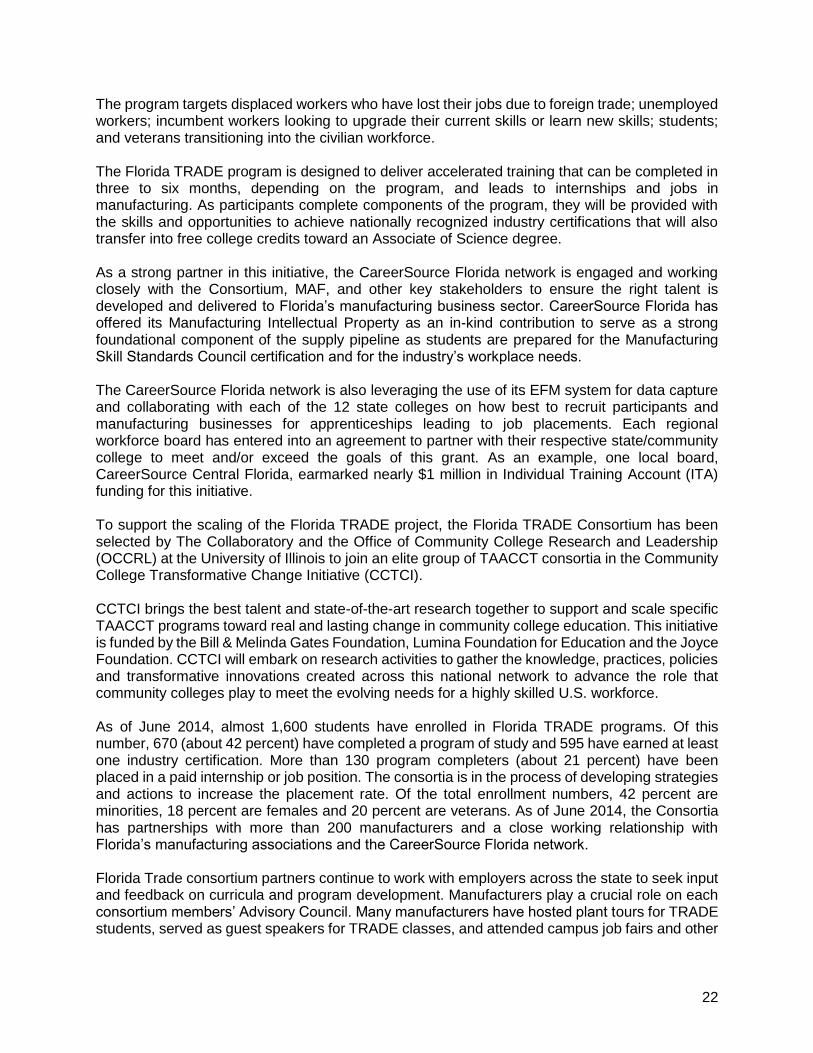
The program targets displaced workers who have lost their jobs due to foreign trade; unemployed workers; incumbent workers looking to upgrade their current skills or learn new skills; students; and veterans transitioning into the civilian workforce. The Florida TRADE program is designed to deliver accelerated training that can be completed in three to six months, depending on the program, and leads to internships and jobs in manufacturing. As participants complete components of the program, they will be provided with the skills and opportunities to achieve nationally recognized industry certifications that will also transfer into free college credits toward an Associate of Science degree. As a strong partner in this initiative, the CareerSource Florida network is engaged and working closely with the Consortium, MAF, and other key stakeholders to ensure the right talent is developed and delivered to Florida’s manufacturing business sector. CareerSource Florida has offered its Manufacturing Intellectual Property as an in-kind contribution to serve as a strong foundational component of the supply pipeline as students are prepared for the Manufacturing Skill Standards Council certification and for the industry’s workplace needs. The CareerSource Florida network is also leveraging the use of its EFM system for data capture and collaborating with each of the 12 state colleges on how best to recruit participants and manufacturing businesses for apprenticeships leading to job placements. Each regional workforce board has entered into an agreement to partner with their respective state/community college to meet and/or exceed the goals of this grant. As an example, one local board, CareerSource Central Florida, earmarked nearly $1 million in Individual Training Account (ITA) funding for this initiative. To support the scaling of the Florida TRADE project, the Florida TRADE Consortium has been selected by The Collaboratory and the Office of Community College Research and Leadership (OCCRL) at the University of Illinois to join an elite group of TAACCT consortia in the Community College Transformative Change Initiative (CCTCI). CCTCI brings the best talent and state-of-the-art research together to support and scale specific TAACCT programs toward real and lasting change in community college education. This initiative is funded by the Bill & Melinda Gates Foundation, Lumina Foundation for Education and the Joyce Foundation. CCTCI will embark on research activities to gather the knowledge, practices, policies and transformative innovations created across this national network to advance the role that community colleges play to meet the evolving needs for a highly skilled U.S. workforce. As of June 2014, almost 1,600 students have enrolled in Florida TRADE programs. Of this number, 670 (about 42 percent) have completed a program of study and 595 have earned at least one industry certification. More than 130 program completers (about 21 percent) have been placed in a paid internship or job position. The consortia is in the process of developing strategies and actions to increase the placement rate. Of the total enrollment numbers, 42 percent are minorities, 18 percent are females and 20 percent are veterans. As of June 2014, the Consortia has partnerships with more than 200 manufacturers and a close working relationship with Florida’s manufacturing associations and the CareerSource Florida network. Florida Trade consortium partners continue to work with employers across the state to seek input and feedback on curricula and program development. Manufacturers play a crucial role on each consortium members’ Advisory Council. Many manufacturers have hosted plant tours for TRADE students, served as guest speakers for TRADE classes, and attended campus job fairs and other
23
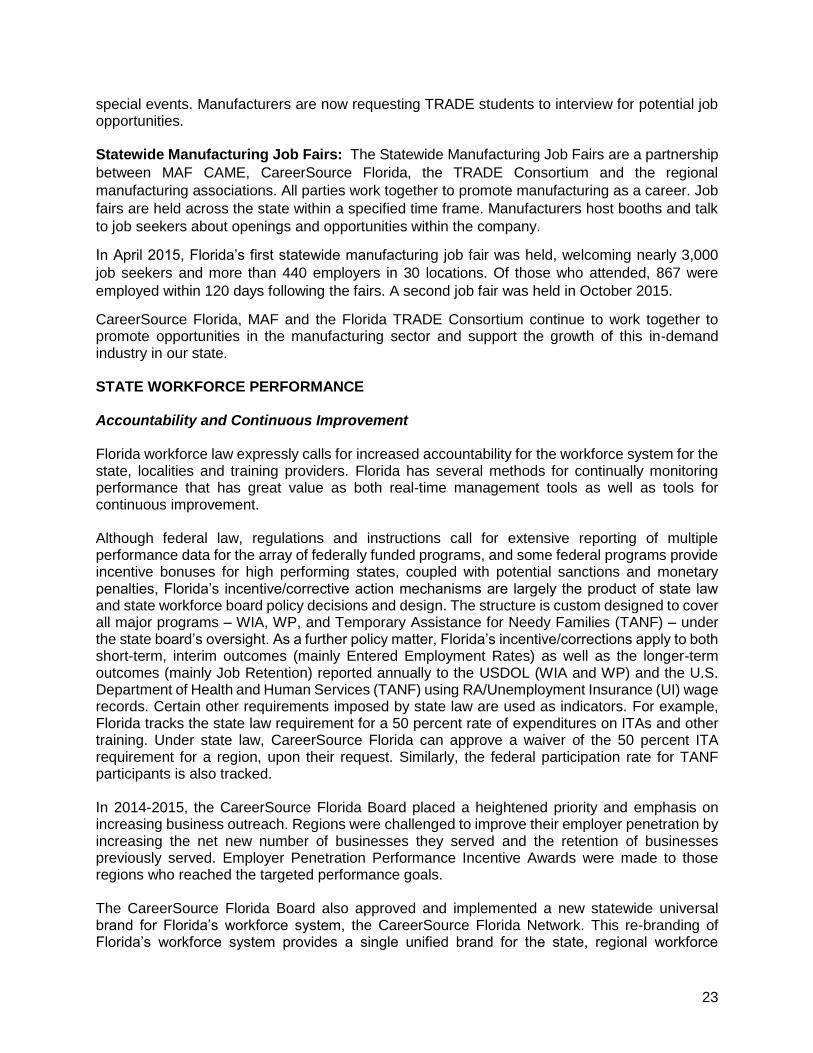
special events. Manufacturers are now requesting TRADE students to interview for potential job opportunities. Statewide Manufacturing Job Fairs: The Statewide Manufacturing Job Fairs are a partnership
between MAF CAME, CareerSource Florida, the TRADE Consortium and the regional
manufacturing associations. All parties work together to promote manufacturing as a career. Job
fairs are held across the state within a specified time frame. Manufacturers host booths and talk
to job seekers about openings and opportunities within the company.
In April 2015, Florida’s first statewide manufacturing job fair was held, welcoming nearly 3,000
job seekers and more than 440 employers in 30 locations. Of those who attended, 867 were
employed within 120 days following the fairs. A second job fair was held in October 2015.
CareerSource Florida, MAF and the Florida TRADE Consortium continue to work together to promote opportunities in the manufacturing sector and support the growth of this in-demand industry in our state. STATE WORKFORCE PERFORMANCE Accountability and Continuous Improvement Florida workforce law expressly calls for increased accountability for the workforce system for the state, localities and training providers. Florida has several methods for continually monitoring performance that has great value as both real-time management tools as well as tools for continuous improvement. Although federal law, regulations and instructions call for extensive reporting of multiple performance data for the array of federally funded programs, and some federal programs provide incentive bonuses for high performing states, coupled with potential sanctions and monetary penalties, Florida’s incentive/corrective action mechanisms are largely the product of state law and state workforce board policy decisions and design. The structure is custom designed to cover all major programs – WIA, WP, and Temporary Assistance for Needy Families (TANF) – under the state board’s oversight. As a further policy matter, Florida’s incentive/corrections apply to both short-term, interim outcomes (mainly Entered Employment Rates) as well as the longer-term outcomes (mainly Job Retention) reported annually to the USDOL (WIA and WP) and the U.S. Department of Health and Human Services (TANF) using RA/Unemployment Insurance (UI) wage records. Certain other requirements imposed by state law are used as indicators. For example, Florida tracks the state law requirement for a 50 percent rate of expenditures on ITAs and other training. Under state law, CareerSource Florida can approve a waiver of the 50 percent ITA requirement for a region, upon their request. Similarly, the federal participation rate for TANF participants is also tracked. In 2014-2015, the CareerSource Florida Board placed a heightened priority and emphasis on increasing business outreach. Regions were challenged to improve their employer penetration by increasing the net new number of businesses they served and the retention of businesses previously served. Employer Penetration Performance Incentive Awards were made to those regions who reached the targeted performance goals. The CareerSource Florida Board also approved and implemented a new statewide universal brand for Florida’s workforce system, the CareerSource Florida Network. This re-branding of Florida’s workforce system provides a single unified brand for the state, regional workforce
24
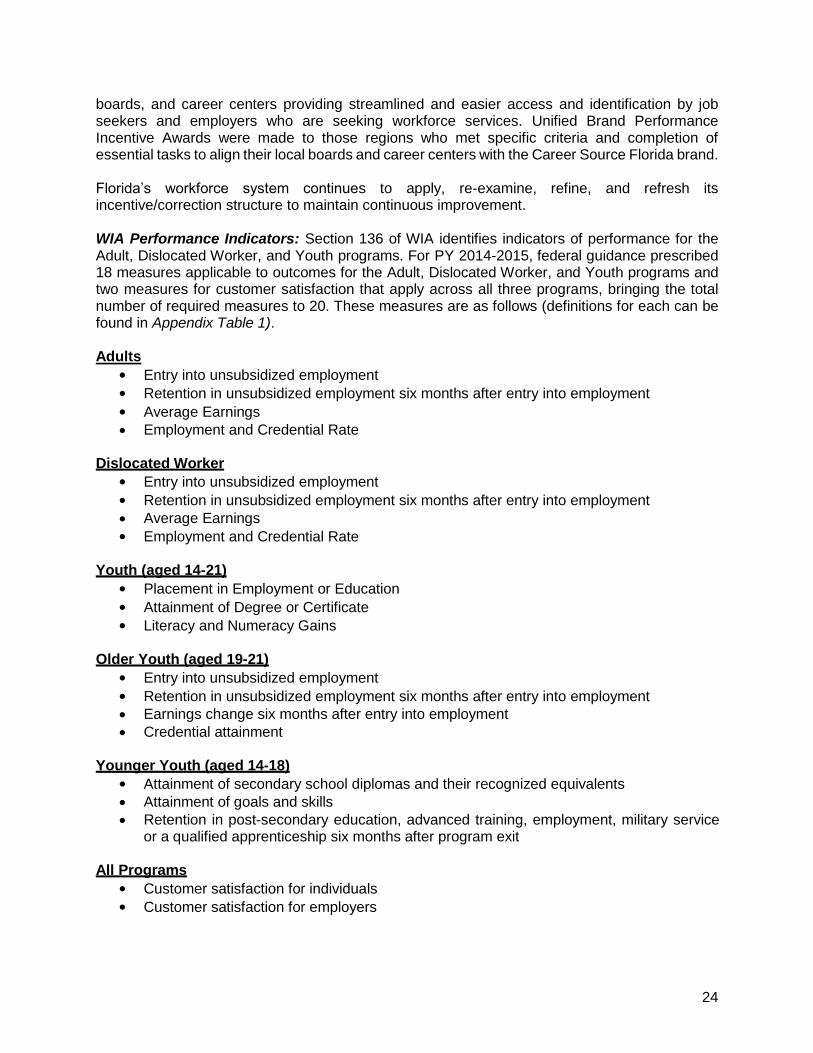
boards, and career centers providing streamlined and easier access and identification by job seekers and employers who are seeking workforce services. Unified Brand Performance Incentive Awards were made to those regions who met specific criteria and completion of essential tasks to align their local boards and career centers with the Career Source Florida brand. Florida’s workforce system continues to apply, re-examine, refine, and refresh its incentive/correction structure to maintain continuous improvement. WIA Performance Indicators: Section 136 of WIA identifies indicators of performance for the Adult, Dislocated Worker, and Youth programs. For PY 2014-2015, federal guidance prescribed 18 measures applicable to outcomes for the Adult, Dislocated Worker, and Youth programs and two measures for customer satisfaction that apply across all three programs, bringing the total number of required measures to 20. These measures are as follows (definitions for each can be found in Appendix Table 1). Adults
Entry into unsubsidized employment
Retention in unsubsidized employment six months after entry into employment
Average Earnings
Employment and Credential Rate Dislocated Worker
Entry into unsubsidized employment
Retention in unsubsidized employment six months after entry into employment
Average Earnings
Employment and Credential Rate
Youth (aged 14-21)
Placement in Employment or Education
Attainment of Degree or Certificate
Literacy and Numeracy Gains
Older Youth (aged 19-21)
Entry into unsubsidized employment
Retention in unsubsidized employment six months after entry into employment
Earnings change six months after entry into employment
Credential attainment Younger Youth (aged 14-18)
Attainment of secondary school diplomas and their recognized equivalents
Attainment of goals and skills
Retention in post-secondary education, advanced training, employment, military service or a qualified apprenticeship six months after program exit
All Programs
Customer satisfaction for individuals
Customer satisfaction for employers
25
In accordance with WIA, each of these measures is divided into sub-categories to track special populations and target groups. The aforementioned Adult and Dislocated Worker programs also provide three levels of service: Core, Intensive, and Training services. Reports must be compiled detailing each level of service, breaking out special populations, such as Veterans, Displaced Homemakers, and Individuals with Disabilities, Out-of-School Youth and Persons on Public Assistance.
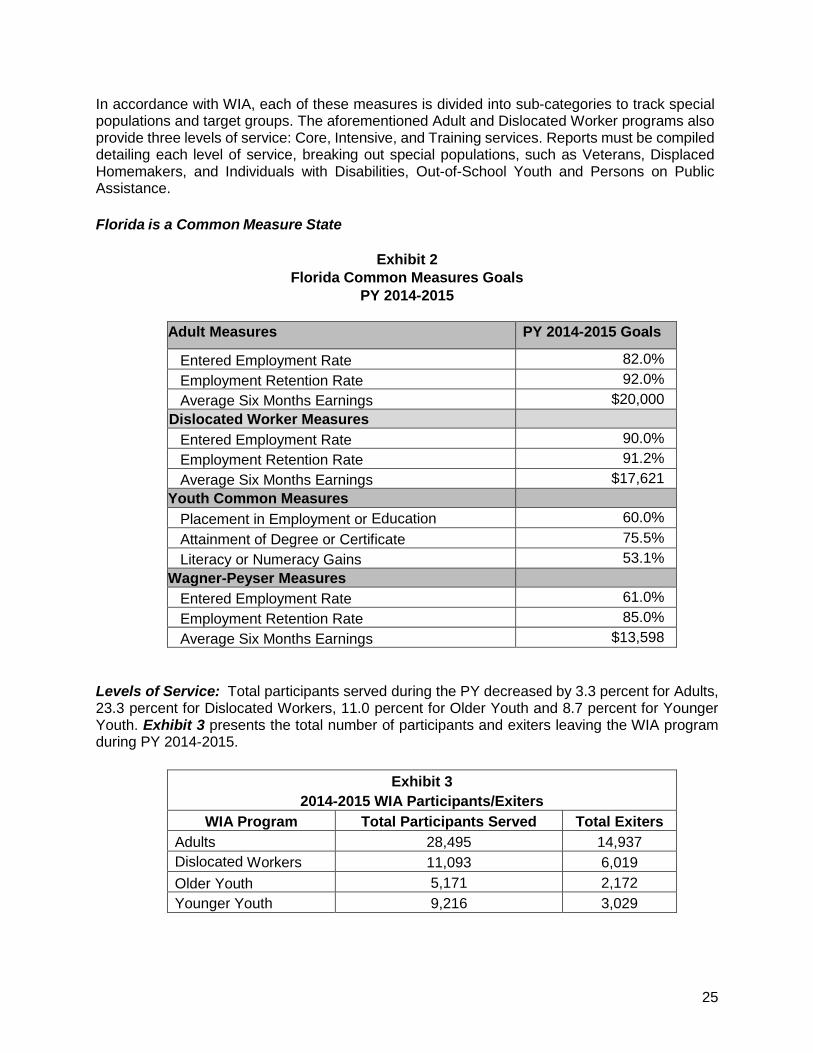
Florida is a Common Measure State
Exhibit 2
Florida Common Measures Goals
PY 2014-2015
Adult Measures PY 2014-2015 Goals
Entered Employment Rate 82.0%
Employment Retention Rate 92.0%
Average Six Months Earnings $20,000
Dislocated Worker Measures
Entered Employment Rate 90.0%
Employment Retention Rate 91.2%
Average Six Months Earnings $17,621
Youth Common Measures
Placement in Employment or Education 60.0%
Attainment of Degree or Certificate 75.5%
Literacy or Numeracy Gains 53.1%
Wagner-Peyser Measures
Entered Employment Rate 61.0%
Employment Retention Rate 85.0%
Average Six Months Earnings $13,598
Levels of Service: Total participants served during the PY decreased by 3.3 percent for Adults, 23.3 percent for Dislocated Workers, 11.0 percent for Older Youth and 8.7 percent for Younger Youth. Exhibit 3 presents the total number of participants and exiters leaving the WIA program during PY 2014-2015.
Exhibit 3
2014-2015 WIA Participants/Exiters
WIA Program Total Participants Served Total Exiters
Adults 28,495 14,937
Dislocated Workers 11,093 6,019
Older Youth 5,171 2,172
Younger Youth 9,216 3,029
26
Reporting Time Periods: Federal guidelines require varying time periods for reporting the counts of participants served, counts of those exiting programs, and performance outcomes for the nine WIA Common Core measures. The first reporting period is the April 1, 2013 to March 31, 2014 period (prior to the PY), used for the retention and average earnings measures. The second period is composed of the four quarters beginning October 1, 2013 and ending September 30, 2014 (prior to the PY), used for all entered employment measures, the youth placement in employment and education measure and the youth attainment of a degree or certificate measure. These delayed reporting periods are required so that follow-up data from RA Wage Reports can be collected on participants during the various outcomes measurement periods. The third reporting period is the period beginning April 1, 2014 to March 31, 2015, used for the counts of exiters. The final reporting period is the actual PY 2014-2015 (the four quarters beginning July 1, 2014 and ending June 30, 2015), used for the youth literacy and numeracy gains measure and the counts of participants served. WIA Performance Measures
Pursuant to WIA, all states submitting a state plan must propose expected levels of performance for each of the prescribed measures. As a result of a waiver granted to the state, beginning with PY 2008-2009, Florida only reports the level of performance relating to the nine WIA Common Measures. Performance on the remaining measures are still tracked; however, in accordance with the granted waiver, no proposed levels of performance are provided. Federal guidelines describe core measures and/or Common Measures as the key measures of success in achieving the legislative goals of WIA. The measures are used to:
Establish performance goals at the state and local level.
Ensure comparability of state performance results to maintain objectivity in measuring results for incentive and sanction determinations.
Provide information for system-wide reporting and evaluation for program improvement.
The proposed levels of performance are developed with the use of baseline data produced in accordance with federal instructions. As part of the state plan review process, the Secretary of USDOL and the Governor must negotiate an agreement on the levels of performance or goals for the Common Measures.
Data on core measures and Common Measures is collected from Florida’s Management Information System (MIS), RA Wage Records, and from the Wage Record Information System (WRIS). The MIS system gathers exit information on participants and covers the real-time data elements referenced above. RA Wage records contain information such as wage and retention information after exit. The WRIS system is a database consisting of several participating states’ records for wages and employment, etc. WRIS records supplement Florida’s RA data to provide a more complete picture of participant outcomes.
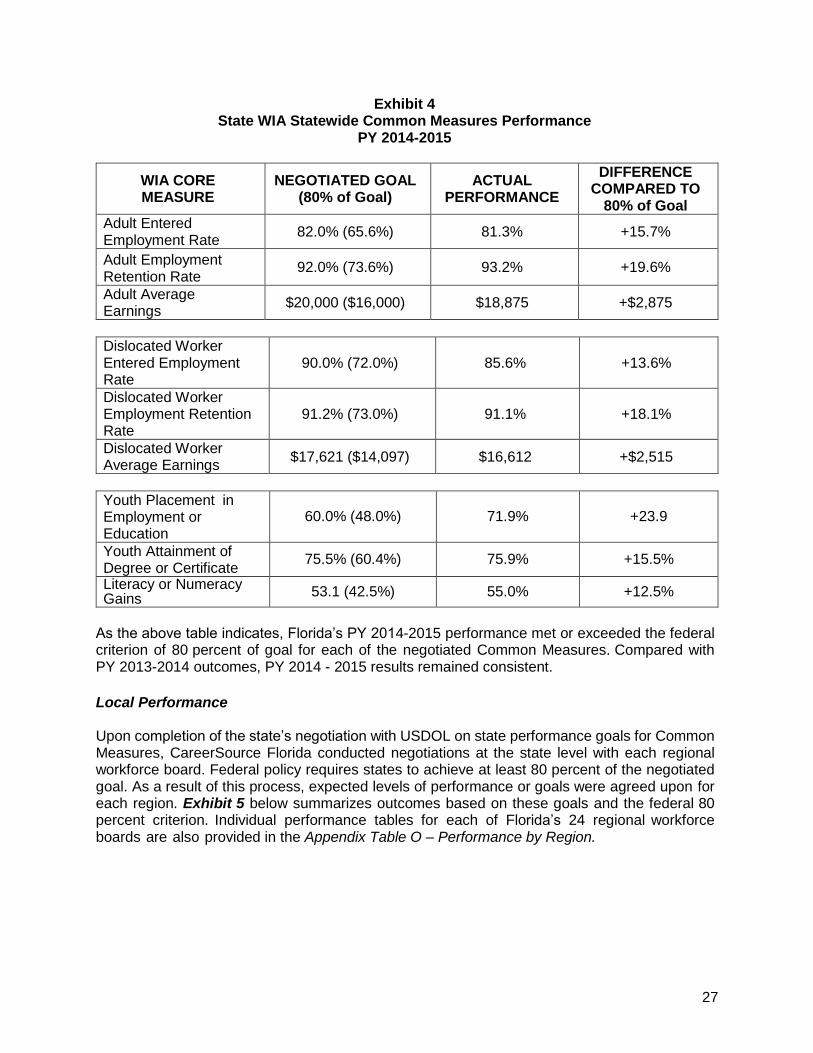
Exhibit 4 below displays Florida’s negotiated rate for each of the required Common Measures along with the actual statewide outcomes achieved. Pursuant to federal policy, states achieving at least 80 percent of the negotiated goal are considered to have met the goal. The 80 percent criterion is shown in parentheses.
27
Exhibit 4 State WIA Statewide Common Measures Performance
PY 2014-2015
WIA CORE MEASURE
NEGOTIATED GOAL (80% of Goal)
ACTUAL PERFORMANCE
DIFFERENCE COMPARED TO
80% of Goal
Adult Entered Employment Rate
82.0% (65.6%) 81.3% +15.7%
Adult Employment Retention Rate
92.0% (73.6%) 93.2% +19.6%
Adult Average Earnings
$20,000 ($16,000) $18,875 +$2,875
Dislocated Worker Entered Employment Rate
90.0% (72.0%) 85.6% +13.6%
Dislocated Worker Employment Retention Rate
91.2% (73.0%) 91.1% +18.1%
Dislocated Worker Average Earnings
$17,621 ($14,097) $16,612 +$2,515
Youth Placement in Employment or Education
60.0% (48.0%) 71.9% +23.9
Youth Attainment of Degree or Certificate
75.5% (60.4%) 75.9% +15.5%
Literacy or Numeracy Gains
53.1 (42.5%) 55.0% +12.5%
As the above table indicates, Florida’s PY 2014-2015 performance met or exceeded the federal criterion of 80 percent of goal for each of the negotiated Common Measures. Compared with PY 2013-2014 outcomes, PY 2014 - 2015 results remained consistent.
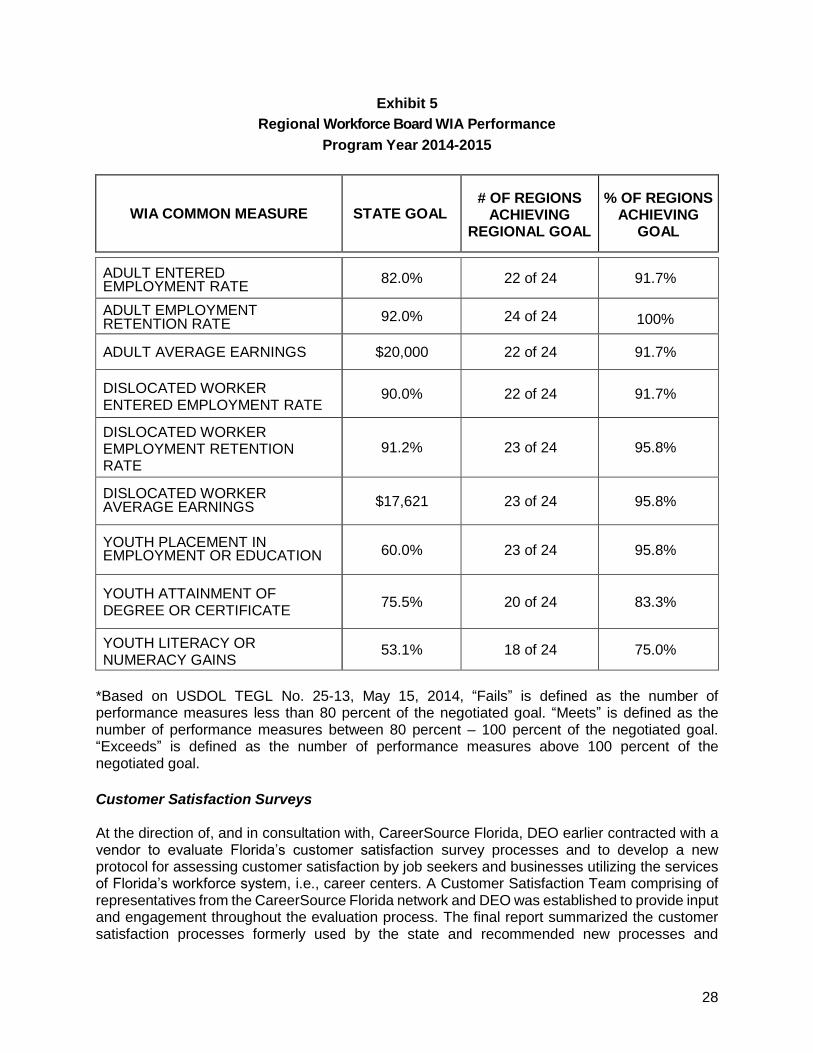
Local Performance Upon completion of the state’s negotiation with USDOL on state performance goals for Common Measures, CareerSource Florida conducted negotiations at the state level with each regional workforce board. Federal policy requires states to achieve at least 80 percent of the negotiated goal. As a result of this process, expected levels of performance or goals were agreed upon for each region. Exhibit 5 below summarizes outcomes based on these goals and the federal 80 percent criterion. Individual performance tables for each of Florida’s 24 regional workforce boards are also provided in the Appendix Table O – Performance by Region.
28
Exhibit 5
Regional Workforce Board WIA Performance
Program Year 2014-2015
WIA COMMON MEASURE STATE GOAL # OF REGIONS
ACHIEVING REGIONAL GOAL
% OF REGIONS ACHIEVING
GOAL
ADULT ENTERED EMPLOYMENT RATE
82.0% 22 of 24 91.7%
ADULT EMPLOYMENT RETENTION RATE
92.0% 24 of 24 100%
ADULT AVERAGE EARNINGS $20,000 22 of 24 91.7%
DISLOCATED WORKER ENTERED EMPLOYMENT RATE
90.0% 22 of 24 91.7%
DISLOCATED WORKER EMPLOYMENT RETENTION RATE
91.2% 23 of 24 95.8%
DISLOCATED WORKER AVERAGE EARNINGS $17,621 23 of 24 95.8%
YOUTH PLACEMENT IN EMPLOYMENT OR EDUCATION 60.0% 23 of 24 95.8%
YOUTH ATTAINMENT OF DEGREE OR CERTIFICATE
75.5% 20 of 24 83.3%
YOUTH LITERACY OR NUMERACY GAINS
53.1% 18 of 24 75.0%
*Based on USDOL TEGL No. 25-13, May 15, 2014, “Fails” is defined as the number of performance measures less than 80 percent of the negotiated goal. “Meets” is defined as the number of performance measures between 80 percent – 100 percent of the negotiated goal. “Exceeds” is defined as the number of performance measures above 100 percent of the negotiated goal.
Customer Satisfaction Surveys At the direction of, and in consultation with, CareerSource Florida, DEO earlier contracted with a vendor to evaluate Florida’s customer satisfaction survey processes and to develop a new protocol for assessing customer satisfaction by job seekers and businesses utilizing the services of Florida’s workforce system, i.e., career centers. A Customer Satisfaction Team comprising of representatives from the CareerSource Florida network and DEO was established to provide input and engagement throughout the evaluation process. The final report summarized the customer satisfaction processes formerly used by the state and recommended new processes and
29
methodologies to better refine and more accurately capture true customer satisfaction by job seekers and employers. Florida plans to further refine some of the recommended protocols and to design and implement a new customer satisfaction survey process to capture customer satisfaction metrics for those who use the workforce system. Florida plans to integrate customer satisfaction surveys as a component of its workforce management system, EFM. DEO will be working with the vendor to ensure its survey protocol, processes, and methodology meet the requirements outlined in TEGL 12-12. Customer satisfaction survey results will be invaluable to the state as it continues to identify and refine strategies that can be implemented to better serve its workforce services customers. STATE EVALUATION ACTIVITIES AND INCENTIVE POLICY Overall Description and Background Due to historical practices and state law mandates, Florida has long engaged in extensive program evaluation activities with a particular emphasis on results, outcomes, and longitudinal information. In the workforce realm, much of that evaluation activity has been based on many of the key elements mandated by WIA, including use of many of the same or similar measures, similar definitions and heavy reliance on use of RA wage records to verify initial job placement, job retention, and initial and long-term earnings over time. Florida Education and Training Placement Information Program (FETPIP) One of Florida’s earliest and most successful innovations in evaluation and performance tracking has been FETPIP, which was established in mid-1980 within DOE. This program was developed mainly to help evaluate the effectiveness of postsecondary education and training programs, particularly vocational education and similar career preparation programs. The scope of the groups to be tracked rapidly expanded to cover nearly all job training and placement programs including WIA, WP, Job Corps, Veterans, Welfare Transition (WT)/TANF, Supplemental Nutrition Assistance Program (SNAP), Apprenticeship, RA claimants, and ex-offenders. A total of nearly 600 groups or sub-cohorts are being tracked. FETPIP follow-up data is electronically derived from RA quarterly wage records, federal military and civilian personnel records, public assistance, incarceration/parole records, and continued education rosters. Access to this data allows for annual reports with extensive detail and longitudinal capabilities. Each group is typically tracked for at least two years with many tracked over much longer periods, including the “Class of 1991” composed of all graduates (and drop-outs) of high school, certificate programs, and all levels of higher education. Quarterly reports covering employment and public assistance status and outcomes are regularly run and analyzed. For more details on FETPIP, including examples of annual outcome reports, visit http://fldoe.org/accountability/fl-edu-training-placement-info-program/. FETPIP data is provided to regional workforce boards to enable them to evaluate the strength of training programs offered throughout the state. State Longitudinal Measures — “Tier Measures” The Florida Legislature mandated that CareerSource Florida develop uniform measures and standards to cover all job training, placement, career education, and other workforce programs
30
(see section 445.004(9), Florida Statutes). Tier 1 measures are broad outcome measures that can be applied to all workforce-related indicators, including entered employment, job retention, and earnings at various levels. Tier 2 measures are oriented to a logical grouping of programs and/or targeted populations and provide additional measures that are uniquely relevant to that group. These measures include continued education status for youth programs and reduction in public assistance dependency for TANF recipients and other low-income individuals. Tier 3 includes process/output measures including those mandated for federally funded programs. These measures also disaggregate the Tier 1 and 2 measures to sub-state breakouts, some of which are regionally adjusted. Examples of process measures would include caseloads for specific programs or first-payment time lapse data for RA. Disaggregated results would include the WIA performance of specific regional workforce boards or the number/percentage of youth who complete teen pregnancy prevention programs in a specific county or region. The nine measures performance is reported against include the following:
Total Individuals.
Initial employment or those who exited/completed workforce programs and were found employed expressed as a percentage of the total number of those exiting/completing programs.
Earnings or Wage Levels expressed as the percentage of those found employed at each of four full-time earnings or wage levels listed below.
Level 0 – those earning below a minimum quarterly wage of $4,123.
Level 1 – those earning at least minimum wage of $4,123 but less than $5,013 quarterly.
Level 2 – those earning at least $5,013 but less than $5,793 quarterly.
Level 3 – those earning $5,793 and greater quarterly.
Continued Employment expressed as a percentage of those found employed at follow-up the year following program exit or completion.
Initial Earnings expressed as the average quarterly amount earned for those found employed the year after program exit/completion.
Earnings Growth expressed as the amount of gain or loss in average quarterly earnings as compared to the average initial earnings.
Public Assistance or those who exited/completed workforce programs and were found to be receiving public assistance expressed as a percentage of the total number of those exiting/completing programs.
Continued Public Assistance expressed as a percentage of those found to be receiving public assistance the year after program exit/completion.
Continuing Education or those who exited/completed workforce programs and were found to be in any education or training program expressed as a percentage of the total number of those exiting/completing programs.
The Tier Measure Report is produced annually. Previous Tier Measure Reports can be reviewed as part of the CareerSource Florida Annual Reports by visiting careersourceflorida.com. Regional Performance Reviews Section 445.007(3), Florida Statutes, directs DEO, under CareerSource Florida’s direction, to meet annually with each regional workforce board to review performance and certify they are in compliance with state and federal laws.
31
During PY 2014-2015, DEO staff presented performance findings to each regional workforce board. The presentations included information on the region’s program and financial performance. The annual presentations provide a unique opportunity for dialogue with local board members and offer them a better understanding of state and federal performance requirements and their region’s performance outcomes. State Incentive Policy Florida law expressly calls for increased accountability for the workforce system for the state, localities, and training providers. Accordingly, the state has established a state incentive corrective action policy based on the direction of CareerSource Florida. This policy is aimed at continuous improvement and designed to cover all major programs under the state board’s oversight, including WIA, WP, and TANF. As a further policy matter, Florida’s incentive/corrections apply to both short-term, interim outcomes as revealed in our state quarterly reports based on administrative data, as well as the longer-term outcomes reported annually to USDOL (WIA & WP) and HHS (TANF) using RA (UC/UI) wage records. Certain other requirements imposed by state law are used as “threshold” qualifiers/disqualifiers. For example, regional workforce boards that do not achieve the state law requirement of the 50 percent rate of expenditures on ITAs and other training are automatically disqualified for all WIA Incentive Payments. During the annual budgeting process, CareerSource Florida may approve an incentive pool from state-level discretionary funds. The resulting pool combines short-term and long-term performance awards for each of the contributing funding sources. Regional workforce boards that have met the threshold qualifications related to expenditures on training, direct services, and out-of-school youth may become eligible for incentive awards. State Performance Improvement Plan (PIP) Policy Florida’s approach also provides for consequences in situations where there is a pattern of low performance. Typically, low-performing regional workforce boards are required to first develop and implement their own Corrective Action Plans. If low performance persists, state-level staff work with regional workforce board staff to design a state-approved PIP with specific deliverables, often supported by state and peer Technical Assistance and Training (TAT) and sometimes supplemental funding for specific interventions. Continued chronic performance and operational problems can result in progressive levels of direct, sustained on-site oversight by state staff or state-designated regional workforce board peer supervision, receivership, or replacement of local executive staff. As an ultimate sanction, a region may be re-designated or consolidated due to performance problems; to date, no region has been sanctioned in this manner. COST OF WORKFORCE INVESTMENT ACTIVITIES Expenditure Levels During PY 2014-2015, Florida had $243,179,003 in available funds including carry-forward from all WIA funding sources. Of this amount, $157,609,017, or approximately 65 percent, was expended to carry out state-level and regional activities. Of the $147,123,098 expended in formula funding by the state’s 24 regions, 93 percent went for direct client services. Of the $10,485,919 in funds expended on state-level funds activities, 96 percent was for direct client services.
32
State-Level Discretionary Funding The CareerSource Florida Board of Directors has dedicated Title I funding to state administration to induce, design, develop and fund innovative ITA pilots, demonstrations and special programs. Of these state-level funds, $3 million of state-level supplemental funding were reserved for the IWT program. Additionally, the CareerSource Florida Board directed funding for operating fiscal, compliance and management accountability systems, conducted workforce development research and evaluation and provided technical assistance and capacity building funding to enhance regional workforce boards. Cost of Program Activities Relative to Effect Florida tracks and evaluates the cost of program activities relative to effect in a number of ways. Cost per participant and cost per positive outcome are computed at the state and regional levels for the Adult, Dislocated Worker, and Youth programs. The positive outcome tracked for the Dislocated Worker program was entered employment. Positive outcomes for the Adult program included entered employment and the successful completion of program activities designed to assist employed workers in upgrading their employment in order to attain a greater degree of self-sufficiency. Florida has placed an emphasis on assisting the under-employed worker as well as helping workers avoid layoff. As a result, the number of Adult program exiters with positive outcomes included 15,969 employed workers who successfully completed program activities in order to upgrade their employment. Positive outcomes for Youth included entered employment, entrance into postsecondary education, advanced training, apprenticeship or the military, and the attainment of a diploma or a credential. Generally, outcomes were tracked for the exit periods used for the corresponding WIA performance measures. The exit period used for the Adult, Dislocated Worker and Youth programs was the period from October 1, 2013 to September 30, 2014. Cost information was also tracked by major level of activity: core services, intensive services, and training for the Adult and Dislocated Worker programs and for other services and training for the Youth programs. Florida also utilizes other means of gauging cost in relation to effect suggested by TEGL 7-15, including cost per exit, costs for in-school and out-of-school youth and ITA costs. These data are regularly used in evaluating regional performance. Statewide expenditure and cost data is displayed in Exhibit 6 below. Similar data for each of Florida’s 24 regional workforce boards are included in Appendix Tables 3 through 5.
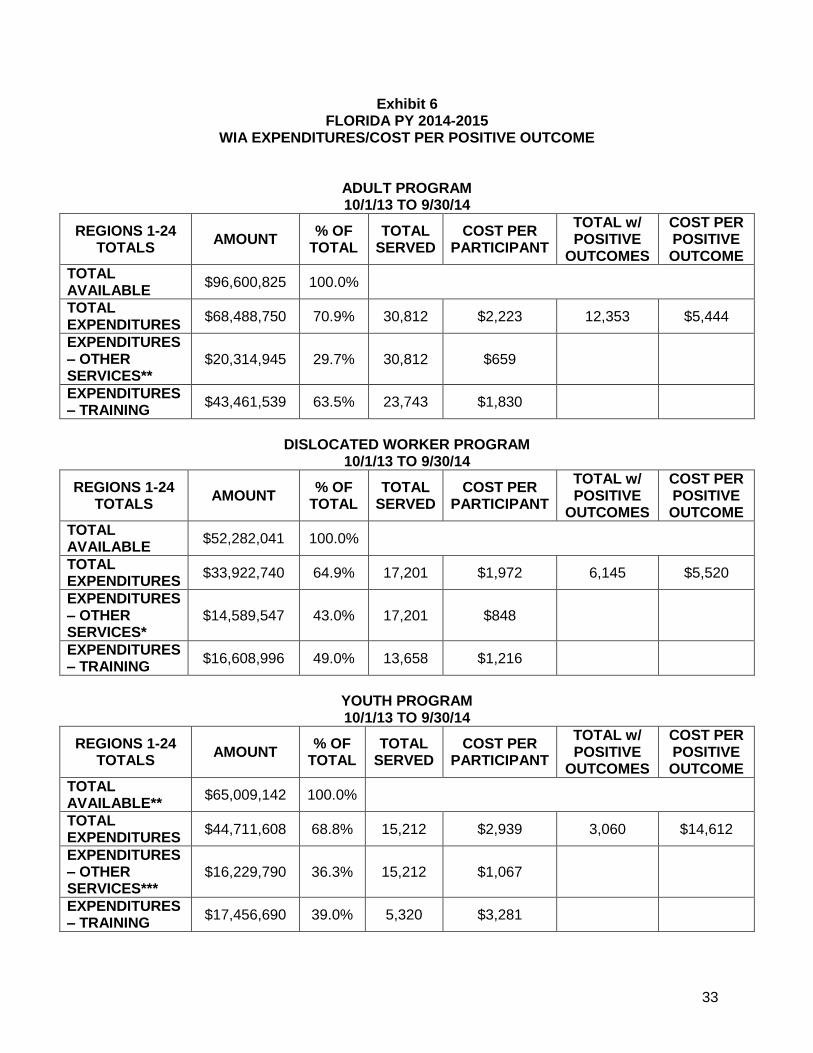
33
Exhibit 6 FLORIDA PY 2014-2015
WIA EXPENDITURES/COST PER POSITIVE OUTCOME
ADULT PROGRAM 10/1/13 TO 9/30/14
REGIONS 1-24 TOTALS
AMOUNT % OF
TOTAL TOTAL
SERVED COST PER
PARTICIPANT
TOTAL w/ POSITIVE
OUTCOMES
COST PER POSITIVE OUTCOME
TOTAL AVAILABLE
$96,600,825 100.0%
TOTAL EXPENDITURES
$68,488,750 70.9% 30,812 $2,223 12,353 $5,444
EXPENDITURES – OTHER SERVICES**
$20,314,945 29.7% 30,812 $659
EXPENDITURES – TRAINING
$43,461,539 63.5% 23,743 $1,830
DISLOCATED WORKER PROGRAM
10/1/13 TO 9/30/14
REGIONS 1-24 TOTALS
AMOUNT % OF
TOTAL TOTAL
SERVED COST PER
PARTICIPANT
TOTAL w/ POSITIVE
OUTCOMES
COST PER POSITIVE OUTCOME
TOTAL AVAILABLE
$52,282,041 100.0%
TOTAL EXPENDITURES
$33,922,740 64.9% 17,201 $1,972 6,145 $5,520
EXPENDITURES – OTHER SERVICES*
$14,589,547 43.0% 17,201 $848
EXPENDITURES – TRAINING
$16,608,996 49.0% 13,658 $1,216
YOUTH PROGRAM 10/1/13 TO 9/30/14
REGIONS 1-24 TOTALS
AMOUNT % OF
TOTAL TOTAL
SERVED COST PER
PARTICIPANT
TOTAL w/ POSITIVE
OUTCOMES
COST PER POSITIVE OUTCOME
TOTAL AVAILABLE**
$65,009,142 100.0%
TOTAL EXPENDITURES
$44,711,608 68.8% 15,212 $2,939 3,060 $14,612
EXPENDITURES – OTHER SERVICES***
$16,229,790 36.3% 15,212 $1,067
EXPENDITURES – TRAINING
$17,456,690 39.0% 5,320 $3,281
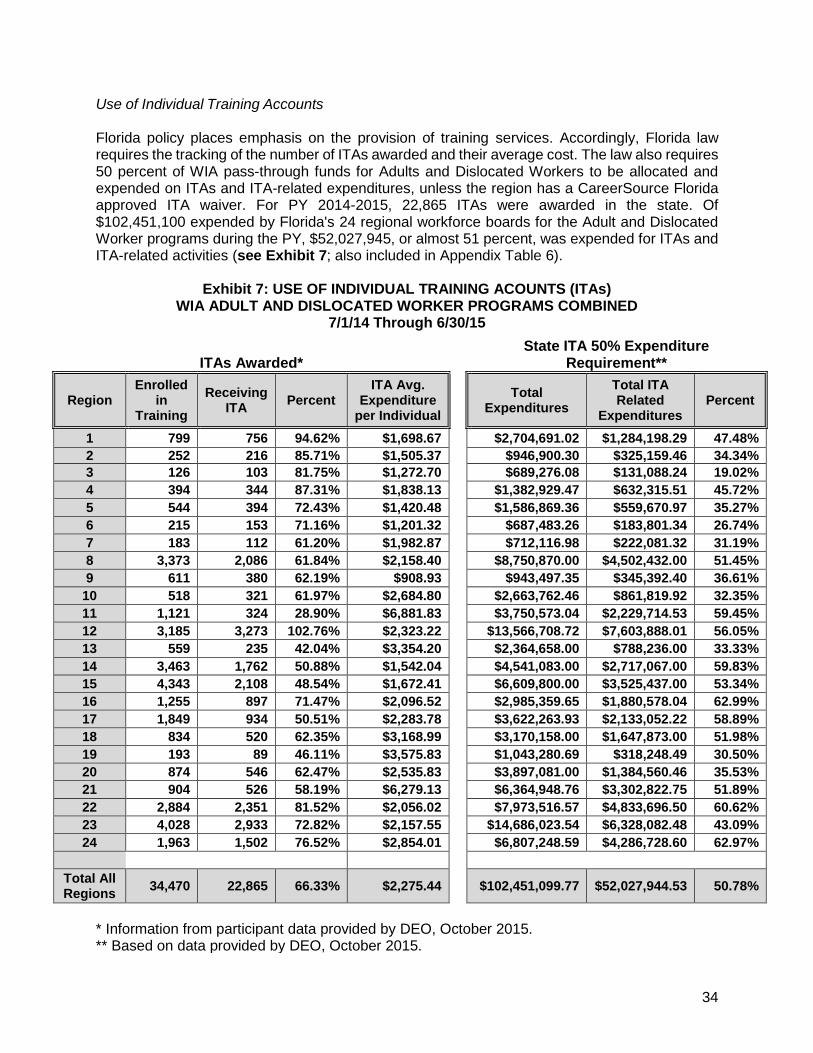
34
Use of Individual Training Accounts Florida policy places emphasis on the provision of training services. Accordingly, Florida law requires the tracking of the number of ITAs awarded and their average cost. The law also requires 50 percent of WIA pass-through funds for Adults and Dislocated Workers to be allocated and expended on ITAs and ITA-related expenditures, unless the region has a CareerSource Florida approved ITA waiver. For PY 2014-2015, 22,865 ITAs were awarded in the state. Of $102,451,100 expended by Florida's 24 regional workforce boards for the Adult and Dislocated Worker programs during the PY, $52,027,945, or almost 51 percent, was expended for ITAs and ITA-related activities (see Exhibit 7; also included in Appendix Table 6).
Exhibit 7: USE OF INDIVIDUAL TRAINING ACOUNTS (ITAs) WIA ADULT AND DISLOCATED WORKER PROGRAMS COMBINED
7/1/14 Through 6/30/15
ITAs Awarded* State ITA 50% Expenditure
Requirement**
Region Enrolled
in Training
Receiving ITA
Percent ITA Avg.
Expenditure per Individual
Total Expenditures
Total ITA Related
Expenditures Percent
1 799 756 94.62% $1,698.67 $2,704,691.02 $1,284,198.29 47.48%
2 252 216 85.71% $1,505.37 $946,900.30 $325,159.46 34.34%
3 126 103 81.75% $1,272.70 $689,276.08 $131,088.24 19.02%
4 394 344 87.31% $1,838.13 $1,382,929.47 $632,315.51 45.72%
5 544 394 72.43% $1,420.48 $1,586,869.36 $559,670.97 35.27%
6 215 153 71.16% $1,201.32 $687,483.26 $183,801.34 26.74%
7 183 112 61.20% $1,982.87 $712,116.98 $222,081.32 31.19%
8 3,373 2,086 61.84% $2,158.40 $8,750,870.00 $4,502,432.00 51.45%
9 611 380 62.19% $908.93 $943,497.35 $345,392.40 36.61%
10 518 321 61.97% $2,684.80 $2,663,762.46 $861,819.92 32.35%
11 1,121 324 28.90% $6,881.83 $3,750,573.04 $2,229,714.53 59.45%
12 3,185 3,273 102.76% $2,323.22 $13,566,708.72 $7,603,888.01 56.05%
13 559 235 42.04% $3,354.20 $2,364,658.00 $788,236.00 33.33%
14 3,463 1,762 50.88% $1,542.04 $4,541,083.00 $2,717,067.00 59.83%
15 4,343 2,108 48.54% $1,672.41 $6,609,800.00 $3,525,437.00 53.34%
16 1,255 897 71.47% $2,096.52 $2,985,359.65 $1,880,578.04 62.99%
17 1,849 934 50.51% $2,283.78 $3,622,263.93 $2,133,052.22 58.89%
18 834 520 62.35% $3,168.99 $3,170,158.00 $1,647,873.00 51.98%
19 193 89 46.11% $3,575.83 $1,043,280.69 $318,248.49 30.50%
20 874 546 62.47% $2,535.83 $3,897,081.00 $1,384,560.46 35.53%
21 904 526 58.19% $6,279.13 $6,364,948.76 $3,302,822.75 51.89%
22 2,884 2,351 81.52% $2,056.02 $7,973,516.57 $4,833,696.50 60.62%
23 4,028 2,933 72.82% $2,157.55 $14,686,023.54 $6,328,082.48 43.09%
24 1,963 1,502 76.52% $2,854.01 $6,807,248.59 $4,286,728.60 62.97%
Total All Regions
34,470 22,865 66.33% $2,275.44 $102,451,099.77 $52,027,944.53 50.78%
* Information from participant data provided by DEO, October 2015. ** Based on data provided by DEO, October 2015.
35
Federal Waivers Florida continues to take full advantage of the flexibility provisions in WIA for waivers. Florida has requested and received USDOL approval for several waivers, as listed below, that were in effect during the PY 2014-2015 and remain in effect. These waivers include: A waiver of the limitation at WIA Section 133(b)(4) to permit 75 percent transfer of funds between the Adult and Dislocated Worker funding streams.
In previous years, local boards have experienced much higher demands for training and support services from Adults than from Dislocated Workers due to Florida’s shifting demographics and economic situation. Under these circumstances, this waiver provided regional workforce boards greater flexibility in allocating and expending Adult and Dislocated Worker funds to meet changing local conditions and has, since its 2002 approval, been extensively used. Generally, in the past as the unemployment rate in the state was below the national average, it was used to meet the much higher demand for Adult training (ITAs). It allowed local boards the flexibility to maximize the use of funds for training Adults while still meeting the needs of Dislocated Workers. Other local boards see more people who meet the Adult criteria, and less that meet Dislocated Worker criteria, wanting to attend school or training. This waiver allows local areas to respond to varying, economically induced challenges while also meeting the demands of Dislocated Workers who may face other unique circumstances.
A waiver of provisions of WIA Sections 136(b)(1 and 2) and 20 CFR 666.100(a) and 20 CFR 666.300(a) to allow the state to replace for federal reporting purposes the WIA core measures with the common measures delineated in TEGL 17-05.
This waiver has allowed Florida to continue to remove the inconsistencies and complexities inherent in the current WIA performance reporting requirements. It has allowed the state to continue to effectively align accountability across all programs within the state’s workforce system. The common measures more effectively support the state’s goals of promoting on the job training (OJT) and customized training for Adult workers including employed workers. The common measures also have more clearly targeted out-of-school youth and youth most in need as identified by the USDOLs Youth Vision Statement.
A waiver of the 50 percent employer contribution for customized training at WIA Section 101(8)(C).
This waiver permits using a sliding-scale match, allowing no less than a 10 percent match for employers with 50 or fewer employees and no less than a 25 percent match for employers with 51-250 employees. For employers with more than 250 employees, the statutory 50 percent contribution applies. As with the above-referenced OJT waiver, this sliding scale has created the necessary flexibility for small employers to provide a required match more reasonably suited to their size. This has resulted in the increased participation of small businesses in customized training programs.
A waiver of WIA Section 101(31)(B) to increase the employer reimbursement for OJT.
Under this waiver, reimbursement amounts of up to 90 percent for employers with 50 or fewer employees and up to 75 percent for employers with 51-250 employees are permitted. For employers with more than 250 employees, the statutory 50 percent limit applies. This has enabled the state to more effectively market WIA funded OJT to support
36
job creation in that sector of the employer community that supports the overwhelming majority of the state’s jobs as it allows the small employer to be reimbursed at a level more reasonably suited to their size.
Waivers of the language that limits the authority to provide the activities in WIA Section 134 to the state to allow 20 percent of local Dislocated Worker formula funds and 20 percent of state-level rapid response funds to be expended on IWT.
This waiver provides regional workforce boards and CareerSource Florida the opportunity to effectively avert potential layoffs by providing IWT activities with a demand-driven, business focus. As global competition requires companies to adapt to survive and change in a changing environment, training can provide technical skills of workers at risk of layoff, thus stabilizing affected companies.
A waiver of 20 CFR 667.300 to minimize participant data capture requirements for IWT programs operated with local WIA funds.
This waiver allows the state to streamline the data capture requirements to ensure that employers are not unnecessarily burdened with federal data requirements. Thus, the use of the waiver has strengthened the ability of regional workforce boards to coordinate workforce investment activities with economic development strategies and develop employer linkages. One of the primary reasons that regional workforce boards provide IWT or Employed Worker Training is to improve their regional economies by upgrading the skills of their existing workforce, enabling both the employer and the individual worker to improve their competitiveness. Additionally, as workers improve their skills and climb the career ladder, it enables the local boards to backfill those vacancies. Thus, the program builds employer usage and satisfaction of the public workforce system.
A waiver of 20 CFR 664.510 to allow the use of ITAs for WIA older and/or out of school youth without requiring dual enrollment as WIA Adults.
The waiver has afforded older youth the ability to pursue their occupational goals without the additional barrier of having to meet Adult or Dislocated Worker eligibility requirements. The waiver has also eliminated the duplication of paperwork for enrolling older youth appropriately served with Youth funds into the Adult programs and benefits training providers as they no longer have to follow two separate processes to provide services to Adult/Dislocated Workers and Older Workers/Youth. It has also allowed local boards to improve their expenditures on out-of-school youth and meet the federal mandate to expend 30 percent of youth funds for this population. Regional workforce boards also have had greater flexibility in delivering services based on the individual needs of participants as intended under WIA.
A waiver of 20 CFR 662.240(b)(10) to allow career center staff funded by WIA or WP funds to perform participant intake and eligibility determination for other supportive workforce programs such as TANF, SNAP, and Medicaid Programs.
Florida operates a totally integrated service delivery system and is an access point for the state’s DCF. DEO also is the prime workforce provider for the state’s TANF program. Customers come into local career centers for a variety of workforce services. This waiver addresses one of the primary barriers faced by the staff of the key partner programs that are integrated in the state’s career centers managed by a single career center operator. It allows the state to consider intake and eligibility services for a program such as TANF and relieves the burden from the career center operator of having to collect customer data each time an individual is served in order to meet federal cost allocation principles.
37
Tracking and recording those costs create additional administrative costs to the program and trying to negotiate the funding from the other agencies/partners is problematic. Conducting a common intake that can determine their initial eligibility for those services is a benefit to our customers. Career center customers benefit from an increased level of services available at the career centers as they do not have to expend extra time and effort to go to other non-WIA and WP-funded staff for intake and eligibility determination for their enrollment in other supportive workforce programs such as TANF, cash assistance, or food stamps. The waiver also increases the number of individuals coming into the career centers, thus increasing the number of individuals who can benefit from the workforce services offered. The integrated approach facilitated by this waiver continues to result in increased numbers of low-income individuals being served.
WORKFORCE INVESTMENT ACT PROGRAMS AND INITIATIVES The state’s seamless and fully integrated service delivery system ensures availability of all workforce services to WIA customers with a focus on targeted populations such as veterans, military spouses, individuals with disabilities, youth aging out of foster care, out-of-school youth, children of incarcerated parents, Native American youth, MSFWs, older workers, Dislocated Workers, low-income workers, displaced homemakers, and others. More than 22,029 Adults and Dislocated Workers were placed into training through the use of local WIA formula funds over the most recent year. Additionally, Adults and Dislocated Workers were placed into training through the use of state-level WIA funds designated for special project initiatives. Nearly 7,500 individuals received training through the QRT grant program and more than 7,100 received training through the IWT grant program. State oversight functions include identifying needs for improvement and providing training and technical assistance to regional workforce boards. Newly hired front-line staff members are required to attain Tier I certification, which consists of an overview and understanding of the workforce system, within six months of their hire date. They are also required to complete 15 hours of continuing education annually. DEOs training unit is currently developing an online Job Search Training curriculum for SNAP Employment & Training (E&T) program participants. Communication mechanisms are in place to assess ongoing training and technical assistance needs of regional workforce boards and staff. To address identified needs, DEO has posted to its website a comprehensive and evolving series of program and policy trainings complete with voiceover. The workforce system has increased access and services for eligible Adults and Dislocated Workers. The following projects were either partially or fully funded with WIA funds during the PY 2014-2015:
Regional Performance Incentive Funds. These funds were distributed to the regional workforce boards in accordance with the approved CareerSource Florida performance incentive policy.
Strategic Plan Implementation such as:
Customer Relationship Management Solution
Florida Workforce Scorecard Initiative
38
Talent Development
Enhancing Business Engagement Process Toolkit
Business Development Process Services
Strategic Initiatives such as:
Advanced Manufacturing Excellence
Healthcare Marketplace Business Intelligence Research
Emerging Initiatives such as:
WIOA Organizational Bridge Plan Development
WIOA Implementation
Regional Economic Modeling
Miscellaneous projects such as:
Regional Innovation Funds
AmeriCorps
DJJ Youthful Offender Project
Rural Initiatives
High Demand Specialized Training Programs Labor Market Information The Labor Market Information Program: DEOs LMS Bureau produces, analyzes, and distributes labor statistics to improve economic decision-making. DEOs role is to support the data needs of state and regional data users in workforce, economic development, and education. The following items highlight the accomplishments of LMS during FY 2014-2015:
Produced Labor Statistics: Produced labor force, employment, unemployment, unemployment rates, employment and wages by industry and occupation, employment projections by industry and occupation, and distributed Census data.
Produced Statewide and Regional Occupational Supply/Demand (S/D) Reports: Produced quarterly occupational S/D reports to assist workforce and education in aligning training with the hiring needs of business. Over the past year, the S/D system has been released to workforce and higher education professionals. Staff at each CareerSource regional location was provided training and access to the system for integrated use in their current planning process. Additional development is being done to provide a public facing system that includes interactive reports focused on the career planning needs of jobseekers, parents, and students. The system uses real-time demand data from the Conference Board for short-term demand analysis and DEO projections of annual average occupational openings for long-term demand analysis. On the supply side, the system includes all sources of education data including public and private sources of enrollees and completers/graduates, in addition to job seekers registered at career centers.
DEO has trained the Provosts from Florida’s University and College Systems on how to determine jobs in demand. When these institutions consider new programs they must determine need related to the job market. The S/D system has been particularly useful for Economic Development in helping to determine available labor supply to support business recruitment.
Prepared Analysis of Potential Economic Impacts: Produced several custom economic impact studies of requested industry clusters, including aerospace, manufacturing, transportation and warehousing, and other industries. These studies focused on impacts on employment, labor income, value added, and output.
39
Prepared Labor Supply Studies: Produced labor supply studies and labor cost analysis to assist economic development efforts in the recruitment of businesses in manufacturing, aircraft manufacturing, transportation, commercial bakery, call center, food processing manufacturing, aviation and aerospace manufacturing, amusement and recreation, and professional and business services.
Produced Employment Projections and Demand Lists for Jobs Requiring Associate’s, Bachelor’s, and Master’s Degrees: Produced statewide short-term employment projections to 2016 for the USDOL, Employment and Training Administration’s Workforce Information Grant and long-term employment projections to 2023 for state workforce planning. These projections were used as a critical input to produce the Statewide Demand List for jobs requiring associate’s degrees, bachelor’s degrees, and master’s and above degrees.
Produced the Regional Demand Occupations Lists: Produced the 2022 occupational employment projections database for DEOs Regional Demand Occupations List. With the end of the formal review and approval of the Targeted Occupations Lists (TOL) process, workforce partners still needed data to assist with planning. To assist with the transition, LMS posted Excel files on the website matching the data extracts of the TOL. Work on the 2015-2023 projections commenced with the building and reviewing of industry databases for the next round of projections. Model selection for this round started in early 2015 and was finished for state and regional industry projections.
Prepared Special Reports: Prepared numerous special reports on employment and unemployment; wage and income data, occupations and industries, demographic characteristics, educational attainment, industry certification, commuting, state comparisons, maritime occupations, experimental small area time series by industry by county, employment reports for science, technology, engineering, and mathematics (STEM), analysis reports on the overall job market, Help Wanted OnLine special reports, including STEM, wages for all regions, and employment projections.
Prepared Maps for Analysis: Special order maps included unemployment rates, commuters and residents for several counties, mile-radius commuting maps, employment density for selected industries, custom density maps for local economic development (selected industries), business locations in Enterprise Zones and Urban Job Tax Credit areas, and small businesses for Enterprise Florida, Inc.
Prepared Occupational Employment and Wage Data: Prepared and released the final 2022 occupational employment for Florida, large counties, and each of the regional workforce boards. Also released the base year 2014 wage estimates for Florida and all metro areas. The wage data were indexed to the first quarter of 2015 using Employment Cost Index (as of June 30). Wage data are re-indexed each quarter.
Produced Industry Profile Reports: Produced detailed analyses of Florida’s leading industry clusters including aviation and aerospace, life sciences, financial and professional services, information technology, logistics and distribution, and manufacturing.
Responded to Requests for Information: Provided information for over 1.3 million customers via mail, phone, email, and the website. Of these, 9,479 requests were handled with individual customers as custom reports or data consultations.
Distributed Publications Statewide: Distributed almost 98,000 LMS printed publications and printable publications to regional workforce boards, career centers, schools, school districts throughout the state, and other customers.
Distributed Labor Market Statistics Data Electronically: LMS deploys the Florida Research and Economic Information Database Application (FREIDA), What People Are Asking (WPAA), in addition to the LMS website, Florida Wages (the Estimates Delivery System), Regional Demand Occupations Lists (RDOLs), and the Quarterly Workforce
40
Indicators as major delivery vehicles for on-line uses. Total website page views and downloads were over 1,300,000 in FY 2014-2015. Website activity now comprises the majority of data and publications provided to customers and partners.
Maintained an Occupational Licensing Database: LMS maintained a publicly-accessible database of all required occupational licenses in Florida, collating data from 12 different state agencies covering 219 occupational licenses that cross over to 306 different occupations.
The LMS Center has developed a number of goals for FY 2015-2016 designed to improve data availability and services to the extent possible. They are highlighted below.
Work with the U.S. Bureau of Labor Statistics Policy Councils to improve federal/state statistical procedures to improve data quality.
Expand GIS mapping capabilities and economic impact analysis to support workforce, economic development, and emergency management.
Continue to improve Internet data delivery by providing easier and more complete access.
Provide public access to the Occupational Supply/Demand System.
Improve local area data profiles to meet customers’ needs.
Increase the efficiency of processing monthly state and local area data release. Rapid Response Funding for Regional Workforce Boards WIA requires that up to 25 percent of the state’s annual Dislocated Worker allocation be used for rapid response activities to respond to major layoffs and emergency situations. Pursuant to the state’s Workforce Innovation Act of 2000, the expenditure of these Rapid Response funds is to be carried out in accordance with approved CareerSource Florida board policies by DEO under contract with CareerSource Florida. At the beginning of each PY, USDOL awards the state an allocation in Dislocated Worker funds. The state-approved allocation for Rapid Response/Dislocated Worker assistance consists of funds budgeted for the State Dislocated Worker Unit activities with a balance set aside as emergency reserve. Reemployment and Emergency Assistance Coordination Team (REACT): REACT serves as Florida's state-level Dislocated Worker Unit, as required by WIA. When employers submit layoff and business closing notices under the Worker Adjustment and Retraining Notification (WARN) Act, DEO staff reviews each notice for completeness. The employer is contacted when additional information is needed, such as the name and telephone number of the employer’s local contact person at each location, the type of business issuing the WARN, the worker residences by county, the reason for the layoff or business closing, and the possible applicability of the Trade Act. DEO staff then enters the WARN notice into the REACT database and distributes the WARN and the background information to the executive director of the affected regional workforce board, the regional rapid response coordinator, and other appropriate workforce partners. State-level REACT and workforce development board rapid response activities are carried out in accordance with WIA regulations at CFR 665.300 through 665.340.
Regional workforce boards are required to make Rapid Response services available when possible to any employer requesting Rapid Response. Routinely, Rapid Response visits are made to employers laying off 50 or more workers. When a layoff is smaller than 50 workers, the affected workers can be directed to the nearest career center for services.
41
Rapid Response services must be made available to affected workers when a Trade Act petition is filed.
Regional workforce boards receive a copy of all WARN notices received by the state.
Regional workforce boards are expected to submit a monthly report on Rapid Response activities to the state office.
In support of Rapid Response activities, DEO has a Mobile Career Center it can deploy across the state to respond to layoffs and participate in job fairs. The Mobile Career Center offers a full array of employment, reemployment, and employer services. It contains nine computer workstations and a training room that can accommodate eight additional computer stations. Internet access is available for filing RA claims and searching EFM and other job banks. When the regional workforce boards’ staff members have a need for the DEO Mobile Career Center, REACT staff schedules the vehicle, has the unit delivered to and from the site, sets it up for use, manages the unit during the visit, and secures it overnight. Examples of services provided by the regional workforce boards and their local career center service providers include:
Presentations to employers showing the advantages of working with regional workforce boards.
Presentations to affected workers explaining workforce services.
Assistance to workers in filing RA claims.
Direct job referral and placement services.
Providing information on maintaining health insurance and other separation issues.
Arranging job fairs and other special employment events.
Referral to community agencies for supportive services.
Providing information on training opportunities. State REACT staff initiated services for 94 dislocation events generated by WARN notices this PY, identifying 12,010 eligible Dislocated Workers. State-level Rapid Response expenditures are included in Appendix Table 7. DEO plans to continue to coordinate with the regional workforce boards on Rapid Response activities and to provide technical assistance and staff support to any regions needing such assistance. DEO also plans to:
Continue to work with employers by sharing information about the services of regional workforce boards.
Continue statewide promotion of workforce services by DEO External Affairs.
Promote the Short-Time Compensation program to encourage employers to avoid layoffs.
Continue to provide the use of the Mobile Career Center to assist with plant layoffs and dislocations, especially in rural communities.
Youth Programs and Initiatives Workforce Investment Act (WIA) Program Youth: The WIA of 1998 rewrote federal statutes governing programs of job training, adult education and literacy, and vocational rehabilitation. The law mandates the use of One-Stop Operating Systems. WIA is designed to streamline and eliminate duplication of services and empower individuals to obtain the services and the skills
42
they want and need. The law provided regional workforce boards more flexibility to operate their programs while also requiring accountability. The goals of WIA are to (1) improve the quality of the workforce, (2) enhance the productivity and competitiveness of the nation, and (3) reduce welfare dependency. The Florida Legislature addressed many of these goals with the passage of the state’s Workforce Innovation Act of 2000. WIA defines “youth” as individuals from 14 years to 21 years of age, who are low income and face one or more of the statutory barriers. Youth who fall between the ages of 18 and 21 years may receive services as a Youth or Adult or both at the same time. A lack of basic skills is the most common employment barrier for young people accessing services. Additionally, youth deal with issues such as lack of transportation, childcare, unstable housing, and the need for work supplies and other basic necessities. The state’s seamless and fully integrated service delivery system is designed to improve the availability of all workforce services to its WIA Youth customers and focuses on targeted populations such as youth aging out of foster care, youth in and out of school, children of incarcerated parents, youth veterans, homeless youth, migrant youth, youth with disabilities, juvenile offenders, and others. Examples of program activities promoting youth development include postsecondary education, industry recognized training, life skills instruction, work readiness training, tutoring, mentoring, support services, and work experiences. Local areas have extensive experience working with disadvantaged youth and recognize the need for support services that assist youth in overcoming obstacles through their Youth Councils. Youth Council members are uniquely qualified to help the workforce system confront the serious barriers that prevent our youth clients from participating in activities authorized under WIA. WIA Youth programs link closely to local labor market needs, community services, and academic and occupational learning. Recruiting businesses is another challenge local areas face when seeking job training opportunities for youth. Through WIA, paid or unpaid work experiences are available. Employers must be flexible in working with youth who have barriers to employment and must be willing to act as job mentors. Finding quality worksites result in a greater chance for work experiences that may lead to unsubsidized employment opportunities. From July 1, 2014 – June 30, 2015, 14,387 youth were served through the use of local WIA Youth funds. DEO, working in conjunction with CareerSource Florida, continues to provide training and technical assistance to regional workforce board staff and partners in order to meet performance goals. DEO also provides assessment of workforce initiatives and projects to improve overall state workforce development services. With the goal of increasing WIA Youth performance, the state encourages local areas to focus on the following program elements:
Improve participants’ employability skills through work readiness training.
Work with the private sector and public sector to provide more work experience opportunities for economically disadvantaged and disconnected youth.
Strengthen activities that transition youth from subsidized work experiences into unsubsidized employment, educational pathways, occupational skills training, or co-enrollment into WIA Adult services.
43
Other WIA Youth program strategies include:
Leveraging funding resources.
Focusing on older and out-of-school youth.
Improving eligibility processes.
Identifying quality worksites for youth.
Ensuring job matching in high growth occupations (green jobs, healthcare, etc.).
Educating employers about tax incentives to hire youth. The state continuously responds to these issues through its ongoing assessment of state and local projects to ensure continued service improvements, increased performance, and replication of successful program designs. Reemployment Services Reemployment Services: Reemployment services in Florida are fully integrated into career centers along with all WP services, WIA services, the Trade Adjustment Assistance Program (TAA), SNAP, and WT/TANF. The purpose of Florida’s Reemployment Services’ Program is to provide claimants with appropriate work readiness tools to facilitate their return to stable employment. Reemployment services include the Priority Re-Employment Planning Program (PREP), Reemployment and Eligibility Assessment (REA) Program, and WP/Labor Exchange. Reemployment services are integrated into the career centers’ service delivery.
PREP: Claimants are identified for reemployment service programs once they are in the fourth week of their claim and have received their first payment. A regularly scheduled file transfer from Florida’s Online RA System to EFM transmits RA claimant information so career centers can schedule appointments for RA claimants to come into the centers for workforce services. A statistical methodology is used to select claimants who are most likely to exhaust their benefits. The goal of PREP is to shorten the RA benefit duration by providing claimants with job readiness tools to secure stable employment. This is accomplished by providing them with information on available workforce services and by involving them in scheduled workforce activities, training opportunities, etc. through their local career center.
REA Program: Florida was selected as one of the original pilot states to receive grant funding for the REA Program. This past year, 19 of Florida’s 24 regional workforce boards participated in the program. REA participants are profiled and selected weekly from each participating region’s pool of RA claimants. Participants are placed into pre-existing events managed by career center staff and scheduled for a one-on-one assessment interview. The assessment interview includes:
Orientation about the career center’s services, with particular emphasis on accessing available career information.
Initial assessment to review the participant’s strengths, weaknesses, and barriers.
Provision of labor market information.
Development of an employability plan.
Scheduling appropriate work search activities for the participant.
Referral to employment and training opportunities when appropriate.
44
Reemployment Services and WP/Labor Exchange System: Claimants are automatically registered as job seekers in EFM within 24 hours of filing for RA. EFMs skills matching functionality generates an initial listing of current jobs in the system for individual claimants based on the employment information entered into the system when their claim was filed. This process generates an automatic email to the claimant that informs the claimant of their EFM login information, provides a link to the initial list of jobs matched to their employment history, and provides the link for them to complete a full résumé and begin active use of the system to search and apply for jobs. This information is immediately available to staff and to employers who are searching for candidates based on the skills needed to fill a job opening. Each career center offers RA claimants work search tools and other services.
Florida’s program has again proven successful in facilitating early intervention for new claimants. For example, claimants exiting the system during PY 2014 – 2015 had an Entered Employment Rate (EER) of 65 percent compared to those exiting the system during PY 2013 – 2014 who had an EER of 61 percent. All WP participants exiting the system during PY 2014 – 2015 had an EER of 64 percent, while WP participants exiting the system during PY 2013 – 2014 had an EER of 60 percent. The state’s RA System integrates RA and workforce data, thereby providing more streamlined processes and innovative opportunities for better ways to serve RA claimants. National Emergency Grant (NEG) DEO has been awarded several NEGs from USDOL that provide resources to the state and regional workforce boards for reemployment services and training services to assist impacted workers. They include: Dislocated Worker Training (DWT) NEG: Florida was awarded $1,437,743 for the period of June 26, 2013 through September 30, 2016 for the DWT NEG, which expands the use of training to meet the needs of Dislocated Workers, especially the long-term unemployed and RA recipients who have been profiled as likely to exhaust their benefits. Ten regional workforce boards are participating in this NEG – 4, 9, 10, 11, 14, 15, 16, 18, 21, and 2 – and, as of June 30, 2015, they have enrolled 313 participants in the program, of which 185 enrolled in OJT and 254 enrolled in training. Of those enrolled, 192 have exited, with 179 employed at exit, and 154 of those employed at exit participated in training activities. Tropical Storm (TS) Debby NEG: This NEG was first awarded on October 1, 2012 to address clean-up work in Franklin County needed as a result of TS Debby. CareerSource Gulf Coast is the only participating region. The initial award for temporary jobs was $256,953. An additional $2,699,712 was awarded to place 200 dislocated oystermen into temporary jobs helping to re-shell Apalachicola Bay, which sustained damage from the storm. The grant period was later extended to June 30, 2016 and a supplemental award of $2,131,425 was approved to provide workforce training for the oystermen who participated in and completed the re-shelling component of the project. The total award for this grant now is $4,548,125. During the temporary jobs component of the grant through March 31, 2014, 230 participants were served. The training component of the grant is now underway and, to date, 24 participants have been enrolled.
45
Job-Driven (JD) NEG: Florida was awarded $6,173,875 to address long-term unemployment by facilitating continued employer engagement to identify workforce demands by focusing on efficient job coaching and job matching that effectively assists participants from assessment through employment and follow-up activities. Based on those comprehensive efforts, JD NEG participants will be provided with the appropriate mix of services to get a job in a high-growth sector, including career assessments, intensive services, occupational skills training, work-based training, OJT, and customized training. Regions 2, 3, 5, 9, 11, 13, 14, 15, 17, and 22 are participating in this grant. As of June 30, 2015, 438 participants had been enrolled – 145 enrolled in training, 102 exited, and 100 employed at exit. Sector Partnership (SP) NEG: On June 17, 2015, Florida was notified it would receive $6,998,765 to build on existing sector partnership programs at the state and local level that target the Advanced Manufacturing and Healthcare sectors. This grant will be operated under the direction of CareerSource Florida and administered by DEO. The ten local boards who will participate in the grant are regions 6, 8, 10, 12, 13, 14, 15, 16, 21, and 22. Veterans’ Programs and Initiatives Disabled Veterans' Outreach Program (DVOP) and Local Veterans' Employment Representative (LVER) Program: USDOL Veterans' Employment and Training Service (VETS) awards Jobs for Veterans’ Act grant funds to DEO to support the funding of DVOP and LVER staff and associated support expenses. DVOP and LVER staff members are assigned to Florida's career centers. DVOPs, LVERs and all career center staff are tasked with providing priority of workforce services to veterans, especially veterans with barriers to employment, and employers on behalf of veterans. In FY 2014-2015, DEO was awarded approximately $11.4 million to support 108 DVOPs and 52 LVERs. One percent of Florida’s total FY 2014-2015 Jobs for Veterans State Grant (JVSG) award, or $113,000, was designated for performance incentive awards to recognize career centers that provide exceptional services to Florida’s veterans. LVER staff members are responsible for the functional oversight of the local career center Veterans' Program, ensuring all staff members in the career centers provide mandated priority services for veterans. They also conduct outreach to employers to develop jobs for veterans, conduct seminars for employer organizations and trade associations. DVOP specialists focus on staff-assisted intensive services to meet the needs of veterans with significant barriers to employment, e.g., disabled veterans, homeless veterans, etc. using the case management approach to deliver services. DVOPs also coordinate with other area service providers to assist veterans and other eligible persons to overcome barriers to employment. LVERs and DVOPs are a part of the career center team and are responsible for promoting all career center services, especially services in the employer-marketing arena, e.g., employer visits, employer job fairs, and employer recruitments, among others. Veterans' Program service-delivery strategies fully integrate into the career center delivery system. This seamless integration ultimately benefits veterans. The DEO Veterans' Program includes the following ancillary services:
Vocational Rehabilitation and Employment (VR&E) is an employment and training program facilitated by DVOP staff to assist disabled veterans who are being trained/retrained and rehabilitated for new careers by the U.S. Department of Veterans' Affairs (VA). DEO DVOP specialists, known in Florida as Intensive Services Coordinators
46
(ISC), are currently located at VA VR&E Centers in Pensacola, Ft. Walton Beach, Jacksonville, Orlando, St. Petersburg, and Ft. Lauderdale. All returning disabled/injured veterans are exposed to education/training and rehabilitation services through the VA VR&E Program.
Transitioning Incarcerated Veterans’ Program (TIVP) is an employment and training program facilitated by DVOP specialists, which provides intensive case management and other workforce services to incarcerated veterans who are transitioning from correctional centers back to society and the workforce. These services will result in reducing the risk of homelessness and prevent a reversion back to crime among this population.
Florida has one of the fastest growing veterans' populations in the nation with more than 1.5 million veterans. To ensure Florida’s veterans are aware of and receive quality services from our workforce system, the state coordinators provide guidance and planning instructions to regional workforce boards to ensure they are aware of the JVSG requirements as set forth in Title 38 USC, Chapters 41 and 42. Additionally, the state coordinators also provide guidance as set forth in the Federal Register, dated August 15, 2009, and 20 CFR Part 1010, Priority of Service for Covered Persons. The regional workforce boards update their local plans based on the guidance provided by the state coordinators. As other grants such as the Homeless Veterans’ Reintegration Program (HVRP) become available, the state and the regional workforce boards will submit quality proposals in order to continue assisting veterans with training, housing, and other supportive and workforce services. DEO will also continue its assessment of workforce initiatives and projects that will improve overall state workforce development services for veterans, transitioning military members, and National Guard Members and Reservists. The following are highlights for the PY:
Paycheck for Patriots (P4P): Florida’s military and veteran community, DEO, the Florida National Guard, and FDVA, along with support from Governor Rick Scott, invited and encouraged Florida’s businesses to participate in this annual statewide hiring event for veterans and military families. The event brings employers with current position openings in Florida to the table with great military and veteran candidates. Florida’s business participation in P4P over two years has made a difference in the lives and careers of veterans and military families. More than 50 percent of the military and veteran candidates who participated gained employment as a result of the relationships built through the hiring event.
Veterans’ Program Staff Training: The State Veterans’ Program Coordinator, the Assistant State Veterans’ Program Coordinator, and the three Regional Veterans’ Program Coordinators have put together a plan for three regional staff training sessions to include CareerSource Florida and management staff training. These sessions included presentations from staff of the National Veterans Training Institute (NVTI) and VETS. The primary objective of the training sessions are to raise awareness and focus on advance case management, advance employer outreach, the roles, responsibilities, and regulations for the Veterans’ Employment Program in order to ensure appropriate delivery of services by veterans’ program staff to veterans and eligible persons.
47
Mobile Career Center – Veterans Services: DEOs Mobile Career Center continues to be utilized for Veterans’ Job Fairs and Stand Downs throughout the state. In addition to Job Fairs and Stand Downs, the Mobile Unit has proven to be an invaluable asset in providing services to veterans in rural areas.
Veterans – Effectiveness of Services/Performance Data: In addition to the federally required performance data that is captured in EFM on services to veterans, the state has also implemented additional performance tools/reports to help regional workforce boards better manage the services provided to this population to ensure they are effective. The state has implemented the Monthly Management Report (MMR) that provides a monthly performance snapshot by region and includes data on Short-Term Veterans EER and Short-Term Veterans EER for those Employed at Participation. Additionally, a Weekly Job Placement Report for Veterans is distributed to each region as well as is a number of ad hoc veterans reports produced on a regular schedule and upon request – all designed to assist regional workforce boards in better serving veterans. The regional workforce boards use these various reporting tools for strategic management and decision making when developing their local veterans services’ business models. The tools further help regional workforce boards in program assessment, identification of areas needing improvement, refinement of current strategies, and development of best practices to more effectively serve the state’s veterans. Military Family Employment Advocacy Program The Military Family Employment Advocacy (MFEA) Program provides advocates and services at Florida’s career centers in regions with the densest populations of active duty personnel and military installations, and each year CareerSource Florida allocates WP 7(b) funding to support the program. Persons eligible for this assistance include spouses and dependents of active-duty military personnel, and activated Florida National Guard members and military reservists. There are currently approximately 49,000 military spouses, including military spouses of mobilized National Guard members/reservists, who reside in Florida. The state’s role is to set the vision and expectations for the PY and provide a statewide coordinator to provide technical assistance and training to local advocates, develop strategies for statewide marketing of the program, and collect and analyze service data from EFM. The state’s strategy is to support the efforts of the local advocates as they develop tailored programs to meet the employment needs of military spouses and dependents. Eleven Military Family Employment Advocates are currently assigned to career centers in Pensacola, Ft. Walton Beach, Crestview, Panama City, Jacksonville, Melbourne, Tampa Bay, and Miami/Dade (Regions 1, 2, 4, 8, 13, 15, and 23). Many of the advocates are co-located on military bases at the Family Support Centers. The advocates participate in welcome events and briefings for newly stationed families and job fairs throughout their regions. Services provided include job search and placement assistance, career planning and counseling, case management, résumé assistance, assessment and testing services, interviewing skills training, referral to educational and training programs, job fairs and job clubs, among other things. Military spouses are also eligible to receive training and other support services under WIA and may be eligible to collect RA benefits if they have quit their jobs to relocate with their active duty military spouse.
48
MFEA program advocates participate in numerous employer recruitments, employment workshops and jobseeker outreach activities on and around military installations statewide. Additionally, they work with staff at local military installations and family support centers to assist military family members in developing résumés, performing job searches, and coordinating military and state activities. Some advocates are provided an office by the military staff for more accessibility to military family members on base. The target clients, military family members, are challenging to support for a number of reasons:
They are highly transitory by nature of the active duty member’s national security commitments.
They may reside in a location for a limited period of time before relocating, which can limit their ability to build a strong work history and/or participate in education/training to establish or update competitive work skills when seeking employment at a new location.
Military family members, particularly spouses, who possess a good work history and/or education to compete for high paying, personally rewarding positions, may experience limited opportunities in and around military installations.
During the PY, there were 8,439 military spouses registered in EFM and 4,979 secured employment for a statewide EER of 59 percent, a statewide Employment Retention Rate (ERR) of 81 percent, and an average statewide salary of $12,196 for a six-month period.
Wagner-Peyser Programs WP 7(a) Program: The WP Act of 1933 created the nationwide public employment service. This program is funded under the Federal Unemployment Tax Act (FUTA) for labor exchange services to match employers with qualified workers. In the 1990s, WP funded public labor exchange system became a core component of the new workforce development system, and in 2000, WP became the universal access component of the nation’s career centers. Changes in traditional employment service planning, coordination, and funding have occurred as a result of amendments to the WP Act, but labor exchange continues to be the primary purpose and mandate of the WP program. Current federal regulations require career centers have the capacity to assist job seekers in finding employment, assist employers in filling jobs, facilitate the match between job seekers and employers, participate in a national system for labor exchange, and meet the work test requirements of the state’s RA law. Additionally, USDOL, Employment and Training Administration established equity and minimum service level performance standards for MSFWs, which must be met annually. These federal standards are designed to measure the quality and level of employment services provided to MSFWs. To meet compliance standards, services provided to the MSFW participants must be proportionate to services provided to the total registered applicant pool. Performance highlights for PY 2014-2015 include:
The number of job seekers that entered employment in the current PY remained relatively close to the number that entered employment from the previous PY. The total number of job seekers who entered employment for PY 2013-2014 was 474,060 and for PY 2014-15 was 439,979.
49
The state met all five equity ratio indicators for services to MSFWs for PY 2014-2015. These indicators are – referred to jobs, received staff assisted services, referred to support services, career guidance, and job development contacts. Additionally, 52.9 percent of MSFW job seekers entered employment.
Achieving the level of services attained at career centers is attributed to the unique Florida workforce delivery system and its intensified efforts to reach and serve all customers. Emphasis by career centers on proper identification of agricultural workers (MSFWs) and proper coding of applicants and the services provided to them contributed to the state’s accomplishments. DEO training and technical assistance, on-site monitoring, more comprehensive and expanded data analysis, and the Senior Monitor Advocate’s oversight also supported this higher level of achievement during the PY. An ongoing challenge facing the provision of WP services is the consistently high number of job seekers requiring employment, training, and supportive services. The workforce system has addressed this by providing a seamless, integrated online job-matching system for both job seekers and employers through EFM. CareerSource Florida, DEO, and the regional workforce boards are actively seeking opportunities to enhance, consolidate, and streamline these critical applications and services to both employers and job seekers. The WP program serves as the basis for core activities and services provided through the career centers. The established goals for this program are based on the premise that WP is a labor exchange function, serving both job seekers and employers, and the established performance goals for the WP program in Florida directly reflect the degree to which program success is achieved. Continued training is offered to the regions to improve WP program business and reporting requirements. Additionally, the WP team is developing standalone presentations on basic WP issues as well as targeted regional trainings to address repeat issues. WP 7(b) Program: Section 7(b) of the WP Act reserves 10 percent of the available grant funds to be used for state level activities, including services to groups with special needs (e.g., youth and offenders), exemplary workforce models, and performance incentives for the regional workforce boards. Regions that meet or exceed required performance goals are eligible for performance incentive funds. The CareerSource Florida board approves the use of all WP 7(b) funds. The following projects were either partially or fully funded from WP 7(b) funds during PY 2014-2015:
Regional Performance Incentive funds that are distributed to the regional workforce boards in accordance with the approved CareerSource Florida performance incentive policy.
Exemplary Models for Delivering Job Services such as:
Regional Branding Initiatives.
Statewide Branding Initiatives.
Statewide Integrated Communications, which includes continued facilitation of an integrated communications program that provides a comprehensive outreach and marketing effort to build a skilled, high-quality, and competitive Florida workforce.
Regional Workforce Professional Development Summit.
50
Business Engagement Future of Florida.
Economic Development Partnerships.
Services for Groups with Special Needs such as:
Families and Caregivers for Persons with Disabilities (Family Café).
Military Family Employment Advocacy Program.
Statewide Disability Portal.
Youth Outreach Efforts.
DJJ Youthful Offender Pilot Project.
Regional Rural Initiatives. The state has laid the groundwork for enhancing opportunities to improve alignment of resources, collaboration, and responsiveness to businesses and embraced key partners and stakeholders in workforce, education, industry, and economic development to build on our successes. Targeted Populations Non-Custodial Parent Employment Program (NCPEP): In October 1996, the Personal Responsibility and Work Opportunity Reconciliation Act (PRWORA) eliminated the open-ended federal entitlement program, Aid to Families with Dependent Children (AFDC) and replaced it with the TANF block grant. In addition to ending the entitlement program, it encouraged states to implement pilot programs to help eliminate issues plaguing families in the U.S. and that fall under the four purposes of TANF, which are to:
Assist needy families so children can be cared for in their own homes.
Reduce the dependency of needy parents by promoting job preparation, work, and marriage.
Prevent out-of-wedlock pregnancies.
Encourage the formation and maintenance of two-parent families. PRWORA also mandated that states continue efforts to enforce child support payments from non-custodial parents who either refuse or are unable to pay child support. The federal government encouraged states to implement pilot programs to:
Help non-custodial parents pay or contribute to child support they owe.
Fulfill all financial obligations and meet all conditions imposed on non-custodial parents, such as participation in a work program or other related activity.
Florida complied by including the ability for the regional workforce boards to implement and manage local NCPEP. Section 414.065(5), Florida Statutes, provides the acceptable work activity requirements for non-custodial parents so they may obtain employment and fulfill the obligation to provide support payments, and it stipulates that the parent may be held in contempt for failure to satisfactorily engage in court-ordered work activities. Florida’s plan also allows non-custodial parents to volunteer to participate in a non-custodial program if they meet TANF eligibility requirements. DEO develops NCPEP reporting instructions and pulls monthly reports of program enrollees and benchmarks. DEO continues to clarify instructions for program administration and provide participating regional workforce boards with regional performance information for program participants.
51
NCPEP participant information is tracked in the One-Stop Service Tracking (OSST) system. The success of the NCPEP program may be measured by the number of enrollees who become employed or maintain employment and who report they are making regular child support payments. Program benchmarks are designed to capture program and participant success. Success indicators include:
The number of enrollees who retained employment for 90 days for at least 20 hours per week.
The number of enrollees who retained employment for 180 days for at least 20 hours per week.
The number of enrollees who earned a position upgrade.
The number of enrollees who enter employment while in the program.
The number of enrollees who report a wage increase while in the program.
The number of enrollees who report they have started and continued to pay child support.
The number of enrollees who report they continued to pay child support for more than three months.
The NCPEP services are available to participants in Miami-Dade, Hillsborough, Pinellas, and Pasco counties with CareerSource Pinellas administering the NCPEP funds. It has been beneficial to families in these areas that offer and manage a local program. However, the program faces a funding challenge since it is a TANF-funded special project and the funds to manage it are limited. DEO is working to solicit more regional workforce board participation to manage a local NCPEP. Individuals with Disabilities: In an effort to strengthen alignment and leverage resources to address the workforce challenges faced by job seekers who must overcome barriers to employment, state and local workforce leaders work closely with major partners such as DOE, which houses Florida’s Vocational Rehabilitation program and the Division of Blind Services, DCF, and FDVA. CareerSource Florida has a representative on the board of the Florida Rehabilitation Council for the Blind, created pursuant to section 413.011, Florida Statutes, which is an advisory council to DOEs Division of Blind Services. The Council assists DOE in the planning and development of statewide vocational rehabilitation programs and services, and recommends improvements to such programs and services. As mentioned earlier in this report, DEO, in collaboration with the Agency for Persons with Disabilities, Vocational Rehabilitation, the Governor’s Commission on Jobs for Floridians with Disabilities, and other state and local partners, launched a micro-portal in EFM. It was designed to meet the needs of Florida employers looking to hire qualified job seekers with disabilities and the job seekers who are trying to find that next great job. Disability Employment Initiative (DEI): DEI is a collaborative effort between USDOLs Employment and Training Administration and the Office of Disability Employment Policy. One goal is to improve coordination and collaboration among employment and training and asset development programs carried out at a state and local level, including the Ticket to Work (TtW) program. Another is to build effective community partnerships that leverage public and private resources to better serve individuals with disabilities and improve employment outcomes.
52
Florida received an award on October 2012 for $3,402,124 through September 2015. Ten regions chose to participate, 4, 6, 7, 8, 13, 14, 17, 21, 22, and 24. Of those ten regions, USDOL and their independent evaluators, Social Dynamics, chose five pilot sites for full funding – 4, 14, 17, 21, and 22 – and five as control sites that provide data – 6, 7, 8, 13, and 24. Florida chose Partnership and Collaboration, Blending and Braiding Funds/Leveraging Resources, Integrated Resource Teams, and Asset Development Strategies as its service delivery models. USDOL required all participating regions to be employment networks and they required the hiring of dedicated staff for this grant. Because Florida’s regions were already employment networks and already had staff in place, they were able to begin implementation of the grant with no delays. USDOL assigned a technical assistance advisor from the National Disability Institute to assist with implementation, and together, with the state lead, they hold monthly conference calls and face-to-face meetings two times per year. Since implementation of this grant, the pilot sites have worked closely with the National Disability Institute on Asset Development training, and all of the Disability Resource Coordinators are now qualified as trainers and will conduct their first solo staff training this fall. Disability Program Navigator (DPN): The primary objectives of the DPN initiative are to increase the ability of the career center system to enhance the employability of job seekers with disabilities and increase the number of career advancement opportunities available to them. Additionally, the DPN:
Guides career center staff in assisting persons with disabilities to access and navigate the complexities of various programs and services that affect their ability to gain/retain employment by providing periodic training.
Identifies appropriate community resources for job seekers with disabilities to remove barriers to employment, i.e., training, transportation, housing, assistive technology needs, etc.
Develops linkages and collaborates on an ongoing basis with employers to facilitate job placements for persons with disabilities.
Facilitates the transition of in-school and out-of-school youth with disabilities to obtain employment and economic self-sufficiency.
Serves as a resource for referrals on the Social Security Administration’s (SSA) initiatives: work incentives and employment support programs, Protection and Advocacy systems, and employment-related demonstration projects.
Serves as a resource to the workforce development community to ensure the availability of comprehensive knowledge of federal, state, local, and private programs that impact the ability of persons with disabilities to enter and remain in the workforce.
Creates systemic change and transforms the culture of how career centers serve customers with disabilities.
The DPN Initiative was initially a joint venture between USDOL, Office of Disability Employment Policy, and the SSA and was administered by the former Agency for Workforce Innovation, now DEO. Federal funding for the DPN ended on June 30, 2010; however, because of its success, CareerSource Florida allocated funds to the 17 regional workforce boards that are Employment Networks so they could continue operating the program through June 2014. In addition, many regional boards have continued the program beyond June 2014 to continue the successful implementation of services to persons with disabilities as prioritized by WIOA.
53
The DPN initiative provides dedicated staff to career centers who:
Train other staff members to better serve persons with disabilities.
Make contact with employers in their communities.
Develop job opportunities for persons with disabilities.
Become acquainted with the resources in their communities that can assist their customers.
Ensure all persons with disabilities who enter a career center do not encounter barriers to using the facility.
The state’s role is to monitor and support the DPNs and disability specialists in their efforts. The state facilitates technical assistance for the regions that participate in the TtW program and provides information to inform and assist the regions in better serving all persons with disabilities. The following are highlights and accomplishments of the DPN:
Increased employment and self-sufficiency for Social Security beneficiaries and others with disabilities by identifying and facilitating employment and training opportunities and helping individuals understand how earnings may affect their Social Security benefits and other support programs.
Facilitated seamless and comprehensive services to persons with disabilities in career centers through collaboration and partnerships within the community.
Facilitated access and referrals to other local programs and services and linkages to the employer community.
Increased participation of regional workforce boards in the TtW program. Currently, 17 of the 24 boards have become Employment Networks under the program.
CareerSource Broward is now the number one workforce Employment Network in the country in terms of money earned and ticketholders served.
Participated in a pilot initiative with SSA in which DEO became an administrative Employment Network in the TtW program.
Facilitated information between SSA and the regional workforce boards that are Employment Networks to help the regions identify and market to those people with Tickets that are already registered in EFM.
One of the primary challenges is conducting outreach to develop and maintain long-term relationships with advocacy groups, community organizations, and agencies that facilitate the employment of persons with disabilities. Another challenge, as reported by the rural regions, is that the lack of public transportation hinders their customers’ ability to find and keep a job. Though challenges exist, the regional workforce boards will continue to expand employment and training opportunities for persons with disabilities by leveraging workforce and community resources, and they will continue to work with community partners to promote systemic change within the career centers. From its inception, USDOL and SSA have promoted the TtW program as a way to sustain the DPN program into the future. The goal of TtW is to increase choices, opportunities, and support for Social Security disability beneficiaries to obtain employment with the goal of becoming economically self-supporting over time. SSA provides disability beneficiaries with a ticket they can use to obtain the services, support, and job search assistance they need from a new universe of organizations called Employment Networks. DEO works diligently with representatives from SSA,
54
Maximus, and the Institute for Community Inclusion to provide technical assistance to the regions so they will have a successful TtW program that will in turn provide the monies needed to sustain and expand the DPN.
DEO is an administrative Employment Network with SSA. This enables DEO to transmit data on participants from EFM and the One Stop Management Information System (OSMIS) to SSA. Using the information provided, SSA performs a data match to determine which customers in EFM/OSMIS are ticket holders and then provides the information to the regions (Employment Networks) so they can deliver the required services under the TtW program. Federal Fidelity Bonding Program: In 1966, USDOL established the Federal Bonding Program to provide Fidelity Bonds that guarantee honesty for “at-risk,” hard-to-place job seekers. The Federal Bonding Program provides a fidelity bond, free of charge, to employers who hire ex-offenders or others who have some risk factor in their personal background. The bonds cover the first six months of employment and protects the employers in the event of any loss of money or property due to employee dishonesty. The average bond coverage is $5,000 per applicant, although larger bonds are possible. The state provides marketing materials to the regional workforce boards to publicize the program to employers and potential applicants. In addition, staff provides information to individuals regarding the program requirements and directs them to the local career center. The local career centers then complete and submit bonding applications to DEO who reviews the application and issues the bond. Florida provides more bonds than any other state, and during FY 2014-2015, 363 individuals with barriers to employment were employed due to bonds being issued to their employer. Future program goals and strategies include the continuation of work with career centers to develop more effective marketing strategies so a greater number of at-risk applicants can take advantage of the program and employment. Florida Council on the Social Status of Black Men and Boys: DEO participates on the Florida Council on the Social Status of Black Men and Boys in accordance with section 16.615, Florida Statutes. The mission of the council is to research and propose measures that improve conditions affecting black men and boys. Each year the council publishes its findings in an annual report that is submitted to the Governor, President of the Senate, and Speaker of the House of Representatives. DEOs agency representative serves as a member of the full council, the Chair of the Employment and Economics Subcommittee and on other committees as appointed by the council’s chair. The scope of the council’s research is comprehensive and encompasses studies on education, health and families, criminal justice, and employment and economics. In 2012, a strategic plan was adopted by the council with key performance indicators and measureable strategic goals. The Employment and Economics Subcommittee will continue to seek strategies to improve economic opportunities for black males. The subcommittee’s annual performance measurements are (1) the annual increase in the number of black males who obtain jobs and (2) the statewide annual increase in the number of black male youth (ages 14-22) who obtain industry certifications. The council will monitor key performance indicators throughout the year and provide updates in its annual report. DEO will continue to work collaboratively with the council, CareerSource Florida and Florida’s 24 regional workforce boards to promote increased workforce participation, positive employment outcomes, and an increased number of industry certifications.
55
Independent Living Services Advisory Council: DEO is a statutorily required member of the Independent Living Services Advisory Council, which is administratively housed under DCF which provides support for the council. Pursuant to section 409.1451(7) Florida Statutes, the council’s purpose is to review and provide recommendations related to implementation and operation of the independent living transition services. Each year the council prepares and submits a report to the Florida Legislature and DCF on the status of the services being provided, including successes and barriers to these services. DCF contracts with 17 Community-Based Care Lead Agencies in Florida to provide Independent living services for current and former foster youth and young adults. Four categories of Independent Living services are currently available in Florida, including:
Extended Foster Care.
Postsecondary Education Services and Support (PESS).
Aftercare Support Services.
Road-to-Independence Program. Efforts are underway to connect and improve local collaboration between the community-based care agencies and the CareerSource Florida network. Assisting youth, who are in and aging out of foster care, in obtaining gainful employment is a focus of the council. The council is working to develop an employment workgroup, led by CareerSource Florida and DEO representatives, to seek strategies that will improve foster youth access to workforce services and address barriers that affect access to employment. AmeriCorps CareerSource Youth Services (ACYS): On January 1, 2015, DEO in conjunction with Volunteer Florida, the Corporation for National and Community Service (CNCS), and CareerSource Florida launched its newly created ACYS Program to provide at-risk and disadvantaged youth job placement assistance and job skills training as they explore careers and engage with employers. Participating regions include CareerSource Capital Region, CareerSource Northeast Florida, CareerSource Citrus Levy Marion, CareerSource Pinellas, and CareerSource Tampa Bay. Community employers participating in the ACYS Employer Engagement workshops include ITT Tech, Walmart, Walgreens, Sam’s Club, Helping Hands, and The Lawrence Gregory Community Center. In addition to their career center services, ACYS members also participated in community service activities and statewide initiatives, such as the Family Café. Welfare Transition and Supplemental Nutrition Assistance Program Welfare Transition Program: DEO provides guidance on TANF and WT program requirements in accordance with federal law, Florida Statutes, Florida Administrative Code, and policy outlined by CareerSource Florida. DEO offers technical assistance in various WT program areas, including program administration and creating local procedures, and offers on-site, web-based, and/or telephonic technical assistance at local board request, as well. DEO also conducts quality assurance reviews of the WT program to ensure regional workforce boards are adhering to laws, rules, and regulations set forth in federal or state law and guidance. In continuing its efforts to be innovative leaders in welfare reform, Florida is one of the states that made up-front work registration an eligibility requirement for Temporary Cash Assistance (TCA). On September 18, 2013, the state launched a project allowing TCA applicants to complete the
56
work registration process online. Applicants receive a program overview and complete a Needs Assessment, which helps identify barriers to employment or program participation during the application process. The assessment is designed to identify several issues such as medical limitations, emergencies, Substance Abuse and Mental Health (SAMH), and Domestic Violence. If an applicant identifies an issue and indicates they would like assistance or counseling, they are given the opportunity, after they have completed their assessment, to access an online list of counseling resources in their area. Prior to creating this process online, each of the 24 regional workforce boards engaged applicants locally. Data entry for work registration by case managers is time-intensive and takes the case manager on average one hour per work registration entry. Repetitive system functions such as creating the applicant case and recording program orientation is now completed by an online system driven by the applicant’s access to their online account. As an enhancement to online work registration, the program overview includes a quiz that is given intermittently to customers as they review the orientation to ensure they have read and understand the information in the overview or have listened to the narrator regarding program expectations. If the customer misses two questions, the system returns them to the beginning of the section to review and listen to the program overview again. While reviewing the overview again, the system presents the customer with a new set of questions, and the customer can only move forward once they have correctly answered the questions. Florida amended its Work Verification Plan to include a subsidized employment model that allows the regional workforce boards to offer a subsidy to employers who agree to provide work-study opportunities to work-eligible participants who are enrolled in degree-seeking or vocational programs. This allows students to gain practical skills to be coupled with their education to close the skills gap reported by employers. One region is taking advantage of this model and has realized moderate success with its first cohort of work-study students. DEO continues to coordinate with DCF in its modernization of the public assistance eligibility process. As partner agencies, DEO and DCF are working on system interfaces between the two agencies in order to increase efficiencies. The two departments continue discussions with the Department of Revenue (DOR) to determine how coordination efforts with Child Support Enforcement can benefit the populations served between them. The departments will start by simply educating staff about services provided by both departments and preparing them to answer commonly asked questions relative to each agency. DEO and DOR will continue communications to discuss how to increase coordination efforts to serve each department’s populations more effectively. In light of a rebounding economy, DEO finds many TANF recipients who remain on or enter into Florida’s TANF caseload do not have the education and or skills to enter into the workforce with self-sustaining employment. Many are first time or brand new recipients with multiple barriers, some of which include basic educational skills, soft skills, and life skills. Life skills such as managing family, money, and work are essential to the upcoming workforce. Without these skills, program participants may falter in the program and in their efforts to become self-sufficient and, consequently, continue in a cycle of dependency. Additionally, because providing young families with these skills is not counted in the consideration of meeting federally established participation rates, meeting participation rates still poses a challenge. The state continues to make strides in its All Family participation rate. Florida uses two methods to measure the state’s participation rate performance. The state’s Monthly Management Report
57
(MMR) is a monthly indicator of how each region is performing and how the state is performing as a whole. The Participation Report closely mirrors the federal methodology for determining participation rates for all states. Florida continues to struggle with the Two-Parent Family Participation Rate. The federal requirement is 90 percent, and the state’s highest average during the PY was 52.4 percent. Major goals of the program include continuing the collaborative relationship between DEO, DCF and CareerSource Florida, providing training to regions to meet performance requirements, and improving the performance of the WT program. Efforts are ongoing to identify ways to improve and enhance data entry systems, communication with the regions, and methods for reporting programmatic outcomes. The WT caseload is expected to continue to decline as the economy shows evidence of rebounding. However, the caseload reduction credit will possibly decrease with each passing year, making it imperative for Florida to meet the required 50 percent All Family participation rate and 90 percent two-parent family participation rate. The state strives to achieve a consistent All Family participation rate greater than 50 percent. During the PY, Florida’s All Family participation rate was 43.5 percent. The state’s highest average during the PY was 47.2 percent. Florida strives to provide the best possible service to its WT participants and program staff. DEO continues to create training materials that are useful and practical to the regional workforce boards by appealing to different learning styles. DEO will continue to offer web training, step-by-step “How-To” guides for system navigation and usage, and resource guides to help understand and apply WT program policy. A major focus of program training for the upcoming year is practical application of program policy with hands-on exercises and peer modeling. Supplemental Nutrition Assistance Program Employment and Training: Florida’s SNAP is designed to provide food assistance recipients with training, education, support services, and skills needed to increase the likelihood of self-sufficiency through employment. DCF staff registers participants for work and refers them for participation in SNAP E&T components delivered by participating regional workforce boards. Federal funds from the U.S. Department of Agriculture (USDA) and state general revenue are used to support the program. Like other programs, DEO provides guidance on SNAP E&T program requirements in accordance with federal law, Florida Statutes, Florida Administrative Code, and policy outlined by CareerSource Florida. DEO also offers on-site, web-based, and/or telephonic technical assistance at the region’s request and conducts quality assurance reviews of the program to ensure regional workforce boards are adhering to laws, rules, and regulations. During PY 2014-15, Florida operated a volunteer SNAP E&T program based on its eligibility for extended RA benefits as indicated by USDOLs Extended Benefit (EB) Trigger Notice. Under longstanding guidance, states meeting the EB criteria can qualify for a 12-month statewide waiver, up to 12 months after the trigger date. The USDA Food and Nutrition Services (FNS) can approve a waiver if the state's unemployment triggers the criteria for EBs regardless of whether the state has elected the option to offer EB itself. Florida is one of the states that meet the EB criteria under USDOL Trigger Notice 2013-38. Although SNAP E&T is voluntary, participants are still referred to the program via a system interface. Recipients between the ages of 16-39 who do not meet an exemption are mailed letters to inform them about available services and are provided instructions on how to start participating
58
if they choose to volunteer. If the customer does not take steps to volunteer, DEOs OSST system will automatically close their OSST case after 90 days of inactivity. In 2012, CareerSource Gulf Coast began piloting Employment Retention Services (ERS) for SNAP E&T customers, and in October 2013, CareerSource Pinellas started providing these services to SNAP E&T participants. ERS allowed program volunteers who gained employment while participating in SNAP E&T to receive transitional services for up to three months. The services included additional transportation services beyond the traditional Food Stamp Reimbursement (FSR) transportation, childcare reimbursement, clothing, tools, and equipment. Program participants who meet ERS criteria are eligible to receive a reimbursement for these expenses. The OSST system was updated to track ERS eligibility for service areas. ERS have been well received by the two regions and customers who qualify for the services. Florida hopes to maintain services to the SNAP population in order to continue promoting, encouraging, and supporting employment. While SNAP E&T engagement has increased, the state still faces challenges with engagement due to funding. The education and skills gained by participants in E&T programs help them become more marketable and employable. State-Level Programs Alien Labor Certification (ALC) Programs: The ALC Programs are designed to ensure the admission of foreign workers into the U.S. on a temporary basis will not adversely affect the job opportunities, wages, and working conditions of American workers. The programs also enable American businesses to employ the skills and labor not readily available in the domestic labor force in order to effectively compete in the global economy. The ALC Program unit is divided into two major areas:
H-2A – Certification for Temporary Seasonal Work: This program is for agricultural employers who anticipate a shortage of domestic workers to bring non-immigrant foreign workers to the U.S. to perform agricultural labor or services of a temporary or seasonal nature. This includes agricultural clearance orders, housing inspections and agricultural prevailing wage surveys, which establish wage and practice activities of employers.
H-2B – Certification for Temporary Nonagricultural Work: This program permits employers to hire foreign workers to come to the U.S. and perform non-agricultural work, which may be one-time, seasonal, peak-load, or intermittent workload needs for 12 months or less.
During FY 2014 -2015, the ALC Program:
Conducted 213 H-2A housing inspection visits.
Completed a combined total of 24 H-2A prevailing wage and practices surveys.
Posted 152 H-2A intrastate job orders into EFM.
Posted 555 H-2A interstate job orders into EFM.
Posted 152 H-2B job orders into EFM. On April 29, 2015, new regulations governing the H-2B Temporary Non-agricultural Certification Program became effective.
59
Work Opportunity Tax Credit (WOTC) Program: The WOTC Program is designed to help job seekers from certain target groups who consistently have a particularly high unemployment rate enter employment. By hiring from these targeted groups, employers may receive a potential maximum tax credit of up to $9,600 during the first year of employment or up to $9,000 over two years, depending on the qualified applicant. The targeted groups are Qualified TANF Recipients, Qualified Veterans/Disabled Veterans, Unemployed Veterans, Qualified Ex-Felons, Designated Community Residents, Vocational Rehabilitation Referrals, Qualified Food Stamp Recipients, Qualified Supplemental Security Income Recipients, and Long-Term Family Assistance Recipients. Below are a few highlights and accomplishments of the WOTC Program.
During FY 2014 – 2015, the WOTC Program issued 118,618 certifications that resulted in a potential tax credit savings of $284,683,200 to Florida employers.
The online application processing system (E-WOTC) currently has approximately 55 WOTC consulting companies and over 80 Florida employers who are participating.
From July 1, 2010 to June 30, 2015, DEO received over 750,000 electronic applications from employers and tax credit consultants.
On December 19, 2014, President Obama signed into law The Tax Increase Prevention Act of 2014, which reauthorized the WOTC program without any amendments to the program. Specifically, the Act retroactively extended all the current WOTC target groups without changes or new provisions from December 31, 2013 through December 31, 2014. On December 31, 2014, the legislative authority for all WOTC target groups expired. As a result, beginning January 1, 2015, the WOTC Program was a placed into an authorization lapse. During this authorization lapse, DEO has adhered to the following procedures pending further congressional actions:
DEO accepts and fully processes timely filed WOTC certification requests to employers’ new hires made on or before December 31, 2014.
DEO accepts and fully processes WOTC certification requests for employers’ new hires made on or after January 1, 2015.
Until the program is reauthorized, DEO will withhold issuance of certifications and denials on all WOTC certification requests for employers’ new hires made on or after January 1, 2015.
However, to be eligible for consideration of the tax credit during this authorization lapse, employers must properly file WOTC certification requests in a timely manner (must be postmarked within 28 calendar days after the new employee’s job start date of employment). The WOTC application process traditionally requires employers to mail original signed copies of IRS forms and supporting documentation to their state workforce agency (DEO) in order to apply for the tax credit; however, the new E-WOTC application process provides a paperless alternative to the traditional process. The electronic process streamlines application submittal and processing for businesses, resulting in increased program efficiencies. As the program continues to be publicized, DEO anticipates more business organizations will begin using the E-WOTC application process resulting in quicker approvals of their tax credit certifications.
60
DEO will continue to promote the WOTC Program and the E-WOTC online system through outreach initiatives with our workforce partners, regional workforce boards, and other interested organizations by providing training and technical assistance. Additionally, DEO is working to better publicize the program so more employers are aware of the potential tax benefits. LOOKING AHEAD A primary focus for Florida’s workforce system for 2015 – 2016, as it was in this past program year, is implementation of WIOA. CareerSource Florida was charged with leading a task force of state agency, business and education partners who began evaluating requirements of WIOA to provide specific recommendations to the State Board for policy consideration, the Governor for decision and action, and the Florida Legislature for statutory consideration. Florida is well-positioned for WIOA implementation, having benefited for the past several years from a business-focused workforce system that engages with multiple core partners. The new law both codifies and compels improvements in relationships with businesses and core partners and requires the expansion of these partnerships to create a truly inclusive workforce system where all Floridians have the opportunity to maximize their potential for self-sufficiency. The CareerSource Florida network will continue to build upon its sector strategy approach to gathering and leveraging market intelligence for the health care and advanced manufacturing industries with a goal of fully engaging business leaders in both industries. Additionally, CareerSource Florida remains committed to enhancing customer service to businesses in all industries as well as internal partners and stakeholders. Essential to Florida’s ongoing position as a national leader in workforce innovation is the dedication of its workforce system to the core value of continuous improvement. This commitment is taken seriously by the entire CareerSource Florida network and remains an area of ongoing focus for the coming year and beyond.

61
APPENDIX OF TABLES
62
Table 1
DEFINITIONS FOR WIA PERFORMANCE MEASURES
Customer Satisfaction Measures
Participant Satisfaction The weighted averages of participant ratings on each of the three questions regarding overall satisfaction are reported on a 0-100 point scale. The score is a weighted average, not a percentage. Employer Satisfaction The weighted averages of employer ratings on each of the three questions regarding overall satisfaction are reported on a 0-100 point scale. The score is a weighted average, not a percentage.
Adult Measures
Adult Entered Employment Rate Of those who are not employed at registration: Number of adults who have entered employment by the end of the first quarter after exit divided by the number of adults who exit during the quarter. Adult Employment Retention Rate at Six Months Of those who are employed in the first quarter after exit: Number of adults who are employed in the third quarter after exit divided by the number of adults who exit during the quarter. Adult Average Earnings Of those adult participants who are employed in the first, second, and third quarters after the exit quarter: Total earnings in the second quarter plus total earnings in the third quarter after the exit quarter divided by the number of adult participants who exit during the quarter.
Adult Employment and Credential Rate Of adults who received training services: Number of adults who were employed in the first quarter after exit and received a credential by the end of the third quarter after exit divided by the number of adults who exited services during the quarter.
Dislocated Worker Measures Dislocated Worker Entered Employment Rate Number of dislocated workers who have entered employment by the end of the first quarter after exit divided by the number of dislocated workers who exit during the quarter. Dislocated Worker Employment Retention Rate at Six Months Of those who are employed in the first quarter after exit: Number of dislocated workers who are employed in the third quarter after exit divided by the number of dislocated workers who exit during the quarter.
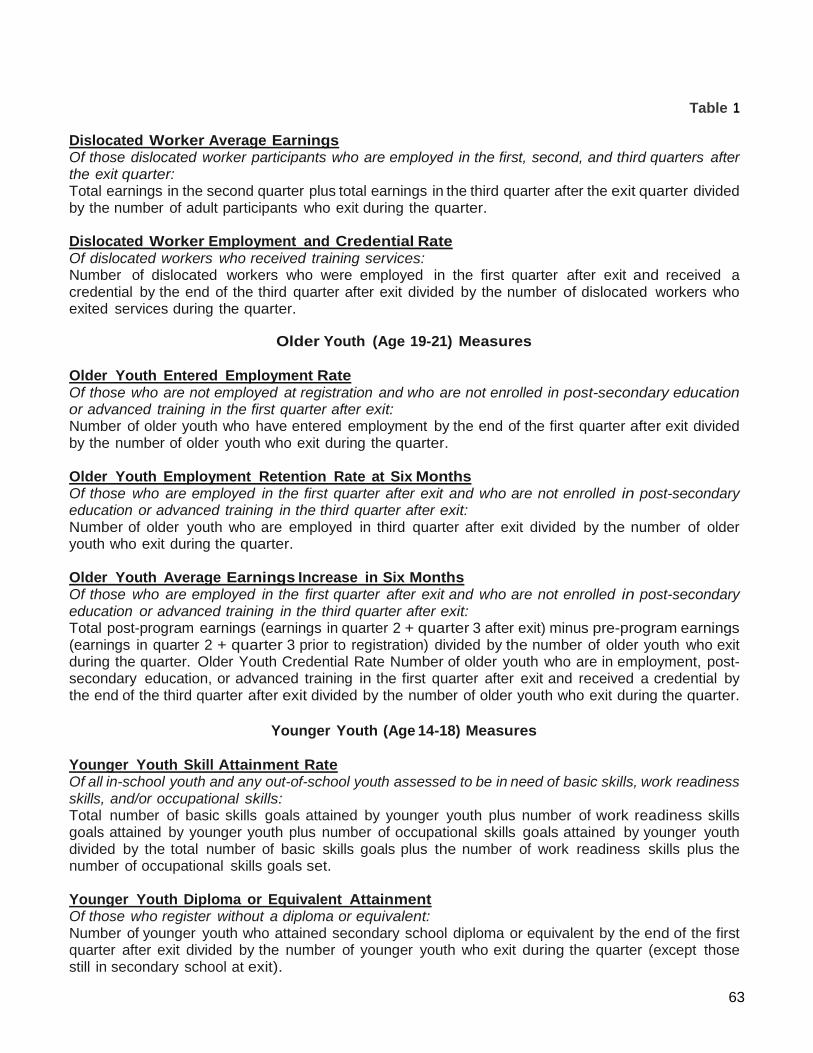
63
Table 1
Dislocated Worker Average Earnings Of those dislocated worker participants who are employed in the first, second, and third quarters after the exit quarter: Total earnings in the second quarter plus total earnings in the third quarter after the exit quarter divided by the number of adult participants who exit during the quarter. Dislocated Worker Employment and Credential Rate Of dislocated workers who received training services: Number of dislocated workers who were employed in the first quarter after exit and received a credential by the end of the third quarter after exit divided by the number of dislocated workers who exited services during the quarter.
Older Youth (Age 19-21) Measures
Older Youth Entered Employment Rate Of those who are not employed at registration and who are not enrolled in postsecondary education or advanced training in the first quarter after exit: Number of older youth who have entered employment by the end of the first quarter after exit divided by the number of older youth who exit during the quarter. Older Youth Employment Retention Rate at Six Months Of those who are employed in the first quarter after exit and who are not enrolled in post-secondary education or advanced training in the third quarter after exit: Number of older youth who are employed in third quarter after exit divided by the number of older youth who exit during the quarter. Older Youth Average Earnings Increase in Six Months Of those who are employed in the first quarter after exit and who are not enrolled in post-secondary education or advanced training in the third quarter after exit: Total post-program earnings (earnings in quarter 2 + quarter 3 after exit) minus preprogram earnings (earnings in quarter 2 + quarter 3 prior to registration) divided by the number of older youth who exit during the quarter. Older Youth Credential Rate Number of older youth who are in employment, post-secondary education, or advanced training in the first quarter after exit and received a credential by the end of the third quarter after exit divided by the number of older youth who exit during the quarter.
Younger Youth (Age 14-18) Measures
Younger Youth Skill Attainment Rate Of all in-school youth and any out-of-school youth assessed to be in need of basic skills, work readiness skills, and/or occupational skills: Total number of basic skills goals attained by younger youth plus number of work readiness skills goals attained by younger youth plus number of occupational skills goals attained by younger youth divided by the total number of basic skills goals plus the number of work readiness skills plus the number of occupational skills goals set. Younger Youth Diploma or Equivalent Attainment Of those who register without a diploma or equivalent: Number of younger youth who attained secondary school diploma or equivalent by the end of the first quarter after exit divided by the number of younger youth who exit during the quarter (except those still in secondary school at exit).

64
Table 1
Younger Youth Retention Rate Number of younger youth found in one of the following categories in the third quarter following exit:
Post-secondary education.
Advanced training.
Employment.
Military service.
Qualified apprenticeships divided by the number of younger youth who exit during the quarter (except those still in secondary school at exit).
All Youth
Placement in Employment or Education- New Measure Of those who are not in post-secondary education or employment (including the military) at the date of participation: Number of youth participants who are in employment (including the military) or enrolled in post-secondary education and/or advanced training/occupational skills training in the first quarter after the exit quarter divided by the number of youth participants who exit during the quarter. Attainment of a Degree or Certificate- New Measure Of those enrolled in education (at the date of participation or at any point during the program): Number of youth participants who attain a diploma, GED, or certificate by the end of the third quarter after the exit quarter divided by the of youth participants who exit during the quarter. Literacy and Numeracy Gains- New Measure Of those out-of-school youth who are basic skills deficient: The number of youth participants who increase one or more educational functioning levels divided by the number of youth participants who have completed a year in the program (i.e., one year from the date of first youth program service) plus the number of youth participants who exit before completing a year in the youth program.
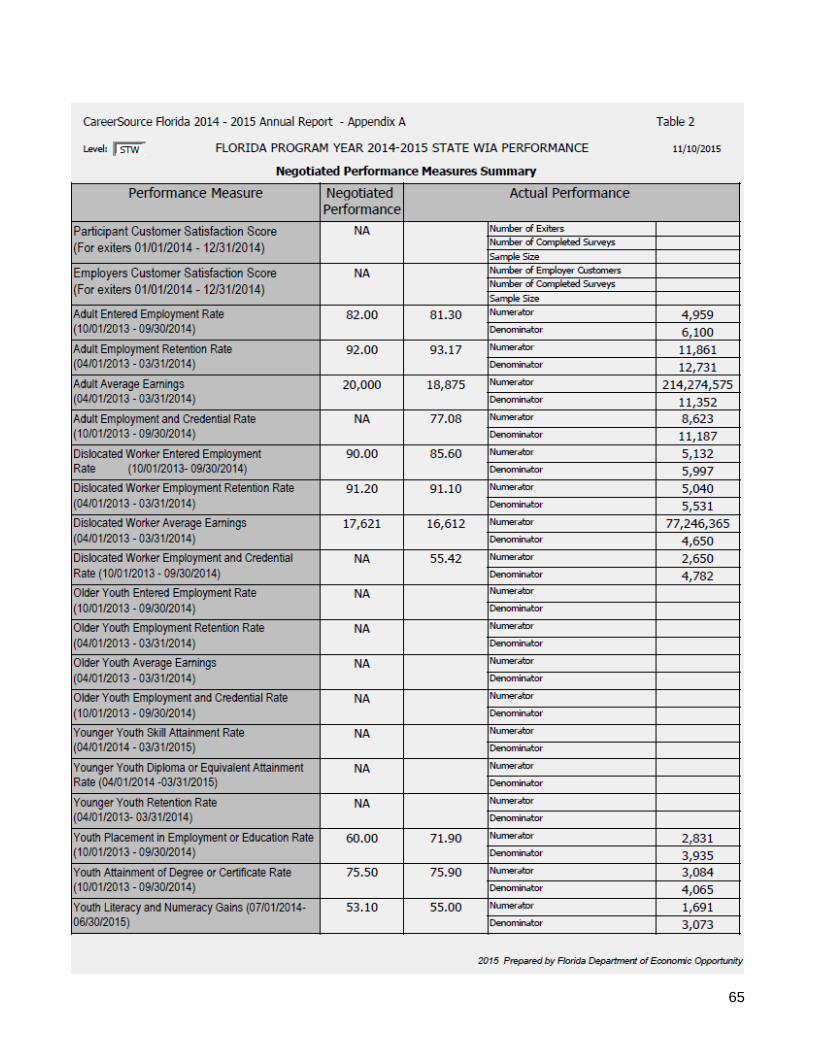
65
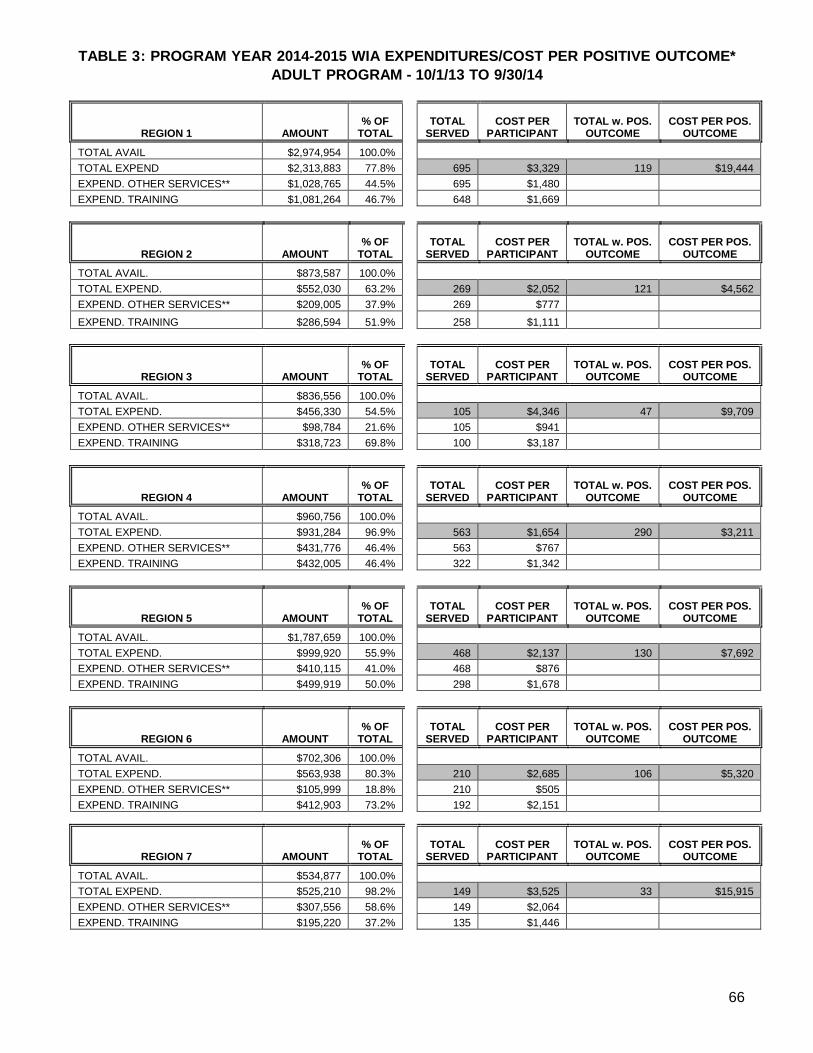
TABLE 3: PROGRAM YEAR 2014-2015 WIA EXPENDITURES/COST PER POSITIVE OUTCOME*
ADULT PROGRAM - 10/1/13 TO 9/30/14
66
REGION 1 AMOUNT % OF
TOTAL TOTAL
SERVED COST PER
PARTICIPANT TOTAL w. POS.
OUTCOME COST PER POS.
OUTCOME
TOTAL AVAIL $2,974,954 100.0%
TOTAL EXPEND $2,313,883 77.8% 695 $3,329 119 $19,444
EXPEND. OTHER SERVICES** $1,028,765 44.5% 695 $1,480
EXPEND. TRAINING $1,081,264 46.7% 648 $1,669
REGION 2 AMOUNT % OF
TOTAL TOTAL
SERVED COST PER
PARTICIPANT TOTAL w. POS.
OUTCOME COST PER POS.
OUTCOME
TOTAL AVAIL. $873,587 100.0%
TOTAL EXPEND. $552,030 63.2% 269 $2,052 121 $4,562
EXPEND. OTHER SERVICES** $209,005 37.9% 269 $777
EXPEND. TRAINING $286,594 51.9% 258 $1,111
REGION 3 AMOUNT % OF
TOTAL TOTAL
SERVED COST PER
PARTICIPANT TOTAL w. POS.
OUTCOME COST PER POS.
OUTCOME
TOTAL AVAIL. $836,556 100.0%
TOTAL EXPEND. $456,330 54.5% 105 $4,346 47 $9,709
EXPEND. OTHER SERVICES** $98,784 21.6% 105 $941
EXPEND. TRAINING $318,723 69.8% 100 $3,187
REGION 4 AMOUNT % OF
TOTAL TOTAL
SERVED COST PER
PARTICIPANT TOTAL w. POS.
OUTCOME COST PER POS.
OUTCOME
TOTAL AVAIL. $960,756 100.0%
TOTAL EXPEND. $931,284 96.9% 563 $1,654 290 $3,211
EXPEND. OTHER SERVICES** $431,776 46.4% 563 $767
EXPEND. TRAINING $432,005 46.4% 322 $1,342
REGION 5 AMOUNT % OF
TOTAL TOTAL
SERVED COST PER
PARTICIPANT TOTAL w. POS.
OUTCOME COST PER POS.
OUTCOME
TOTAL AVAIL. $1,787,659 100.0%
TOTAL EXPEND. $999,920 55.9% 468 $2,137 130 $7,692
EXPEND. OTHER SERVICES** $410,115 41.0% 468 $876
EXPEND. TRAINING $499,919 50.0% 298 $1,678
REGION 6 AMOUNT % OF
TOTAL TOTAL
SERVED COST PER
PARTICIPANT TOTAL w. POS.
OUTCOME COST PER POS.
OUTCOME
TOTAL AVAIL. $702,306 100.0%
TOTAL EXPEND. $563,938 80.3% 210 $2,685 106 $5,320
EXPEND. OTHER SERVICES** $105,999 18.8% 210 $505
EXPEND. TRAINING $412,903 73.2% 192 $2,151
REGION 7 AMOUNT % OF
TOTAL TOTAL
SERVED COST PER
PARTICIPANT TOTAL w. POS.
OUTCOME COST PER POS.
OUTCOME
TOTAL AVAIL. $534,877 100.0%
TOTAL EXPEND. $525,210 98.2% 149 $3,525 33 $15,915
EXPEND. OTHER SERVICES** $307,556 58.6% 149 $2,064
EXPEND. TRAINING $195,220 37.2% 135 $1,446
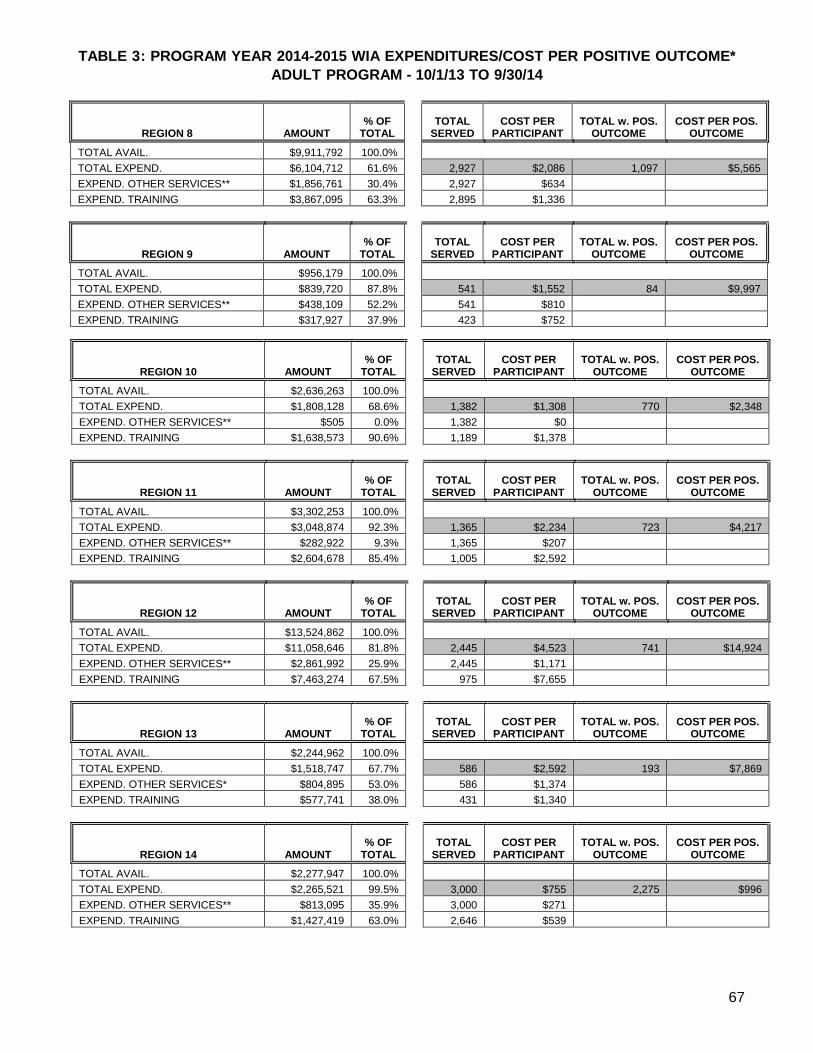
TABLE 3: PROGRAM YEAR 2014-2015 WIA EXPENDITURES/COST PER POSITIVE OUTCOME*
ADULT PROGRAM - 10/1/13 TO 9/30/14
67
REGION 8 AMOUNT % OF
TOTAL TOTAL
SERVED COST PER
PARTICIPANT TOTAL w. POS.
OUTCOME COST PER POS.
OUTCOME
TOTAL AVAIL. $9,911,792 100.0%
TOTAL EXPEND. $6,104,712 61.6% 2,927 $2,086 1,097 $5,565
EXPEND. OTHER SERVICES** $1,856,761 30.4% 2,927 $634
EXPEND. TRAINING $3,867,095 63.3% 2,895 $1,336
REGION 9 AMOUNT % OF
TOTAL TOTAL
SERVED COST PER
PARTICIPANT TOTAL w. POS.
OUTCOME COST PER POS.
OUTCOME
TOTAL AVAIL. $956,179 100.0%
TOTAL EXPEND. $839,720 87.8% 541 $1,552 84 $9,997
EXPEND. OTHER SERVICES** $438,109 52.2% 541 $810
EXPEND. TRAINING $317,927 37.9% 423 $752
REGION 10 AMOUNT % OF
TOTAL TOTAL
SERVED COST PER
PARTICIPANT TOTAL w. POS.
OUTCOME COST PER POS.
OUTCOME
TOTAL AVAIL. $2,636,263 100.0%
TOTAL EXPEND. $1,808,128 68.6% 1,382 $1,308 770 $2,348
EXPEND. OTHER SERVICES** $505 0.0% 1,382 $0
EXPEND. TRAINING $1,638,573 90.6% 1,189 $1,378
REGION 11 AMOUNT % OF
TOTAL TOTAL
SERVED COST PER
PARTICIPANT TOTAL w. POS.
OUTCOME COST PER POS.
OUTCOME
TOTAL AVAIL. $3,302,253 100.0%
TOTAL EXPEND. $3,048,874 92.3% 1,365 $2,234 723 $4,217
EXPEND. OTHER SERVICES** $282,922 9.3% 1,365 $207
EXPEND. TRAINING $2,604,678 85.4% 1,005 $2,592
REGION 12 AMOUNT % OF
TOTAL TOTAL
SERVED COST PER
PARTICIPANT TOTAL w. POS.
OUTCOME COST PER POS.
OUTCOME
TOTAL AVAIL. $13,524,862 100.0%
TOTAL EXPEND. $11,058,646 81.8% 2,445 $4,523 741 $14,924
EXPEND. OTHER SERVICES** $2,861,992 25.9% 2,445 $1,171
EXPEND. TRAINING $7,463,274 67.5% 975 $7,655
REGION 13 AMOUNT % OF
TOTAL TOTAL
SERVED COST PER
PARTICIPANT TOTAL w. POS.
OUTCOME COST PER POS.
OUTCOME
TOTAL AVAIL. $2,244,962 100.0%
TOTAL EXPEND. $1,518,747 67.7% 586 $2,592 193 $7,869
EXPEND. OTHER SERVICES* $804,895 53.0% 586 $1,374
EXPEND. TRAINING $577,741 38.0% 431 $1,340
REGION 14 AMOUNT % OF
TOTAL TOTAL
SERVED COST PER
PARTICIPANT TOTAL w. POS.
OUTCOME COST PER POS.
OUTCOME
TOTAL AVAIL. $2,277,947 100.0%
TOTAL EXPEND. $2,265,521 99.5% 3,000 $755 2,275 $996
EXPEND. OTHER SERVICES** $813,095 35.9% 3,000 $271
EXPEND. TRAINING $1,427,419 63.0% 2,646 $539
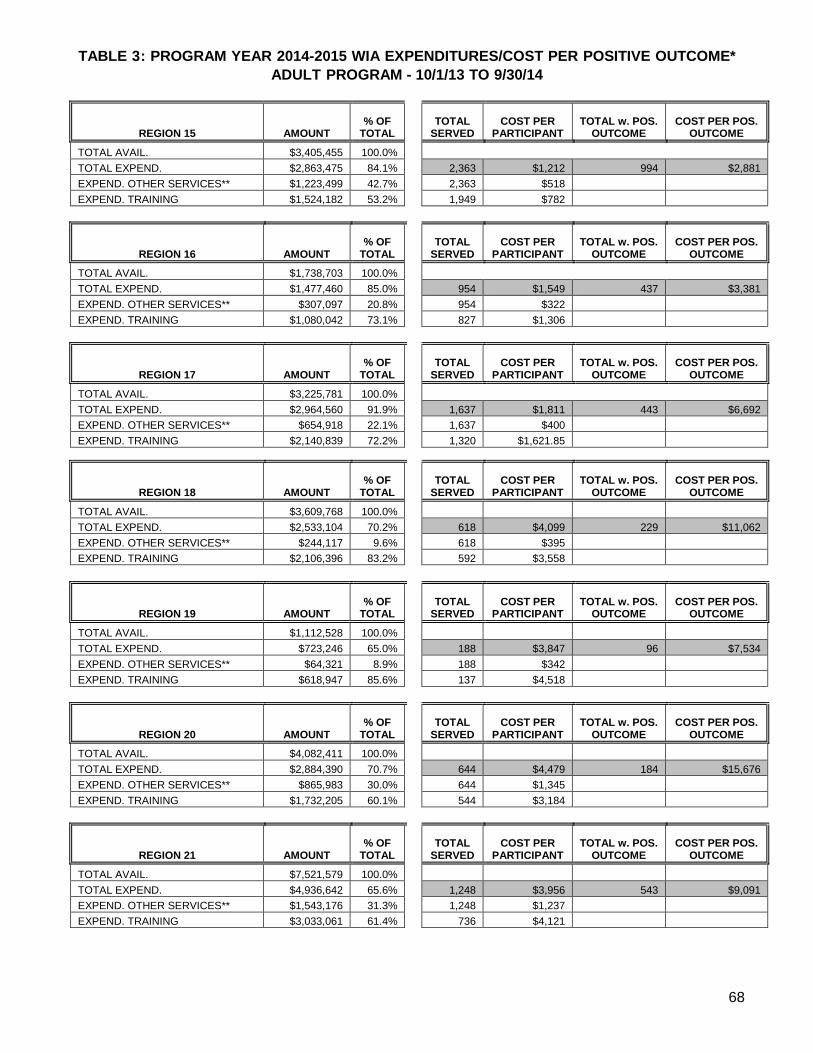
TABLE 3: PROGRAM YEAR 2014-2015 WIA EXPENDITURES/COST PER POSITIVE OUTCOME*
ADULT PROGRAM - 10/1/13 TO 9/30/14
68
REGION 15 AMOUNT % OF
TOTAL TOTAL
SERVED COST PER
PARTICIPANT TOTAL w. POS.
OUTCOME COST PER POS.
OUTCOME
TOTAL AVAIL. $3,405,455 100.0%
TOTAL EXPEND. $2,863,475 84.1% 2,363 $1,212 994 $2,881
EXPEND. OTHER SERVICES** $1,223,499 42.7% 2,363 $518
EXPEND. TRAINING $1,524,182 53.2% 1,949 $782
REGION 16 AMOUNT % OF
TOTAL TOTAL
SERVED COST PER
PARTICIPANT TOTAL w. POS.
OUTCOME COST PER POS.
OUTCOME
TOTAL AVAIL. $1,738,703 100.0%
TOTAL EXPEND. $1,477,460 85.0% 954 $1,549 437 $3,381
EXPEND. OTHER SERVICES** $307,097 20.8% 954 $322
EXPEND. TRAINING $1,080,042 73.1% 827 $1,306
REGION 17 AMOUNT % OF
TOTAL TOTAL
SERVED COST PER
PARTICIPANT TOTAL w. POS.
OUTCOME COST PER POS.
OUTCOME
TOTAL AVAIL. $3,225,781 100.0%
TOTAL EXPEND. $2,964,560 91.9% 1,637 $1,811 443 $6,692
EXPEND. OTHER SERVICES** $654,918 22.1% 1,637 $400
EXPEND. TRAINING $2,140,839 72.2% 1,320 $1,621.85
REGION 18 AMOUNT % OF
TOTAL TOTAL
SERVED COST PER
PARTICIPANT TOTAL w. POS.
OUTCOME COST PER POS.
OUTCOME
TOTAL AVAIL. $3,609,768 100.0%
TOTAL EXPEND. $2,533,104 70.2% 618 $4,099 229 $11,062
EXPEND. OTHER SERVICES** $244,117 9.6% 618 $395
EXPEND. TRAINING $2,106,396 83.2% 592 $3,558
REGION 19 AMOUNT % OF
TOTAL TOTAL
SERVED COST PER
PARTICIPANT TOTAL w. POS.
OUTCOME COST PER POS.
OUTCOME
TOTAL AVAIL. $1,112,528 100.0%
TOTAL EXPEND. $723,246 65.0% 188 $3,847 96 $7,534
EXPEND. OTHER SERVICES** $64,321 8.9% 188 $342
EXPEND. TRAINING $618,947 85.6% 137 $4,518
REGION 20 AMOUNT % OF
TOTAL TOTAL
SERVED COST PER
PARTICIPANT TOTAL w. POS.
OUTCOME COST PER POS.
OUTCOME
TOTAL AVAIL. $4,082,411 100.0%
TOTAL EXPEND. $2,884,390 70.7% 644 $4,479 184 $15,676
EXPEND. OTHER SERVICES** $865,983 30.0% 644 $1,345
EXPEND. TRAINING $1,732,205 60.1% 544 $3,184
REGION 21 AMOUNT % OF
TOTAL TOTAL
SERVED COST PER
PARTICIPANT TOTAL w. POS.
OUTCOME COST PER POS.
OUTCOME
TOTAL AVAIL. $7,521,579 100.0%
TOTAL EXPEND. $4,936,642 65.6% 1,248 $3,956 543 $9,091
EXPEND. OTHER SERVICES** $1,543,176 31.3% 1,248 $1,237
EXPEND. TRAINING $3,033,061 61.4% 736 $4,121
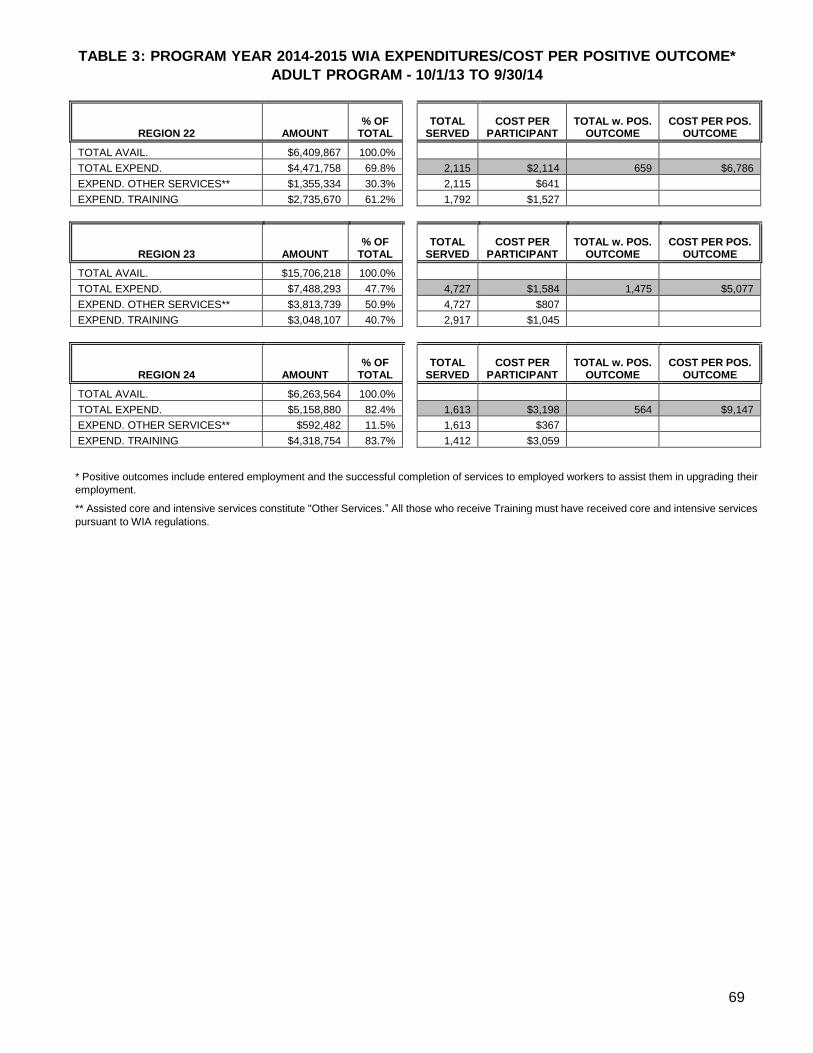
TABLE 3: PROGRAM YEAR 2014-2015 WIA EXPENDITURES/COST PER POSITIVE OUTCOME*
ADULT PROGRAM - 10/1/13 TO 9/30/14
69
REGION 22 AMOUNT % OF
TOTAL TOTAL
SERVED COST PER
PARTICIPANT TOTAL w. POS.
OUTCOME COST PER POS.
OUTCOME
TOTAL AVAIL. $6,409,867 100.0%
TOTAL EXPEND. $4,471,758 69.8% 2,115 $2,114 659 $6,786
EXPEND. OTHER SERVICES** $1,355,334 30.3% 2,115 $641
EXPEND. TRAINING $2,735,670 61.2% 1,792 $1,527
REGION 23 AMOUNT % OF
TOTAL TOTAL
SERVED COST PER
PARTICIPANT TOTAL w. POS.
OUTCOME COST PER POS.
OUTCOME
TOTAL AVAIL. $15,706,218 100.0%
TOTAL EXPEND. $7,488,293 47.7% 4,727 $1,584 1,475 $5,077
EXPEND. OTHER SERVICES** $3,813,739 50.9% 4,727 $807
EXPEND. TRAINING $3,048,107 40.7% 2,917 $1,045
REGION 24 AMOUNT % OF
TOTAL TOTAL
SERVED COST PER
PARTICIPANT TOTAL w. POS.
OUTCOME COST PER POS.
OUTCOME
TOTAL AVAIL. $6,263,564 100.0%
TOTAL EXPEND. $5,158,880 82.4% 1,613 $3,198 564 $9,147
EXPEND. OTHER SERVICES** $592,482 11.5% 1,613 $367
EXPEND. TRAINING $4,318,754 83.7% 1,412 $3,059
* Positive outcomes include entered employment and the successful completion of services to employed workers to assist them in upgrading their
employment.
** Assisted core and intensive services constitute "Other Services.” All those who receive Training must have received core and intensive services
pursuant to WIA regulations.
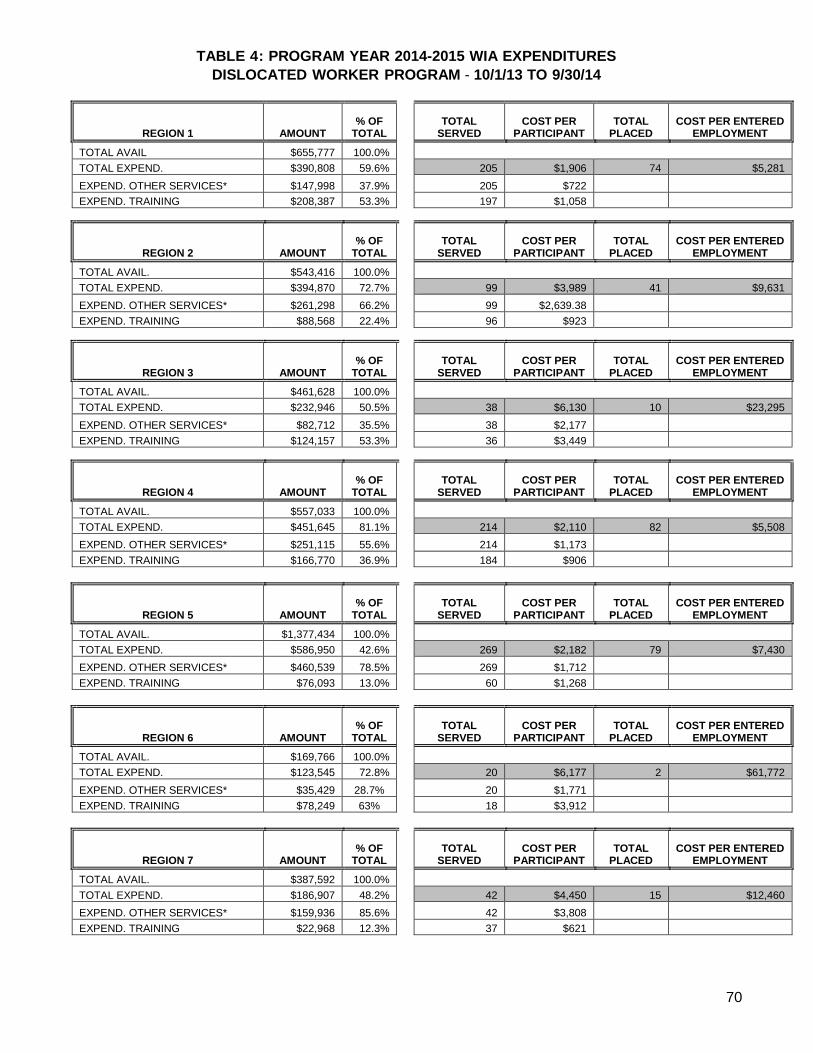
TABLE 4: PROGRAM YEAR 2014-2015 WIA EXPENDITURES
DISLOCATED WORKER PROGRAM - 10/1/13 TO 9/30/14
70
REGION 1 AMOUNT % OF
TOTAL TOTAL
SERVED COST PER
PARTICIPANT TOTAL
PLACED COST PER ENTERED
EMPLOYMENT
TOTAL AVAIL $655,777 100.0%
TOTAL EXPEND. $390,808 59.6% 205 $1,906 74 $5,281
EXPEND. OTHER SERVICES* $147,998 37.9% 205 $722
EXPEND. TRAINING $208,387 53.3% 197 $1,058
REGION 2 AMOUNT % OF
TOTAL TOTAL
SERVED COST PER
PARTICIPANT TOTAL
PLACED COST PER ENTERED
EMPLOYMENT
TOTAL AVAIL. $543,416 100.0%
TOTAL EXPEND. $394,870 72.7% 99 $3,989 41 $9,631
EXPEND. OTHER SERVICES* $261,298 66.2% 99 $2,639.38
EXPEND. TRAINING $88,568 22.4% 96 $923
REGION 3 AMOUNT % OF
TOTAL TOTAL
SERVED COST PER
PARTICIPANT TOTAL
PLACED COST PER ENTERED
EMPLOYMENT
TOTAL AVAIL. $461,628 100.0%
TOTAL EXPEND. $232,946 50.5% 38 $6,130 10 $23,295
EXPEND. OTHER SERVICES* $82,712 35.5% 38 $2,177
EXPEND. TRAINING $124,157 53.3% 36 $3,449
REGION 4 AMOUNT % OF
TOTAL TOTAL
SERVED COST PER
PARTICIPANT TOTAL
PLACED COST PER ENTERED
EMPLOYMENT
TOTAL AVAIL. $557,033 100.0%
TOTAL EXPEND. $451,645 81.1% 214 $2,110 82 $5,508
EXPEND. OTHER SERVICES* $251,115 55.6% 214 $1,173
EXPEND. TRAINING $166,770 36.9% 184 $906
REGION 5 AMOUNT % OF
TOTAL TOTAL
SERVED COST PER
PARTICIPANT TOTAL
PLACED COST PER ENTERED
EMPLOYMENT
TOTAL AVAIL. $1,377,434 100.0%
TOTAL EXPEND. $586,950 42.6% 269 $2,182 79 $7,430
EXPEND. OTHER SERVICES* $460,539 78.5% 269 $1,712
EXPEND. TRAINING $76,093 13.0% 60 $1,268
REGION 6 AMOUNT % OF
TOTAL TOTAL
SERVED COST PER
PARTICIPANT TOTAL
PLACED COST PER ENTERED
EMPLOYMENT
TOTAL AVAIL. $169,766 100.0%
TOTAL EXPEND. $123,545 72.8% 20 $6,177 2 $61,772
EXPEND. OTHER SERVICES* $35,429 28.7% 20 $1,771
EXPEND. TRAINING $78,249 63% 18 $3,912
REGION 7 AMOUNT % OF
TOTAL TOTAL
SERVED COST PER
PARTICIPANT TOTAL
PLACED COST PER ENTERED
EMPLOYMENT
TOTAL AVAIL. $387,592 100.0%
TOTAL EXPEND. $186,907 48.2% 42 $4,450 15 $12,460
EXPEND. OTHER SERVICES* $159,936 85.6% 42 $3,808
EXPEND. TRAINING $22,968 12.3% 37 $621
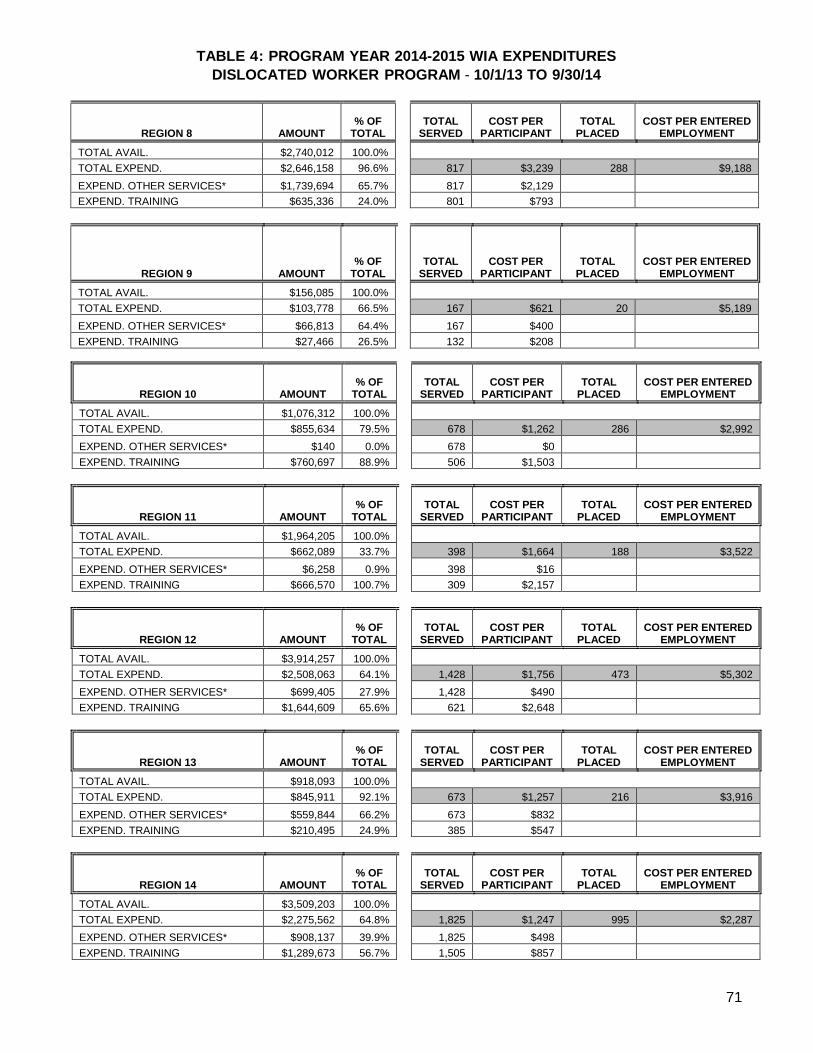
TABLE 4: PROGRAM YEAR 2014-2015 WIA EXPENDITURES
DISLOCATED WORKER PROGRAM - 10/1/13 TO 9/30/14
71
REGION 8 AMOUNT % OF
TOTAL TOTAL
SERVED COST PER
PARTICIPANT TOTAL
PLACED COST PER ENTERED
EMPLOYMENT
TOTAL AVAIL. $2,740,012 100.0%
TOTAL EXPEND. $2,646,158 96.6% 817 $3,239 288 $9,188
EXPEND. OTHER SERVICES* $1,739,694 65.7% 817 $2,129
EXPEND. TRAINING $635,336 24.0% 801 $793
REGION 9 AMOUNT % OF
TOTAL TOTAL
SERVED COST PER
PARTICIPANT TOTAL
PLACED COST PER ENTERED
EMPLOYMENT
TOTAL AVAIL. $156,085 100.0%
TOTAL EXPEND. $103,778 66.5% 167 $621 20 $5,189
EXPEND. OTHER SERVICES* $66,813 64.4% 167 $400
EXPEND. TRAINING $27,466 26.5% 132 $208
REGION 10 AMOUNT % OF
TOTAL TOTAL
SERVED COST PER
PARTICIPANT TOTAL
PLACED COST PER ENTERED
EMPLOYMENT
TOTAL AVAIL. $1,076,312 100.0%
TOTAL EXPEND. $855,634 79.5% 678 $1,262 286 $2,992
EXPEND. OTHER SERVICES* $140 0.0% 678 $0
EXPEND. TRAINING $760,697 88.9% 506 $1,503
REGION 11 AMOUNT % OF
TOTAL TOTAL
SERVED COST PER
PARTICIPANT TOTAL
PLACED COST PER ENTERED
EMPLOYMENT
TOTAL AVAIL. $1,964,205 100.0%
TOTAL EXPEND. $662,089 33.7% 398 $1,664 188 $3,522
EXPEND. OTHER SERVICES* $6,258 0.9% 398 $16
EXPEND. TRAINING $666,570 100.7% 309 $2,157
REGION 12 AMOUNT % OF
TOTAL TOTAL
SERVED COST PER
PARTICIPANT TOTAL
PLACED COST PER ENTERED
EMPLOYMENT
TOTAL AVAIL. $3,914,257 100.0%
TOTAL EXPEND. $2,508,063 64.1% 1,428 $1,756 473 $5,302
EXPEND. OTHER SERVICES* $699,405 27.9% 1,428 $490
EXPEND. TRAINING $1,644,609 65.6% 621 $2,648
REGION 13 AMOUNT % OF
TOTAL TOTAL
SERVED COST PER
PARTICIPANT TOTAL
PLACED COST PER ENTERED
EMPLOYMENT
TOTAL AVAIL. $918,093 100.0%
TOTAL EXPEND. $845,911 92.1% 673 $1,257 216 $3,916
EXPEND. OTHER SERVICES* $559,844 66.2% 673 $832
EXPEND. TRAINING $210,495 24.9% 385 $547
REGION 14 AMOUNT % OF
TOTAL TOTAL
SERVED COST PER
PARTICIPANT TOTAL
PLACED COST PER ENTERED
EMPLOYMENT
TOTAL AVAIL. $3,509,203 100.0%
TOTAL EXPEND. $2,275,562 64.8% 1,825 $1,247 995 $2,287
EXPEND. OTHER SERVICES* $908,137 39.9% 1,825 $498
EXPEND. TRAINING $1,289,673 56.7% 1,505 $857
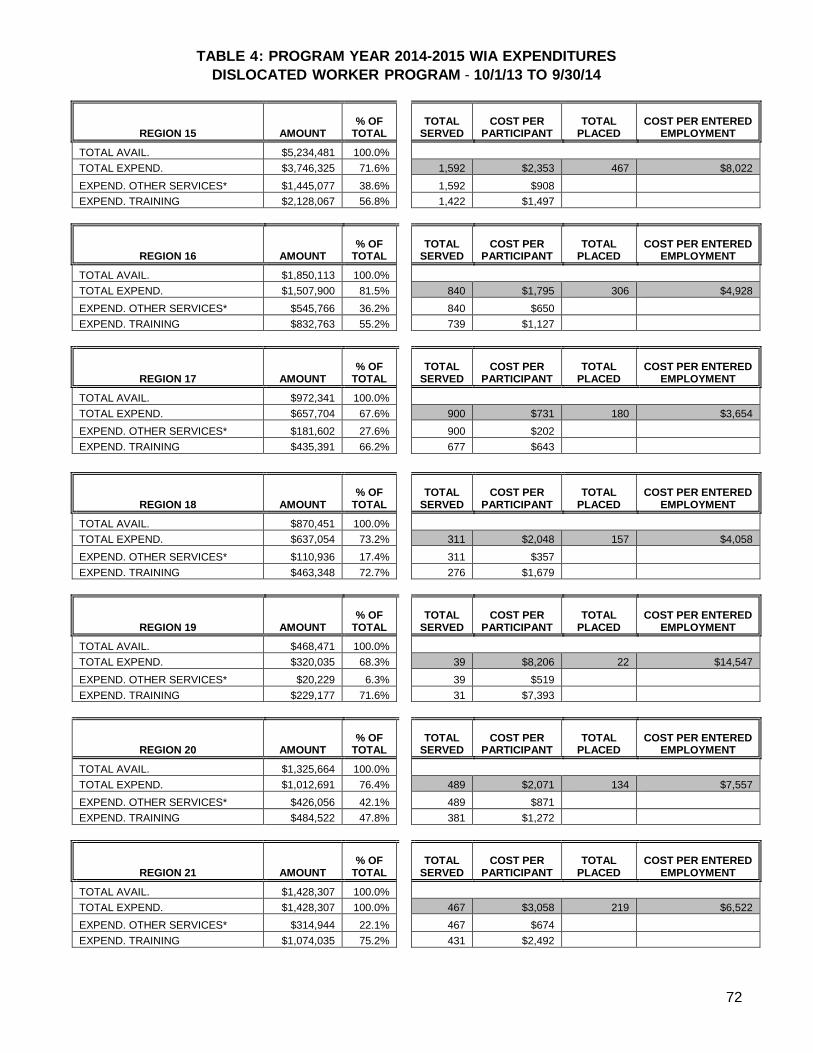
TABLE 4: PROGRAM YEAR 2014-2015 WIA EXPENDITURES
DISLOCATED WORKER PROGRAM - 10/1/13 TO 9/30/14
72
REGION 15 AMOUNT % OF
TOTAL TOTAL
SERVED COST PER
PARTICIPANT TOTAL
PLACED COST PER ENTERED
EMPLOYMENT
TOTAL AVAIL. $5,234,481 100.0%
TOTAL EXPEND. $3,746,325 71.6% 1,592 $2,353 467 $8,022
EXPEND. OTHER SERVICES* $1,445,077 38.6% 1,592 $908
EXPEND. TRAINING $2,128,067 56.8% 1,422 $1,497
REGION 16 AMOUNT % OF
TOTAL TOTAL
SERVED COST PER
PARTICIPANT TOTAL
PLACED COST PER ENTERED
EMPLOYMENT
TOTAL AVAIL. $1,850,113 100.0%
TOTAL EXPEND. $1,507,900 81.5% 840 $1,795 306 $4,928
EXPEND. OTHER SERVICES* $545,766 36.2% 840 $650
EXPEND. TRAINING $832,763 55.2% 739 $1,127
REGION 17 AMOUNT % OF
TOTAL TOTAL
SERVED COST PER
PARTICIPANT TOTAL
PLACED COST PER ENTERED
EMPLOYMENT
TOTAL AVAIL. $972,341 100.0%
TOTAL EXPEND. $657,704 67.6% 900 $731 180 $3,654
EXPEND. OTHER SERVICES* $181,602 27.6% 900 $202
EXPEND. TRAINING $435,391 66.2% 677 $643
REGION 18 AMOUNT % OF
TOTAL TOTAL
SERVED COST PER
PARTICIPANT TOTAL
PLACED COST PER ENTERED
EMPLOYMENT
TOTAL AVAIL. $870,451 100.0%
TOTAL EXPEND. $637,054 73.2% 311 $2,048 157 $4,058
EXPEND. OTHER SERVICES* $110,936 17.4% 311 $357
EXPEND. TRAINING $463,348 72.7% 276 $1,679
REGION 19 AMOUNT % OF
TOTAL TOTAL
SERVED COST PER
PARTICIPANT TOTAL
PLACED COST PER ENTERED
EMPLOYMENT
TOTAL AVAIL. $468,471 100.0%
TOTAL EXPEND. $320,035 68.3% 39 $8,206 22 $14,547
EXPEND. OTHER SERVICES* $20,229 6.3% 39 $519
EXPEND. TRAINING $229,177 71.6% 31 $7,393
REGION 20 AMOUNT % OF
TOTAL TOTAL
SERVED COST PER
PARTICIPANT TOTAL
PLACED COST PER ENTERED
EMPLOYMENT
TOTAL AVAIL. $1,325,664 100.0%
TOTAL EXPEND. $1,012,691 76.4% 489 $2,071 134 $7,557
EXPEND. OTHER SERVICES* $426,056 42.1% 489 $871
EXPEND. TRAINING $484,522 47.8% 381 $1,272
REGION 21 AMOUNT % OF
TOTAL TOTAL
SERVED COST PER
PARTICIPANT TOTAL
PLACED COST PER ENTERED
EMPLOYMENT
TOTAL AVAIL. $1,428,307 100.0%
TOTAL EXPEND. $1,428,307 100.0% 467 $3,058 219 $6,522
EXPEND. OTHER SERVICES* $314,944 22.1% 467 $674
EXPEND. TRAINING $1,074,035 75.2% 431 $2,492
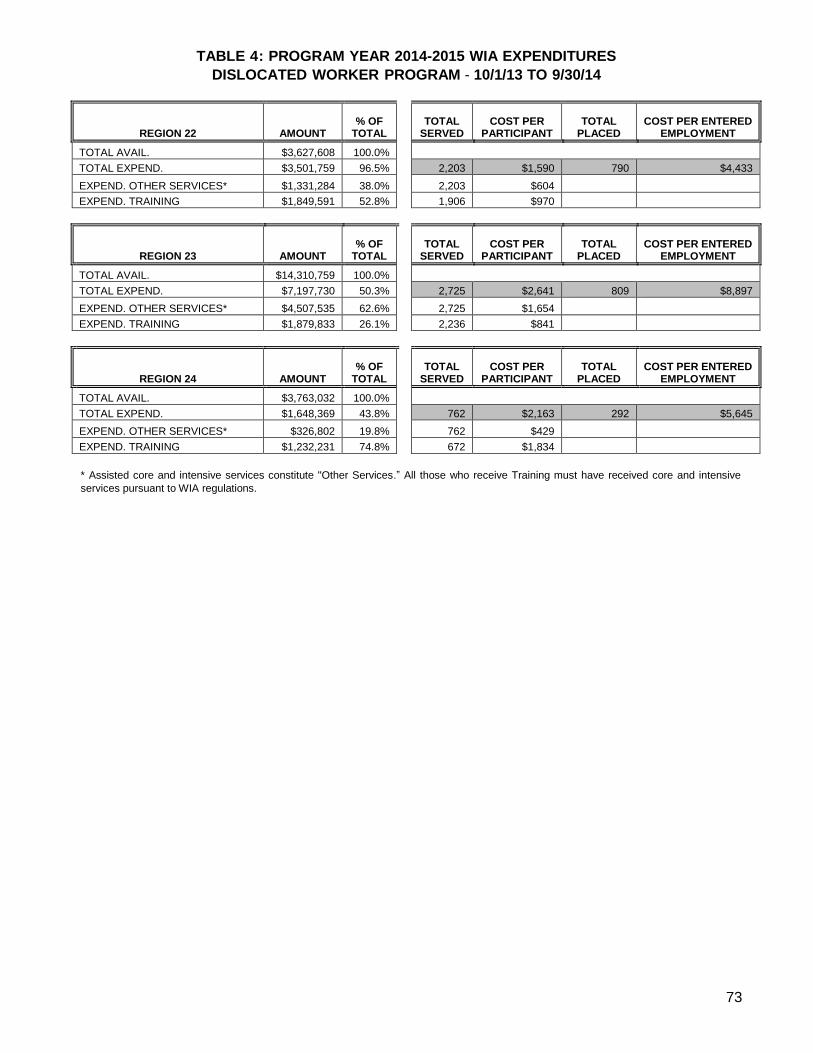
TABLE 4: PROGRAM YEAR 2014-2015 WIA EXPENDITURES
DISLOCATED WORKER PROGRAM - 10/1/13 TO 9/30/14
73
REGION 22 AMOUNT % OF
TOTAL TOTAL
SERVED COST PER
PARTICIPANT TOTAL
PLACED COST PER ENTERED
EMPLOYMENT
TOTAL AVAIL. $3,627,608 100.0%
TOTAL EXPEND. $3,501,759 96.5% 2,203 $1,590 790 $4,433
EXPEND. OTHER SERVICES* $1,331,284 38.0% 2,203 $604
EXPEND. TRAINING $1,849,591 52.8% 1,906 $970
REGION 23 AMOUNT % OF
TOTAL TOTAL
SERVED COST PER
PARTICIPANT TOTAL
PLACED COST PER ENTERED
EMPLOYMENT
TOTAL AVAIL. $14,310,759 100.0%
TOTAL EXPEND. $7,197,730 50.3% 2,725 $2,641 809 $8,897
EXPEND. OTHER SERVICES* $4,507,535 62.6% 2,725 $1,654
EXPEND. TRAINING $1,879,833 26.1% 2,236 $841
REGION 24 AMOUNT % OF
TOTAL TOTAL
SERVED COST PER
PARTICIPANT TOTAL
PLACED COST PER ENTERED
EMPLOYMENT
TOTAL AVAIL. $3,763,032 100.0%
TOTAL EXPEND. $1,648,369 43.8% 762 $2,163 292 $5,645
EXPEND. OTHER SERVICES* $326,802 19.8% 762 $429
EXPEND. TRAINING $1,232,231 74.8% 672 $1,834
* Assisted core and intensive services constitute "Other Services.” All those who receive Training must have received core and intensive
services pursuant to WIA regulations.
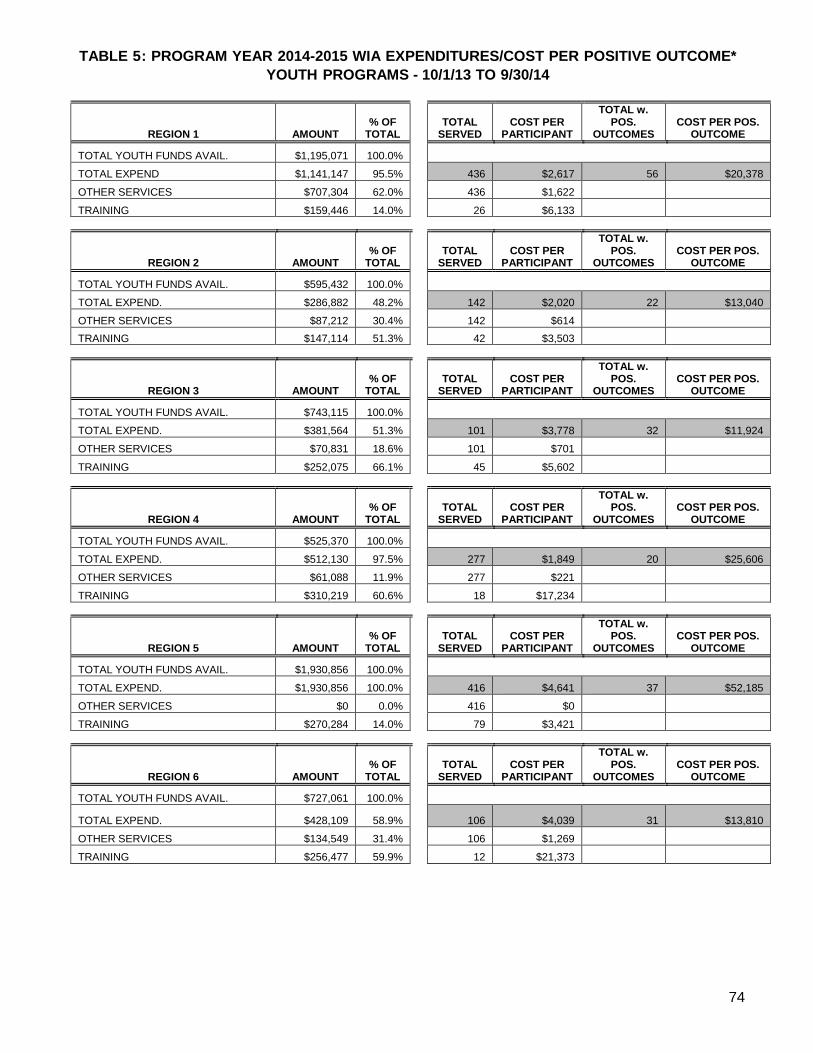
TABLE 5: PROGRAM YEAR 2014-2015 WIA EXPENDITURES/COST PER POSITIVE OUTCOME*
YOUTH PROGRAMS - 10/1/13 TO 9/30/14
74
REGION 1 AMOUNT % OF
TOTAL TOTAL
SERVED COST PER
PARTICIPANT
TOTAL w. POS.
OUTCOMES COST PER POS.
OUTCOME
TOTAL YOUTH FUNDS AVAIL. $1,195,071 100.0%
TOTAL EXPEND $1,141,147 95.5% 436 $2,617 56 $20,378
OTHER SERVICES $707,304 62.0% 436 $1,622
TRAINING $159,446 14.0% 26 $6,133
REGION 2 AMOUNT % OF
TOTAL TOTAL
SERVED COST PER
PARTICIPANT
TOTAL w. POS.
OUTCOMES COST PER POS.
OUTCOME
TOTAL YOUTH FUNDS AVAIL. $595,432 100.0%
TOTAL EXPEND. $286,882 48.2% 142 $2,020 22 $13,040
OTHER SERVICES $87,212 30.4% 142 $614
TRAINING $147,114 51.3% 42 $3,503
REGION 3 AMOUNT % OF
TOTAL TOTAL
SERVED COST PER
PARTICIPANT
TOTAL w. POS.
OUTCOMES COST PER POS.
OUTCOME
TOTAL YOUTH FUNDS AVAIL. $743,115 100.0%
TOTAL EXPEND. $381,564 51.3% 101 $3,778 32 $11,924
OTHER SERVICES $70,831 18.6% 101 $701
TRAINING $252,075 66.1% 45 $5,602
REGION 4 AMOUNT % OF
TOTAL TOTAL
SERVED COST PER
PARTICIPANT
TOTAL w. POS.
OUTCOMES COST PER POS.
OUTCOME
TOTAL YOUTH FUNDS AVAIL. $525,370 100.0%
TOTAL EXPEND. $512,130 97.5% 277 $1,849 20 $25,606
OTHER SERVICES $61,088 11.9% 277 $221
TRAINING $310,219 60.6% 18 $17,234
REGION 5 AMOUNT % OF
TOTAL TOTAL
SERVED COST PER
PARTICIPANT
TOTAL w. POS.
OUTCOMES COST PER POS.
OUTCOME
TOTAL YOUTH FUNDS AVAIL. $1,930,856 100.0%
TOTAL EXPEND. $1,930,856 100.0% 416 $4,641 37 $52,185
OTHER SERVICES $0 0.0% 416 $0
TRAINING $270,284 14.0% 79 $3,421
REGION 6 AMOUNT % OF
TOTAL TOTAL
SERVED COST PER
PARTICIPANT
TOTAL w. POS.
OUTCOMES COST PER POS.
OUTCOME
TOTAL YOUTH FUNDS AVAIL. $727,061 100.0%
TOTAL EXPEND. $428,109 58.9% 106 $4,039 31 $13,810
OTHER SERVICES $134,549 31.4% 106 $1,269
TRAINING $256,477 59.9% 12 $21,373
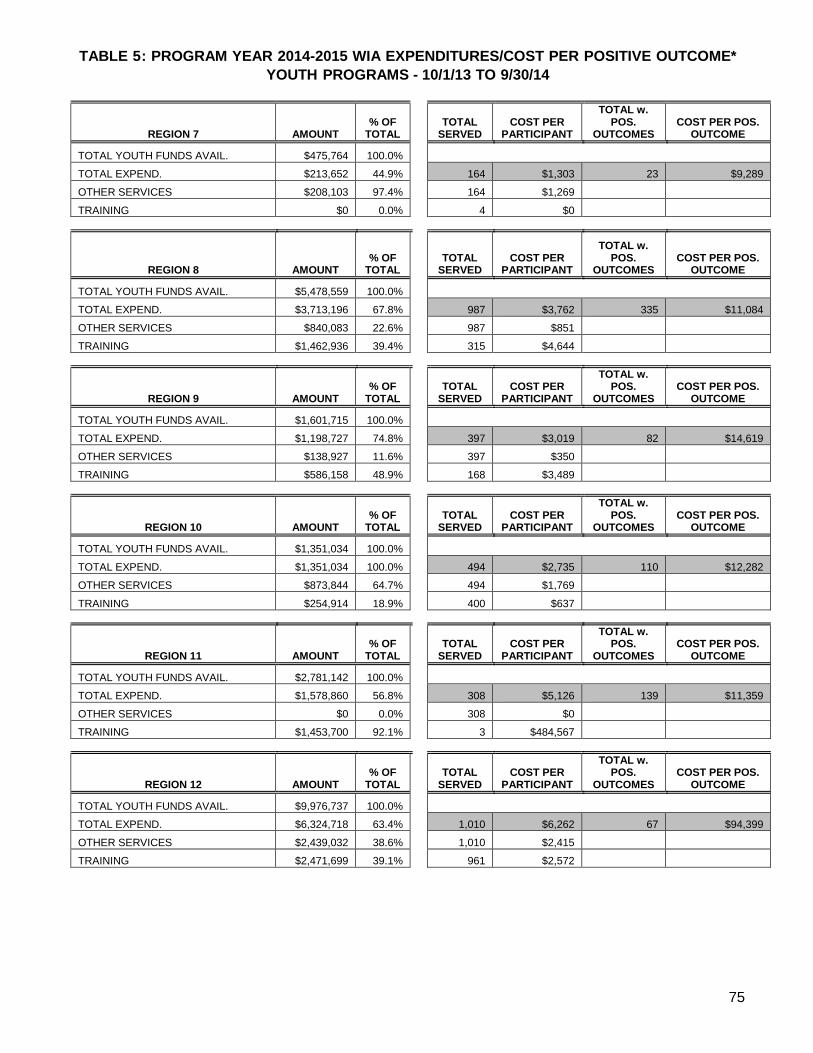
TABLE 5: PROGRAM YEAR 2014-2015 WIA EXPENDITURES/COST PER POSITIVE OUTCOME*
YOUTH PROGRAMS - 10/1/13 TO 9/30/14
75
REGION 7 AMOUNT % OF
TOTAL TOTAL
SERVED COST PER
PARTICIPANT
TOTAL w. POS.
OUTCOMES COST PER POS.
OUTCOME
TOTAL YOUTH FUNDS AVAIL. $475,764 100.0%
TOTAL EXPEND. $213,652 44.9% 164 $1,303 23 $9,289
OTHER SERVICES $208,103 97.4% 164 $1,269
TRAINING $0 0.0% 4 $0
REGION 8 AMOUNT % OF
TOTAL TOTAL
SERVED COST PER
PARTICIPANT
TOTAL w. POS.
OUTCOMES COST PER POS.
OUTCOME
TOTAL YOUTH FUNDS AVAIL. $5,478,559 100.0%
TOTAL EXPEND. $3,713,196 67.8% 987 $3,762 335 $11,084
OTHER SERVICES $840,083 22.6% 987 $851
TRAINING $1,462,936 39.4% 315 $4,644
REGION 9 AMOUNT % OF
TOTAL TOTAL
SERVED COST PER
PARTICIPANT
TOTAL w. POS.
OUTCOMES COST PER POS.
OUTCOME
TOTAL YOUTH FUNDS AVAIL. $1,601,715 100.0%
TOTAL EXPEND. $1,198,727 74.8% 397 $3,019 82 $14,619
OTHER SERVICES $138,927 11.6% 397 $350
TRAINING $586,158 48.9% 168 $3,489
REGION 10 AMOUNT % OF
TOTAL TOTAL
SERVED COST PER
PARTICIPANT
TOTAL w. POS.
OUTCOMES COST PER POS.
OUTCOME
TOTAL YOUTH FUNDS AVAIL. $1,351,034 100.0%
TOTAL EXPEND. $1,351,034 100.0% 494 $2,735 110 $12,282
OTHER SERVICES $873,844 64.7% 494 $1,769
TRAINING $254,914 18.9% 400 $637
REGION 11 AMOUNT % OF
TOTAL TOTAL
SERVED COST PER
PARTICIPANT
TOTAL w. POS.
OUTCOMES COST PER POS.
OUTCOME
TOTAL YOUTH FUNDS AVAIL. $2,781,142 100.0%
TOTAL EXPEND. $1,578,860 56.8% 308 $5,126 139 $11,359
OTHER SERVICES $0 0.0% 308 $0
TRAINING $1,453,700 92.1% 3 $484,567
REGION 12 AMOUNT % OF
TOTAL TOTAL
SERVED COST PER
PARTICIPANT
TOTAL w. POS.
OUTCOMES COST PER POS.
OUTCOME
TOTAL YOUTH FUNDS AVAIL. $9,976,737 100.0%
TOTAL EXPEND. $6,324,718 63.4% 1,010 $6,262 67 $94,399
OTHER SERVICES $2,439,032 38.6% 1,010 $2,415
TRAINING $2,471,699 39.1% 961 $2,572
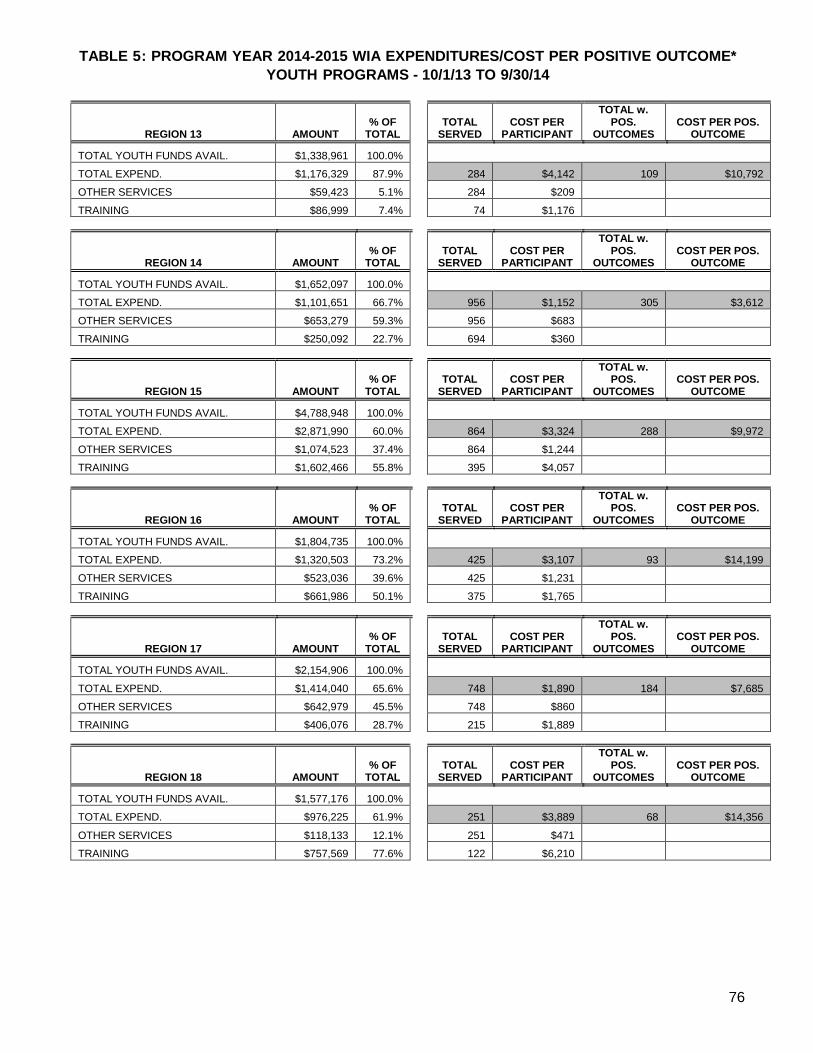
TABLE 5: PROGRAM YEAR 2014-2015 WIA EXPENDITURES/COST PER POSITIVE OUTCOME*
YOUTH PROGRAMS - 10/1/13 TO 9/30/14
76
REGION 13 AMOUNT % OF
TOTAL TOTAL
SERVED COST PER
PARTICIPANT
TOTAL w. POS.
OUTCOMES COST PER POS.
OUTCOME
TOTAL YOUTH FUNDS AVAIL. $1,338,961 100.0%
TOTAL EXPEND. $1,176,329 87.9% 284 $4,142 109 $10,792
OTHER SERVICES $59,423 5.1% 284 $209
TRAINING $86,999 7.4% 74 $1,176
REGION 14 AMOUNT % OF
TOTAL TOTAL
SERVED COST PER
PARTICIPANT
TOTAL w. POS.
OUTCOMES COST PER POS.
OUTCOME
TOTAL YOUTH FUNDS AVAIL. $1,652,097 100.0%
TOTAL EXPEND. $1,101,651 66.7% 956 $1,152 305 $3,612
OTHER SERVICES $653,279 59.3% 956 $683
TRAINING $250,092 22.7% 694 $360
REGION 15 AMOUNT % OF
TOTAL TOTAL
SERVED COST PER
PARTICIPANT
TOTAL w. POS.
OUTCOMES COST PER POS.
OUTCOME
TOTAL YOUTH FUNDS AVAIL. $4,788,948 100.0%
TOTAL EXPEND. $2,871,990 60.0% 864 $3,324 288 $9,972
OTHER SERVICES $1,074,523 37.4% 864 $1,244
TRAINING $1,602,466 55.8% 395 $4,057
REGION 16 AMOUNT % OF
TOTAL TOTAL
SERVED COST PER
PARTICIPANT
TOTAL w. POS.
OUTCOMES COST PER POS.
OUTCOME
TOTAL YOUTH FUNDS AVAIL. $1,804,735 100.0%
TOTAL EXPEND. $1,320,503 73.2% 425 $3,107 93 $14,199
OTHER SERVICES $523,036 39.6% 425 $1,231
TRAINING $661,986 50.1% 375 $1,765
REGION 17 AMOUNT % OF
TOTAL TOTAL
SERVED COST PER
PARTICIPANT
TOTAL w. POS.
OUTCOMES COST PER POS.
OUTCOME
TOTAL YOUTH FUNDS AVAIL. $2,154,906 100.0%
TOTAL EXPEND. $1,414,040 65.6% 748 $1,890 184 $7,685
OTHER SERVICES $642,979 45.5% 748 $860
TRAINING $406,076 28.7% 215 $1,889
REGION 18 AMOUNT % OF
TOTAL TOTAL
SERVED COST PER
PARTICIPANT
TOTAL w. POS.
OUTCOMES COST PER POS.
OUTCOME
TOTAL YOUTH FUNDS AVAIL. $1,577,176 100.0%
TOTAL EXPEND. $976,225 61.9% 251 $3,889 68 $14,356
OTHER SERVICES $118,133 12.1% 251 $471
TRAINING $757,569 77.6% 122 $6,210
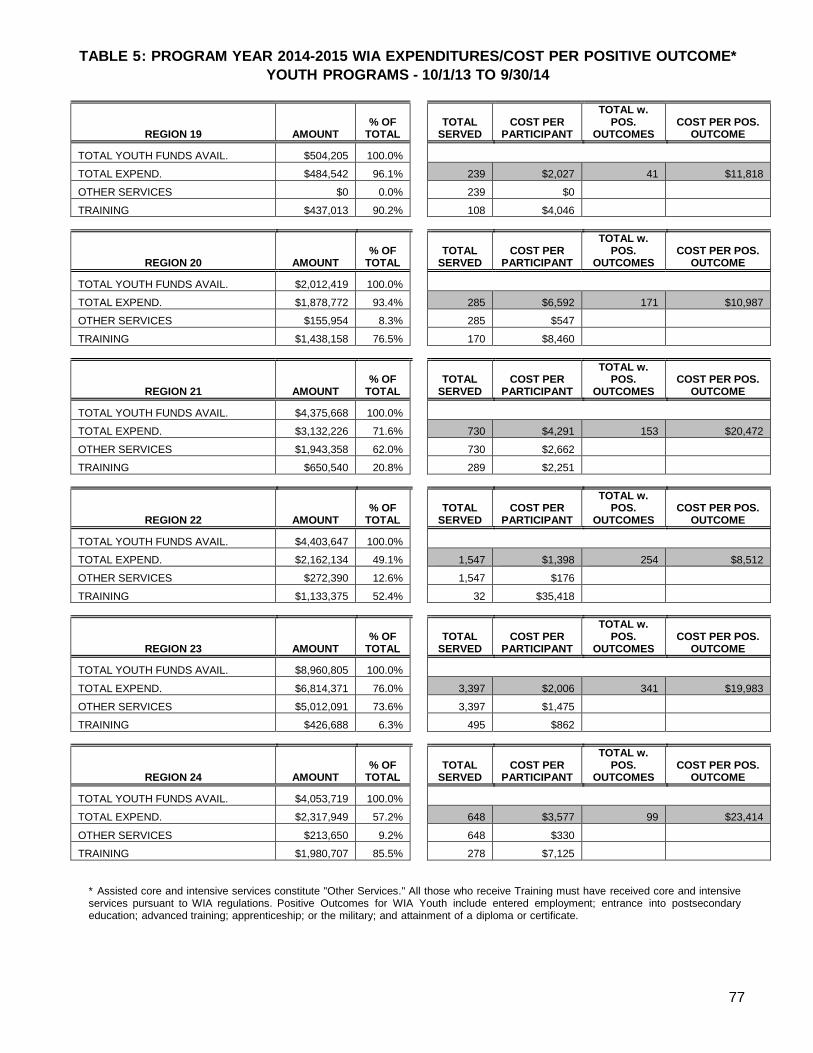
TABLE 5: PROGRAM YEAR 2014-2015 WIA EXPENDITURES/COST PER POSITIVE OUTCOME*
YOUTH PROGRAMS - 10/1/13 TO 9/30/14
77
REGION 19 AMOUNT % OF
TOTAL TOTAL
SERVED COST PER
PARTICIPANT
TOTAL w. POS.
OUTCOMES COST PER POS.
OUTCOME
TOTAL YOUTH FUNDS AVAIL. $504,205 100.0%
TOTAL EXPEND. $484,542 96.1% 239 $2,027 41 $11,818
OTHER SERVICES $0 0.0% 239 $0
TRAINING $437,013 90.2% 108 $4,046
REGION 20 AMOUNT % OF
TOTAL TOTAL
SERVED COST PER
PARTICIPANT
TOTAL w. POS.
OUTCOMES COST PER POS.
OUTCOME
TOTAL YOUTH FUNDS AVAIL. $2,012,419 100.0%
TOTAL EXPEND. $1,878,772 93.4% 285 $6,592 171 $10,987
OTHER SERVICES $155,954 8.3% 285 $547
TRAINING $1,438,158 76.5% 170 $8,460
REGION 21 AMOUNT % OF
TOTAL TOTAL
SERVED COST PER
PARTICIPANT
TOTAL w. POS.
OUTCOMES COST PER POS.
OUTCOME
TOTAL YOUTH FUNDS AVAIL. $4,375,668 100.0%
TOTAL EXPEND. $3,132,226 71.6% 730 $4,291 153 $20,472
OTHER SERVICES $1,943,358 62.0% 730 $2,662
TRAINING $650,540 20.8% 289 $2,251
REGION 22 AMOUNT % OF
TOTAL TOTAL
SERVED COST PER
PARTICIPANT
TOTAL w. POS.
OUTCOMES COST PER POS.
OUTCOME
TOTAL YOUTH FUNDS AVAIL. $4,403,647 100.0%
TOTAL EXPEND. $2,162,134 49.1% 1,547 $1,398 254 $8,512
OTHER SERVICES $272,390 12.6% 1,547 $176
TRAINING $1,133,375 52.4% 32 $35,418
REGION 23 AMOUNT % OF
TOTAL TOTAL
SERVED COST PER
PARTICIPANT
TOTAL w. POS.
OUTCOMES COST PER POS.
OUTCOME
TOTAL YOUTH FUNDS AVAIL. $8,960,805 100.0%
TOTAL EXPEND. $6,814,371 76.0% 3,397 $2,006 341 $19,983
OTHER SERVICES $5,012,091 73.6% 3,397 $1,475
TRAINING $426,688 6.3% 495 $862
REGION 24 AMOUNT % OF
TOTAL TOTAL
SERVED COST PER
PARTICIPANT
TOTAL w. POS.
OUTCOMES COST PER POS.
OUTCOME
TOTAL YOUTH FUNDS AVAIL. $4,053,719 100.0%
TOTAL EXPEND. $2,317,949 57.2% 648 $3,577 99 $23,414
OTHER SERVICES $213,650 9.2% 648 $330
TRAINING $1,980,707 85.5% 278 $7,125
* Assisted core and intensive services constitute "Other Services." All those who receive Training must have received core and intensive services pursuant to WIA regulations. Positive Outcomes for WIA Youth include entered employment; entrance into postsecondary education; advanced training; apprenticeship; or the military; and attainment of a diploma or certificate.
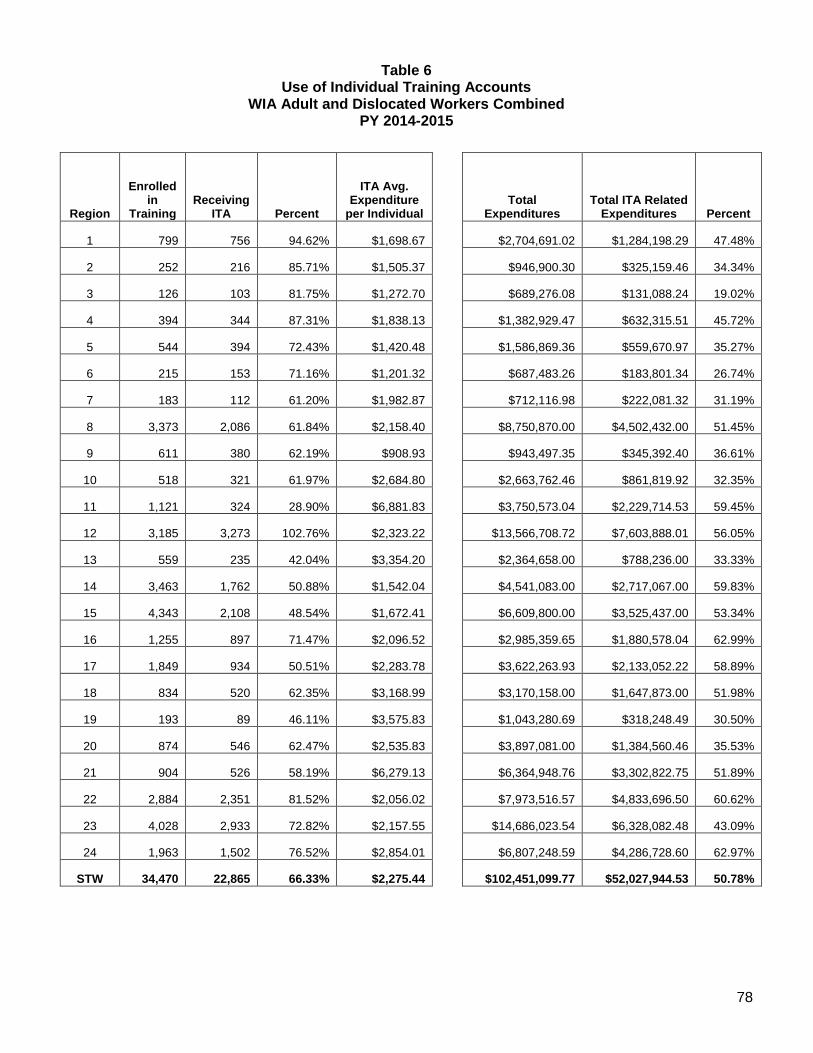
78
Table 6
Use of Individual Training Accounts WIA Adult and Dislocated Workers Combined
PY 2014-2015
Region
Enrolled in
Training Receiving
ITA Percent
ITA Avg. Expenditure
per Individual Total
Expenditures Total ITA Related
Expenditures Percent
1 799 756 94.62% $1,698.67 $2,704,691.02 $1,284,198.29 47.48%
2 252 216 85.71% $1,505.37 $946,900.30 $325,159.46 34.34%
3 126 103 81.75% $1,272.70 $689,276.08 $131,088.24 19.02%
4 394 344 87.31% $1,838.13 $1,382,929.47 $632,315.51 45.72%
5 544 394 72.43% $1,420.48 $1,586,869.36 $559,670.97 35.27%
6 215 153 71.16% $1,201.32 $687,483.26 $183,801.34 26.74%
7 183 112 61.20% $1,982.87 $712,116.98 $222,081.32 31.19%
8 3,373 2,086 61.84% $2,158.40 $8,750,870.00 $4,502,432.00 51.45%
9 611 380 62.19% $908.93 $943,497.35 $345,392.40 36.61%
10 518 321 61.97% $2,684.80 $2,663,762.46 $861,819.92 32.35%
11 1,121 324 28.90% $6,881.83 $3,750,573.04 $2,229,714.53 59.45%
12 3,185 3,273 102.76% $2,323.22 $13,566,708.72 $7,603,888.01 56.05%
13 559 235 42.04% $3,354.20 $2,364,658.00 $788,236.00 33.33%
14 3,463 1,762 50.88% $1,542.04 $4,541,083.00 $2,717,067.00 59.83%
15 4,343 2,108 48.54% $1,672.41 $6,609,800.00 $3,525,437.00 53.34%
16 1,255 897 71.47% $2,096.52 $2,985,359.65 $1,880,578.04 62.99%
17 1,849 934 50.51% $2,283.78 $3,622,263.93 $2,133,052.22 58.89%
18 834 520 62.35% $3,168.99 $3,170,158.00 $1,647,873.00 51.98%
19 193 89 46.11% $3,575.83 $1,043,280.69 $318,248.49 30.50%
20 874 546 62.47% $2,535.83 $3,897,081.00 $1,384,560.46 35.53%
21 904 526 58.19% $6,279.13 $6,364,948.76 $3,302,822.75 51.89%
22 2,884 2,351 81.52% $2,056.02 $7,973,516.57 $4,833,696.50 60.62%
23 4,028 2,933 72.82% $2,157.55 $14,686,023.54 $6,328,082.48 43.09%
24 1,963 1,502 76.52% $2,854.01 $6,807,248.59 $4,286,728.60 62.97%
STW 34,470 22,865 66.33% $2,275.44 $102,451,099.77 $52,027,944.53 50.78%
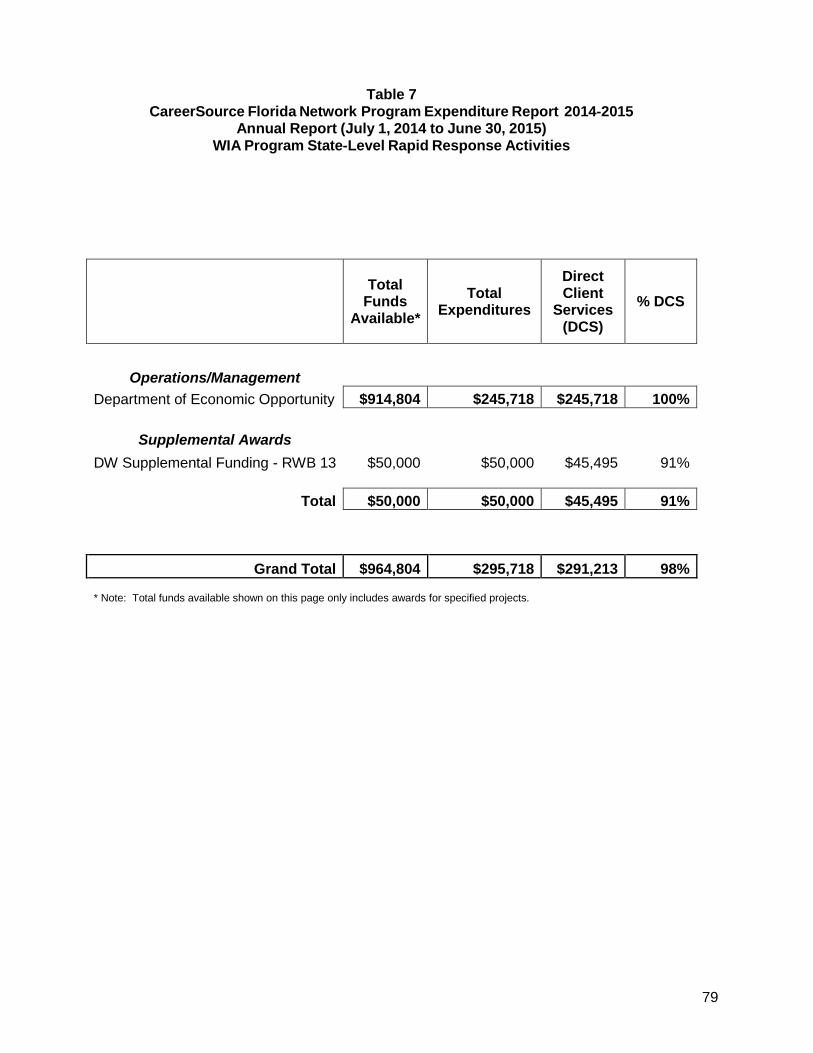
79
Table 7 CareerSource Florida Network Program Expenditure Report 2014‐2015
Annual Report (July 1, 2014 to June 30, 2015) WIA Program State‐Level Rapid Response Activities
Total
Funds Available*
Total Expenditures
Direct Client
Services (DCS)
% DCS
Operations/Management
Department of Economic Opportunity $914,804 $245,718 $245,718 100%
Supplemental Awards
DW Supplemental Funding - RWB 13 $50,000 $50,000 $45,495 91%
Total $50,000 $50,000 $45,495 91%
Grand Total $964,804 $295,718 $291,213 98%
* Note: Total funds available shown on this page only includes awards for specified projects.