with data storytelling - delta analytics - home · good storytelling is about weaving different...
TRANSCRIPT

Storytelling with Data
Measuring and showing your
impact

A little about us!

Jonathan WangRisk Analytics at Uber
& Director of Projects at Delta Analytics [email protected]
Twitter: @JJXWang
Sara HookerData Scientist at Udemy
& Executive Director at Delta [email protected]
Twitter: @sarahookr
5 golden rules for storytelling with data

5 golden rules everyone will have in their toolkit by the end of this talk:
1. Answer 3 questions early ona. Why should your audience care?b. Why are you best positioned to solve this problem?c. What is the desired outcome?
2. Good data collection matters3. Understand your audience4. Borrow from Others5. Focus on the story

1. Answer 3 important questions early on, or risk losing your audience.

a. Why should your audience care?

State your goal at the very beginning.
Start by communicating the key takeaways, don’t wait until the end for the big reveal.
This helps frame in your audience's mind everything that follows.

Example: Why are we all here today? Why should your organization care about storytelling with data?

So what is storytelling with data?

“Measurement only matters if it changes the way you act.”
Marc Koenig, Author at nonprofithub
Data needs to be actionable

● Enables key stakeholders to make decisions
● Acknowledges failures & scales successes
● Communicates impact
Good storytelling makes your data actionable

Social impact organizations are forced to hold themselves accountable more often because they are beholden to grant recipients.● Grant requirements are often
different from internal needs
Storytelling is not cherry picking data

Leveraging data is crucial because we now live in a flood of data.
Data has become an expected component of how we communicate.

Nonprofits are pushing the hardest for data
● focus on accountability
● desire to understand impact

What about your projects?

90% of GES delegates are at the very beginning of their data journey.Initial:
no ongoing data collectionIntermediate:
very little data collectedAdvanced:
steady stream of data
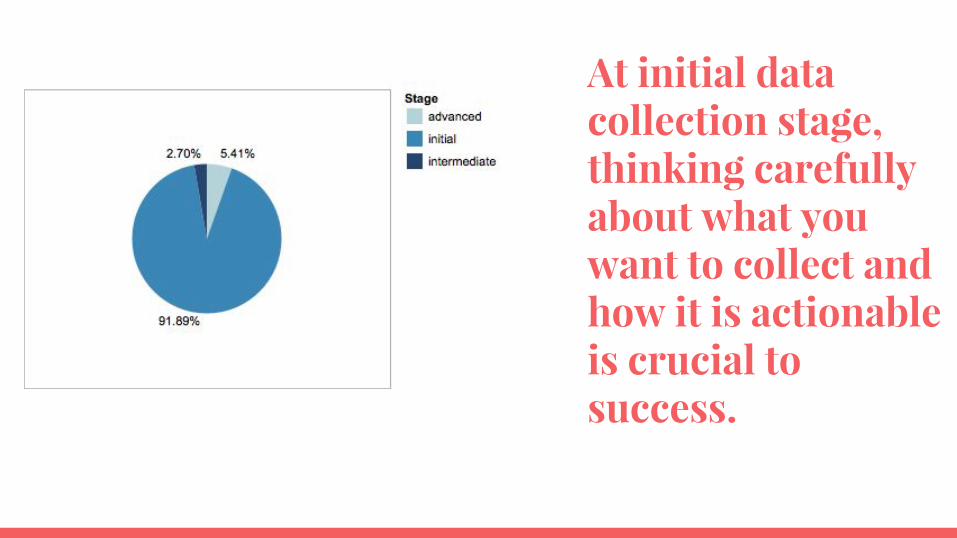
At initial data collection stage, thinking carefully about what you want to collect and how it is actionable is crucial to success.

Collecting data always has a cost. The level of difficulty is driven by:
● What sector you are trying to serve?○ For example, health care data is more difficult to collect because
of privacy requirements.● What community are you serving?
○ Serving remote communities that are hard to reach regularly has a higher cost than serving and collecting data at your local school.
● What medium does your project use?○ A mobile app automatically generates a stream of data. A
workshop demands conscious data collection.

GES delegates are serving very different communities all over the world.

Health care is a sector 30% of GES proposals are serving.
Does the sector you are serving pose additional difficulties?

GES Delegates are impacting their communities through many different channels.
Formats like workshops are harder to generate data from:● Metrics tend to be
harder to define● Require timely,
conscious collection.

For 70% of the GES proposals, data collection is costly.
Cheap dataYour core offering generates a stream of data.
Costly dataYour project does not automatically generate any data.

The choices you make now will have an outsized impact on your ability to communicate using data.
Delaying investment in data the critical mistake that many new organizations make.
There is a premium return on effort put in early on.

b. Why are you best positioned to solve this?

Establish your credibility to answer the pain point you
established in 1).

Example: Jonathan and I need to convince you we have
relevant experience to share during this talk.

3 years ago, we started Delta
Analytics, a 501(c)3 nonprofit to help other nonprofits better leverage
their data.

Delta Analytics fills the technical skill gap and enables
nonprofits to accelerate their
impact.

26 projects with nonprofits and social impact organizations
80+ Fellows volunteering part-time over 3 years
$0.00 charged for services
16 US and 10 International projects (Tanzania, UK, Kenya, and more)
Over 15,000 hours donated
Our Impact

Delta Analytics has helped nonprofits all over the world
tell their story.

CommunityEngagement
Education Economic Development
Environmental
Some of our projects:

What did we do to establish credibility?80+ Fellows volunteering part-time over 3 years
2. Simple aggregate metrics communicate our scale and longevity.
3. Our sector map is rich and exciting. We provide more information by using logo images instead of text.
1. We have a clear narrative arc, starting with the mission statement of Delta.

c. What is the desired outcome?

Don’t leave your audience guessing about what they should take away.
C should add more specificity to the overarching goal you state in a.
Think of a. as the destination, c. should be the directions to get there.

Example: Jonathan and I tell you what you will leave with by the end of this workshop.

5 point roadmap everyone will have in their toolkit by the end of this talk:
1. Answer 3 questions early on2. Good data collection matters3. Understand your audience4. Borrow from Others5. Focus on the story

1. By setting an agenda early on, we provide a roadmap for the session.
2. Simple visual cues highlight where we are in our journey. This helps the audience place a point within the larger framework.
3. Repetition of the agenda at the end of every section allows us to track progress.
What did we do to communicate outcome?

2. Good data collection = the bricks that build your story.

Key data collection mistakes
● Unsustainable data collection: some orgs try to collect too many data points at once, which often becomes unsustainable.
● Erratic data collection: some orgs change key metrics frequently, which results in messy data and inconsistent coverage.

Why do social impact orgs struggle to define core metrics?
• Scarce resources: data collection often costly
• High personnel churn: core metrics need to be collected consistently over time

Define what success looks like from day 1
Defining the vision of your organization is crucial for establishing what data you should collect.
What is your vision?
Who are you serving?
What is your value add?
What parts of your impact can be
measured using data?
What are the outcomes that define
your vision?
Define Core Metrics

Before you collect data, make sure you are able to sustain the commitment.
How you collect data and the frequency of updates determines the cost of data collection.
Define Core Metrics
What data do you need?
How will the data be collected?
How will the data be stored?
How often will the data be collected?

If data collection is costly, try to first leverage data that already exists

Example of a GES proposal that is already doing this:
“Street-children that loiter around every traffic light and marketplace in Pakistan are a common sight for those who live here. Most survive on the streets through a combination of strategies: they pick trash from large, unhygienic rubbish dumps, sort and sell the waste product to assorted dealers for a pittance.
According to the currentUNICEF statistics, estimates 30 million in Asia and 1.2 million street children onlyin Pakistan...”

Key advice for successful data collection:
• Automate wherever possible: Avoid paper.
• Store data purposefully (E.g. avoid ad hoc data storage, such as an excel sheet somewhere. Use Github, google sheets, salesforces, etc.).

5 point roadmap everyone will have in their toolkit by the end of this talk:
1. Answer 3 questions early on2. Good data collection matters3. Understand your audience4. Borrow from Others5. Focus on the story

3. Understand your audience.

Three Dimensions of Your Audience
GENERAL AUDIENCE
EXTERNAL STAKEHOLDERS
INTERNAL STAKEHOLDERS
RELATIONSHIP TO YOUR ORG
COMMUNICATION MEDIUM
PUBLICATION
PRESENTATION
WEBSITE
CALL TO ACTION
BE CONVINCED
BEHAVIOR CHANGE
CONTRIBUTE
... ... ...

How is your audience related to you?
GENERAL AUDIENCE
EXTERNAL STAKEHOLDERS
INTERNAL STAKEHOLDERS
- Lack context - No “buy in”
- Bought in- Tailor to perspective
- Bought in- Understand internal
systems

How are you communicating to them?
PUBLICATION PRESENTATION WEBSITE
- Focus in depth on one topic
- Focus in depth on one topic
- Broad overview

What do you want your audience to do?
BE CONVINCED
Transfernation(GES 2015)
BEHAVIOR CHANGE
WomensHealth.gov
CONTRIBUTE
GiveDirectly

5 point roadmap everyone will have in their toolkit by the end of this talk:
1. Answer 3 questions early on2. Good data collection matters3. Understand your audience4. Borrow from Others5. Focus on the story

4. Be inspired by existing work

Highlight the takeaways

Start general, dive deep

Use comparable baselines to measure impact

5 point roadmap everyone will have in their toolkit by the end of this talk:
1. Answer 3 questions early on2. Good data collection matters3. Understand your audience4. Borrow from Others5. Focus on the story

5. Focus on the story

Data should always be part of a larger story you are trying to tell.
Do not add charts without purpose.
Some outcomes cannot be quantified. Do not force it!
Good storytelling is about weaving different elements (data, quotes, pictures) together seamlessly.

Let me tell you a short story about one of our grant recipients, Eneza Education.

Eneza Education
Spreading Education Everywhere

Eneza Education
Eneza Education is a pre-smart phone technology company question bank accessible on a low cost mobile phone.

Eneza Education
Eneza Education is a pre-smart phone technology company question bank accessible on a low cost mobile phone.

Incredible growth in number of students actively learning each month.
Eneza Education

Simple text based model with instant feedback to questions
Pre smart phone portal = KES 10 for a weekly subscription ($0.098).
Eneza Education

Eneza Education

Gamification techniques to improve retention with students.
Eneza Education

Gamification techniques to improve retention with students.
Eneza Education

Eneza started in Kenya, branching out to Tanzania and Ghana.
Eneza Education

Why are there big spikes in July, September and October?
Eneza Education

Activity peaks close to the Kenyan annual exams inOctober, it is at it’s lowest in January after Exams.
Eneza Education

Why do you think activity for students is peaking in the evening?
Eneza Education

Students mainly use their parents cellphones to access Eneza.
Eneza Education

Since parents are key stakeholders, Eneza also caters to them with “parent” quizzes targeting key skills like personal finance & business.
Eneza Education

What did we do to make this a compelling case study?
1. Data is always part of a larger story we are trying to tell. We use images to orientate our audience and data to drive our points home.
2. We use aggregated metrics to quickly orientate the audience to the scale of Eneza

3. We engage the audience, asking them to come to their own conclusion before stating our own.
2. We place the map and chart side by side because one adds to the understanding of the other.

Let’s discuss.

Consider applying to be one of our grant
recipients atwww.deltanalytics.org