wisconsin producer perspective on the phosphorus index
TRANSCRIPT
Wisconsin Producer Wisconsin Producer Perspective on the Perspective on the Phosphorus IndexPhosphorus Index
Dennis R FrameUW – Discovery Farms Program
P – Index (Management Tool)P – Index (Management Tool)
The P Index is a nutrient management planning tool
It is also used as a targeting and assessment tool for water quality projects
P – Index (Management Tool)P – Index (Management Tool)
Excellent tool to evaluate the relative risk of fields or management practices against other fields or practices on the same farm
P – Index (Management Tool)P – Index (Management Tool)
Question the value of evaluating the relative risk of fields or management practices against other farms
P – Index (Regulatory tool)P – Index (Regulatory tool)
Today the P-Index is a regulatory tool:
◦ Croplands, pastures, and winter grazing areas shall average a phosphorus index of 6 or less over the accounting period and may not exceed a phosphorus index of 12 in any individual year within the accounting period.
P – Index (Regulatory tool)P – Index (Regulatory tool)
The P-Index is an excellent regulatory tool.
◦ It allows people with little background in farming to calculate whether a farm is losing phosphorus at unacceptable levels
◦ Agency personnel are making management recommendations based on model, not based on field visits, farmer contact or experience.
P – Index (Regulatory tool)P – Index (Regulatory tool)
The calculated impacts from changes in management can be done in the office with little or no involvement of the farmer.
and
If we don’t like the results, just change the criteria
P – Index (Regulatory tool)P – Index (Regulatory tool)
It is a goal of this project to prevent an increase in the rotational PI of any field.
◦ Starting with Crop Year 2014, 50% of the cropped acres used by participating farms must meet a Phosphorus Index (PI) of 4 or less throughout the rotation. Farms joining this project as participating farms (non-emergency) will be given 5 years to achieve this requirement.
P – Index (Regulatory tool)P – Index (Regulatory tool)
Is there any data showing that reducing the P-Index from 6 to 4 has reduced the annual and total phosphorus loss as measured in a water body?
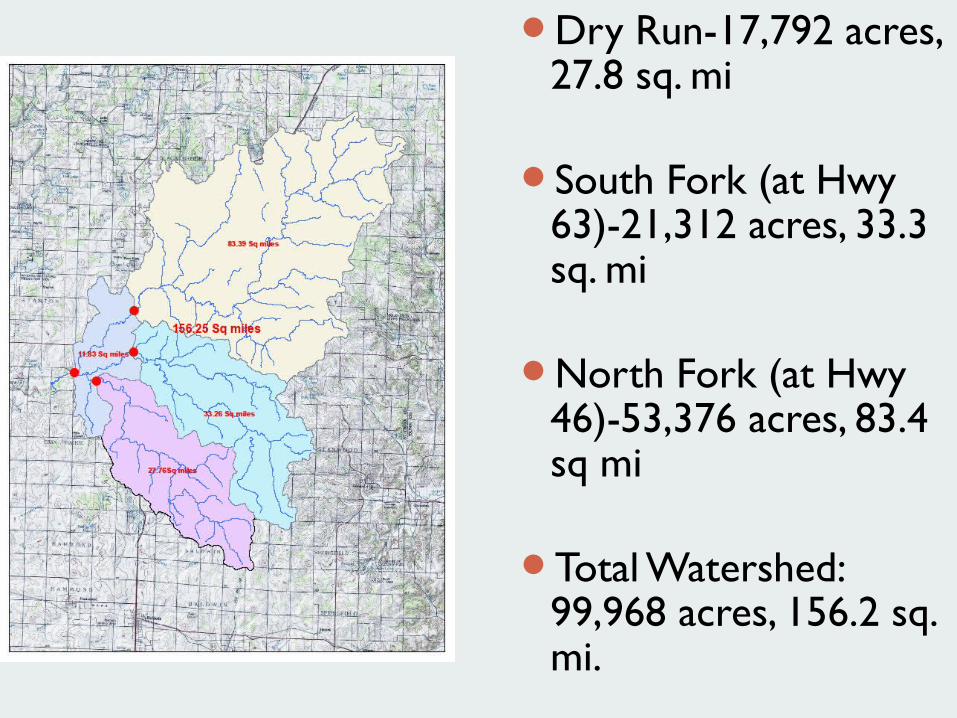
Dry Run-17,792 acres, 27.8 sq. mi
South Fork (at Hwy 63)-21,312 acres, 33.3 sq. mi
North Fork (at Hwy 46)-53,376 acres, 83.4 sq mi
Total Watershed: 99,968 acres, 156.2 sq. mi.

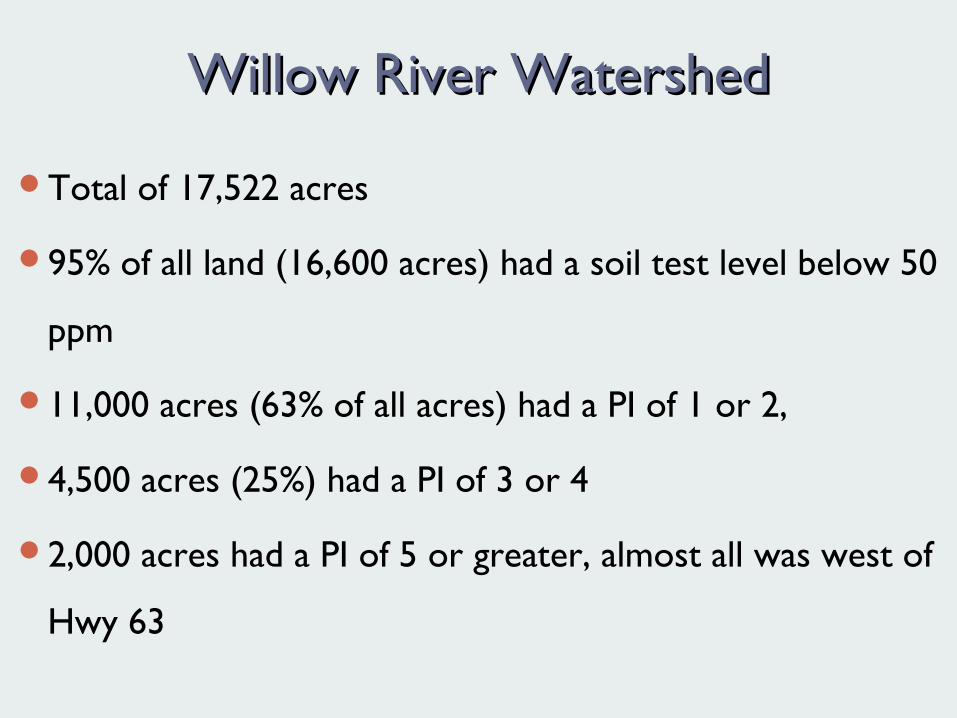
Willow River WatershedWillow River Watershed
Total of 17,522 acres
95% of all land (16,600 acres) had a soil test level below 50
ppm
11,000 acres (63% of all acres) had a PI of 1 or 2,
4,500 acres (25%) had a PI of 3 or 4
2,000 acres had a PI of 5 or greater, almost all was west of
Hwy 63
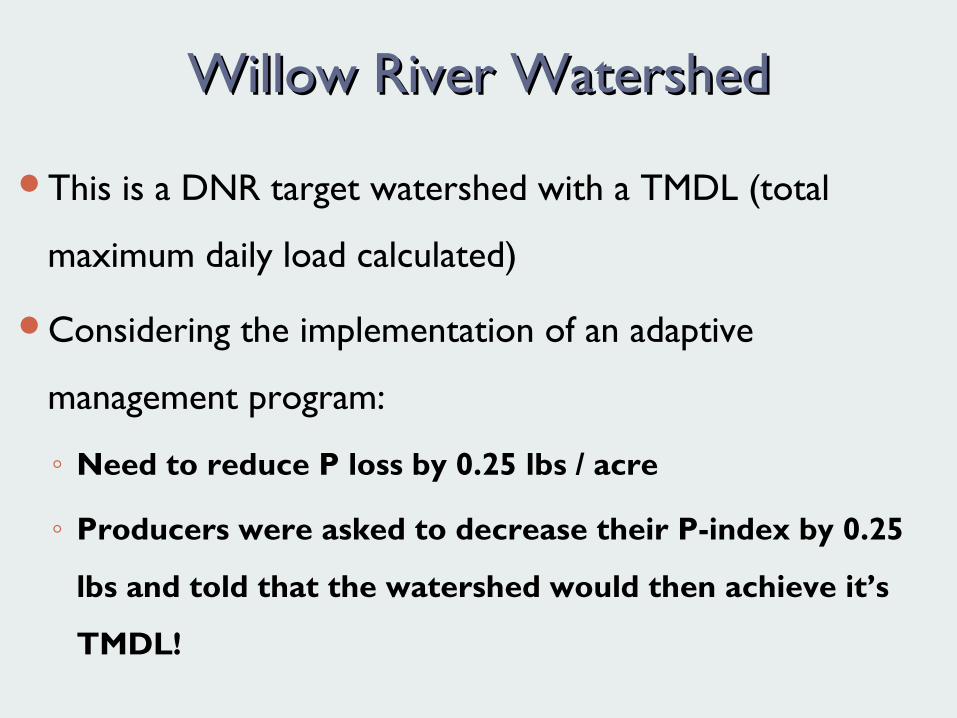
Willow River WatershedWillow River Watershed
This is a DNR target watershed with a TMDL (total
maximum daily load calculated)
Considering the implementation of an adaptive
management program:
◦ Need to reduce P loss by 0.25 lbs / acre
◦ Producers were asked to decrease their P-index by 0.25
lbs and told that the watershed would then achieve it’s
TMDL!

Producer PerspectiveProducer Perspective
The P-Index maybe the greatest tool every designed if:
1. Agencies are held accountable that the recommendations given to farmers will allow them to remain profitable and water quality will improve.
Producer PerspectiveProducer Perspective
The P-Index maybe the greatest tool every designed if:
2. If water quality does not improve, the index numbers cannot be adjusted until there is sound science which proves that achieving the new goal will improve water quality
Producer PerspectiveProducer Perspective
The P-Index maybe the greatest tool every designed if:
3. All evaluation of improvement is based on the model and not on water quality. Failure to improve water quality is the agencies, not the farmers.
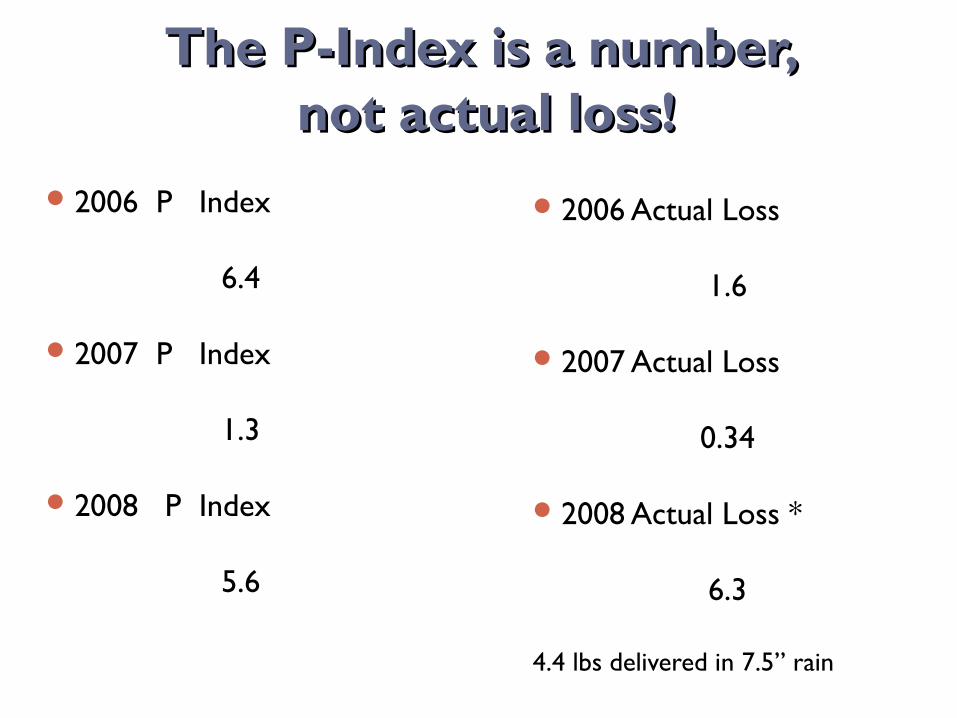
The P-Index is a number, The P-Index is a number, not actual loss!not actual loss!
2006 P Index
6.4
2007 P Index
1.3
2008 P Index
5.6
2006 Actual Loss
1.6
2007 Actual Loss
0.34
2008 Actual Loss *
6.3
4.4 lbs delivered in 7.5” rain