wireless sensor network for disaster monitoring · wireless sensor network for disaster monitoring...
TRANSCRIPT

Wireless Sensor Network for Disaster Monitoring 1
Wireless Sensor Network for Disaster Monitoring
Dr. Maneesha Vinodini Ramesh
0
Wireless Sensor Network for Disaster Monitoring
Dr. Maneesha Vinodini RameshAmrita Center for Wireless Networks and Applications,
Amrita Vishwa Vidyapeetham (Amrita University)India
1. Introduction
This chapter provides a framework of the methodical steps and considerations required whendesigning and deploying a Wireless Sensor Network (WSN) to a given application. A realexample is used to demonstrate WSN deployment in action.WSN has many possible applications that have not yet been explored. WSN is a fast grow-ing technology however much written about WSN is still theory. ’How to deploy WSNs,’although having much theory written still currently lacks a practical guide.Using our research experience and the practical real life solutions found when deploying aWSN for the application of Landslide Detection this chapter outlines the steps required whenconducting a real world deployment of a WSN.In this chapter the application for WSN most focused on is for purpose of detecting naturaldisasters. WSN can be useful to disaster management in two ways. Firstly, WSN has enableda more convenient early warning system and secondly, WSN provides a system able to learnabout the phenomena of natural disasters.Natural disasters are increasing world wide due to the global warming and climate change.The losses due to these disasters are increasing in an alarming rate. Hence, it is would bebeneficial to detect the pre-cursors of these disasters, early warn the population, evacuatethem, and save their life. However, these disasters are largely unpredictable and occur withinvery short spans of time. Therefore technology has to be developed to capture relevant signalswith minimum monitoring delay. Wireless Sensors are one of the cutting edge technologiesthat can quickly respond to rapid changes of data and send the sensed data to a data analysiscenter in areas where cabling is inappropriate.WSN technology has the capability of quick capturing, processing, and transmission of criticaldata in real-time with high resolution. However, it has its own limitations such as relativelylow amounts of battery power and low memory availability compared to many existing tech-nologies. It does, though, have the advantage of deploying sensors in hostile environmentswith a bare minimum of maintenance. This fulfills a very important need for any real timemonitoring, especially in hazardous or remote scenarios.Our researchers are using WSNs in the landslide scenario for estimating the chance occurrenceof landslides. India faces landslides every year with a large threat to human life causingannual loss of US $400 million (27). The main goal of this effort is to detect rainfall inducedlandslides which occur commonly in India.Many papers have highlighted the need for a better understanding of landslide phenomenaand attempted to create systems that gather and analyse that data (1), (14) & (31).
1
The capacity of sensors and a WSN to collect and collate and analyse valuable worthwhiledata, in an ordered manner, for studying landslide phenomena or other natural disasters andhas not fully been explored.Landslide prone-area are usually situated in terrains that are steep, hostile, difficult to accessmaking monitoring landslides a strenuous activity. The wireless sensor network offers itselfas an effective, reliable, low maintenance solution.Using WSN for real-time continuous monitoring has been proven possible as shown the ex-ample of (9) who developed a Drought Forecast and Alert System (DFAS) using a WSN. Thissuccess in conjunction with (4) who developed a durable wireless sensor node able to remotelymonitor soil conditions and (26) who proposed a design for slip surface localization in WSNsmotivated our researchers to the design, develop, and deploy a real-time WSN for landslidedetection. This system is deployed to monitor and detect landslides, in a landslide prone areaof Kerala, India, and is further supported by laboratory setups.This landslide detection system using a WSN is the first in India, one of the first in the worldof its kind. It is also one of the first landslide field deployments backed up by a laboratorysetup and modeling software. This system has been operational and collecting data for thelast two years, and has issued landslide warnings in July 2009. The current system can bereplicated in other rainfall induced landslide prone areas around the world.One particular advance was the design of a Deep Earth Probe (DEP) to support the deploy-ment of sensors. Previous landslide monitoring procedures have used sensors yet they havenot implemented connecting all the sensors to a single wireless sensor node ((29); (28); (14);(1)). We have designed a sensor placement strategy that can be adapted for any landslideprone area and potentially for placing sensors to detect other natural disasters, in other disas-ter prone areas.The chapter is arranged as follows: Requirement Analysis consisting of: Analysis of Scenario,Selection of Geophysical Sensors, Placement of Geophysical Sensors, Spatial Distribution ofthe Deep Earth Probe (DEP), Wireless Sensor Network Requirements, Algorithm Require-ments, Network requirements (data transmission requirements/method), Data Analysis Re-quirements and Data Visualization Requirements;Followed by sections on: Wireless Sensor Network Architecture; Wireless Network Designand Architecture; Wireless Sensor Network Algorithms; Wireless Software Architecture; De-sign of Interfacing Sensors and Power Management Methods; Field Deployment Methodsand Experiences; Field Selection; Deployment of Deep Earth Probe (DEP); Network Imple-mentation and Integration; Validation of the Complete System - Landslide Warning Issued;and lastly, Conclusion and Future Work.
2. Requirement Analysis
This section will describe in detail how to design a real-time Wireless Sensor Network (WSN),and what are the considerations/requirements that have to be analyzed for designing thenetwork for any scenario. The different processes that will contribute to a WSN design are:
• Analysis of ScenarioWireless Sensor Networks (WSN) could be useful in a vast and diverse amount of appli-cations. The chosen target scenario must be understood and investigated thoroughly inorder to choose the most appropriate sensors and network. A comprehensive analysisof the scenario is one of the first steps to undertake when considering the design of the
system. The constraints found (from the analysis of the scenario) determine and governthe overall size and type of network and sensors required.Understanding the characteristics of a scenario allows logical links to be made abouthow to detect the occurrence of land movement. The scenario here is landslides andis then further specified to become ’rainfall induced landslides’. The importance ofspecialization is that landslides would be too generic and there would be too manyother factors to consider.Each landslide behaves differently. Factors playing strong roles in landslide occurrenceinclude slope subsurface factors such as: the type of soil and its properties, soil layerstructure, the depth of the soil to bedrock, the presence of quartz or other mineral veins,and the depth of the water table, among others and slope surface factors such as: thetypes of foliage and vegetation, the topographical geography, human alterations to thelandscape, and the amount, intensity, and duration of rainfall.Landslides are one of the major catastrophic disasters that happen around the world.Their occurrence can be related to several causes such as geological, morphological andphysical effects, as well as human activities (30). Basically, landslides are the down-slope movement of soil, rock and organic materials due to the influence of gravity.These movements are short-lived and suddenly occurring phenomena that cause ex-traordinary landscape changes and destruction of life and property. Some slopes aresusceptible to landslides whereas others are more stable. Many factors contribute to theinstability of slopes, but the main controlling factors are the nature of the soil and un-derlying bedrock, the configuration of the slope, the geometry of the slope, and ground-water conditions.In India, (27) the main landslide triggers are intense rainfall and earthquakes. Land-slides can also be triggered by gradual processes such as weathering, or by externalmechanisms including:
– Undercutting of a slope by stream erosion, wave action, glaciers, or human activ-ity such as road building,
– Intense or prolonged rainfall, rapid snowmelt, or sharp fluctuations in ground-water levels,
– Shocks or vibrations caused by earthquakes or construction activity,
– Loading on upper slopes, or
– A combination of these and other factors.
Some of the factors that aggravate the incidence of landslides are environmental degra-dation on account of the heavy pressure of population, decline in forest cover, change inagricultural practices, and the development of industry and infrastructure on unstablehill slopes, among others.In India, the main landslide triggers are intense rainfall and earthquakes. Under heavyrainfall conditions, rain infiltration on the slope causes instability, a reduction in thefactor of safety, transient pore pressure responses, changes in water table height, a re-duction in shear strength which holds the soil or rock, an increase in soil weight anda reduction in the angle of repose. When the rainfall intensity is larger than the slopesaturated hydraulic conductivity, runoff occurs (12).The key principal parameters that initiate the rainfall induced landslides are:

Wireless Sensor Network for Disaster Monitoring 3
The capacity of sensors and a WSN to collect and collate and analyse valuable worthwhiledata, in an ordered manner, for studying landslide phenomena or other natural disasters andhas not fully been explored.Landslide prone-area are usually situated in terrains that are steep, hostile, difficult to accessmaking monitoring landslides a strenuous activity. The wireless sensor network offers itselfas an effective, reliable, low maintenance solution.Using WSN for real-time continuous monitoring has been proven possible as shown the ex-ample of (9) who developed a Drought Forecast and Alert System (DFAS) using a WSN. Thissuccess in conjunction with (4) who developed a durable wireless sensor node able to remotelymonitor soil conditions and (26) who proposed a design for slip surface localization in WSNsmotivated our researchers to the design, develop, and deploy a real-time WSN for landslidedetection. This system is deployed to monitor and detect landslides, in a landslide prone areaof Kerala, India, and is further supported by laboratory setups.This landslide detection system using a WSN is the first in India, one of the first in the worldof its kind. It is also one of the first landslide field deployments backed up by a laboratorysetup and modeling software. This system has been operational and collecting data for thelast two years, and has issued landslide warnings in July 2009. The current system can bereplicated in other rainfall induced landslide prone areas around the world.One particular advance was the design of a Deep Earth Probe (DEP) to support the deploy-ment of sensors. Previous landslide monitoring procedures have used sensors yet they havenot implemented connecting all the sensors to a single wireless sensor node ((29); (28); (14);(1)). We have designed a sensor placement strategy that can be adapted for any landslideprone area and potentially for placing sensors to detect other natural disasters, in other disas-ter prone areas.The chapter is arranged as follows: Requirement Analysis consisting of: Analysis of Scenario,Selection of Geophysical Sensors, Placement of Geophysical Sensors, Spatial Distribution ofthe Deep Earth Probe (DEP), Wireless Sensor Network Requirements, Algorithm Require-ments, Network requirements (data transmission requirements/method), Data Analysis Re-quirements and Data Visualization Requirements;Followed by sections on: Wireless Sensor Network Architecture; Wireless Network Designand Architecture; Wireless Sensor Network Algorithms; Wireless Software Architecture; De-sign of Interfacing Sensors and Power Management Methods; Field Deployment Methodsand Experiences; Field Selection; Deployment of Deep Earth Probe (DEP); Network Imple-mentation and Integration; Validation of the Complete System - Landslide Warning Issued;and lastly, Conclusion and Future Work.
2. Requirement Analysis
This section will describe in detail how to design a real-time Wireless Sensor Network (WSN),and what are the considerations/requirements that have to be analyzed for designing thenetwork for any scenario. The different processes that will contribute to a WSN design are:
• Analysis of ScenarioWireless Sensor Networks (WSN) could be useful in a vast and diverse amount of appli-cations. The chosen target scenario must be understood and investigated thoroughly inorder to choose the most appropriate sensors and network. A comprehensive analysisof the scenario is one of the first steps to undertake when considering the design of the
system. The constraints found (from the analysis of the scenario) determine and governthe overall size and type of network and sensors required.Understanding the characteristics of a scenario allows logical links to be made abouthow to detect the occurrence of land movement. The scenario here is landslides andis then further specified to become ’rainfall induced landslides’. The importance ofspecialization is that landslides would be too generic and there would be too manyother factors to consider.Each landslide behaves differently. Factors playing strong roles in landslide occurrenceinclude slope subsurface factors such as: the type of soil and its properties, soil layerstructure, the depth of the soil to bedrock, the presence of quartz or other mineral veins,and the depth of the water table, among others and slope surface factors such as: thetypes of foliage and vegetation, the topographical geography, human alterations to thelandscape, and the amount, intensity, and duration of rainfall.Landslides are one of the major catastrophic disasters that happen around the world.Their occurrence can be related to several causes such as geological, morphological andphysical effects, as well as human activities (30). Basically, landslides are the down-slope movement of soil, rock and organic materials due to the influence of gravity.These movements are short-lived and suddenly occurring phenomena that cause ex-traordinary landscape changes and destruction of life and property. Some slopes aresusceptible to landslides whereas others are more stable. Many factors contribute to theinstability of slopes, but the main controlling factors are the nature of the soil and un-derlying bedrock, the configuration of the slope, the geometry of the slope, and ground-water conditions.In India, (27) the main landslide triggers are intense rainfall and earthquakes. Land-slides can also be triggered by gradual processes such as weathering, or by externalmechanisms including:
– Undercutting of a slope by stream erosion, wave action, glaciers, or human activ-ity such as road building,
– Intense or prolonged rainfall, rapid snowmelt, or sharp fluctuations in ground-water levels,
– Shocks or vibrations caused by earthquakes or construction activity,
– Loading on upper slopes, or
– A combination of these and other factors.
Some of the factors that aggravate the incidence of landslides are environmental degra-dation on account of the heavy pressure of population, decline in forest cover, change inagricultural practices, and the development of industry and infrastructure on unstablehill slopes, among others.In India, the main landslide triggers are intense rainfall and earthquakes. Under heavyrainfall conditions, rain infiltration on the slope causes instability, a reduction in thefactor of safety, transient pore pressure responses, changes in water table height, a re-duction in shear strength which holds the soil or rock, an increase in soil weight anda reduction in the angle of repose. When the rainfall intensity is larger than the slopesaturated hydraulic conductivity, runoff occurs (12).The key principal parameters that initiate the rainfall induced landslides are:

1. Rainfall: Rainfall is one of the main triggers for the landslide. The increase in therainfall rate or its intensity increases the probability of landslide. Hence monitor-ing rainfall rate is essential for the detection and prediction of landslides. This canbe performed by incorporating a rain gauge with the complete system for moni-toring landslides.
2. Moisture: The moisture level in the soil will increase as the rainfall increases.Enormous increase in moisture content is considered to be a primary indicationfor landslide initiation. Hence, it is very important to know the soil moisture atwhich the soil loses sheer strength and eventually triggers failure.
3. Pore pressure: The pore pressure piezometer is one of the critical sensors neededfor the rainfall induced landslide detection. As rainfall increases rainwater accu-mulates at the pores of the soil. This exerts a negative pressure and also it causesthe loosening of soil strength. So the groundwater pore pressure must be mea-sured, as this measurement provides critical information about how much wateris in the ground. As the amount of water in the ground is directly related to the soilcohesion strength, this parameter is one of the most important for slope stabilityand landslide prediction.
4. Tilt: Sliding of soil layers has to be measured for identifying the slope failures.This can be performed by measuring the angular tilt (angular slide) during theslope failure.
5. : Vibrations: Vibrations in the earth can be produced during the initiation of alandslide, as the land mass starts to move, but does not fully slide. These vibra-tions can be monitored and taken as a precursor to a full landslide.
• Selection of Geophysical SensorsLandslide detection requires measurement of principal parameters discussed in theabove section. The key geophysical sensors such as rain gauge, soil moisture sensors,pore pressure transducers, strain gauges, tiltmeters, and geophones are identified formeasuring the principal parameters. These sensors are selected based on their rele-vance in finding the causative geological factors for inducing landslides under heavyrainfall conditions.The details of the selected sensors are:
– Dielectric moisture sensors: Capacitance-type dielectric moisture sensors are usedto monitor the changes experienced in volumetric water content.
– Pore pressure piezometers: Pore pressure piezometers are used to capture the porepressure variations, as the rainfall rate varies. Either the vibrating wire piezometeror the strain gauge type piezometer is used for in this deployment.
– Strain gauges: When attached to a DEP (Deep Earth Probe), a strain gauge canbe used to measure the movement of soil layers. Strain gauges of different resis-tance such as 100Ω, 350Ω, and 1000Ω have been used for deployment, to measuredeflections in the DEP of 0.5 mm per meter.
– Tiltmeters: Tiltmeters are used for measuring the soil layer movements such asvery slow creep movements or sudden movements. High accuracy tiltmeters arerequired for this scenario.
– Geophones: The geophone is used for the analysis of vibrations caused during alandslide. The characteristics of landslides demand the measurement of frequen-cies up to 250 Hz. The resolution should be within 0.1 Hz and these measurementsneed to be collected real-time.
– Rain gauges: Maximum rainfall of 5000 mm per year needs to be measured usingthe tipping bucket. The tipping bucket type of wireless rain gauge, in which thetipping event is counted as .001 inch of rainfall, has been deployed.
– Temperature sensors: The physical properties of soil and water change with tem-perature. A resolution of 1/10th degree Celsius, measured every 15 minutes, issufficient. Temperature measurements are collected using the rain gauge.
Cost-Effective Considerations Cost-effective solutions have been explored, e.g. usingstrain gauges for monitoring slope movement. Investigation into the sensors is a neces-sary pursuit. Searching for cost effective, yet reliable sensors and accessing their abilityto process that data is an issue. When choosing appropriate sensors for your given ap-plication it is necessary to access the usefulness of a sensor and its ability to provide thetype of worthwhile data required. Developing the ability of sensors effects the applica-tions currently available.Another factor when considering the most appropriate sensors is how cost-effective thesensor is, for example our team opted to use strain gauges for monitoring slope move-ment which are significantly cheaper than tiltmeters. Though in choosing to use straingauges it took a much longer to develop the signal conditioning and electronics to inter-face the strain gauge to the wireless sensor nodes. It also took a longer time to learn howto accurately interpret the data resulting from the strain gauges since strain gauges cap-ture more noise (and unwanted signals) than other more expensive sensors. Thereforesignal conditioning was required to extract the relevant signals that determine slopemovements from the strain gauge’s raw data.Nested Dielectric Moisture Sensor is another cost effective choice made by the re-searchers for monitoring the infiltration rate.
• Placement of Geophysical SensorsThe chosen, above mentioned, sensors or a combination of them can be used for detect-ing landslides. The terrain and type of landslide will determine the group of sensorsto be used in a particular location for detecting landslides. All the chosen geophysicalsensors are capable of real-time monitoring with bare minimum maintenance. A DEP(Deep Earth Probe) was devised to deploy these many sensors as a stack, attached toa vertical pipe, in different locations of the landslide prone site. This generalized de-sign for the DEP, and the sensor placement procedures at the DEP has been developedand implemented to simplify future deployments. This design can be adapted for anylandslide prone area and potentially for placing sensors to detect other natural disas-ters, in other disaster prone areas. Preparation with an ’eye on the future’ is an integralpart of the development of a practical system, as this design for a DEP proves. Cur-rently replication of this particular system is being requested across much of India bythe Government, the design of the DEP will enable each procedure to be much moreorganised and simplify deployment.The ideal depth for the DEP to be deployed would be the same as the depth of thebedrock in that location.
Wireless Sensor Network for Disaster Monitoring 5
1. Rainfall: Rainfall is one of the main triggers for the landslide. The increase in therainfall rate or its intensity increases the probability of landslide. Hence monitor-ing rainfall rate is essential for the detection and prediction of landslides. This canbe performed by incorporating a rain gauge with the complete system for moni-toring landslides.
2. Moisture: The moisture level in the soil will increase as the rainfall increases.Enormous increase in moisture content is considered to be a primary indicationfor landslide initiation. Hence, it is very important to know the soil moisture atwhich the soil loses sheer strength and eventually triggers failure.
3. Pore pressure: The pore pressure piezometer is one of the critical sensors neededfor the rainfall induced landslide detection. As rainfall increases rainwater accu-mulates at the pores of the soil. This exerts a negative pressure and also it causesthe loosening of soil strength. So the groundwater pore pressure must be mea-sured, as this measurement provides critical information about how much wateris in the ground. As the amount of water in the ground is directly related to the soilcohesion strength, this parameter is one of the most important for slope stabilityand landslide prediction.
4. Tilt: Sliding of soil layers has to be measured for identifying the slope failures.This can be performed by measuring the angular tilt (angular slide) during theslope failure.
5. : Vibrations: Vibrations in the earth can be produced during the initiation of alandslide, as the land mass starts to move, but does not fully slide. These vibra-tions can be monitored and taken as a precursor to a full landslide.
• Selection of Geophysical SensorsLandslide detection requires measurement of principal parameters discussed in theabove section. The key geophysical sensors such as rain gauge, soil moisture sensors,pore pressure transducers, strain gauges, tiltmeters, and geophones are identified formeasuring the principal parameters. These sensors are selected based on their rele-vance in finding the causative geological factors for inducing landslides under heavyrainfall conditions.The details of the selected sensors are:
– Dielectric moisture sensors: Capacitance-type dielectric moisture sensors are usedto monitor the changes experienced in volumetric water content.
– Pore pressure piezometers: Pore pressure piezometers are used to capture the porepressure variations, as the rainfall rate varies. Either the vibrating wire piezometeror the strain gauge type piezometer is used for in this deployment.
– Strain gauges: When attached to a DEP (Deep Earth Probe), a strain gauge canbe used to measure the movement of soil layers. Strain gauges of different resis-tance such as 100Ω, 350Ω, and 1000Ω have been used for deployment, to measuredeflections in the DEP of 0.5 mm per meter.
– Tiltmeters: Tiltmeters are used for measuring the soil layer movements such asvery slow creep movements or sudden movements. High accuracy tiltmeters arerequired for this scenario.
– Geophones: The geophone is used for the analysis of vibrations caused during alandslide. The characteristics of landslides demand the measurement of frequen-cies up to 250 Hz. The resolution should be within 0.1 Hz and these measurementsneed to be collected real-time.
– Rain gauges: Maximum rainfall of 5000 mm per year needs to be measured usingthe tipping bucket. The tipping bucket type of wireless rain gauge, in which thetipping event is counted as .001 inch of rainfall, has been deployed.
– Temperature sensors: The physical properties of soil and water change with tem-perature. A resolution of 1/10th degree Celsius, measured every 15 minutes, issufficient. Temperature measurements are collected using the rain gauge.
Cost-Effective Considerations Cost-effective solutions have been explored, e.g. usingstrain gauges for monitoring slope movement. Investigation into the sensors is a neces-sary pursuit. Searching for cost effective, yet reliable sensors and accessing their abilityto process that data is an issue. When choosing appropriate sensors for your given ap-plication it is necessary to access the usefulness of a sensor and its ability to provide thetype of worthwhile data required. Developing the ability of sensors effects the applica-tions currently available.Another factor when considering the most appropriate sensors is how cost-effective thesensor is, for example our team opted to use strain gauges for monitoring slope move-ment which are significantly cheaper than tiltmeters. Though in choosing to use straingauges it took a much longer to develop the signal conditioning and electronics to inter-face the strain gauge to the wireless sensor nodes. It also took a longer time to learn howto accurately interpret the data resulting from the strain gauges since strain gauges cap-ture more noise (and unwanted signals) than other more expensive sensors. Thereforesignal conditioning was required to extract the relevant signals that determine slopemovements from the strain gauge’s raw data.Nested Dielectric Moisture Sensor is another cost effective choice made by the re-searchers for monitoring the infiltration rate.
• Placement of Geophysical SensorsThe chosen, above mentioned, sensors or a combination of them can be used for detect-ing landslides. The terrain and type of landslide will determine the group of sensorsto be used in a particular location for detecting landslides. All the chosen geophysicalsensors are capable of real-time monitoring with bare minimum maintenance. A DEP(Deep Earth Probe) was devised to deploy these many sensors as a stack, attached toa vertical pipe, in different locations of the landslide prone site. This generalized de-sign for the DEP, and the sensor placement procedures at the DEP has been developedand implemented to simplify future deployments. This design can be adapted for anylandslide prone area and potentially for placing sensors to detect other natural disas-ters, in other disaster prone areas. Preparation with an ’eye on the future’ is an integralpart of the development of a practical system, as this design for a DEP proves. Cur-rently replication of this particular system is being requested across much of India bythe Government, the design of the DEP will enable each procedure to be much moreorganised and simplify deployment.The ideal depth for the DEP to be deployed would be the same as the depth of thebedrock in that location.
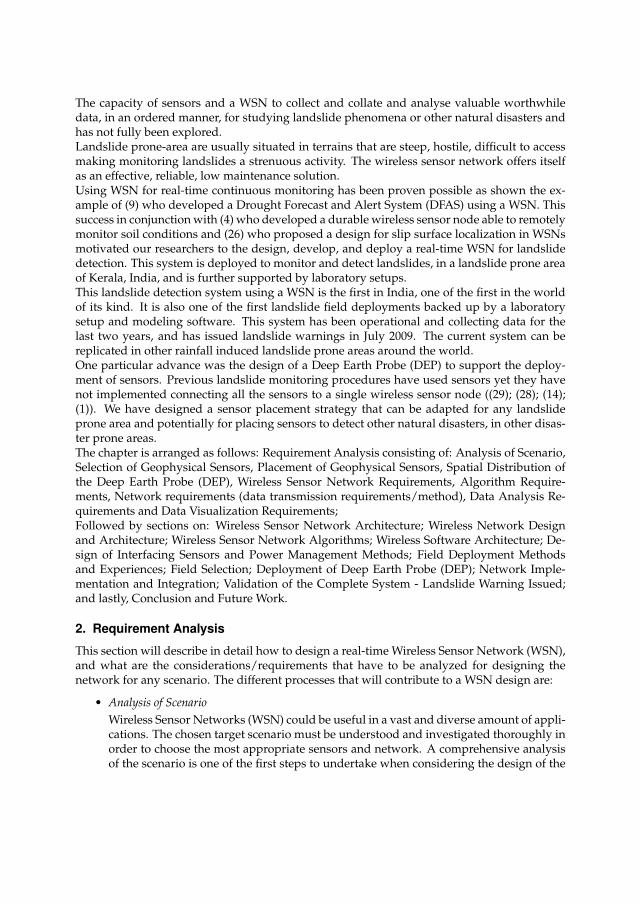
The DEP design uses a heterogeneous structure with different types of geophysical sen-sors at different positions. The geological and hydrological properties, at the location ofeach of the DEPs, determine the total number of each of the geophysical sensors neededand their corresponding position on the DEP. These geophysical sensors are deployedor attached inside or outside of the DEP according to each of their specific deploymentstrategies.All the geological sensors on the DEP are connected to the wireless sensor node via adata acquisition board as shown in Figure 1. This apparatus, including the DEP with itssensors, the data acquisition board and the wireless sensor node, is conjunctly termed awireless probe (WP).
Fig. 1. Multi Sensor Deep Earth Probe
• Spatial Distribution of the DEP (Deep Earth Probe)Challenges come when wide area monitoring is required. Different approaches canbe used for determining the spatial distribution and deployment of Wireless Probes(WPs). The different approaches considered are the Random Approach, the Matrix Ap-proach, the Vulnerability Index Approach, and the Hybrid Approach. In the RandomApproach, WPs can be deployed at all possible locations according to the terrain struc-ture of a landslide prone mountain. Whereas in the Matrix Approach, the total area ofdeployment, A, is sectored into a matrix of NxN size, and one WP is placed in each cellof the matrix. The cell size of the matrix is selected by the smallest value of the max-imum range covered by each sensor present with the DEP. In the Vulnerability IndexApproach, WPs are deployed in vulnerable regions that have been identified during thesite investigation, terrain mapping, and soil testing. The Hybrid Approach incorporates
more than one approach stated earlier. After considering these different approaches, aparticular approach suitable for the deployment area has to be selected.
• Wireless Sensor Network RequirementsLandslide detection requires wide area monitoring, and real-time, continuous data col-lection, processing, and aggregation. Wireless Sensor Networks (WSNs) are the keyemerging technology that has the capability to real-time, continuous data collection,processing, aggregation with minimum maintenance. Any wide area monitoring mustdetermine the
– maximum number of wireless sensor nodes,
– maximum number of relay nodes,
– maximum frequency of data collection from each node per minute,
– maximum data rate required,
– maximum power required for sampling, transmitting, processing, and receiving,
– maximum tolerance limit of delay,
– maximum tolerance limit of data packet loss,
• Algorithm RequirementsWide area monitoring requires efficient algorithm development for data collection, pro-cessing, and transmission. The different criteria to be analyzed for designing the algo-rithms are: the total area of deployment, maximum and minimum transmission range,maximum number of sensor nodes necessary, maximum number of sensor nodes avail-able, maximum amount of power available (in the battery), the corresponding transmis-sion range, data storage capability of each node, availability of constant power source,maximum bandwidth availability, frequency of data collection and transmission spe-cific to the application scenario, and the data aggregation method suitable for the appli-cation under consideration.Analysis of the above requirements contributes to the development of required algo-rithms for designing the network topology, data collection algorithm, data aggregationalgorithm, data dissemination method, energy optimized network, networks with max-imum life time, time synchronized network, localization techniques etc.
• Network RequirementsThe design and development of the complete network architecture requires the knowl-edge and understanding of relevant technologies such as wireless networks, wired net-works, cellular networks, satellite networks etc., maximum number of nodes, maximumdata rate, available bandwidth, traffic rate, delay, distance between the point of datainitiation and its destination, effect of terrain structure, vegetation index, climate varia-tion etc., on data transmission, delay, and data packet loss, accessibility/connectivity ofthe area, location of DEP (Deep Earth Probe), transmission range, identification of thecommunication protocol and radio interface technology, integration of the applicationspecific algorithms for data collection and aggregation, routing and fault tolerance etc.These requirements have to be thoroughly analyzed with regard to the conditions of thedeployment area, maximum data transmission distance, traffic rate, and the availabletechnologies. Choose the best technologies that can be integrated effectively to achieveminimum data packet loss, delay, minimum power consumption, and fast arrival ofdata.

Wireless Sensor Network for Disaster Monitoring 7
The DEP design uses a heterogeneous structure with different types of geophysical sen-sors at different positions. The geological and hydrological properties, at the location ofeach of the DEPs, determine the total number of each of the geophysical sensors neededand their corresponding position on the DEP. These geophysical sensors are deployedor attached inside or outside of the DEP according to each of their specific deploymentstrategies.All the geological sensors on the DEP are connected to the wireless sensor node via adata acquisition board as shown in Figure 1. This apparatus, including the DEP with itssensors, the data acquisition board and the wireless sensor node, is conjunctly termed awireless probe (WP).
Fig. 1. Multi Sensor Deep Earth Probe
• Spatial Distribution of the DEP (Deep Earth Probe)Challenges come when wide area monitoring is required. Different approaches canbe used for determining the spatial distribution and deployment of Wireless Probes(WPs). The different approaches considered are the Random Approach, the Matrix Ap-proach, the Vulnerability Index Approach, and the Hybrid Approach. In the RandomApproach, WPs can be deployed at all possible locations according to the terrain struc-ture of a landslide prone mountain. Whereas in the Matrix Approach, the total area ofdeployment, A, is sectored into a matrix of NxN size, and one WP is placed in each cellof the matrix. The cell size of the matrix is selected by the smallest value of the max-imum range covered by each sensor present with the DEP. In the Vulnerability IndexApproach, WPs are deployed in vulnerable regions that have been identified during thesite investigation, terrain mapping, and soil testing. The Hybrid Approach incorporates
more than one approach stated earlier. After considering these different approaches, aparticular approach suitable for the deployment area has to be selected.
• Wireless Sensor Network RequirementsLandslide detection requires wide area monitoring, and real-time, continuous data col-lection, processing, and aggregation. Wireless Sensor Networks (WSNs) are the keyemerging technology that has the capability to real-time, continuous data collection,processing, aggregation with minimum maintenance. Any wide area monitoring mustdetermine the
– maximum number of wireless sensor nodes,
– maximum number of relay nodes,
– maximum frequency of data collection from each node per minute,
– maximum data rate required,
– maximum power required for sampling, transmitting, processing, and receiving,
– maximum tolerance limit of delay,
– maximum tolerance limit of data packet loss,
• Algorithm RequirementsWide area monitoring requires efficient algorithm development for data collection, pro-cessing, and transmission. The different criteria to be analyzed for designing the algo-rithms are: the total area of deployment, maximum and minimum transmission range,maximum number of sensor nodes necessary, maximum number of sensor nodes avail-able, maximum amount of power available (in the battery), the corresponding transmis-sion range, data storage capability of each node, availability of constant power source,maximum bandwidth availability, frequency of data collection and transmission spe-cific to the application scenario, and the data aggregation method suitable for the appli-cation under consideration.Analysis of the above requirements contributes to the development of required algo-rithms for designing the network topology, data collection algorithm, data aggregationalgorithm, data dissemination method, energy optimized network, networks with max-imum life time, time synchronized network, localization techniques etc.
• Network RequirementsThe design and development of the complete network architecture requires the knowl-edge and understanding of relevant technologies such as wireless networks, wired net-works, cellular networks, satellite networks etc., maximum number of nodes, maximumdata rate, available bandwidth, traffic rate, delay, distance between the point of datainitiation and its destination, effect of terrain structure, vegetation index, climate varia-tion etc., on data transmission, delay, and data packet loss, accessibility/connectivity ofthe area, location of DEP (Deep Earth Probe), transmission range, identification of thecommunication protocol and radio interface technology, integration of the applicationspecific algorithms for data collection and aggregation, routing and fault tolerance etc.These requirements have to be thoroughly analyzed with regard to the conditions of thedeployment area, maximum data transmission distance, traffic rate, and the availabletechnologies. Choose the best technologies that can be integrated effectively to achieveminimum data packet loss, delay, minimum power consumption, and fast arrival ofdata.
• Data Analysis Requirements The data received from the deployment area has to be mod-eled and analyzed according the application scenario requirements. Statistical modelsand pattern recognition techniques can be used for further data analysis to determinethe warning levels. Warning levels are the level of indication (from the sensors) thata landslide maybe becoming possible or about to occur. Along with this data analysisarchitecture has to be developed for effective and fast data analysis.
• Data Visualization Requirements The development of real-time systems requires the de-sign and development of: a data dissemination method, a channel or technology thatcan be used for data dissemination (within the shortest amount of time), and the datavisualization criteria & methods specific to the application scenario. The method ofdata dissemination, and the allowable delay for data dissemination, and the techniquesthat should be adopted for data dissemination will depend on the application scenariounder consideration. The architecture for data visualization has to be developed withthe goal of effective and fast streaming of data.
3. Wireless Sensor Network Architecture
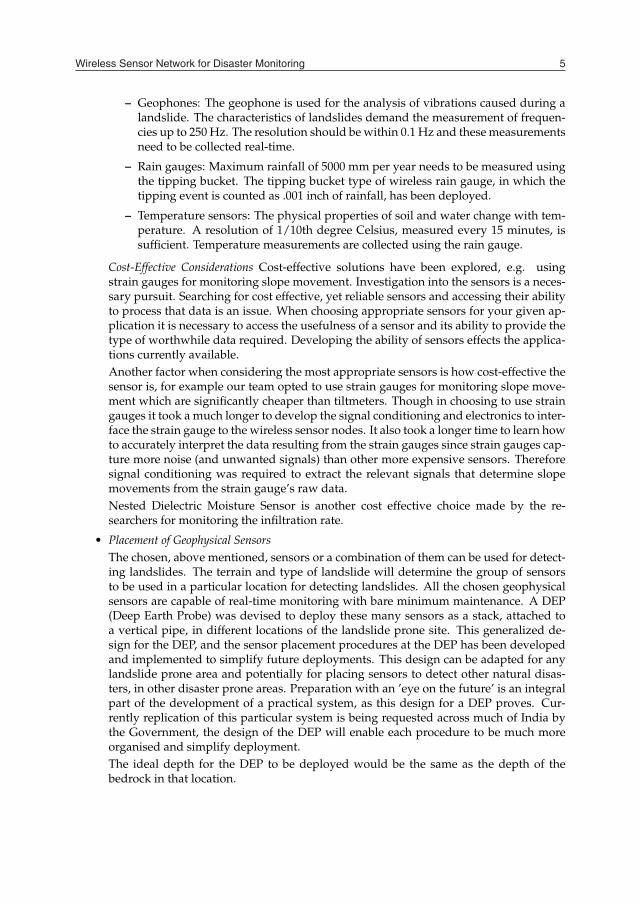
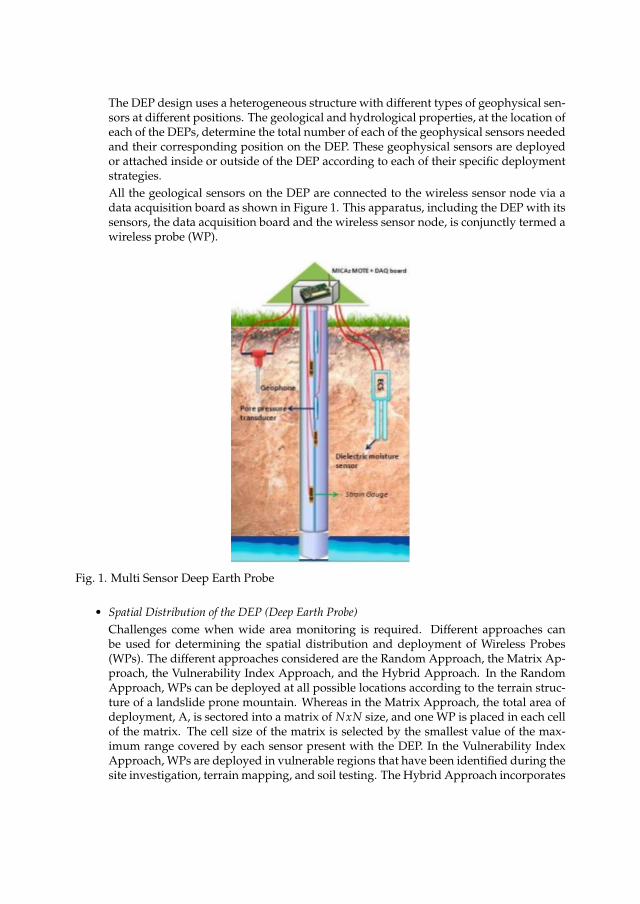
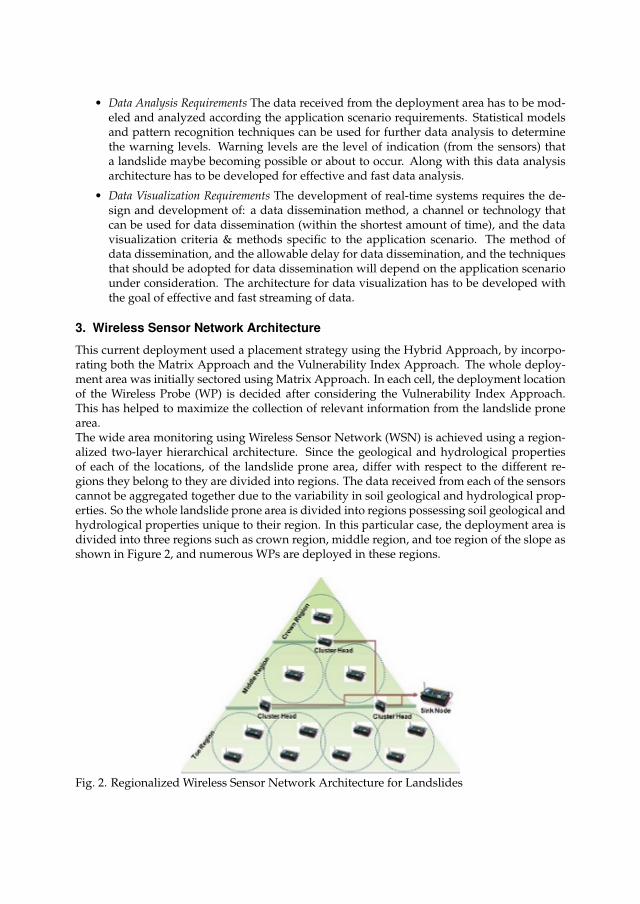
This current deployment used a placement strategy using the Hybrid Approach, by incorpo-rating both the Matrix Approach and the Vulnerability Index Approach. The whole deploy-ment area was initially sectored using Matrix Approach. In each cell, the deployment locationof the Wireless Probe (WP) is decided after considering the Vulnerability Index Approach.This has helped to maximize the collection of relevant information from the landslide pronearea.The wide area monitoring using Wireless Sensor Network (WSN) is achieved using a region-alized two-layer hierarchical architecture. Since the geological and hydrological propertiesof each of the locations, of the landslide prone area, differ with respect to the different re-gions they belong to they are divided into regions. The data received from each of the sensorscannot be aggregated together due to the variability in soil geological and hydrological prop-erties. So the whole landslide prone area is divided into regions possessing soil geological andhydrological properties unique to their region. In this particular case, the deployment area isdivided into three regions such as crown region, middle region, and toe region of the slope asshown in Figure 2, and numerous WPs are deployed in these regions.
Fig. 2. Regionalized Wireless Sensor Network Architecture for Landslides
4. Wireless Network Design and Architecture
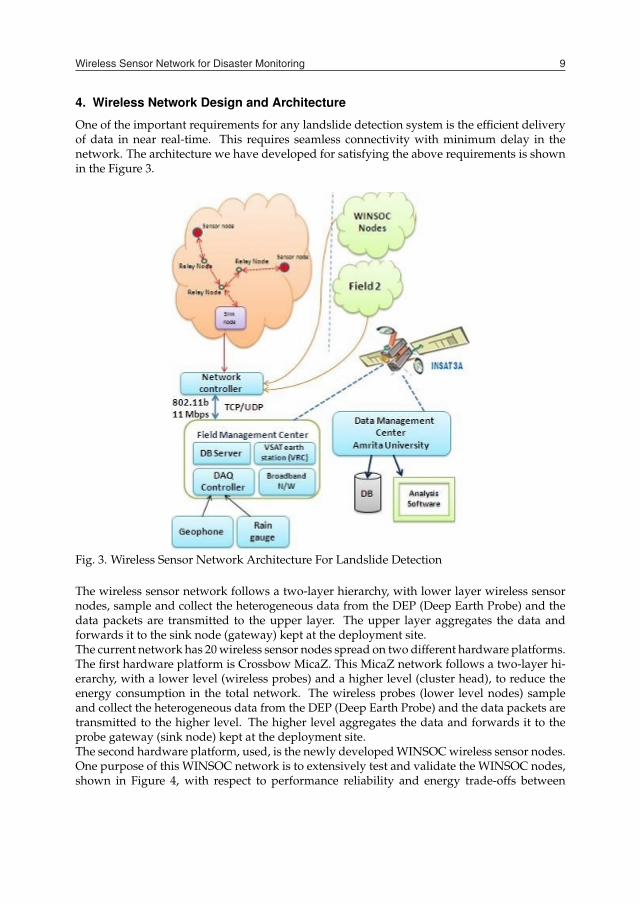
One of the important requirements for any landslide detection system is the efficient deliveryof data in near real-time. This requires seamless connectivity with minimum delay in thenetwork. The architecture we have developed for satisfying the above requirements is shownin the Figure 3.
Fig. 3. Wireless Sensor Network Architecture For Landslide Detection
The wireless sensor network follows a two-layer hierarchy, with lower layer wireless sensornodes, sample and collect the heterogeneous data from the DEP (Deep Earth Probe) and thedata packets are transmitted to the upper layer. The upper layer aggregates the data andforwards it to the sink node (gateway) kept at the deployment site.The current network has 20 wireless sensor nodes spread on two different hardware platforms.The first hardware platform is Crossbow MicaZ. This MicaZ network follows a two-layer hi-erarchy, with a lower level (wireless probes) and a higher level (cluster head), to reduce theenergy consumption in the total network. The wireless probes (lower level nodes) sampleand collect the heterogeneous data from the DEP (Deep Earth Probe) and the data packets aretransmitted to the higher level. The higher level aggregates the data and forwards it to theprobe gateway (sink node) kept at the deployment site.The second hardware platform, used, is the newly developed WINSOC wireless sensor nodes.One purpose of this WINSOC network is to extensively test and validate the WINSOC nodes,shown in Figure 4, with respect to performance reliability and energy trade-offs between
Wireless Sensor Network for Disaster Monitoring 9
• Data Analysis Requirements The data received from the deployment area has to be mod-eled and analyzed according the application scenario requirements. Statistical modelsand pattern recognition techniques can be used for further data analysis to determinethe warning levels. Warning levels are the level of indication (from the sensors) thata landslide maybe becoming possible or about to occur. Along with this data analysisarchitecture has to be developed for effective and fast data analysis.
• Data Visualization Requirements The development of real-time systems requires the de-sign and development of: a data dissemination method, a channel or technology thatcan be used for data dissemination (within the shortest amount of time), and the datavisualization criteria & methods specific to the application scenario. The method ofdata dissemination, and the allowable delay for data dissemination, and the techniquesthat should be adopted for data dissemination will depend on the application scenariounder consideration. The architecture for data visualization has to be developed withthe goal of effective and fast streaming of data.
3. Wireless Sensor Network Architecture
This current deployment used a placement strategy using the Hybrid Approach, by incorpo-rating both the Matrix Approach and the Vulnerability Index Approach. The whole deploy-ment area was initially sectored using Matrix Approach. In each cell, the deployment locationof the Wireless Probe (WP) is decided after considering the Vulnerability Index Approach.This has helped to maximize the collection of relevant information from the landslide pronearea.The wide area monitoring using Wireless Sensor Network (WSN) is achieved using a region-alized two-layer hierarchical architecture. Since the geological and hydrological propertiesof each of the locations, of the landslide prone area, differ with respect to the different re-gions they belong to they are divided into regions. The data received from each of the sensorscannot be aggregated together due to the variability in soil geological and hydrological prop-erties. So the whole landslide prone area is divided into regions possessing soil geological andhydrological properties unique to their region. In this particular case, the deployment area isdivided into three regions such as crown region, middle region, and toe region of the slope asshown in Figure 2, and numerous WPs are deployed in these regions.
Fig. 2. Regionalized Wireless Sensor Network Architecture for Landslides
4. Wireless Network Design and Architecture
One of the important requirements for any landslide detection system is the efficient deliveryof data in near real-time. This requires seamless connectivity with minimum delay in thenetwork. The architecture we have developed for satisfying the above requirements is shownin the Figure 3.
Fig. 3. Wireless Sensor Network Architecture For Landslide Detection
The wireless sensor network follows a two-layer hierarchy, with lower layer wireless sensornodes, sample and collect the heterogeneous data from the DEP (Deep Earth Probe) and thedata packets are transmitted to the upper layer. The upper layer aggregates the data andforwards it to the sink node (gateway) kept at the deployment site.The current network has 20 wireless sensor nodes spread on two different hardware platforms.The first hardware platform is Crossbow MicaZ. This MicaZ network follows a two-layer hi-erarchy, with a lower level (wireless probes) and a higher level (cluster head), to reduce theenergy consumption in the total network. The wireless probes (lower level nodes) sampleand collect the heterogeneous data from the DEP (Deep Earth Probe) and the data packets aretransmitted to the higher level. The higher level aggregates the data and forwards it to theprobe gateway (sink node) kept at the deployment site.The second hardware platform, used, is the newly developed WINSOC wireless sensor nodes.One purpose of this WINSOC network is to extensively test and validate the WINSOC nodes,shown in Figure 4, with respect to performance reliability and energy trade-offs between
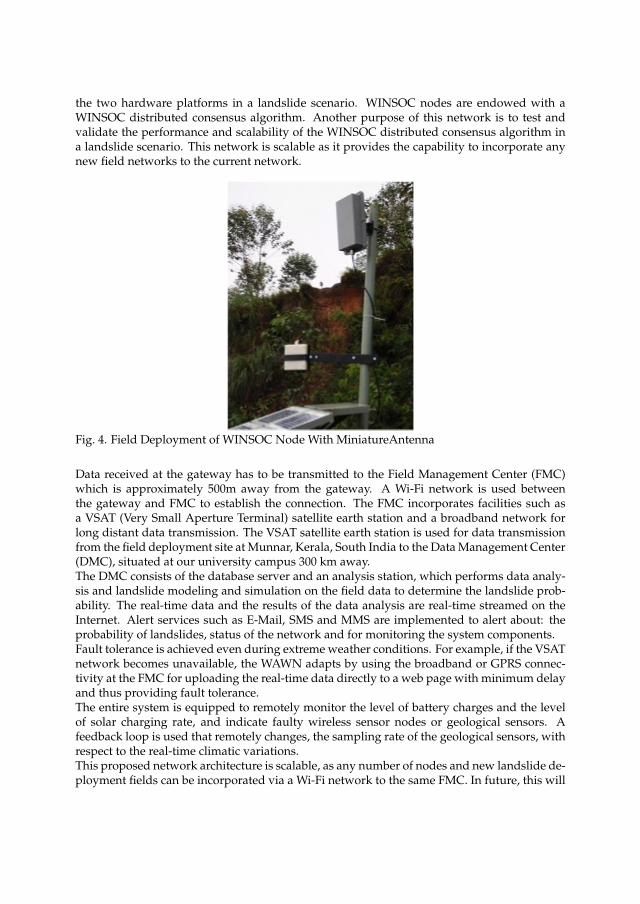
the two hardware platforms in a landslide scenario. WINSOC nodes are endowed with aWINSOC distributed consensus algorithm. Another purpose of this network is to test andvalidate the performance and scalability of the WINSOC distributed consensus algorithm ina landslide scenario. This network is scalable as it provides the capability to incorporate anynew field networks to the current network.
Fig. 4. Field Deployment of WINSOC Node With MiniatureAntenna
Data received at the gateway has to be transmitted to the Field Management Center (FMC)which is approximately 500m away from the gateway. A Wi-Fi network is used betweenthe gateway and FMC to establish the connection. The FMC incorporates facilities such asa VSAT (Very Small Aperture Terminal) satellite earth station and a broadband network forlong distant data transmission. The VSAT satellite earth station is used for data transmissionfrom the field deployment site at Munnar, Kerala, South India to the Data Management Center(DMC), situated at our university campus 300 km away.The DMC consists of the database server and an analysis station, which performs data analy-sis and landslide modeling and simulation on the field data to determine the landslide prob-ability. The real-time data and the results of the data analysis are real-time streamed on theInternet. Alert services such as E-Mail, SMS and MMS are implemented to alert about: theprobability of landslides, status of the network and for monitoring the system components.Fault tolerance is achieved even during extreme weather conditions. For example, if the VSATnetwork becomes unavailable, the WAWN adapts by using the broadband or GPRS connec-tivity at the FMC for uploading the real-time data directly to a web page with minimum delayand thus providing fault tolerance.The entire system is equipped to remotely monitor the level of battery charges and the levelof solar charging rate, and indicate faulty wireless sensor nodes or geological sensors. Afeedback loop is used that remotely changes, the sampling rate of the geological sensors, withrespect to the real-time climatic variations.This proposed network architecture is scalable, as any number of nodes and new landslide de-ployment fields can be incorporated via a Wi-Fi network to the same FMC. In future, this will
provide the capability to monitor many very large areas and also to incorporate the differentspatio-temporal analysis to provide an even better understanding of landslides.The Munnar region experiences frequent landslides and has several landslide prone areaswithin every 1 sq km, which can be utilized as future extension sites for landslide detectionsystems. The different deployment sites can connect to the FMC via a Wi-Fi network.
5. Wireless Sensor Network Algorithms
The wireless sensor network designed and deployed for wide area landslide monitoringrequires efficient data collection, data aggregation, energy management, and fault tolerantmethods.Regionalized dynamic clustering method is designed and implemented for effective geologi-cal and hydrological data collection using the wireless sensor network.Threshold based temporal data collection and data aggregation method (19)is designed andimplemented for effective data aggregation. This algorithm combined with the newly de-signed state transition algorithm (18) contributes optimum energy consumption by each nodeand in increasing the life time of the whole network, avoiding unnecessary collection, pro-cessing and transmission of redundant data thus achieving increased energy efficiency andthe simplification of the data analysis & visualization process.Fault tolerant methods are designed and integrated in the wireless sensor network for effectivehandling of node failure, reduced signal strength, high data packet loss, and low balanceenergy per node.
6. Wireless Software Architecture
Real-time monitoring and detection of landslides require seamless connectivity together withminimum delay for data transmission. The existing Wireless Sensor Network (WSN) sys-tem for landslide detection incorporates various heterogeneous wireless networks such as theWSN, Wi-Fi, satellite network, and broadband network. Each of these networks perform atdifferent frequency range, that contributes to different traffic rate, congestion, data packet loss,buffering methods, delay, and different data collection, transmission, and processing methods.Hence to reduce the complexity in dealing with different types of wireless network, genericsoftware architecture was designed and implemented for achieving all the requirements ofeach of the wireless network. This wireless software architecture includes wireless sensornetwork software, wireless sensor gateway software, and a middleware for heterogeneouswireless networks.
7. Design of Interfacing Sensors and Power Management Methods
We designed special purpose interfacing circuits, since the commercially available wirelesssensor nodes do not include implanted geophysical sensors necessary for landslide monitor-ing, and also the geophysical sensors cannot be connected directly to the data acquisitionboard, integrated with the wireless sensor node. The special purpose interfacing circuit act asan intermediary to remove the variance experienced between the required input voltage fora data acquisition board and the output voltage received from the geophysical sensors. Thusdesign requirements of the interfacing board are described in (17), and the output from theinterfacing board is directly fed into the data acquisition board inputs. Later, the signals weresoftware adjusted to obtain the original sensor outputs, and hence the sensor data. The detailsof the interfacing circuit requirements are shown in Figure 5.

Wireless Sensor Network for Disaster Monitoring 11
the two hardware platforms in a landslide scenario. WINSOC nodes are endowed with aWINSOC distributed consensus algorithm. Another purpose of this network is to test andvalidate the performance and scalability of the WINSOC distributed consensus algorithm ina landslide scenario. This network is scalable as it provides the capability to incorporate anynew field networks to the current network.
Fig. 4. Field Deployment of WINSOC Node With MiniatureAntenna
Data received at the gateway has to be transmitted to the Field Management Center (FMC)which is approximately 500m away from the gateway. A Wi-Fi network is used betweenthe gateway and FMC to establish the connection. The FMC incorporates facilities such asa VSAT (Very Small Aperture Terminal) satellite earth station and a broadband network forlong distant data transmission. The VSAT satellite earth station is used for data transmissionfrom the field deployment site at Munnar, Kerala, South India to the Data Management Center(DMC), situated at our university campus 300 km away.The DMC consists of the database server and an analysis station, which performs data analy-sis and landslide modeling and simulation on the field data to determine the landslide prob-ability. The real-time data and the results of the data analysis are real-time streamed on theInternet. Alert services such as E-Mail, SMS and MMS are implemented to alert about: theprobability of landslides, status of the network and for monitoring the system components.Fault tolerance is achieved even during extreme weather conditions. For example, if the VSATnetwork becomes unavailable, the WAWN adapts by using the broadband or GPRS connec-tivity at the FMC for uploading the real-time data directly to a web page with minimum delayand thus providing fault tolerance.The entire system is equipped to remotely monitor the level of battery charges and the levelof solar charging rate, and indicate faulty wireless sensor nodes or geological sensors. Afeedback loop is used that remotely changes, the sampling rate of the geological sensors, withrespect to the real-time climatic variations.This proposed network architecture is scalable, as any number of nodes and new landslide de-ployment fields can be incorporated via a Wi-Fi network to the same FMC. In future, this will
provide the capability to monitor many very large areas and also to incorporate the differentspatio-temporal analysis to provide an even better understanding of landslides.The Munnar region experiences frequent landslides and has several landslide prone areaswithin every 1 sq km, which can be utilized as future extension sites for landslide detectionsystems. The different deployment sites can connect to the FMC via a Wi-Fi network.
5. Wireless Sensor Network Algorithms
The wireless sensor network designed and deployed for wide area landslide monitoringrequires efficient data collection, data aggregation, energy management, and fault tolerantmethods.Regionalized dynamic clustering method is designed and implemented for effective geologi-cal and hydrological data collection using the wireless sensor network.Threshold based temporal data collection and data aggregation method (19)is designed andimplemented for effective data aggregation. This algorithm combined with the newly de-signed state transition algorithm (18) contributes optimum energy consumption by each nodeand in increasing the life time of the whole network, avoiding unnecessary collection, pro-cessing and transmission of redundant data thus achieving increased energy efficiency andthe simplification of the data analysis & visualization process.Fault tolerant methods are designed and integrated in the wireless sensor network for effectivehandling of node failure, reduced signal strength, high data packet loss, and low balanceenergy per node.
6. Wireless Software Architecture
Real-time monitoring and detection of landslides require seamless connectivity together withminimum delay for data transmission. The existing Wireless Sensor Network (WSN) sys-tem for landslide detection incorporates various heterogeneous wireless networks such as theWSN, Wi-Fi, satellite network, and broadband network. Each of these networks perform atdifferent frequency range, that contributes to different traffic rate, congestion, data packet loss,buffering methods, delay, and different data collection, transmission, and processing methods.Hence to reduce the complexity in dealing with different types of wireless network, genericsoftware architecture was designed and implemented for achieving all the requirements ofeach of the wireless network. This wireless software architecture includes wireless sensornetwork software, wireless sensor gateway software, and a middleware for heterogeneouswireless networks.
7. Design of Interfacing Sensors and Power Management Methods
We designed special purpose interfacing circuits, since the commercially available wirelesssensor nodes do not include implanted geophysical sensors necessary for landslide monitor-ing, and also the geophysical sensors cannot be connected directly to the data acquisitionboard, integrated with the wireless sensor node. The special purpose interfacing circuit act asan intermediary to remove the variance experienced between the required input voltage fora data acquisition board and the output voltage received from the geophysical sensors. Thusdesign requirements of the interfacing board are described in (17), and the output from theinterfacing board is directly fed into the data acquisition board inputs. Later, the signals weresoftware adjusted to obtain the original sensor outputs, and hence the sensor data. The detailsof the interfacing circuit requirements are shown in Figure 5.
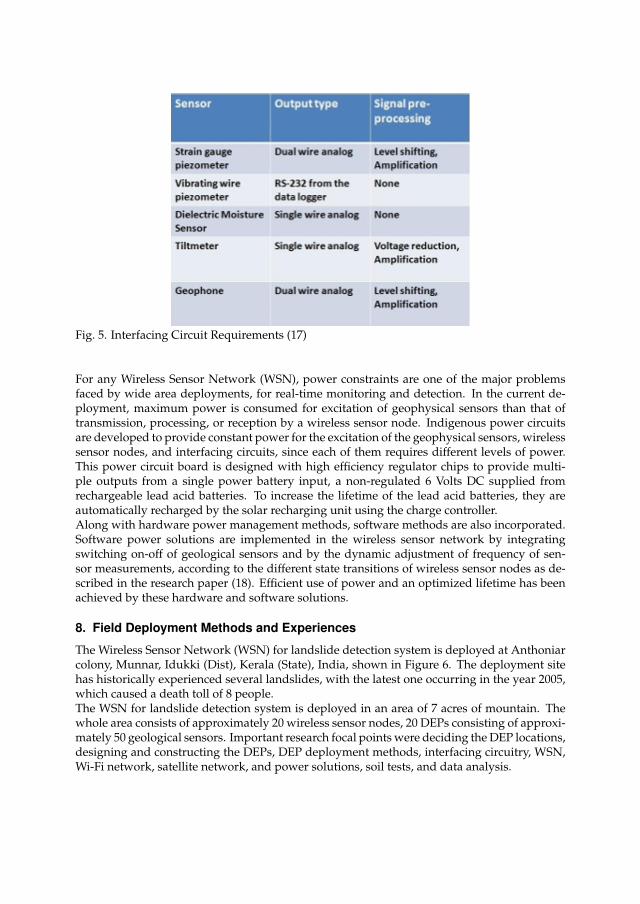
Fig. 5. Interfacing Circuit Requirements (17)
For any Wireless Sensor Network (WSN), power constraints are one of the major problemsfaced by wide area deployments, for real-time monitoring and detection. In the current de-ployment, maximum power is consumed for excitation of geophysical sensors than that oftransmission, processing, or reception by a wireless sensor node. Indigenous power circuitsare developed to provide constant power for the excitation of the geophysical sensors, wirelesssensor nodes, and interfacing circuits, since each of them requires different levels of power.This power circuit board is designed with high efficiency regulator chips to provide multi-ple outputs from a single power battery input, a non-regulated 6 Volts DC supplied fromrechargeable lead acid batteries. To increase the lifetime of the lead acid batteries, they areautomatically recharged by the solar recharging unit using the charge controller.Along with hardware power management methods, software methods are also incorporated.Software power solutions are implemented in the wireless sensor network by integratingswitching on-off of geological sensors and by the dynamic adjustment of frequency of sen-sor measurements, according to the different state transitions of wireless sensor nodes as de-scribed in the research paper (18). Efficient use of power and an optimized lifetime has beenachieved by these hardware and software solutions.
8. Field Deployment Methods and Experiences
The Wireless Sensor Network (WSN) for landslide detection system is deployed at Anthoniarcolony, Munnar, Idukki (Dist), Kerala (State), India, shown in Figure 6. The deployment sitehas historically experienced several landslides, with the latest one occurring in the year 2005,which caused a death toll of 8 people.The WSN for landslide detection system is deployed in an area of 7 acres of mountain. Thewhole area consists of approximately 20 wireless sensor nodes, 20 DEPs consisting of approxi-mately 50 geological sensors. Important research focal points were deciding the DEP locations,designing and constructing the DEPs, DEP deployment methods, interfacing circuitry, WSN,Wi-Fi network, satellite network, and power solutions, soil tests, and data analysis.
Extensive field investigations were conducted for identifying the possible landslide prone ar-eas for the deployment of the system and also for identifying the possible locations for DEPdeployment. The borehole locations for the DEPs were chosen so as to measure the cumulativeeffect of geographically specific parameters that cause landslides.The field deployment was performed in two phases. The pilot deployment in January 2008 toMarch 2008 and the main deployment from January 2009 to June 2009. The period in betweenthese phases involved extensive testing and calibration processes.
8.1 Field SelectionExtensive field investigations were conducted for identifying the possible landslide prone ar-eas for the deployment of the system, in the state of Kerala, India. Approximately 15 landslideprone areas have been visited and studied, that had historically experienced landslides. Afterextensive investigation of the 15 sites, five sites were identified as potential field deploymentsites for a Wireless Sensor Network (WSN) in landslide monitoring applications. Other siteswere also visited but were not deemed suitable for the field deployment due to various factors,including: difficulty of access, uncertainty about the landslide risk, lack of communication fa-cilities, and the size of the potential landslide, among others.
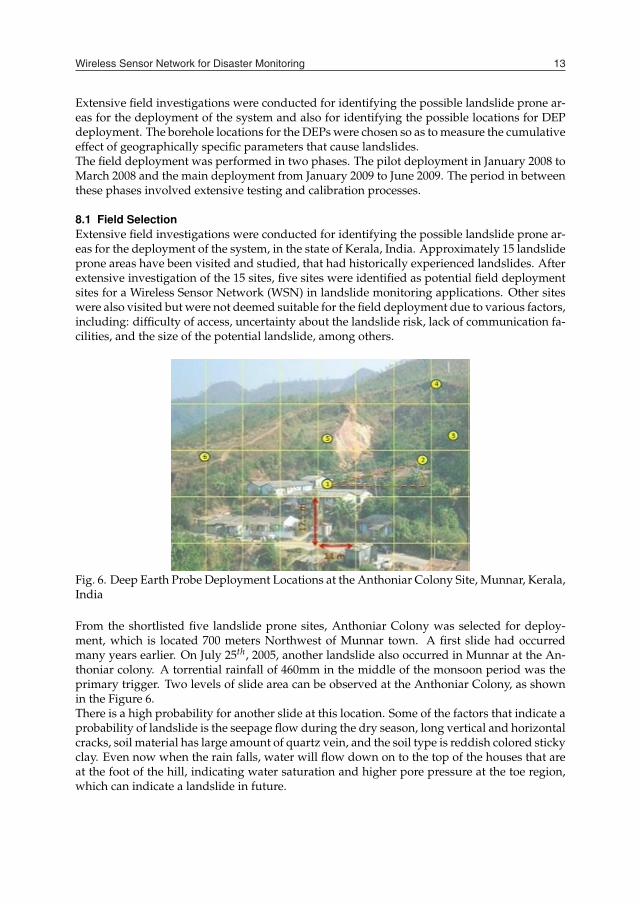
Fig. 6. Deep Earth Probe Deployment Locations at the Anthoniar Colony Site, Munnar, Kerala,India
From the shortlisted five landslide prone sites, Anthoniar Colony was selected for deploy-ment, which is located 700 meters Northwest of Munnar town. A first slide had occurredmany years earlier. On July 25th, 2005, another landslide also occurred in Munnar at the An-thoniar colony. A torrential rainfall of 460mm in the middle of the monsoon period was theprimary trigger. Two levels of slide area can be observed at the Anthoniar Colony, as shownin the Figure 6.There is a high probability for another slide at this location. Some of the factors that indicate aprobability of landslide is the seepage flow during the dry season, long vertical and horizontalcracks, soil material has large amount of quartz vein, and the soil type is reddish colored stickyclay. Even now when the rain falls, water will flow down on to the top of the houses that areat the foot of the hill, indicating water saturation and higher pore pressure at the toe region,which can indicate a landslide in future.
Wireless Sensor Network for Disaster Monitoring 13
Fig. 5. Interfacing Circuit Requirements (17)
For any Wireless Sensor Network (WSN), power constraints are one of the major problemsfaced by wide area deployments, for real-time monitoring and detection. In the current de-ployment, maximum power is consumed for excitation of geophysical sensors than that oftransmission, processing, or reception by a wireless sensor node. Indigenous power circuitsare developed to provide constant power for the excitation of the geophysical sensors, wirelesssensor nodes, and interfacing circuits, since each of them requires different levels of power.This power circuit board is designed with high efficiency regulator chips to provide multi-ple outputs from a single power battery input, a non-regulated 6 Volts DC supplied fromrechargeable lead acid batteries. To increase the lifetime of the lead acid batteries, they areautomatically recharged by the solar recharging unit using the charge controller.Along with hardware power management methods, software methods are also incorporated.Software power solutions are implemented in the wireless sensor network by integratingswitching on-off of geological sensors and by the dynamic adjustment of frequency of sen-sor measurements, according to the different state transitions of wireless sensor nodes as de-scribed in the research paper (18). Efficient use of power and an optimized lifetime has beenachieved by these hardware and software solutions.
8. Field Deployment Methods and Experiences
The Wireless Sensor Network (WSN) for landslide detection system is deployed at Anthoniarcolony, Munnar, Idukki (Dist), Kerala (State), India, shown in Figure 6. The deployment sitehas historically experienced several landslides, with the latest one occurring in the year 2005,which caused a death toll of 8 people.The WSN for landslide detection system is deployed in an area of 7 acres of mountain. Thewhole area consists of approximately 20 wireless sensor nodes, 20 DEPs consisting of approxi-mately 50 geological sensors. Important research focal points were deciding the DEP locations,designing and constructing the DEPs, DEP deployment methods, interfacing circuitry, WSN,Wi-Fi network, satellite network, and power solutions, soil tests, and data analysis.
Extensive field investigations were conducted for identifying the possible landslide prone ar-eas for the deployment of the system and also for identifying the possible locations for DEPdeployment. The borehole locations for the DEPs were chosen so as to measure the cumulativeeffect of geographically specific parameters that cause landslides.The field deployment was performed in two phases. The pilot deployment in January 2008 toMarch 2008 and the main deployment from January 2009 to June 2009. The period in betweenthese phases involved extensive testing and calibration processes.
8.1 Field SelectionExtensive field investigations were conducted for identifying the possible landslide prone ar-eas for the deployment of the system, in the state of Kerala, India. Approximately 15 landslideprone areas have been visited and studied, that had historically experienced landslides. Afterextensive investigation of the 15 sites, five sites were identified as potential field deploymentsites for a Wireless Sensor Network (WSN) in landslide monitoring applications. Other siteswere also visited but were not deemed suitable for the field deployment due to various factors,including: difficulty of access, uncertainty about the landslide risk, lack of communication fa-cilities, and the size of the potential landslide, among others.
Fig. 6. Deep Earth Probe Deployment Locations at the Anthoniar Colony Site, Munnar, Kerala,India
From the shortlisted five landslide prone sites, Anthoniar Colony was selected for deploy-ment, which is located 700 meters Northwest of Munnar town. A first slide had occurredmany years earlier. On July 25th, 2005, another landslide also occurred in Munnar at the An-thoniar colony. A torrential rainfall of 460mm in the middle of the monsoon period was theprimary trigger. Two levels of slide area can be observed at the Anthoniar Colony, as shownin the Figure 6.There is a high probability for another slide at this location. Some of the factors that indicate aprobability of landslide is the seepage flow during the dry season, long vertical and horizontalcracks, soil material has large amount of quartz vein, and the soil type is reddish colored stickyclay. Even now when the rain falls, water will flow down on to the top of the houses that areat the foot of the hill, indicating water saturation and higher pore pressure at the toe region,which can indicate a landslide in future.
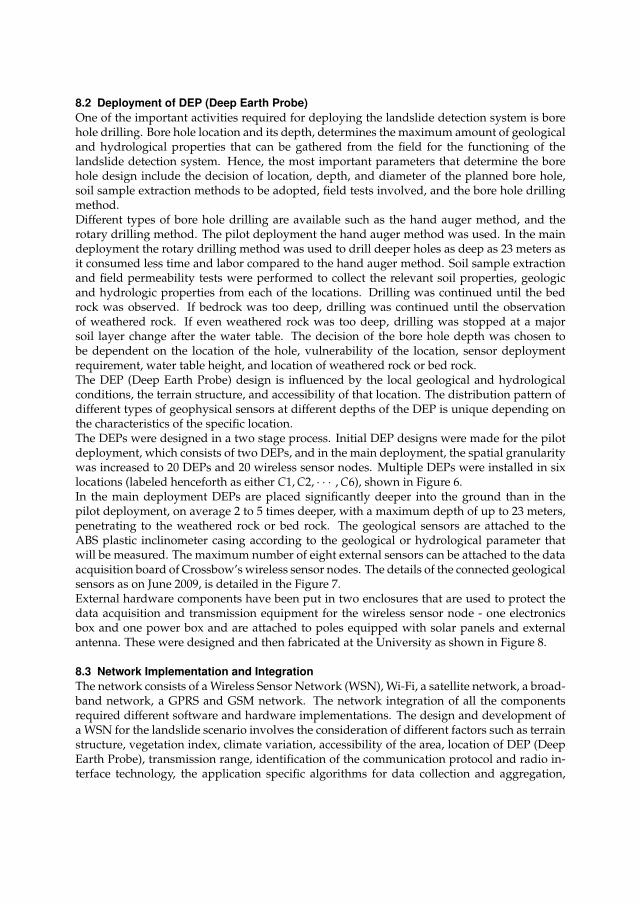
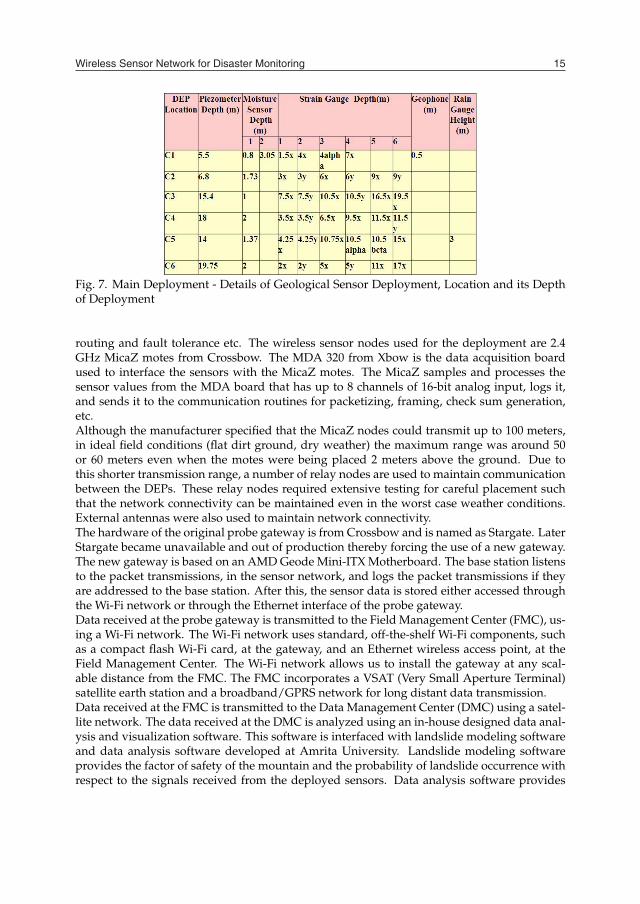
8.2 Deployment of DEP (Deep Earth Probe)One of the important activities required for deploying the landslide detection system is borehole drilling. Bore hole location and its depth, determines the maximum amount of geologicaland hydrological properties that can be gathered from the field for the functioning of thelandslide detection system. Hence, the most important parameters that determine the borehole design include the decision of location, depth, and diameter of the planned bore hole,soil sample extraction methods to be adopted, field tests involved, and the bore hole drillingmethod.Different types of bore hole drilling are available such as the hand auger method, and therotary drilling method. The pilot deployment the hand auger method was used. In the maindeployment the rotary drilling method was used to drill deeper holes as deep as 23 meters asit consumed less time and labor compared to the hand auger method. Soil sample extractionand field permeability tests were performed to collect the relevant soil properties, geologicand hydrologic properties from each of the locations. Drilling was continued until the bedrock was observed. If bedrock was too deep, drilling was continued until the observationof weathered rock. If even weathered rock was too deep, drilling was stopped at a majorsoil layer change after the water table. The decision of the bore hole depth was chosen tobe dependent on the location of the hole, vulnerability of the location, sensor deploymentrequirement, water table height, and location of weathered rock or bed rock.The DEP (Deep Earth Probe) design is influenced by the local geological and hydrologicalconditions, the terrain structure, and accessibility of that location. The distribution pattern ofdifferent types of geophysical sensors at different depths of the DEP is unique depending onthe characteristics of the specific location.The DEPs were designed in a two stage process. Initial DEP designs were made for the pilotdeployment, which consists of two DEPs, and in the main deployment, the spatial granularitywas increased to 20 DEPs and 20 wireless sensor nodes. Multiple DEPs were installed in sixlocations (labeled henceforth as either C1, C2, · · · , C6), shown in Figure 6.In the main deployment DEPs are placed significantly deeper into the ground than in thepilot deployment, on average 2 to 5 times deeper, with a maximum depth of up to 23 meters,penetrating to the weathered rock or bed rock. The geological sensors are attached to theABS plastic inclinometer casing according to the geological or hydrological parameter thatwill be measured. The maximum number of eight external sensors can be attached to the dataacquisition board of Crossbow’s wireless sensor nodes. The details of the connected geologicalsensors as on June 2009, is detailed in the Figure 7.External hardware components have been put in two enclosures that are used to protect thedata acquisition and transmission equipment for the wireless sensor node - one electronicsbox and one power box and are attached to poles equipped with solar panels and externalantenna. These were designed and then fabricated at the University as shown in Figure 8.
8.3 Network Implementation and IntegrationThe network consists of a Wireless Sensor Network (WSN), Wi-Fi, a satellite network, a broad-band network, a GPRS and GSM network. The network integration of all the componentsrequired different software and hardware implementations. The design and development ofa WSN for the landslide scenario involves the consideration of different factors such as terrainstructure, vegetation index, climate variation, accessibility of the area, location of DEP (DeepEarth Probe), transmission range, identification of the communication protocol and radio in-terface technology, the application specific algorithms for data collection and aggregation,
Fig. 7. Main Deployment - Details of Geological Sensor Deployment, Location and its Depthof Deployment
routing and fault tolerance etc. The wireless sensor nodes used for the deployment are 2.4GHz MicaZ motes from Crossbow. The MDA 320 from Xbow is the data acquisition boardused to interface the sensors with the MicaZ motes. The MicaZ samples and processes thesensor values from the MDA board that has up to 8 channels of 16-bit analog input, logs it,and sends it to the communication routines for packetizing, framing, check sum generation,etc.Although the manufacturer specified that the MicaZ nodes could transmit up to 100 meters,in ideal field conditions (flat dirt ground, dry weather) the maximum range was around 50or 60 meters even when the motes were being placed 2 meters above the ground. Due tothis shorter transmission range, a number of relay nodes are used to maintain communicationbetween the DEPs. These relay nodes required extensive testing for careful placement suchthat the network connectivity can be maintained even in the worst case weather conditions.External antennas were also used to maintain network connectivity.The hardware of the original probe gateway is from Crossbow and is named as Stargate. LaterStargate became unavailable and out of production thereby forcing the use of a new gateway.The new gateway is based on an AMD Geode Mini-ITX Motherboard. The base station listensto the packet transmissions, in the sensor network, and logs the packet transmissions if theyare addressed to the base station. After this, the sensor data is stored either accessed throughthe Wi-Fi network or through the Ethernet interface of the probe gateway.Data received at the probe gateway is transmitted to the Field Management Center (FMC), us-ing a Wi-Fi network. The Wi-Fi network uses standard, off-the-shelf Wi-Fi components, suchas a compact flash Wi-Fi card, at the gateway, and an Ethernet wireless access point, at theField Management Center. The Wi-Fi network allows us to install the gateway at any scal-able distance from the FMC. The FMC incorporates a VSAT (Very Small Aperture Terminal)satellite earth station and a broadband/GPRS network for long distant data transmission.Data received at the FMC is transmitted to the Data Management Center (DMC) using a satel-lite network. The data received at the DMC is analyzed using an in-house designed data anal-ysis and visualization software. This software is interfaced with landslide modeling softwareand data analysis software developed at Amrita University. Landslide modeling softwareprovides the factor of safety of the mountain and the probability of landslide occurrence withrespect to the signals received from the deployed sensors. Data analysis software provides
Wireless Sensor Network for Disaster Monitoring 15
8.2 Deployment of DEP (Deep Earth Probe)One of the important activities required for deploying the landslide detection system is borehole drilling. Bore hole location and its depth, determines the maximum amount of geologicaland hydrological properties that can be gathered from the field for the functioning of thelandslide detection system. Hence, the most important parameters that determine the borehole design include the decision of location, depth, and diameter of the planned bore hole,soil sample extraction methods to be adopted, field tests involved, and the bore hole drillingmethod.Different types of bore hole drilling are available such as the hand auger method, and therotary drilling method. The pilot deployment the hand auger method was used. In the maindeployment the rotary drilling method was used to drill deeper holes as deep as 23 meters asit consumed less time and labor compared to the hand auger method. Soil sample extractionand field permeability tests were performed to collect the relevant soil properties, geologicand hydrologic properties from each of the locations. Drilling was continued until the bedrock was observed. If bedrock was too deep, drilling was continued until the observationof weathered rock. If even weathered rock was too deep, drilling was stopped at a majorsoil layer change after the water table. The decision of the bore hole depth was chosen tobe dependent on the location of the hole, vulnerability of the location, sensor deploymentrequirement, water table height, and location of weathered rock or bed rock.The DEP (Deep Earth Probe) design is influenced by the local geological and hydrologicalconditions, the terrain structure, and accessibility of that location. The distribution pattern ofdifferent types of geophysical sensors at different depths of the DEP is unique depending onthe characteristics of the specific location.The DEPs were designed in a two stage process. Initial DEP designs were made for the pilotdeployment, which consists of two DEPs, and in the main deployment, the spatial granularitywas increased to 20 DEPs and 20 wireless sensor nodes. Multiple DEPs were installed in sixlocations (labeled henceforth as either C1, C2, · · · , C6), shown in Figure 6.In the main deployment DEPs are placed significantly deeper into the ground than in thepilot deployment, on average 2 to 5 times deeper, with a maximum depth of up to 23 meters,penetrating to the weathered rock or bed rock. The geological sensors are attached to theABS plastic inclinometer casing according to the geological or hydrological parameter thatwill be measured. The maximum number of eight external sensors can be attached to the dataacquisition board of Crossbow’s wireless sensor nodes. The details of the connected geologicalsensors as on June 2009, is detailed in the Figure 7.External hardware components have been put in two enclosures that are used to protect thedata acquisition and transmission equipment for the wireless sensor node - one electronicsbox and one power box and are attached to poles equipped with solar panels and externalantenna. These were designed and then fabricated at the University as shown in Figure 8.
8.3 Network Implementation and IntegrationThe network consists of a Wireless Sensor Network (WSN), Wi-Fi, a satellite network, a broad-band network, a GPRS and GSM network. The network integration of all the componentsrequired different software and hardware implementations. The design and development ofa WSN for the landslide scenario involves the consideration of different factors such as terrainstructure, vegetation index, climate variation, accessibility of the area, location of DEP (DeepEarth Probe), transmission range, identification of the communication protocol and radio in-terface technology, the application specific algorithms for data collection and aggregation,
Fig. 7. Main Deployment - Details of Geological Sensor Deployment, Location and its Depthof Deployment
routing and fault tolerance etc. The wireless sensor nodes used for the deployment are 2.4GHz MicaZ motes from Crossbow. The MDA 320 from Xbow is the data acquisition boardused to interface the sensors with the MicaZ motes. The MicaZ samples and processes thesensor values from the MDA board that has up to 8 channels of 16-bit analog input, logs it,and sends it to the communication routines for packetizing, framing, check sum generation,etc.Although the manufacturer specified that the MicaZ nodes could transmit up to 100 meters,in ideal field conditions (flat dirt ground, dry weather) the maximum range was around 50or 60 meters even when the motes were being placed 2 meters above the ground. Due tothis shorter transmission range, a number of relay nodes are used to maintain communicationbetween the DEPs. These relay nodes required extensive testing for careful placement suchthat the network connectivity can be maintained even in the worst case weather conditions.External antennas were also used to maintain network connectivity.The hardware of the original probe gateway is from Crossbow and is named as Stargate. LaterStargate became unavailable and out of production thereby forcing the use of a new gateway.The new gateway is based on an AMD Geode Mini-ITX Motherboard. The base station listensto the packet transmissions, in the sensor network, and logs the packet transmissions if theyare addressed to the base station. After this, the sensor data is stored either accessed throughthe Wi-Fi network or through the Ethernet interface of the probe gateway.Data received at the probe gateway is transmitted to the Field Management Center (FMC), us-ing a Wi-Fi network. The Wi-Fi network uses standard, off-the-shelf Wi-Fi components, suchas a compact flash Wi-Fi card, at the gateway, and an Ethernet wireless access point, at theField Management Center. The Wi-Fi network allows us to install the gateway at any scal-able distance from the FMC. The FMC incorporates a VSAT (Very Small Aperture Terminal)satellite earth station and a broadband/GPRS network for long distant data transmission.Data received at the FMC is transmitted to the Data Management Center (DMC) using a satel-lite network. The data received at the DMC is analyzed using an in-house designed data anal-ysis and visualization software. This software is interfaced with landslide modeling softwareand data analysis software developed at Amrita University. Landslide modeling softwareprovides the factor of safety of the mountain and the probability of landslide occurrence withrespect to the signals received from the deployed sensors. Data analysis software provides
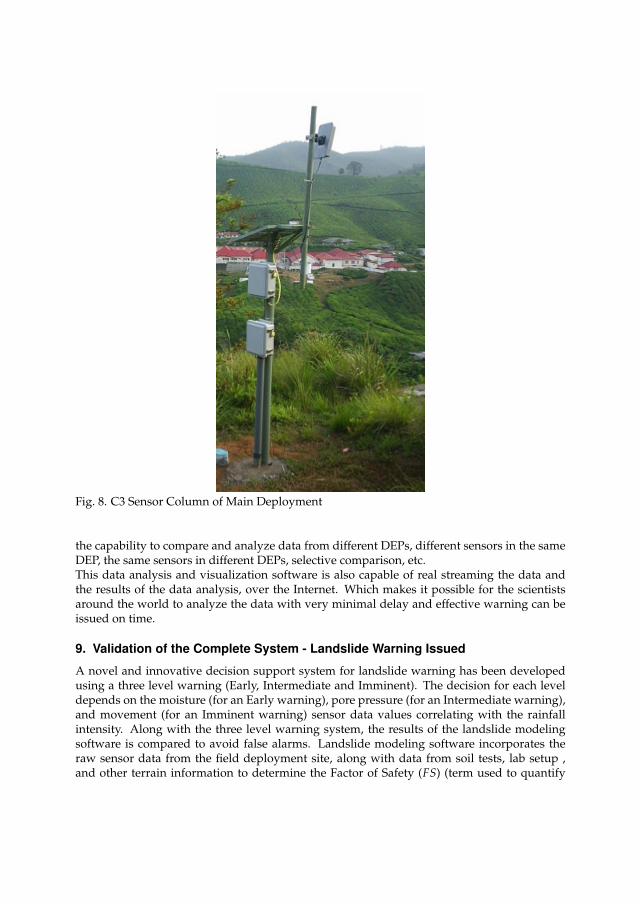
Fig. 8. C3 Sensor Column of Main Deployment
the capability to compare and analyze data from different DEPs, different sensors in the sameDEP, the same sensors in different DEPs, selective comparison, etc.This data analysis and visualization software is also capable of real streaming the data andthe results of the data analysis, over the Internet. Which makes it possible for the scientistsaround the world to analyze the data with very minimal delay and effective warning can beissued on time.
9. Validation of the Complete System - Landslide Warning Issued
A novel and innovative decision support system for landslide warning has been developedusing a three level warning (Early, Intermediate and Imminent). The decision for each leveldepends on the moisture (for an Early warning), pore pressure (for an Intermediate warning),and movement (for an Imminent warning) sensor data values correlating with the rainfallintensity. Along with the three level warning system, the results of the landslide modelingsoftware is compared to avoid false alarms. Landslide modeling software incorporates theraw sensor data from the field deployment site, along with data from soil tests, lab setup ,and other terrain information to determine the Factor of Safety (FS) (term used to quantify
Fig. 9. Snapshot from the real streaming software, for a period of 18 July 2009 (00: 00:17) to 20July 2009 (08:09:05) for location 5, the middle position of the hill
the slope stability). Dependent on the results reaching a threshold (that is, if FS ≤ 1), eachgrid point could be pronounced ’unsafe’ or ’safe’. This implementation is incorporated intothe data visualization software and the results are real-time streamed to the website.In July 2009, high rain fall was experienced at our deployment site and multiple landslidesoccurred all over the state of Kerala, India. The data analysis showed an increase in porepressure and also noticeable soil movements. The pore pressure transducer deployed 14 meterdeep from the surface at location 5 (which is a vulnerable area), showed a gradual increase inpore pressure. The strain gauges deployed at location 5, at various depths such as 4.25 x,4.25 y, 10.75 x, 10.5 alpha, 10.5 beta and 15 x show noticeable movements of underneath soil.More strain gauge soil movement is shown at position 10.75 x, 10.5 alpha and 10.5. Othersensors at 6 different locations at Anthoniar Colony also showed observable soil movementsand increase in pore pressure.Our real streaming software currently incorporated to www.winsoc.org website can be usedto view the pattern.Figure 9 shows the real-time streaming data, for a period of July 18th, 2009 to July 20th, 2009for location 5. The figure shows an increase in the pore pressure and also soil movements atthe middle position of the hill, which is actually a vulnerable area after the previous landslideof July, 2005. Additionally, the soil moisture sensor readings at location 1, the toe region of thehill, were already saturated. The strain gauges at location 1 and location 4 also showed slightsoil movements.All of the above analysis shows the vulnerability of Anthoniar Colony to pos-sible landslides. In this context, we issued a preliminary warning through television channels,and the official Kerala State Government authorities were informed. The government author-ities considered the warning seriously. Higher officials made visits to the landslide prone areaand the people were asked to evacuate with the warning given below.We would like to inform you that in case the torrential rainfall prevails, it would be wiser to alert the
people of this region and advise them to relocate to another area till the region comes back to normalcyin terms of pore pressure and underneath soil movements.
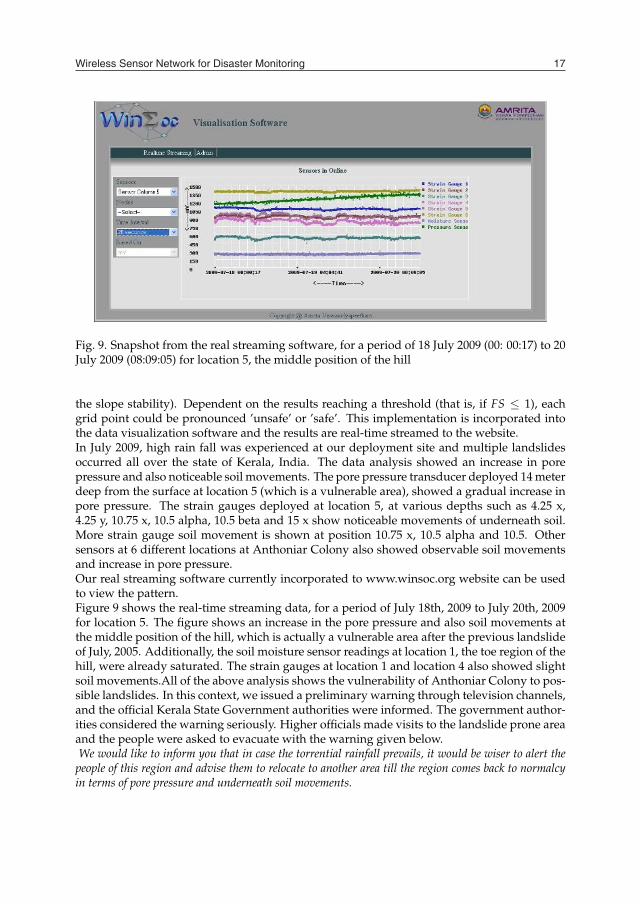
Wireless Sensor Network for Disaster Monitoring 17
Fig. 8. C3 Sensor Column of Main Deployment
the capability to compare and analyze data from different DEPs, different sensors in the sameDEP, the same sensors in different DEPs, selective comparison, etc.This data analysis and visualization software is also capable of real streaming the data andthe results of the data analysis, over the Internet. Which makes it possible for the scientistsaround the world to analyze the data with very minimal delay and effective warning can beissued on time.
9. Validation of the Complete System - Landslide Warning Issued
A novel and innovative decision support system for landslide warning has been developedusing a three level warning (Early, Intermediate and Imminent). The decision for each leveldepends on the moisture (for an Early warning), pore pressure (for an Intermediate warning),and movement (for an Imminent warning) sensor data values correlating with the rainfallintensity. Along with the three level warning system, the results of the landslide modelingsoftware is compared to avoid false alarms. Landslide modeling software incorporates theraw sensor data from the field deployment site, along with data from soil tests, lab setup ,and other terrain information to determine the Factor of Safety (FS) (term used to quantify
Fig. 9. Snapshot from the real streaming software, for a period of 18 July 2009 (00: 00:17) to 20July 2009 (08:09:05) for location 5, the middle position of the hill
the slope stability). Dependent on the results reaching a threshold (that is, if FS ≤ 1), eachgrid point could be pronounced ’unsafe’ or ’safe’. This implementation is incorporated intothe data visualization software and the results are real-time streamed to the website.In July 2009, high rain fall was experienced at our deployment site and multiple landslidesoccurred all over the state of Kerala, India. The data analysis showed an increase in porepressure and also noticeable soil movements. The pore pressure transducer deployed 14 meterdeep from the surface at location 5 (which is a vulnerable area), showed a gradual increase inpore pressure. The strain gauges deployed at location 5, at various depths such as 4.25 x,4.25 y, 10.75 x, 10.5 alpha, 10.5 beta and 15 x show noticeable movements of underneath soil.More strain gauge soil movement is shown at position 10.75 x, 10.5 alpha and 10.5. Othersensors at 6 different locations at Anthoniar Colony also showed observable soil movementsand increase in pore pressure.Our real streaming software currently incorporated to www.winsoc.org website can be usedto view the pattern.Figure 9 shows the real-time streaming data, for a period of July 18th, 2009 to July 20th, 2009for location 5. The figure shows an increase in the pore pressure and also soil movements atthe middle position of the hill, which is actually a vulnerable area after the previous landslideof July, 2005. Additionally, the soil moisture sensor readings at location 1, the toe region of thehill, were already saturated. The strain gauges at location 1 and location 4 also showed slightsoil movements.All of the above analysis shows the vulnerability of Anthoniar Colony to pos-sible landslides. In this context, we issued a preliminary warning through television channels,and the official Kerala State Government authorities were informed. The government author-ities considered the warning seriously. Higher officials made visits to the landslide prone areaand the people were asked to evacuate with the warning given below.We would like to inform you that in case the torrential rainfall prevails, it would be wiser to alert the
people of this region and advise them to relocate to another area till the region comes back to normalcyin terms of pore pressure and underneath soil movements.
As the rainfall reduced, the real-time streaming software showed the pore pressure reducingand then stabilizing. This situation helped us to validate the complete system. As a result ofthe successful warning issuance and system validation, the Indian government now wants toextent the network to all possible landslide areas.
10. Conclusion
Wireless Sensor Networks (WSNs) are still an emerging technology and much literature avail-able is still theoretical, therefore practical deployment guides using actual experience are fewif any. Using real practical experience, this overview of operations is one such guide provid-ing the methodical steps and outlining the basic requirements when designing and deployinga WSN into any given application.This chapter discusses the design and deployment of a landslide detection system using aWSN system at Anthoniar Colony, Munnar, Idukki (Dist), Kerala (State), India, a highly land-slide prone area The deployment site had historically experienced several landslides, with thelatest one occurring in the year 2005, which caused a death toll of 10 (people).Our researchers, at Amrita University, designed and deployed a Wireless Sensor Network forthe purpose of landslide detection. The complete functional system consists of 50 geologicalsensors and 20 wireless sensor nodes. This network has the capability to provide real-timedata through the Internet and also to issue warnings ahead of time using the innovative threelevel warning system developed as part of this work. The system incorporates energy efficientdata collection methods, fault tolerant clustering approaches, and threshold based data aggre-gation techniques. This wireless sensor network system is in place. For two years it has beengathering vast amounts of data, providing better understanding of landslide scenario and hasbeen poised to warn of any pertinent landslide disaster in future. The system has provedits validity by delivering real warning to the local community during heavy rains in the lastmonsoon season (July 2009). This system is scalable to other landslide prone areas and also itcan be used for flood, avalanche, and water quality monitoring with minor modifications.This development describes a real experience and makes apparent the significant advantagesof using Wireless Sensor Networks in Disaster Management. The knowledge gained from thisactual experience is useful in the development of other systems for continuous monitoringand detection of critical and emergency applications.
Acknowledgments
The author would like to express gratitude for the immense amount of motivation and re-search solutions provided by Sri. Mata Amritanandamayi Devi, The Chancellor, Amrita Uni-versity. The authors would also like to acknowledge Dr. P. Venkat Rangan, Dr. H. M. Iyer,Dr. P. V. Ushakumari, Dr. Bharat Jayaraman, Dr. Nirmala Vasudevan, Mr. Sangeeth Kumar,Mr. Joshua (Udar) D. Freeman, Mr. Vijayan Selvan, Mr. Kalainger (Kailash) Thangaraju, Mr.Mukundan T. Raman, Ms Rekha. Prabha, Ms. Thushara. Eranholi, Mr. Manohar. B. Patil, Ms.Erica (Thapasya) S. Fernandes for their valuable contribution to this work.
11. References
[1] Biavati, G.; Godt, W. & McKenna, J. P. (2006). Drainage effects on the transient, near-surface hydrologic response of a steep hillslope to rainfall: implications for slope sta-bility, Edmonds, Washington, USA, Natural Hazards Earth System Science, Vol. 6, pp.343-355, 2006.
[2] Caine, N. (1980). The rainfall intensity-duration control of shallow landslides and debrisflows, Geografiska Annaler, Vol. 62A, pp. 23-27, 1980.
[3] Christanto, N.; Hadmoko, D.S.; Westen, C. J.; Lavigne, F.; Sartohadi, J. & Setiawan, M.A. (2009). Characteristic and Behavior of Rainfall Induced Landslides in Java Island,Indonesia : an Overview, Geophysical Research Abstracts, Vol. 11, 2009.
[4] Garich, E. A. (2007). Wireless, Automated Monitoring For Potential Landslide Hazards,Masters Thesis, Texas A & M University, 2007.
[5] Hill, C. & Sippel, K. (2002) Modern Deformation Monitoring: A Multi Sensor Approach,In Proceedings of FIG XXII International Congress, Washington D.C, USA, April 19-26,2002.
[6] Iverson, R.M. (2000). Landslide triggering by rain infiltration, Water Resource Research,Vol. 36, pp. 1897-1910, 2000.
[7] Kimura, H. & Yamaguchl. Y. (2000). Detection of landslide areas using satellite radarinterferometry, Photogrammetric Engineering & Remote Sensing, Vol. 6 (3), pp. 337-344,2000.
[8] Kumar, V.S.; Sampath, S.; Vinayak, P. V. S. S. K. & Harikumar, R. (2007). Rainfall intensitycharacteristics in at coastal and high altitude stations in Kerala, Journal of Earth SystemsSciences, Vol. 116 (5), pp. 451-463, 2007.
[9] Kung, H.; Hua, J. & Chen, C. (2006) Drought Forecast Model and Framework UsingWireless Sensor Networks, Journal of Information Science and Engineering, Vol. 22, pp.751-769, 2006.
[10] Kunnath, A. T. & Ramesh, M. V. (2010). Integrating geophone network to real-timewireless sensor network system for landslide detection, In Proceedings of The Third In-ternational Conference on Sensor Technologies and Applications, SENSORCOMM 2010, IEEEXplore, 2010.
[11] Kuriakose, S.; Jetten, V. G.; van Westen, C. J.; Sankar, G. & van Beek, L. P. H. (2008). PoreWater Pressure as a Trigger of Shallow Landslides in the Western Ghats of Kerala, India:Some Preliminary Observations from an Experimental Catchment, Physical Geography,Vol. 29 (4), pp. 374-386, 2008.
[12] LAN, Hengxing.; ZHOU, C.; Lee , C. F.; WANG, S. & Faquan, W. U. (2003). Rainfall-induced landslide stability analysis in response to transient pore pressure - A case studyof natural terrain landslide in Hong Kong, Science in China Ser. E Technological Sciences,Vol. 46, pp. 52-68, 2003.
[13] Liu, H.; Meng, Z. & Cui, S. (2007). A Wireless Sensor Network Prototype for Environ-mental Monitoring in Greenhouses, IEEE Xplore, 2007.
[14] Marchi, L.; Arattano, M. & Deganutti, A. M. (2002). Ten years of debris-flow monitoringin the Moscardo Torrent (Italian Alphs), Geomorphology, Elseveir, Vol. 46, pp. 1-17, 2002.
[15] Martinez, C.; Jorge, E. & Olarte Montero, Juan, eds. (2001). Socioeconomic and Envi-ronmental Impacts of Landslides in the Western Hemisphere, Proceedings of the ThirdPanamerican Symposium on Landslides, July 29 to August 3, Cartagena, Colombia, 2001.
[16] Musaloiu-E, R.; Terzis, A.; Szlavecz, K.; Szalay, A.; Cogan, J. & Gray, J. (2006). Life Underyour Feet: A Wireless Soil Ecology Sensor Network, 2006.
[17] Ramesh, M. V. (2009). Real-time Wireless Sensor Network for Landslide Detection, InProceedings of The Third International Conference on Sensor Technologies and Applications,SENSORCOMM 2009, IEEE Digital Library, 2009.
[18] Ramesh, M.V.; Raj, R. T.; Freeman, J. D.; Kumar, S. & Rangan, P. V. (2007). Factorsand Approaches for Energy Optimized Wireless Sensor Network to Detect Rainfall In-
Wireless Sensor Network for Disaster Monitoring 19
As the rainfall reduced, the real-time streaming software showed the pore pressure reducingand then stabilizing. This situation helped us to validate the complete system. As a result ofthe successful warning issuance and system validation, the Indian government now wants toextent the network to all possible landslide areas.
10. Conclusion
Wireless Sensor Networks (WSNs) are still an emerging technology and much literature avail-able is still theoretical, therefore practical deployment guides using actual experience are fewif any. Using real practical experience, this overview of operations is one such guide provid-ing the methodical steps and outlining the basic requirements when designing and deployinga WSN into any given application.This chapter discusses the design and deployment of a landslide detection system using aWSN system at Anthoniar Colony, Munnar, Idukki (Dist), Kerala (State), India, a highly land-slide prone area The deployment site had historically experienced several landslides, with thelatest one occurring in the year 2005, which caused a death toll of 10 (people).Our researchers, at Amrita University, designed and deployed a Wireless Sensor Network forthe purpose of landslide detection. The complete functional system consists of 50 geologicalsensors and 20 wireless sensor nodes. This network has the capability to provide real-timedata through the Internet and also to issue warnings ahead of time using the innovative threelevel warning system developed as part of this work. The system incorporates energy efficientdata collection methods, fault tolerant clustering approaches, and threshold based data aggre-gation techniques. This wireless sensor network system is in place. For two years it has beengathering vast amounts of data, providing better understanding of landslide scenario and hasbeen poised to warn of any pertinent landslide disaster in future. The system has provedits validity by delivering real warning to the local community during heavy rains in the lastmonsoon season (July 2009). This system is scalable to other landslide prone areas and also itcan be used for flood, avalanche, and water quality monitoring with minor modifications.This development describes a real experience and makes apparent the significant advantagesof using Wireless Sensor Networks in Disaster Management. The knowledge gained from thisactual experience is useful in the development of other systems for continuous monitoringand detection of critical and emergency applications.
Acknowledgments
The author would like to express gratitude for the immense amount of motivation and re-search solutions provided by Sri. Mata Amritanandamayi Devi, The Chancellor, Amrita Uni-versity. The authors would also like to acknowledge Dr. P. Venkat Rangan, Dr. H. M. Iyer,Dr. P. V. Ushakumari, Dr. Bharat Jayaraman, Dr. Nirmala Vasudevan, Mr. Sangeeth Kumar,Mr. Joshua (Udar) D. Freeman, Mr. Vijayan Selvan, Mr. Kalainger (Kailash) Thangaraju, Mr.Mukundan T. Raman, Ms Rekha. Prabha, Ms. Thushara. Eranholi, Mr. Manohar. B. Patil, Ms.Erica (Thapasya) S. Fernandes for their valuable contribution to this work.
11. References
[1] Biavati, G.; Godt, W. & McKenna, J. P. (2006). Drainage effects on the transient, near-surface hydrologic response of a steep hillslope to rainfall: implications for slope sta-bility, Edmonds, Washington, USA, Natural Hazards Earth System Science, Vol. 6, pp.343-355, 2006.
[2] Caine, N. (1980). The rainfall intensity-duration control of shallow landslides and debrisflows, Geografiska Annaler, Vol. 62A, pp. 23-27, 1980.
[3] Christanto, N.; Hadmoko, D.S.; Westen, C. J.; Lavigne, F.; Sartohadi, J. & Setiawan, M.A. (2009). Characteristic and Behavior of Rainfall Induced Landslides in Java Island,Indonesia : an Overview, Geophysical Research Abstracts, Vol. 11, 2009.
[4] Garich, E. A. (2007). Wireless, Automated Monitoring For Potential Landslide Hazards,Masters Thesis, Texas A & M University, 2007.
[5] Hill, C. & Sippel, K. (2002) Modern Deformation Monitoring: A Multi Sensor Approach,In Proceedings of FIG XXII International Congress, Washington D.C, USA, April 19-26,2002.
[6] Iverson, R.M. (2000). Landslide triggering by rain infiltration, Water Resource Research,Vol. 36, pp. 1897-1910, 2000.
[7] Kimura, H. & Yamaguchl. Y. (2000). Detection of landslide areas using satellite radarinterferometry, Photogrammetric Engineering & Remote Sensing, Vol. 6 (3), pp. 337-344,2000.
[8] Kumar, V.S.; Sampath, S.; Vinayak, P. V. S. S. K. & Harikumar, R. (2007). Rainfall intensitycharacteristics in at coastal and high altitude stations in Kerala, Journal of Earth SystemsSciences, Vol. 116 (5), pp. 451-463, 2007.
[9] Kung, H.; Hua, J. & Chen, C. (2006) Drought Forecast Model and Framework UsingWireless Sensor Networks, Journal of Information Science and Engineering, Vol. 22, pp.751-769, 2006.
[10] Kunnath, A. T. & Ramesh, M. V. (2010). Integrating geophone network to real-timewireless sensor network system for landslide detection, In Proceedings of The Third In-ternational Conference on Sensor Technologies and Applications, SENSORCOMM 2010, IEEEXplore, 2010.
[11] Kuriakose, S.; Jetten, V. G.; van Westen, C. J.; Sankar, G. & van Beek, L. P. H. (2008). PoreWater Pressure as a Trigger of Shallow Landslides in the Western Ghats of Kerala, India:Some Preliminary Observations from an Experimental Catchment, Physical Geography,Vol. 29 (4), pp. 374-386, 2008.
[12] LAN, Hengxing.; ZHOU, C.; Lee , C. F.; WANG, S. & Faquan, W. U. (2003). Rainfall-induced landslide stability analysis in response to transient pore pressure - A case studyof natural terrain landslide in Hong Kong, Science in China Ser. E Technological Sciences,Vol. 46, pp. 52-68, 2003.
[13] Liu, H.; Meng, Z. & Cui, S. (2007). A Wireless Sensor Network Prototype for Environ-mental Monitoring in Greenhouses, IEEE Xplore, 2007.
[14] Marchi, L.; Arattano, M. & Deganutti, A. M. (2002). Ten years of debris-flow monitoringin the Moscardo Torrent (Italian Alphs), Geomorphology, Elseveir, Vol. 46, pp. 1-17, 2002.
[15] Martinez, C.; Jorge, E. & Olarte Montero, Juan, eds. (2001). Socioeconomic and Envi-ronmental Impacts of Landslides in the Western Hemisphere, Proceedings of the ThirdPanamerican Symposium on Landslides, July 29 to August 3, Cartagena, Colombia, 2001.
[16] Musaloiu-E, R.; Terzis, A.; Szlavecz, K.; Szalay, A.; Cogan, J. & Gray, J. (2006). Life Underyour Feet: A Wireless Soil Ecology Sensor Network, 2006.
[17] Ramesh, M. V. (2009). Real-time Wireless Sensor Network for Landslide Detection, InProceedings of The Third International Conference on Sensor Technologies and Applications,SENSORCOMM 2009, IEEE Digital Library, 2009.
[18] Ramesh, M.V.; Raj, R. T.; Freeman, J. D.; Kumar, S. & Rangan, P. V. (2007). Factorsand Approaches for Energy Optimized Wireless Sensor Network to Detect Rainfall In-
duced Landslides, In Proceedings of the 2007 International Conference on Wireless Networks(ICWN’07), pp. 435-438, CSREA Press, June, 2007.
[19] Ramesh, M. V. & Ushakumari, P. (2008). Threshold Based Data Aggregation AlgorithmTo Detect Rainfall Induced Landslides, In Proceedings of the 2008 International Conferenceon Wireless Networks (ICWN’08), Vol. 1, pp. 255-261, 2008.
[20] Ramesh, M. V.; Vasudevan, N. & Freeman, J. (2009). Real Time Landslide Monitoringvia Wireless Sensor Network,In EGU Geophysical Research Abstracts, Vol. 11, EGU2009-14061, EGU General Assembly, 2009.
[21] Ramesh, M. V.; Kumar, S. & Rangan, P. V. (2009). Wireless Sensor Network for Land-slide Detection, In the Proceedings of the 2009 International Conference on Wireless Networks(ICWN’09), pp. 89-95, 2009.
[22] Ramesh, M. V. & Soman, K. P. (2009). Wireless Sensor Network LocalizationWith Impre-cise Measurements Using Only a Quadratic Solver, In the Proceedings of the 2009 Interna-tional Conference on Wireless Networks (ICWN’09), pp. 109-112, 2009.
[23] Raj, R.; Ramesh, M. V. & Kumar, S. (2008). Fault Tolerant Clustering Approaches inWireless Sensor Network for Landslide Area Monitoring, In Proceedings of the 2008 In-ternational Conference on Wireless Networks (ICWN’08), Vol. 1, pp. 107-113, 2008.
[24] Reid, M. E.; LaHusen, M. E. & Iverson, R.M. (1988). Hydraulic factors triggering a shal-low landslide failure, Bulletin of the Association of Engineering Geologists, Vol. 25(3), pp.349-361, 1988.
[25] Takehiko, O. & Yoshitsugu, T. (1998). The Characteristics of Pore Water Pressure Fluctu-ation on the Slip Surface Based on Drainage Well Works: Study of Tairasawa LandslideArea, Saitama Prefecture, Landslides, Vol. 35(3), pp. 24-33, 1998.
[26] Terzis, A.; Anandarajah, A.; Moore, K. & Wang, I. J.(2006). Slip Surface Localization inWireless Sensor Networks for Landslide Prediction, In Proceedings of Information Process-ing in Sensor Networks (IPSN’06), IEEE, 2006.
[27] Thampi, P. K.; Mathai, J.; Sankar, G. & Sidharthan, S. (1997). Landslides: Causes, Controland Mitigation, Centre for Earth Science Studies, Trivandrum
[28] Tofani, V.; Dapporto, S.; Vannocci, P. & Casagli, N. (2005). Analysis of infiltration, seep-age processes and slope instability mechanisms during the November 2000 storm eventin Tuscany, Advances in Geosciences, Vol. 2, pp. 301-304, 2005.
[29] Tsaparas, I.; Rahardjo, H.; Toll, D. G. & Leong, E. C. (2002). Controlling parameters forrainfall-induced landslides, Computers and Geotechnics, Vol. 29, pp. 1-27, 2002.
[30] Turner, A. K. (1996). Landslides: Investigation and Mitigation, United States Transporta-tion Research Board, National Research Council, 1996.
[31] Van Asch, Th. W. J.; Buma, J. & Van Beek, L. P. H. (1999). A view on some hydrologicaltriggering systems in landslides, Geomorphology, Vol. 30 (1-2), pp. 25-32, October 1999.
[32] Wang et.al 2003 Wang, G. & Sassa, K. (2003). Pore-pressure generation and movementof rainfall-induced landslide: Effect of grain size and fine-particle content, EngineeringGeology, Vol. 69, pp. 109-125, 2003.
[33] Wilson, R. C. & Wieczorek, G. F. (1995). Rainfall Thresholds for the Initiation of DebrisFlowa at La Honda, California, Environmental and Engineering Geoscience, Vol. 1 (1), pp.11-27, 1995.