wind engineering research field laboratory selected … · i . wind engineering research field...
TRANSCRIPT

i
Wind Engineering Research Field Laboratory Selected Data Sets for
Comparison to Model-Scale, Full-Scale and Computational Fluid Dynamics
Simulations
Douglas A. Smith, Ph.D., P.E., F.SEI, F. ASCE Stephen M. Morse, Ph.D.
Kishor C. Mehta, Ph.D., P.E., NAE, P.H. Horn Professor
Wind Science and Engineering Research Center Texas Tech University
Lubbock, Texas February 2017

i
Foreword
An important part of numerical or physical simulation of a physical process, such as wind
effects on structures, is validation. In the case of the wind hazard simulation, validation of two components is desirable: (1) validation of the wind flow characteristics (input); and, (2) validation of the measured pressures on the test specimen (output). The validation of these two components of the simulation should, ideally, be made with data collected in the natural environment on identical structures.
Personnel at the Wind Science and Engineering Research Center have collected data on several full-scale buildings and other structures since 1989. Wind and wind-induced pressure data collected in natural winds are available for a full-scale test specimen. This dataset provides the opportunity for comparison with simulation data collected in a physical facility or generated using computational fluid dynamics..
This report provides the time histories and summary statistics for 15-minute duration records with flow direction acting through our 160 ft high meteorological tower and then impinging on the Wind Engineering Research Field Laboratory test structure. In addition, we provide the available drawings for the test structure along with a drawing and a table showing the location of the instrumented pressure taps installed on the test structure.
This research was supported by the National Science Foundation Grants BCS-88-21542 and the CSU/TTU Cooperative Program in Wind Engineering, Grant No. CMS-9411147. and the NIST/TTU Cooperative Agreement, Windstorm Mitigation Initiative.
ii
Table of Contents Foreword ........................................................................................................................................................ i
Table of Contents .......................................................................................................................................... ii
List of Tables ................................................................................................................................................ iii
List of Figures ............................................................................................................................................... iv
1. Introduction .......................................................................................................................................... 1
2. Wind Engineering Research Field Laboratory ....................................................................................... 1
2.1. Meteorological Tower ................................................................................................................... 1
2.2. Test Structure ................................................................................................................................ 1
3. Data ....................................................................................................................................................... 2
3.1. Typical Data Characteristics .......................................................................................................... 2
3.2. Data Validation Process ................................................................................................................ 3
3.3. Data Selection Criteria .................................................................................................................. 3
3.4. Selected Records ........................................................................................................................... 3
4. Conclusion ............................................................................................................................................. 3
5. References ............................................................................................................................................ 4
6. Tables .................................................................................................................................................... 5
7. Figures ................................................................................................................................................. 19
iii
List of Tables Table 1 Instrumentation used at the Wind Engineering Research Field Laboratory (WERFL) facility on 4th Street. ............................................................................................................................................................ 5 Table 2 Tap locations on the test structure at the Wind Engineering Research Field Laboratory on 4th Street. ............................................................................................................................................................ 6 Table 3 File structure for time histories of data collected at the Wind Engineering Research Field Laboratory (WERFL) on 4th Street .............................................................................................................. 10 Table 4 Summary statistics of wind flow characteristics for selected records from WERFL. ..................... 18 Table 5 Malfunctioning instruments for each run. .................................................................................... 18
iv
List of Figures Figure 1 Roof damage from Hurricane Ike .................................................................................................. 19 Figure 2 Orientation of meteorological tower and the test building (North is towards the top of figure and the 160 ft tower has an azimuth angle of approximately 280° relative to the center of the WERFL building location). ....................................................................................................................................... 20 Figure 3 Meteorological tower located at the Wind Engineering Research Field Laboratory (WERFL) on 4th Street. ................................................................................................................................................... 21 Figure 4 Flat roof configuration of test structure corresponding to the data provided. ............................ 22 Figure 5 Organization of instruments and tubing for roof pressure measurements on the test structure. .................................................................................................................................................................... 23 Figure 6 Organization of instruments and tubing for wall pressure measurements on the test structure. .................................................................................................................................................................... 24 Figure 7 New pressure tap installation used for Mode 1001 data. ............................................................ 25 Figure 8 Tap locations on the test structure. .............................................................................................. 26 Figure 9 Plot of mean Pressure coefficients for record 620. ...................................................................... 27 Figure 10 Plot of standard deviation pressure coefficients for record 620. ............................................... 28

1
1. Introduction
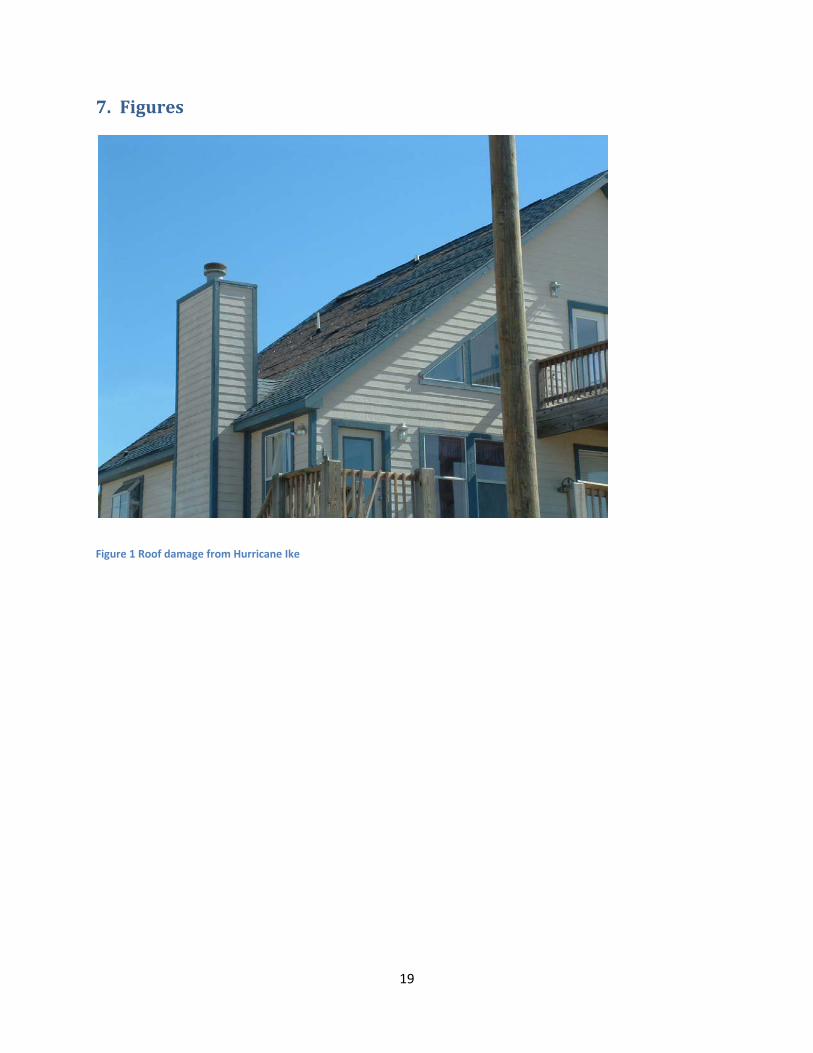
Mitigation of wind-induced damage, such as the roof covering damage shown in Figure 1 that occurred during hurricane Ike, is an overarching goal for wind engineering. The mitigation of damage from wind hazard peril is investigated by the wind engineering community using model-scale simulations in the wind tunnel, full-scale simulations (e.g. those conducted at the Institute of Building and Home Safety, IBHS) and numerical simulations. Regardless of the simulation source, the input (flow characteristics) and the output (flow-induced pressures) should be validated with data collected in the natural environment.
To assist researchers in validating their wind hazard simulations, we identify and provide time histories and summary statistics for 15-minute duration records with flow direction that acted through our 160 ft high meteorological tower and then impinged on the Wind Engineering Research Field Laboratory test structure. In addition, as part of this task, we provide the available drawings for the test structure along with a drawing and a table showing the location of the instrumented pressure taps installed on the test structure.
2. Wind Engineering Research Field Laboratory
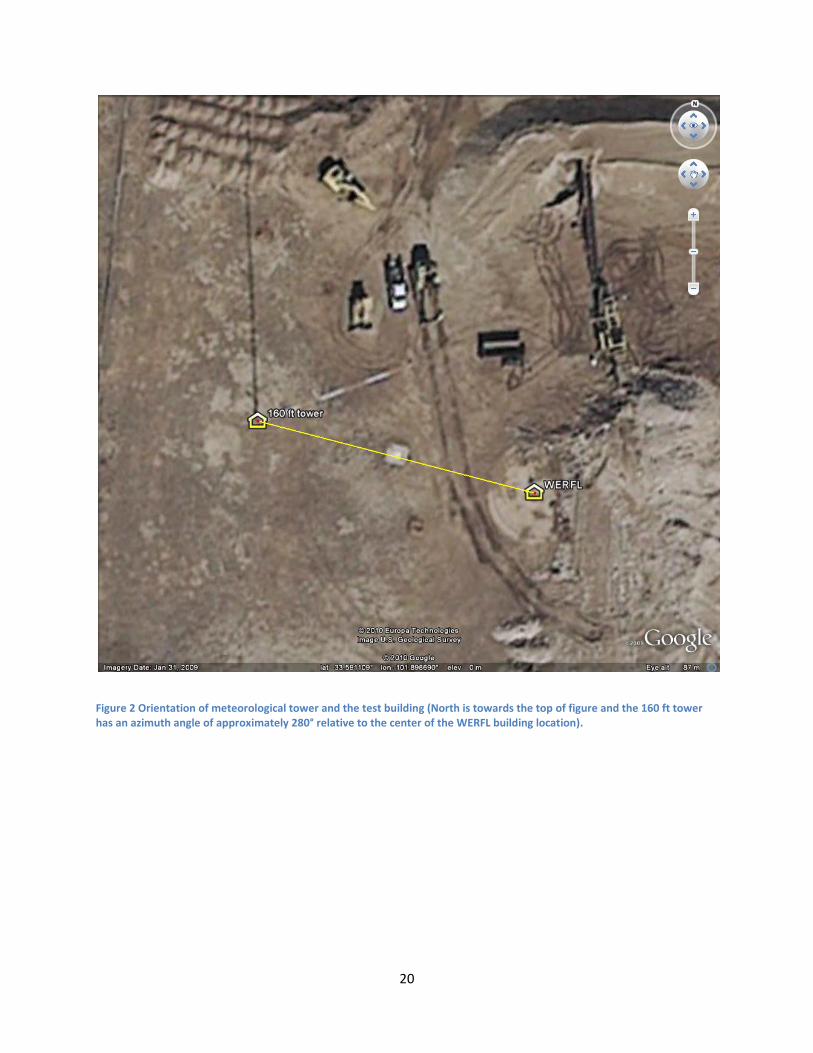
The Wind Engineering Research Field Laboratory (WERFL) was constructed in Lubbock, Texas on the campus of Texas Tech University in 1989. Since that point in time it has produced high quality data that is commonly used for validation of wind tunnel [1-4] and computational fluid dynamic results [5-7]. The facility consists of a 160 ft meteorological tower instrumented at 5 heights (8’, 13’, 33’, 70’, and 160’) and a 30’x45’x13’ high test structure. Wind flow from an azimuth angle of approximately 280° flows through the tower and then impacts the test building (see Figure 2). Each component is briefly described below. Additional details about the facility are given in [8, 9].
2.1. Meteorological Tower
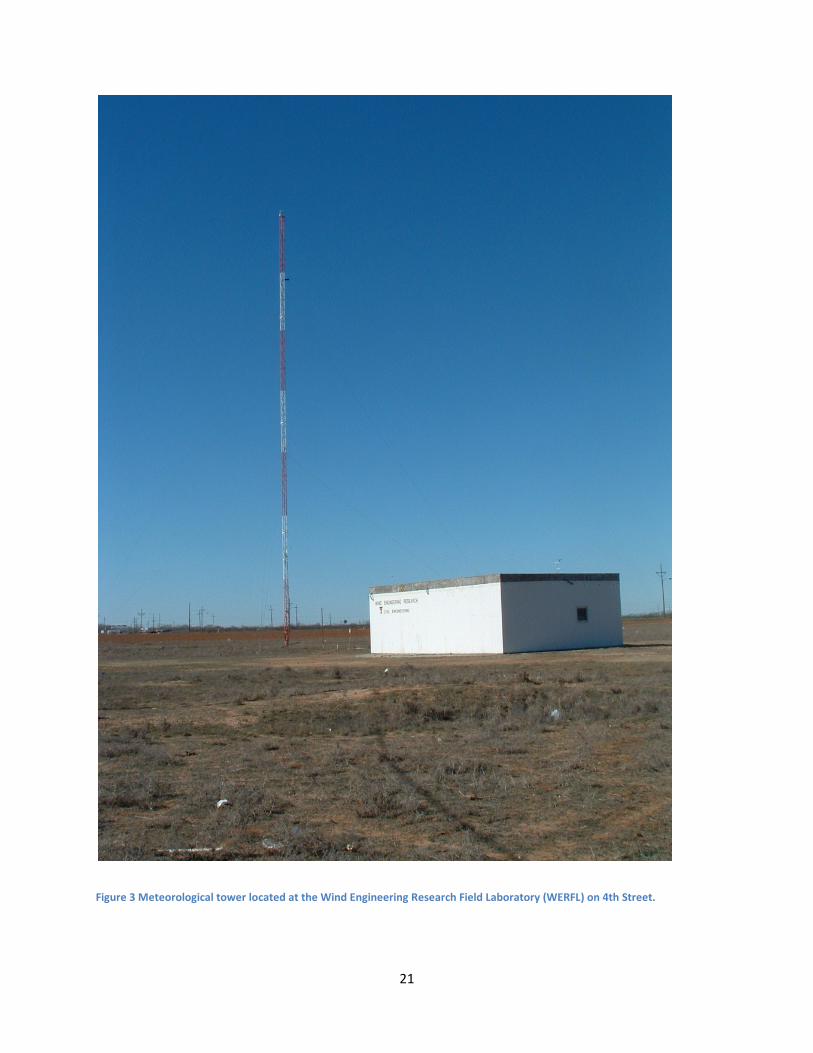
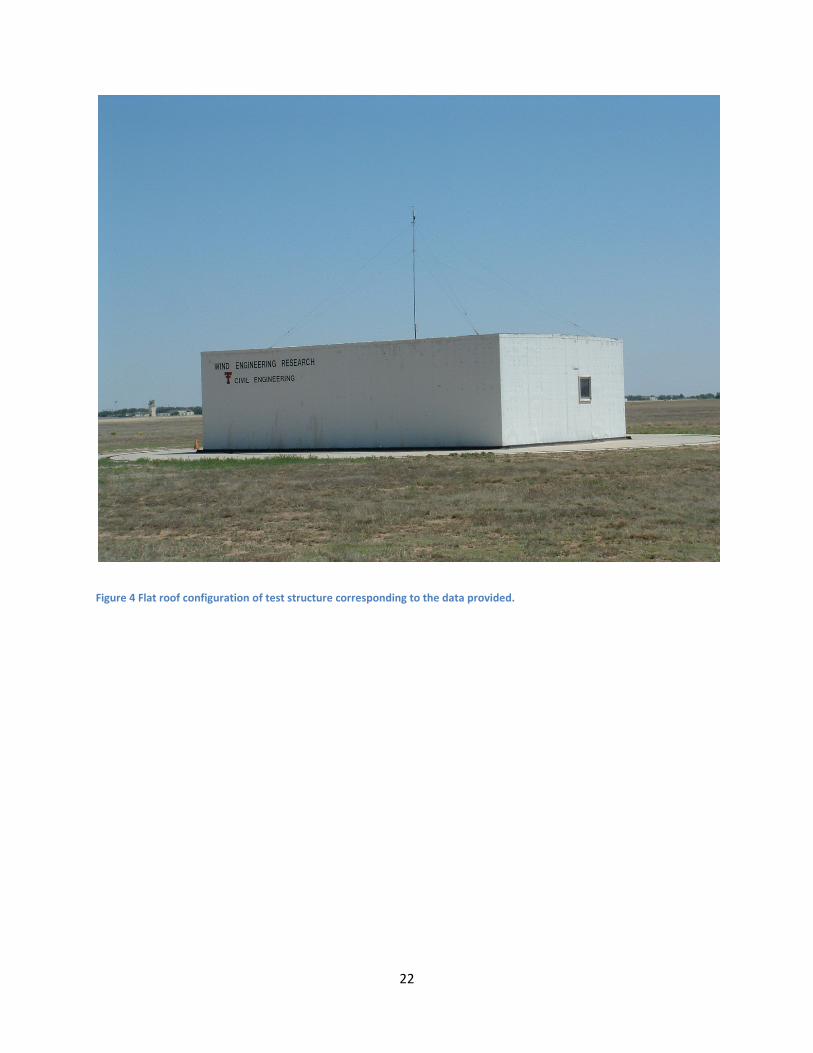
The 160 ft high meteorological tower is a guyed lattice structure (see Figure 3) instrumented at 5 heights. Meteorological instrumentation is mounted on a boom arm that extends toward the Northwest, thus wind from this azimuth angle is not influenced by the tower structure. The meteorological instrumentation used on the tower is provided in Table 1. UVW instruments were used at all 5 heights to measure wind speed and wind direction. A three-cup anemometer and a direction vane are mounted on a separate 13 ft high pole between the test structure and the meteorological tower for redundancy. A three-component sonic wind speed instrument is mounted at 19 ft above the geometric center of the flat roof (see Figure 4).
2.2. Test Structure
2
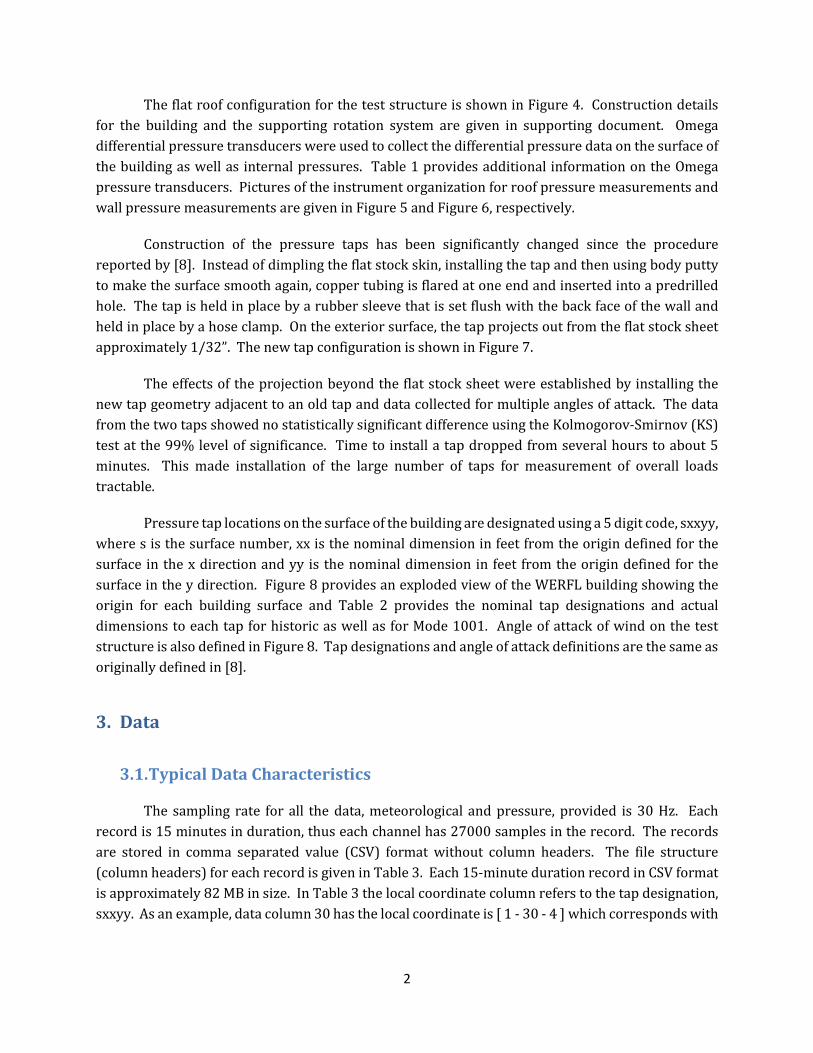
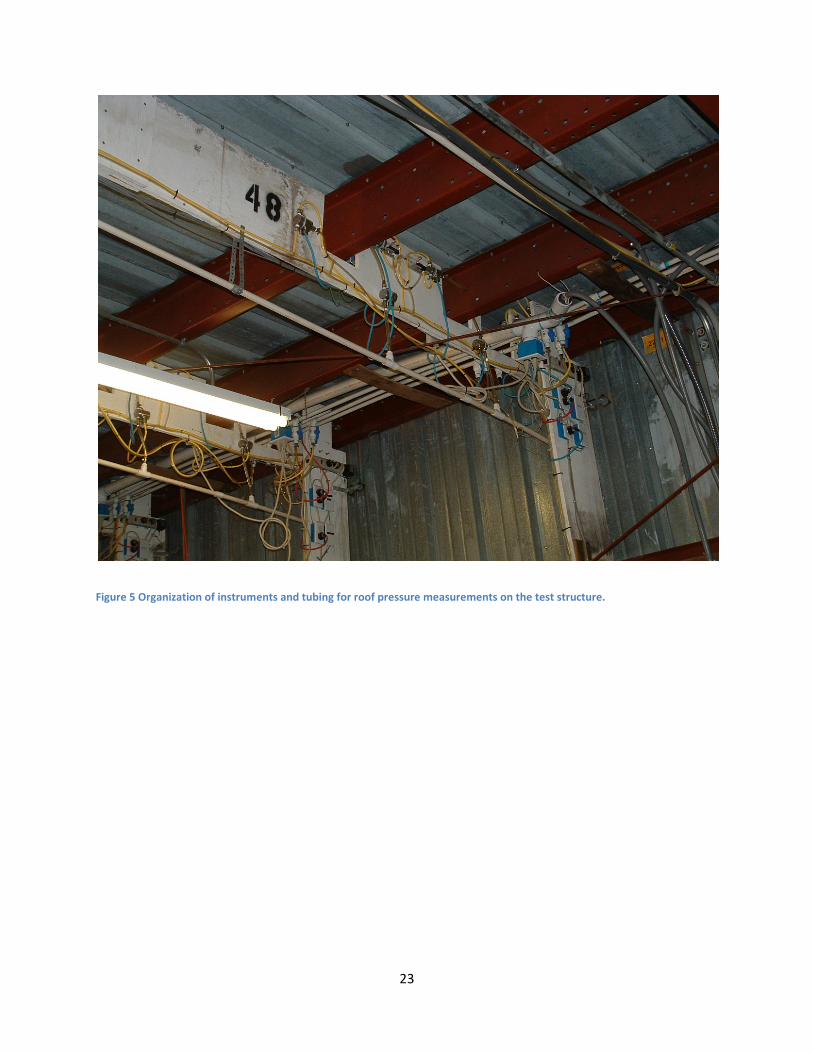
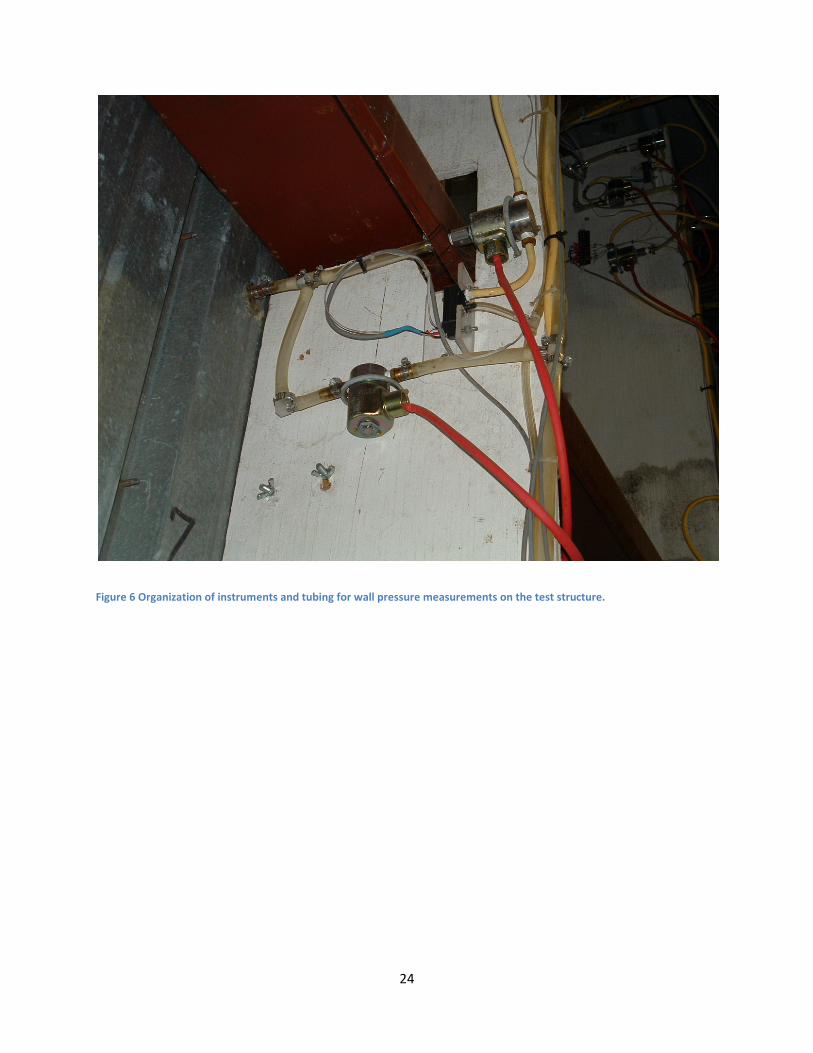
The flat roof configuration for the test structure is shown in Figure 4. Construction details for the building and the supporting rotation system are given in supporting document. Omega differential pressure transducers were used to collect the differential pressure data on the surface of the building as well as internal pressures. Table 1 provides additional information on the Omega pressure transducers. Pictures of the instrument organization for roof pressure measurements and wall pressure measurements are given in Figure 5 and Figure 6, respectively.
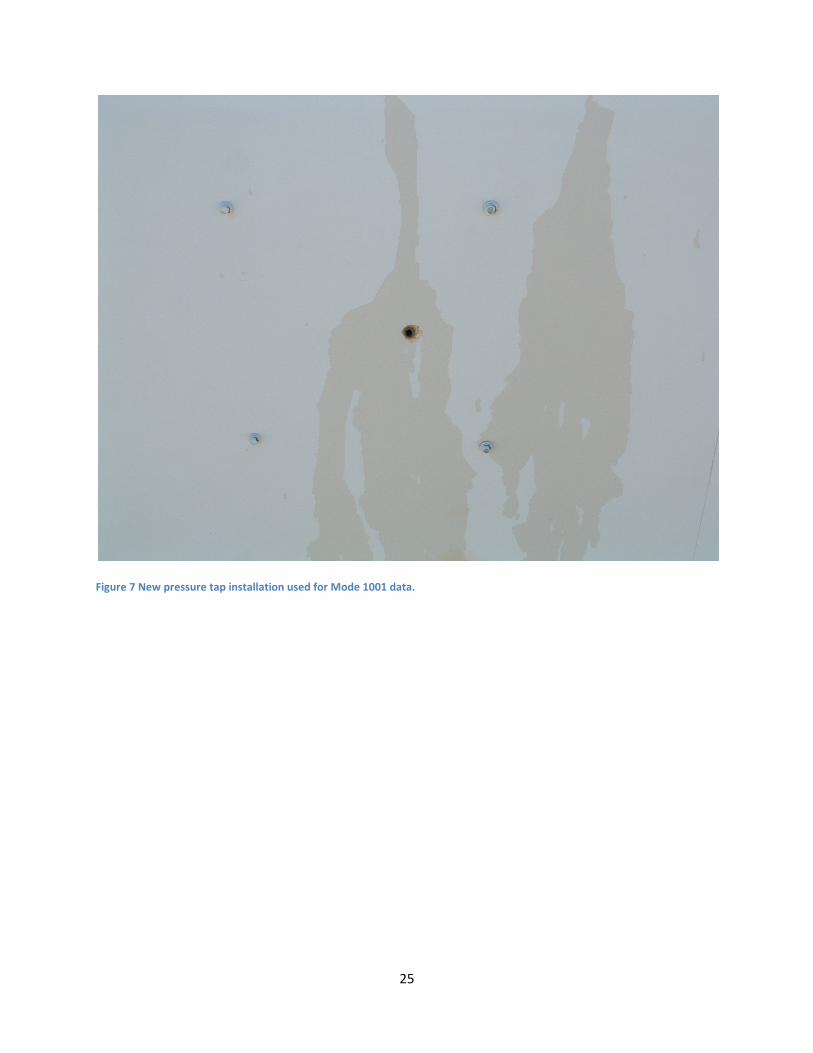
Construction of the pressure taps has been significantly changed since the procedure reported by [8]. Instead of dimpling the flat stock skin, installing the tap and then using body putty to make the surface smooth again, copper tubing is flared at one end and inserted into a predrilled hole. The tap is held in place by a rubber sleeve that is set flush with the back face of the wall and held in place by a hose clamp. On the exterior surface, the tap projects out from the flat stock sheet approximately 1/32”. The new tap configuration is shown in Figure 7.
The effects of the projection beyond the flat stock sheet were established by installing the new tap geometry adjacent to an old tap and data collected for multiple angles of attack. The data from the two taps showed no statistically significant difference using the Kolmogorov-Smirnov (KS) test at the 99% level of significance. Time to install a tap dropped from several hours to about 5 minutes. This made installation of the large number of taps for measurement of overall loads tractable.
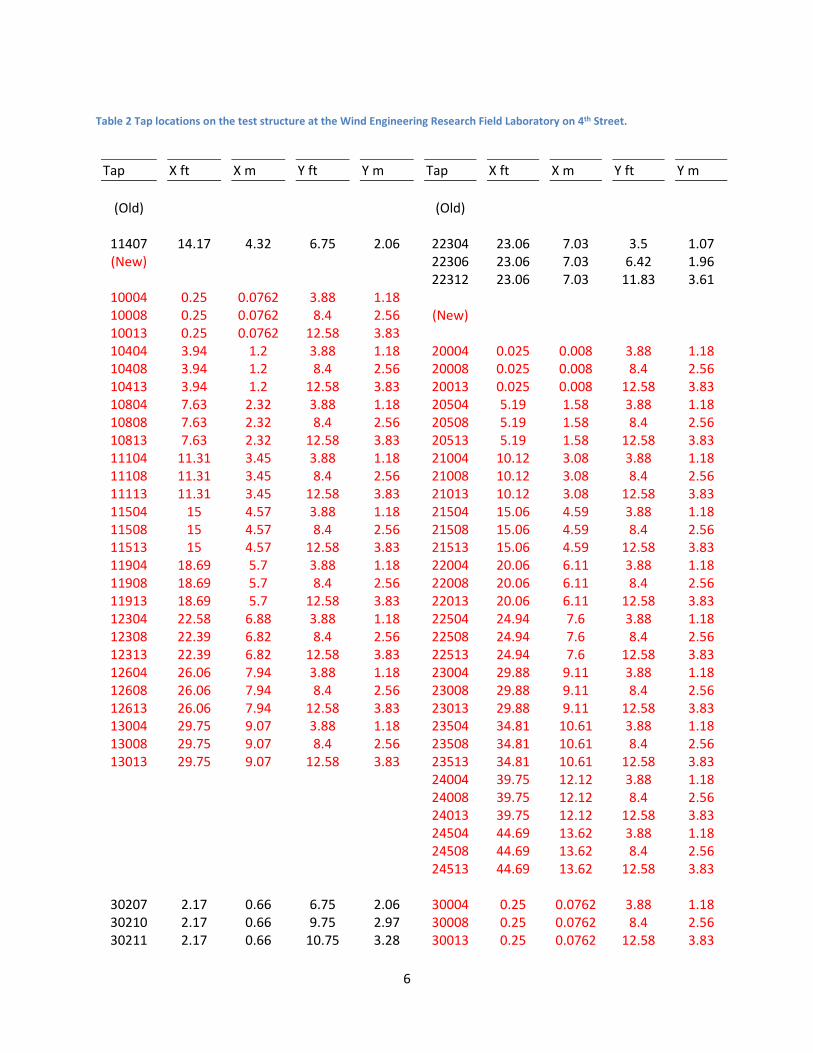
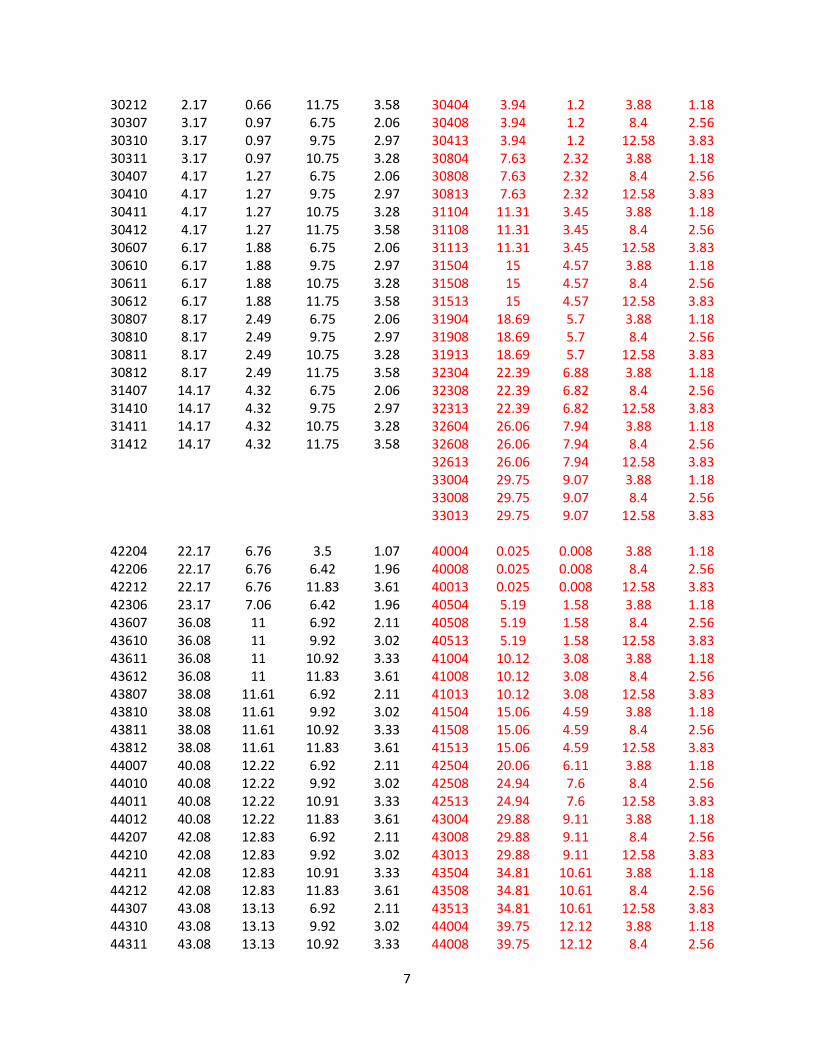
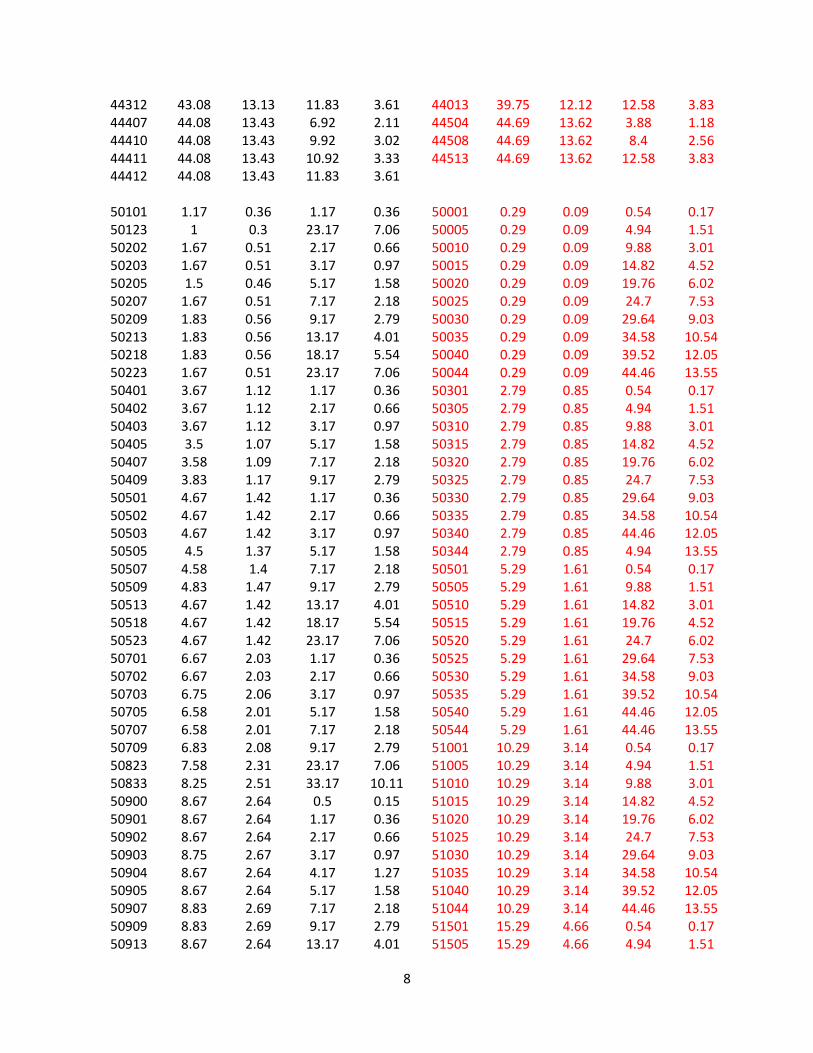
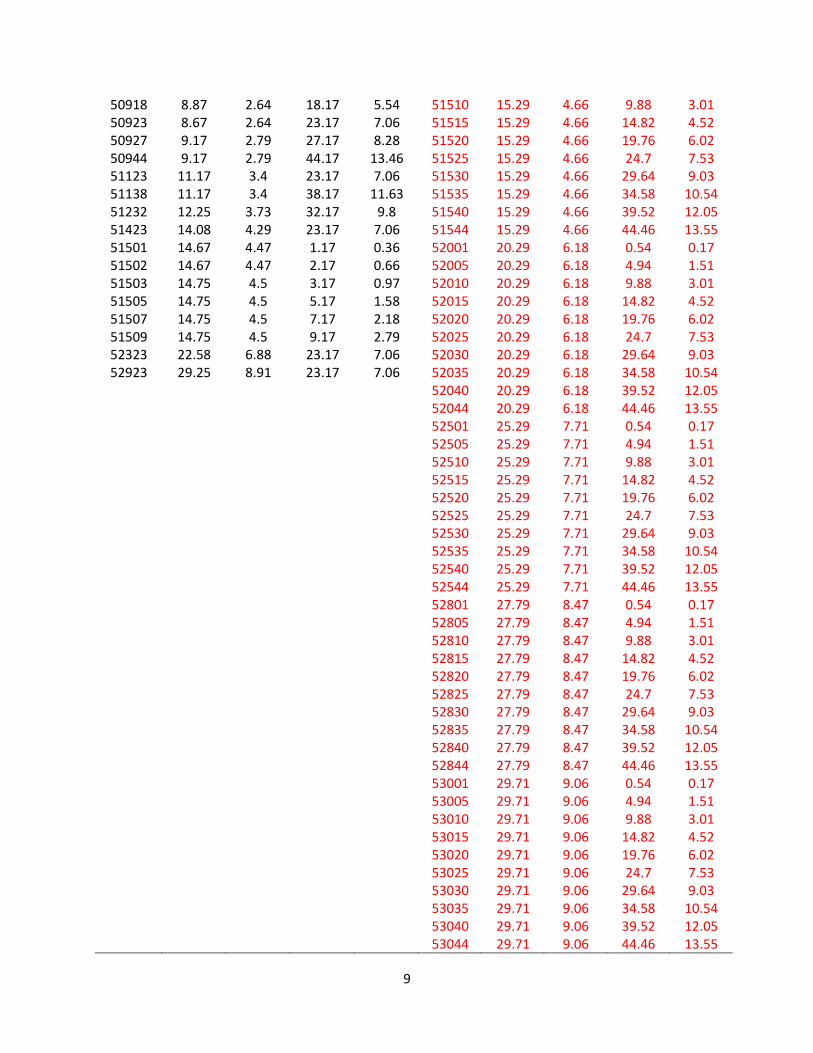
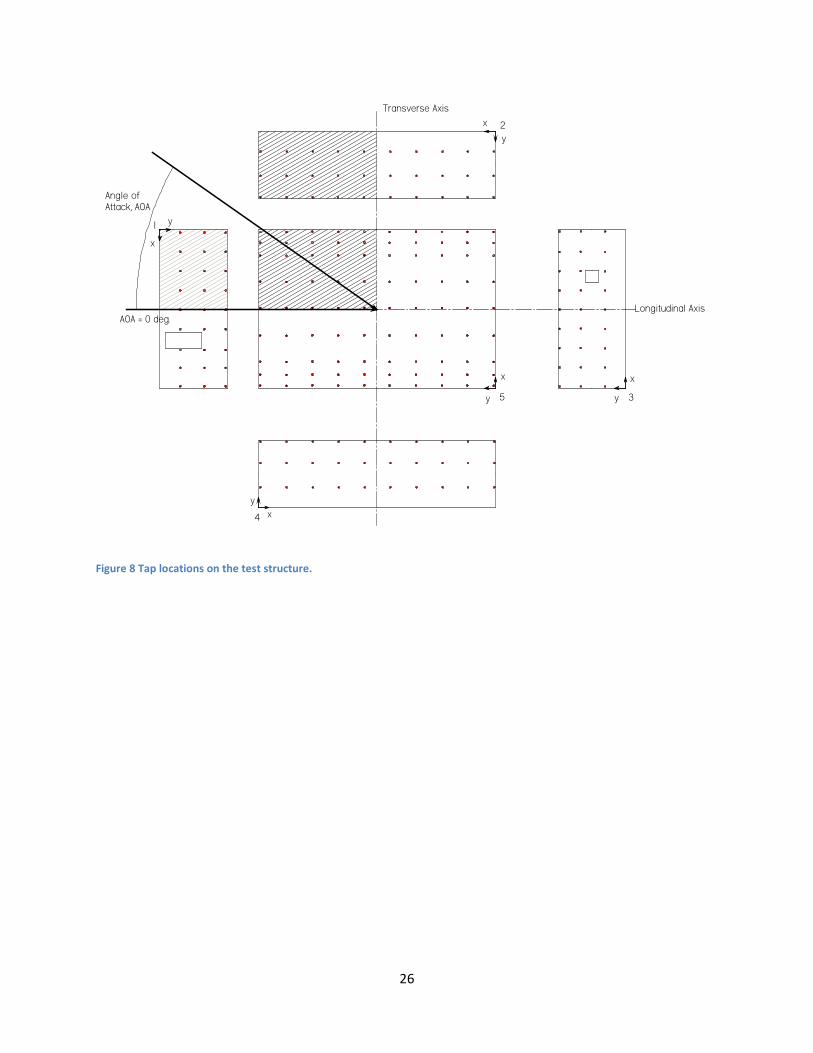
Pressure tap locations on the surface of the building are designated using a 5 digit code, sxxyy, where s is the surface number, xx is the nominal dimension in feet from the origin defined for the surface in the x direction and yy is the nominal dimension in feet from the origin defined for the surface in the y direction. Figure 8 provides an exploded view of the WERFL building showing the origin for each building surface and Table 2 provides the nominal tap designations and actual dimensions to each tap for historic as well as for Mode 1001. Angle of attack of wind on the test structure is also defined in Figure 8. Tap designations and angle of attack definitions are the same as originally defined in [8].
3. Data
3.1. Typical Data Characteristics
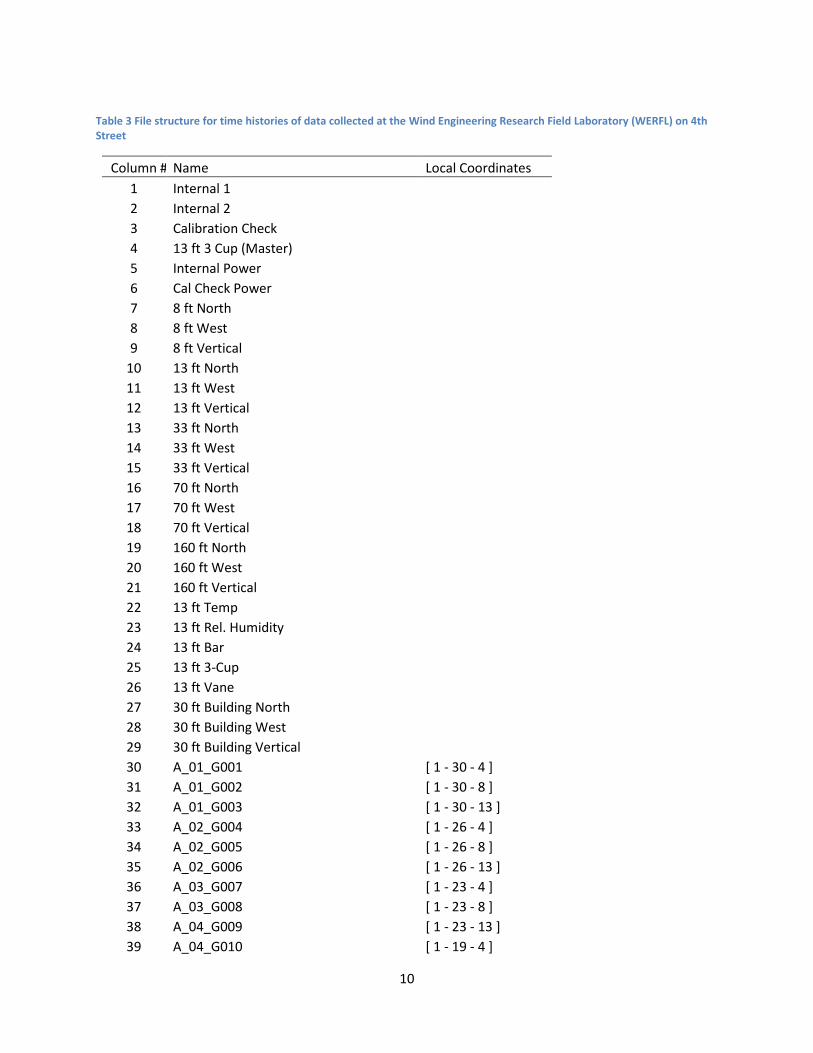
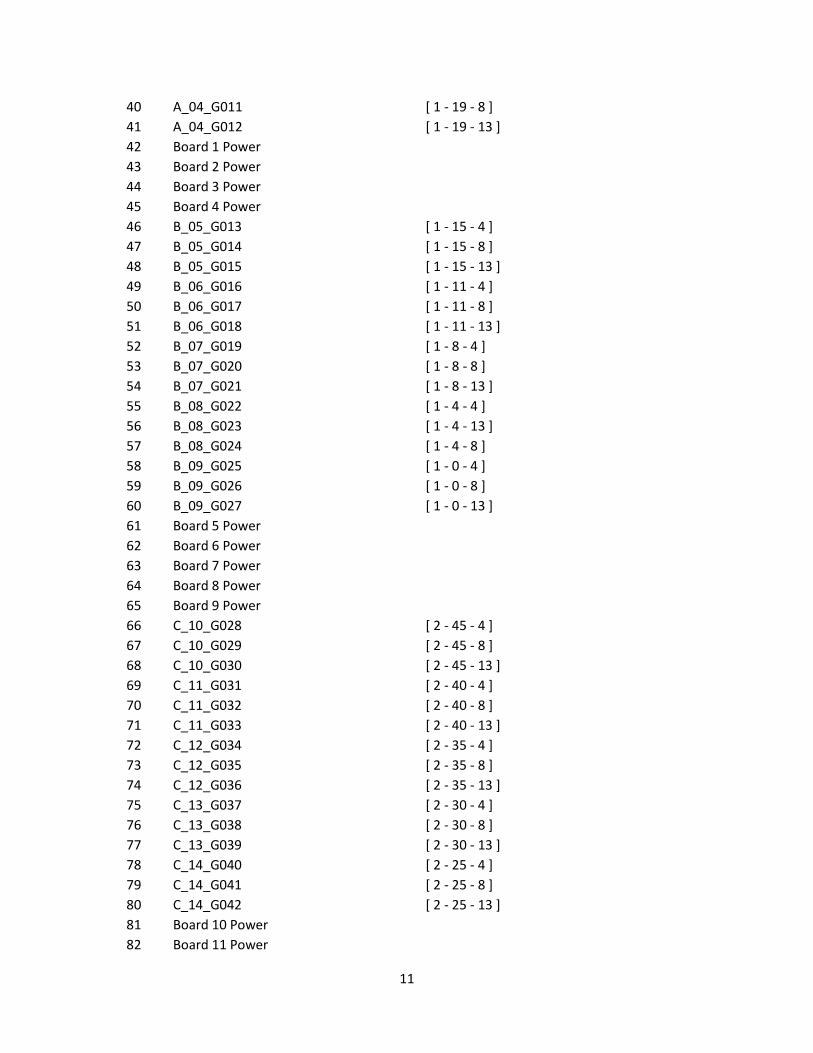
The sampling rate for all the data, meteorological and pressure, provided is 30 Hz. Each record is 15 minutes in duration, thus each channel has 27000 samples in the record. The records are stored in comma separated value (CSV) format without column headers. The file structure (column headers) for each record is given in Table 3. Each 15-minute duration record in CSV format is approximately 82 MB in size. In Table 3 the local coordinate column refers to the tap designation, sxxyy. As an example, data column 30 has the local coordinate is [ 1 - 30 - 4 ] which corresponds with
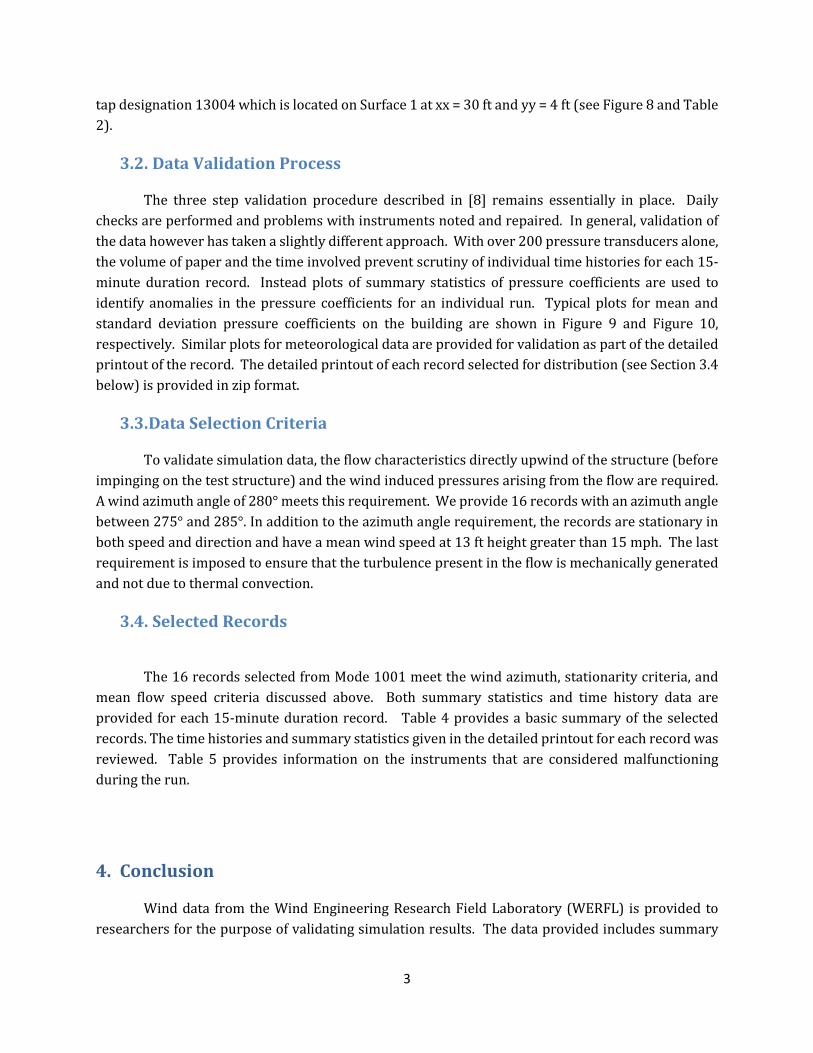
3
tap designation 13004 which is located on Surface 1 at xx = 30 ft and yy = 4 ft (see Figure 8 and Table 2).
3.2. Data Validation Process
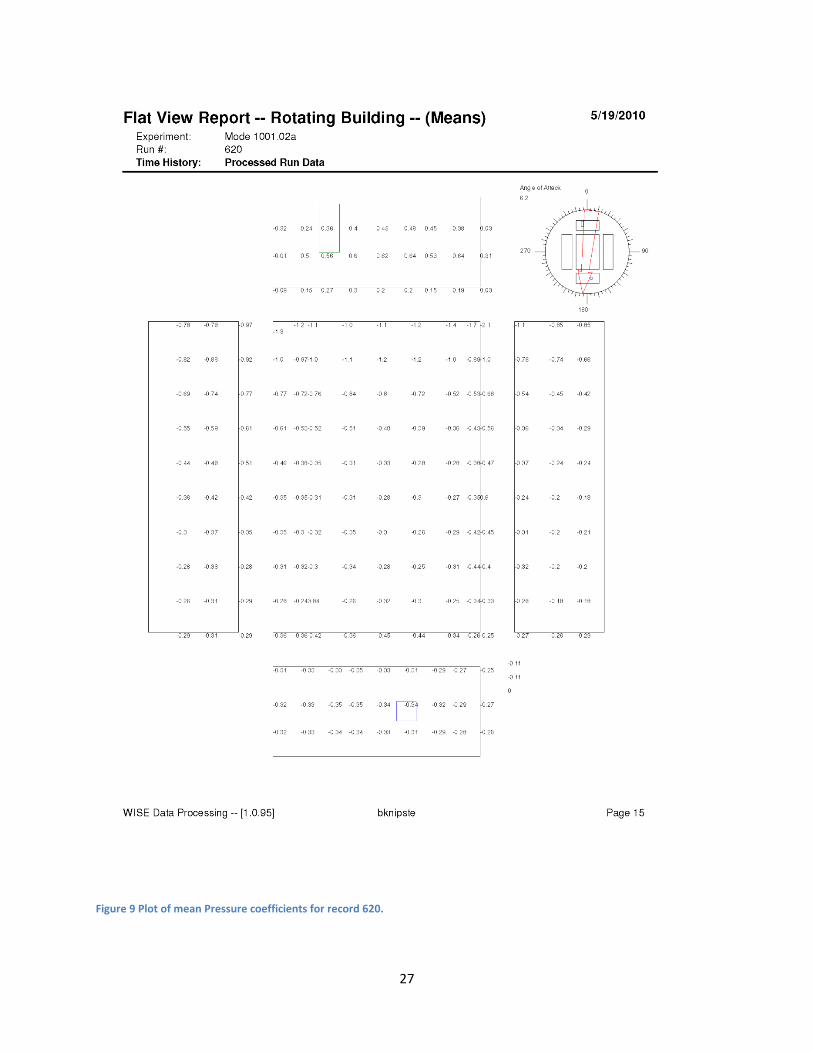
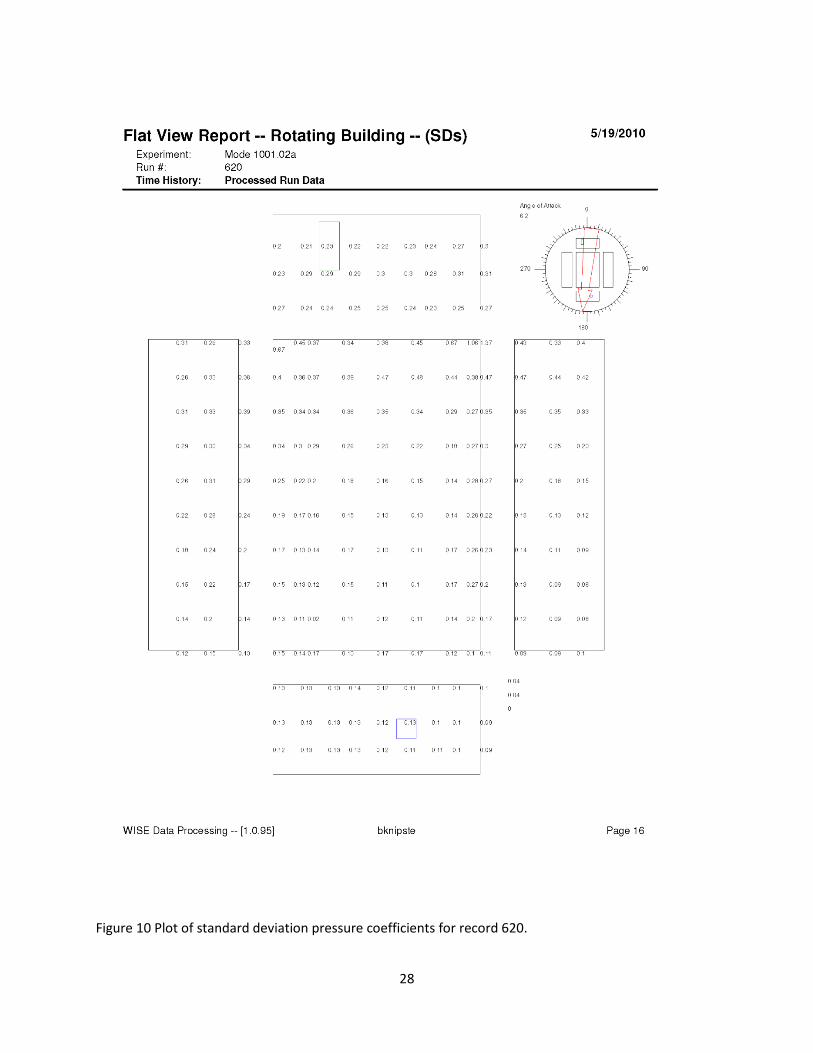
The three step validation procedure described in [8] remains essentially in place. Daily checks are performed and problems with instruments noted and repaired. In general, validation of the data however has taken a slightly different approach. With over 200 pressure transducers alone, the volume of paper and the time involved prevent scrutiny of individual time histories for each 15-minute duration record. Instead plots of summary statistics of pressure coefficients are used to identify anomalies in the pressure coefficients for an individual run. Typical plots for mean and standard deviation pressure coefficients on the building are shown in Figure 9 and Figure 10, respectively. Similar plots for meteorological data are provided for validation as part of the detailed printout of the record. The detailed printout of each record selected for distribution (see Section 3.4 below) is provided in zip format.
3.3. Data Selection Criteria
To validate simulation data, the flow characteristics directly upwind of the structure (before impinging on the test structure) and the wind induced pressures arising from the flow are required. A wind azimuth angle of 280° meets this requirement. We provide 16 records with an azimuth angle between 275° and 285°. In addition to the azimuth angle requirement, the records are stationary in both speed and direction and have a mean wind speed at 13 ft height greater than 15 mph. The last requirement is imposed to ensure that the turbulence present in the flow is mechanically generated and not due to thermal convection.
3.4. Selected Records
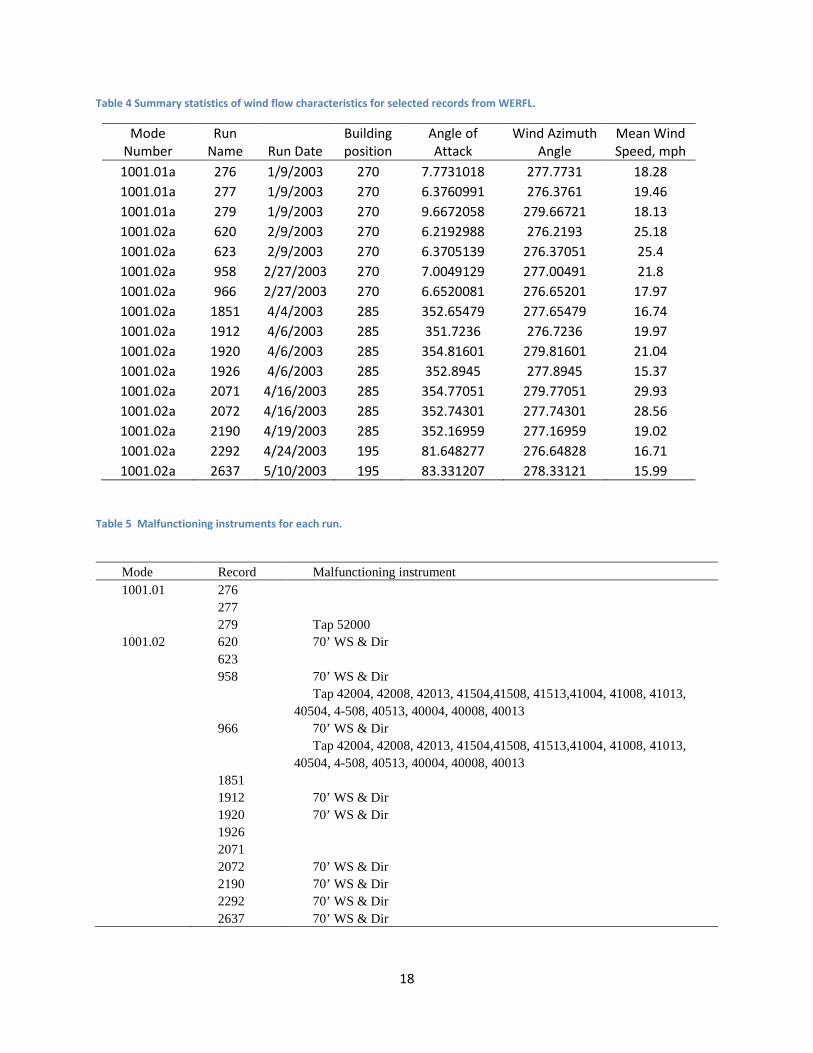
The 16 records selected from Mode 1001 meet the wind azimuth, stationarity criteria, and mean flow speed criteria discussed above. Both summary statistics and time history data are provided for each 15-minute duration record. Table 4 provides a basic summary of the selected records. The time histories and summary statistics given in the detailed printout for each record was reviewed. Table 5 provides information on the instruments that are considered malfunctioning during the run.
4. Conclusion
Wind data from the Wind Engineering Research Field Laboratory (WERFL) is provided to researchers for the purpose of validating simulation results. The data provided includes summary

4
statistics as well as time histories. Details on the locations of the pressure measurements and the construction details for the test structure are also provided.
5. References 1. Bienkiewicz, B. and H.J. Ham, Wind tunnel modeling of roof pressure and turbulence effects on
the TTU test building. Wind and Structures, An International Journal, 2003. 6(2): p. 91. 2. Okada, H. and Y.-C. Ha, Comparison of wind tunnel and full-scale pressure measurement tests on
the Texas Tech Building. Journal of Wind Engineering and Industrial Aerodynamics, 1992. 43(pt 3): p. 1601.
3. Tieleman, H.W., et al., Pressures on a surface-mounted rectangular prism under varying incident turbulence. Journal of Wind Engineering and Industrial Aerodynamics, 2003. 91(9): p. 1095.
4. Xu, Y.L., Model- and full-scale comparison of fatigue-related characteristics of wind pressures on the Texas tech building. Journal of Wind Engineering and Industrial Aerodynamics, 1995. 58(3): p. 147.
5. Bekele, S.A. and H. Hangan, A comparative investigation of the TTU pressure envelope. Numerical versus laboratory and full scale results. Wind and Structures, An International Journal, 2002. 5(2-4): p. 337.
6. Chang C.-H, M.R.N., Numerical and physical modeling of bluff body flow and dispersion in urban street canyons. Journal of Wind Engineering and Industrial Aerodynamics, 2001. 89(14-15): p. 1325.
7. Qasim, A., T.T. Maxwell, and S. Parameawaran, Computational predictions of flow over a 2-D building. Journal of Wind Engineering and Industrial Aerodynamics, 1992. 44(pt 4): p. 2839.
8. Levitan, M.L. and K.C. Mehta, Texas Tech field experiments for wind loads part I: building and pressure measuring system. 1992. 43(1-3): p. 1565.
9. Levitan, M.L. and K.C. Mehta, Texas Tech field experiments for wind loads part II: meteorological instrumentation and terrain parameters. 1992. 43(1-3): p. 1577.
10. Young, R.M. UVW Anemometer Model 27005. 2006 [cited 2006 4/6/2006]; Available from: www.inteltronics.co.za/ products/windsensors/pdf/27005.PDF
11. Young, R.M. Gill MicroVane and 3-cup Anenomenter Model 12002/12005. 2006 4/11/2006]; Available from: http://www.youngusa.com/.
12. Gill. Omnidirectional and Asymmetric Research Ultrasonic Anemometer, Doc No. 1210-PS-0002. 2006 [cited 2006; Available from: www.gill.co.uk.
13. Young, R.M. Barometric Pressure Sensor Model 61201. 2006 [cited 2006 4/11/2006]; Available from: www.jsinstruments.com/files/ Model%2061201%20Barometric%20Pressure%20Sensor.pdf
14. Young, R. Relative Humidity/Temperature Probe Model 41372VC/VF. 2006 [cited 2006 4/11/06]. 15. Omega. Low Pressure Transducer Model PX163-005BD5V. 2006 [cited 2006 4/11/2006];
Available from: http://www.omega.com/ppt/pptsc.asp?ref=PX160
5
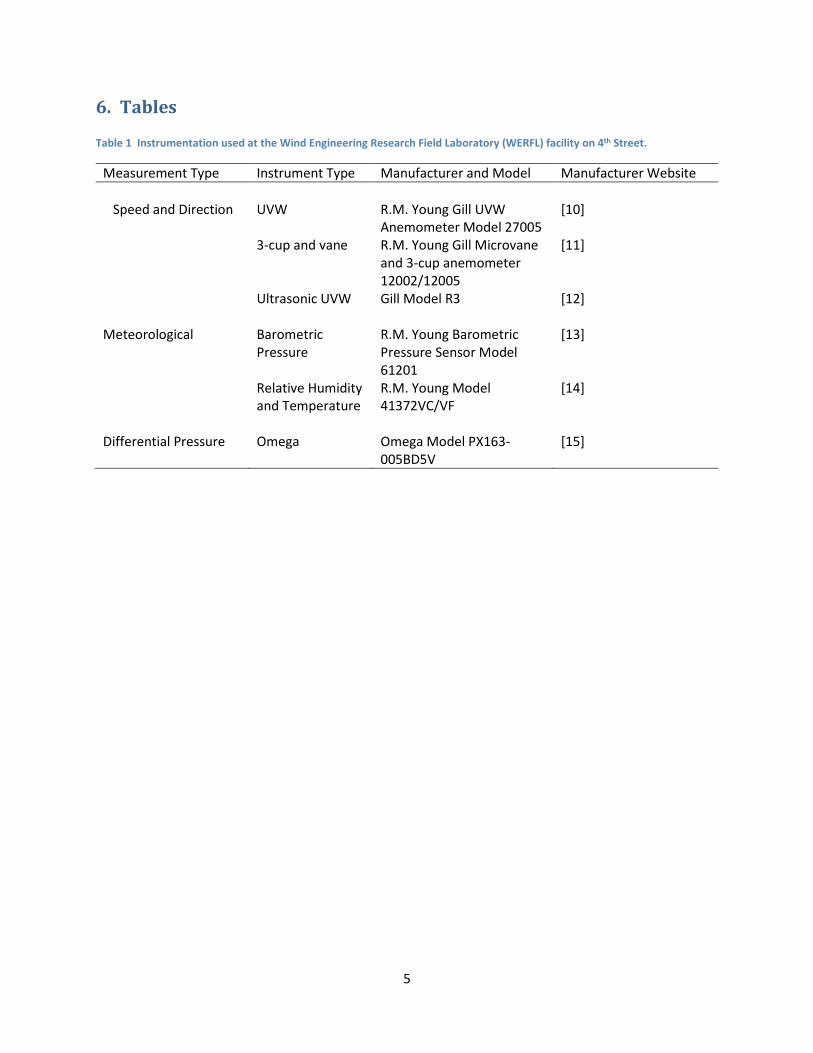
6. Tables Table 1 Instrumentation used at the Wind Engineering Research Field Laboratory (WERFL) facility on 4th Street.
Measurement Type Instrument Type Manufacturer and Model Manufacturer Website Speed and Direction UVW R.M. Young Gill UVW
Anemometer Model 27005 [10]
3-cup and vane R.M. Young Gill Microvane and 3-cup anemometer 12002/12005
[11]
Ultrasonic UVW Gill Model R3 [12] Meteorological Barometric
Pressure R.M. Young Barometric Pressure Sensor Model 61201
[13]
Relative Humidity and Temperature
R.M. Young Model 41372VC/VF
[14]
Differential Pressure Omega Omega Model PX163-
005BD5V [15]
6
Table 2 Tap locations on the test structure at the Wind Engineering Research Field Laboratory on 4th Street.
Tap X ft X m Y ft Y m Tap X ft X m Y ft Y m
(Old) (Old)
11407 14.17 4.32 6.75 2.06 22304 23.06 7.03 3.5 1.07 (New) 22306 23.06 7.03 6.42 1.96
22312 23.06 7.03 11.83 3.61 10004 0.25 0.0762 3.88 1.18 10008 0.25 0.0762 8.4 2.56 (New) 10013 0.25 0.0762 12.58 3.83 10404 3.94 1.2 3.88 1.18 20004 0.025 0.008 3.88 1.18 10408 3.94 1.2 8.4 2.56 20008 0.025 0.008 8.4 2.56 10413 3.94 1.2 12.58 3.83 20013 0.025 0.008 12.58 3.83 10804 7.63 2.32 3.88 1.18 20504 5.19 1.58 3.88 1.18 10808 7.63 2.32 8.4 2.56 20508 5.19 1.58 8.4 2.56 10813 7.63 2.32 12.58 3.83 20513 5.19 1.58 12.58 3.83 11104 11.31 3.45 3.88 1.18 21004 10.12 3.08 3.88 1.18 11108 11.31 3.45 8.4 2.56 21008 10.12 3.08 8.4 2.56 11113 11.31 3.45 12.58 3.83 21013 10.12 3.08 12.58 3.83 11504 15 4.57 3.88 1.18 21504 15.06 4.59 3.88 1.18 11508 15 4.57 8.4 2.56 21508 15.06 4.59 8.4 2.56 11513 15 4.57 12.58 3.83 21513 15.06 4.59 12.58 3.83 11904 18.69 5.7 3.88 1.18 22004 20.06 6.11 3.88 1.18 11908 18.69 5.7 8.4 2.56 22008 20.06 6.11 8.4 2.56 11913 18.69 5.7 12.58 3.83 22013 20.06 6.11 12.58 3.83 12304 22.58 6.88 3.88 1.18 22504 24.94 7.6 3.88 1.18 12308 22.39 6.82 8.4 2.56 22508 24.94 7.6 8.4 2.56 12313 22.39 6.82 12.58 3.83 22513 24.94 7.6 12.58 3.83 12604 26.06 7.94 3.88 1.18 23004 29.88 9.11 3.88 1.18 12608 26.06 7.94 8.4 2.56 23008 29.88 9.11 8.4 2.56 12613 26.06 7.94 12.58 3.83 23013 29.88 9.11 12.58 3.83 13004 29.75 9.07 3.88 1.18 23504 34.81 10.61 3.88 1.18 13008 29.75 9.07 8.4 2.56 23508 34.81 10.61 8.4 2.56 13013 29.75 9.07 12.58 3.83 23513 34.81 10.61 12.58 3.83
24004 39.75 12.12 3.88 1.18 24008 39.75 12.12 8.4 2.56 24013 39.75 12.12 12.58 3.83 24504 44.69 13.62 3.88 1.18 24508 44.69 13.62 8.4 2.56 24513 44.69 13.62 12.58 3.83
30207 2.17 0.66 6.75 2.06 30004 0.25 0.0762 3.88 1.18 30210 2.17 0.66 9.75 2.97 30008 0.25 0.0762 8.4 2.56 30211 2.17 0.66 10.75 3.28 30013 0.25 0.0762 12.58 3.83
7
30212 2.17 0.66 11.75 3.58 30404 3.94 1.2 3.88 1.18 30307 3.17 0.97 6.75 2.06 30408 3.94 1.2 8.4 2.56 30310 3.17 0.97 9.75 2.97 30413 3.94 1.2 12.58 3.83 30311 3.17 0.97 10.75 3.28 30804 7.63 2.32 3.88 1.18 30407 4.17 1.27 6.75 2.06 30808 7.63 2.32 8.4 2.56 30410 4.17 1.27 9.75 2.97 30813 7.63 2.32 12.58 3.83 30411 4.17 1.27 10.75 3.28 31104 11.31 3.45 3.88 1.18 30412 4.17 1.27 11.75 3.58 31108 11.31 3.45 8.4 2.56 30607 6.17 1.88 6.75 2.06 31113 11.31 3.45 12.58 3.83 30610 6.17 1.88 9.75 2.97 31504 15 4.57 3.88 1.18 30611 6.17 1.88 10.75 3.28 31508 15 4.57 8.4 2.56 30612 6.17 1.88 11.75 3.58 31513 15 4.57 12.58 3.83 30807 8.17 2.49 6.75 2.06 31904 18.69 5.7 3.88 1.18 30810 8.17 2.49 9.75 2.97 31908 18.69 5.7 8.4 2.56 30811 8.17 2.49 10.75 3.28 31913 18.69 5.7 12.58 3.83 30812 8.17 2.49 11.75 3.58 32304 22.39 6.88 3.88 1.18 31407 14.17 4.32 6.75 2.06 32308 22.39 6.82 8.4 2.56 31410 14.17 4.32 9.75 2.97 32313 22.39 6.82 12.58 3.83 31411 14.17 4.32 10.75 3.28 32604 26.06 7.94 3.88 1.18 31412 14.17 4.32 11.75 3.58 32608 26.06 7.94 8.4 2.56
32613 26.06 7.94 12.58 3.83 33004 29.75 9.07 3.88 1.18 33008 29.75 9.07 8.4 2.56 33013 29.75 9.07 12.58 3.83
42204 22.17 6.76 3.5 1.07 40004 0.025 0.008 3.88 1.18 42206 22.17 6.76 6.42 1.96 40008 0.025 0.008 8.4 2.56 42212 22.17 6.76 11.83 3.61 40013 0.025 0.008 12.58 3.83 42306 23.17 7.06 6.42 1.96 40504 5.19 1.58 3.88 1.18 43607 36.08 11 6.92 2.11 40508 5.19 1.58 8.4 2.56 43610 36.08 11 9.92 3.02 40513 5.19 1.58 12.58 3.83 43611 36.08 11 10.92 3.33 41004 10.12 3.08 3.88 1.18 43612 36.08 11 11.83 3.61 41008 10.12 3.08 8.4 2.56 43807 38.08 11.61 6.92 2.11 41013 10.12 3.08 12.58 3.83 43810 38.08 11.61 9.92 3.02 41504 15.06 4.59 3.88 1.18 43811 38.08 11.61 10.92 3.33 41508 15.06 4.59 8.4 2.56 43812 38.08 11.61 11.83 3.61 41513 15.06 4.59 12.58 3.83 44007 40.08 12.22 6.92 2.11 42504 20.06 6.11 3.88 1.18 44010 40.08 12.22 9.92 3.02 42508 24.94 7.6 8.4 2.56 44011 40.08 12.22 10.91 3.33 42513 24.94 7.6 12.58 3.83 44012 40.08 12.22 11.83 3.61 43004 29.88 9.11 3.88 1.18 44207 42.08 12.83 6.92 2.11 43008 29.88 9.11 8.4 2.56 44210 42.08 12.83 9.92 3.02 43013 29.88 9.11 12.58 3.83 44211 42.08 12.83 10.91 3.33 43504 34.81 10.61 3.88 1.18 44212 42.08 12.83 11.83 3.61 43508 34.81 10.61 8.4 2.56 44307 43.08 13.13 6.92 2.11 43513 34.81 10.61 12.58 3.83 44310 43.08 13.13 9.92 3.02 44004 39.75 12.12 3.88 1.18 44311 43.08 13.13 10.92 3.33 44008 39.75 12.12 8.4 2.56
8
44312 43.08 13.13 11.83 3.61 44013 39.75 12.12 12.58 3.83 44407 44.08 13.43 6.92 2.11 44504 44.69 13.62 3.88 1.18 44410 44.08 13.43 9.92 3.02 44508 44.69 13.62 8.4 2.56 44411 44.08 13.43 10.92 3.33 44513 44.69 13.62 12.58 3.83 44412 44.08 13.43 11.83 3.61
50101 1.17 0.36 1.17 0.36 50001 0.29 0.09 0.54 0.17 50123 1 0.3 23.17 7.06 50005 0.29 0.09 4.94 1.51 50202 1.67 0.51 2.17 0.66 50010 0.29 0.09 9.88 3.01 50203 1.67 0.51 3.17 0.97 50015 0.29 0.09 14.82 4.52 50205 1.5 0.46 5.17 1.58 50020 0.29 0.09 19.76 6.02 50207 1.67 0.51 7.17 2.18 50025 0.29 0.09 24.7 7.53 50209 1.83 0.56 9.17 2.79 50030 0.29 0.09 29.64 9.03 50213 1.83 0.56 13.17 4.01 50035 0.29 0.09 34.58 10.54 50218 1.83 0.56 18.17 5.54 50040 0.29 0.09 39.52 12.05 50223 1.67 0.51 23.17 7.06 50044 0.29 0.09 44.46 13.55 50401 3.67 1.12 1.17 0.36 50301 2.79 0.85 0.54 0.17 50402 3.67 1.12 2.17 0.66 50305 2.79 0.85 4.94 1.51 50403 3.67 1.12 3.17 0.97 50310 2.79 0.85 9.88 3.01 50405 3.5 1.07 5.17 1.58 50315 2.79 0.85 14.82 4.52 50407 3.58 1.09 7.17 2.18 50320 2.79 0.85 19.76 6.02 50409 3.83 1.17 9.17 2.79 50325 2.79 0.85 24.7 7.53 50501 4.67 1.42 1.17 0.36 50330 2.79 0.85 29.64 9.03 50502 4.67 1.42 2.17 0.66 50335 2.79 0.85 34.58 10.54 50503 4.67 1.42 3.17 0.97 50340 2.79 0.85 44.46 12.05 50505 4.5 1.37 5.17 1.58 50344 2.79 0.85 4.94 13.55 50507 4.58 1.4 7.17 2.18 50501 5.29 1.61 0.54 0.17 50509 4.83 1.47 9.17 2.79 50505 5.29 1.61 9.88 1.51 50513 4.67 1.42 13.17 4.01 50510 5.29 1.61 14.82 3.01 50518 4.67 1.42 18.17 5.54 50515 5.29 1.61 19.76 4.52 50523 4.67 1.42 23.17 7.06 50520 5.29 1.61 24.7 6.02 50701 6.67 2.03 1.17 0.36 50525 5.29 1.61 29.64 7.53 50702 6.67 2.03 2.17 0.66 50530 5.29 1.61 34.58 9.03 50703 6.75 2.06 3.17 0.97 50535 5.29 1.61 39.52 10.54 50705 6.58 2.01 5.17 1.58 50540 5.29 1.61 44.46 12.05 50707 6.58 2.01 7.17 2.18 50544 5.29 1.61 44.46 13.55 50709 6.83 2.08 9.17 2.79 51001 10.29 3.14 0.54 0.17 50823 7.58 2.31 23.17 7.06 51005 10.29 3.14 4.94 1.51 50833 8.25 2.51 33.17 10.11 51010 10.29 3.14 9.88 3.01 50900 8.67 2.64 0.5 0.15 51015 10.29 3.14 14.82 4.52 50901 8.67 2.64 1.17 0.36 51020 10.29 3.14 19.76 6.02 50902 8.67 2.64 2.17 0.66 51025 10.29 3.14 24.7 7.53 50903 8.75 2.67 3.17 0.97 51030 10.29 3.14 29.64 9.03 50904 8.67 2.64 4.17 1.27 51035 10.29 3.14 34.58 10.54 50905 8.67 2.64 5.17 1.58 51040 10.29 3.14 39.52 12.05 50907 8.83 2.69 7.17 2.18 51044 10.29 3.14 44.46 13.55 50909 8.83 2.69 9.17 2.79 51501 15.29 4.66 0.54 0.17 50913 8.67 2.64 13.17 4.01 51505 15.29 4.66 4.94 1.51
9
50918 8.87 2.64 18.17 5.54 51510 15.29 4.66 9.88 3.01 50923 8.67 2.64 23.17 7.06 51515 15.29 4.66 14.82 4.52 50927 9.17 2.79 27.17 8.28 51520 15.29 4.66 19.76 6.02 50944 9.17 2.79 44.17 13.46 51525 15.29 4.66 24.7 7.53 51123 11.17 3.4 23.17 7.06 51530 15.29 4.66 29.64 9.03 51138 11.17 3.4 38.17 11.63 51535 15.29 4.66 34.58 10.54 51232 12.25 3.73 32.17 9.8 51540 15.29 4.66 39.52 12.05 51423 14.08 4.29 23.17 7.06 51544 15.29 4.66 44.46 13.55 51501 14.67 4.47 1.17 0.36 52001 20.29 6.18 0.54 0.17 51502 14.67 4.47 2.17 0.66 52005 20.29 6.18 4.94 1.51 51503 14.75 4.5 3.17 0.97 52010 20.29 6.18 9.88 3.01 51505 14.75 4.5 5.17 1.58 52015 20.29 6.18 14.82 4.52 51507 14.75 4.5 7.17 2.18 52020 20.29 6.18 19.76 6.02 51509 14.75 4.5 9.17 2.79 52025 20.29 6.18 24.7 7.53 52323 22.58 6.88 23.17 7.06 52030 20.29 6.18 29.64 9.03 52923 29.25 8.91 23.17 7.06 52035 20.29 6.18 34.58 10.54
52040 20.29 6.18 39.52 12.05 52044 20.29 6.18 44.46 13.55 52501 25.29 7.71 0.54 0.17
52505 25.29 7.71 4.94 1.51 52510 25.29 7.71 9.88 3.01 52515 25.29 7.71 14.82 4.52 52520 25.29 7.71 19.76 6.02 52525 25.29 7.71 24.7 7.53 52530 25.29 7.71 29.64 9.03 52535 25.29 7.71 34.58 10.54 52540 25.29 7.71 39.52 12.05 52544 25.29 7.71 44.46 13.55 52801 27.79 8.47 0.54 0.17 52805 27.79 8.47 4.94 1.51 52810 27.79 8.47 9.88 3.01 52815 27.79 8.47 14.82 4.52 52820 27.79 8.47 19.76 6.02 52825 27.79 8.47 24.7 7.53 52830 27.79 8.47 29.64 9.03 52835 27.79 8.47 34.58 10.54 52840 27.79 8.47 39.52 12.05 52844 27.79 8.47 44.46 13.55 53001 29.71 9.06 0.54 0.17 53005 29.71 9.06 4.94 1.51 53010 29.71 9.06 9.88 3.01 53015 29.71 9.06 14.82 4.52 53020 29.71 9.06 19.76 6.02 53025 29.71 9.06 24.7 7.53 53030 29.71 9.06 29.64 9.03 53035 29.71 9.06 34.58 10.54 53040 29.71 9.06 39.52 12.05 53044 29.71 9.06 44.46 13.55
10
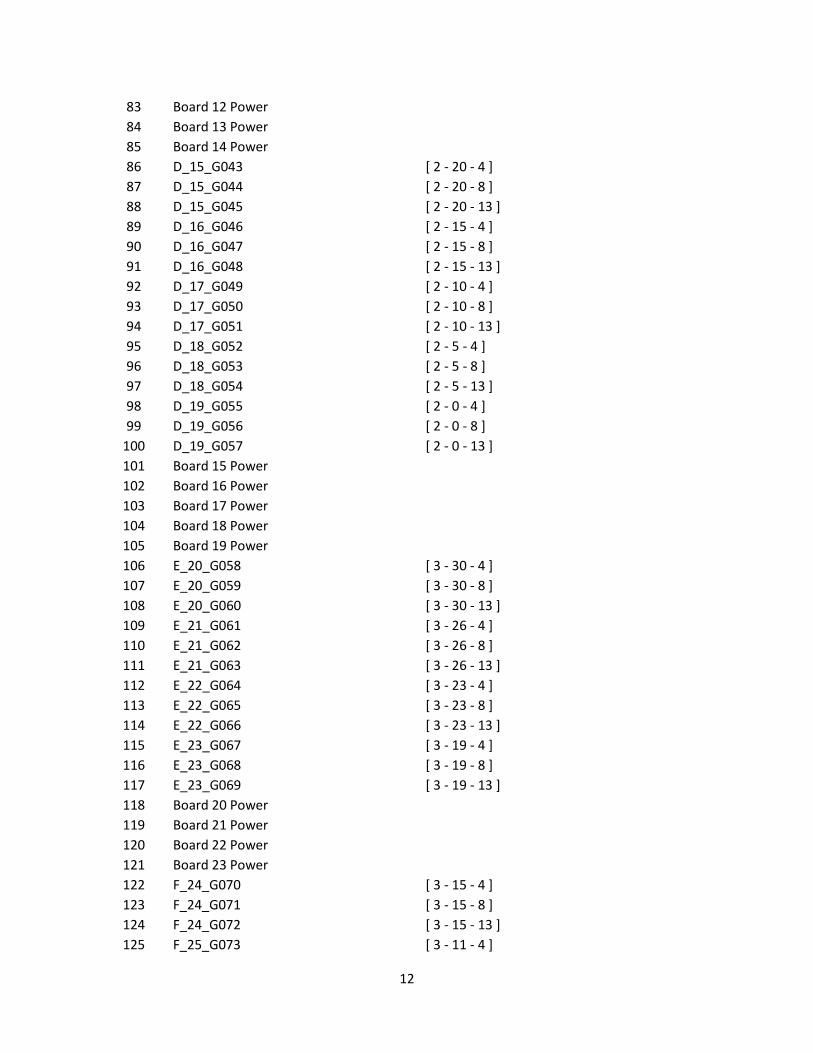
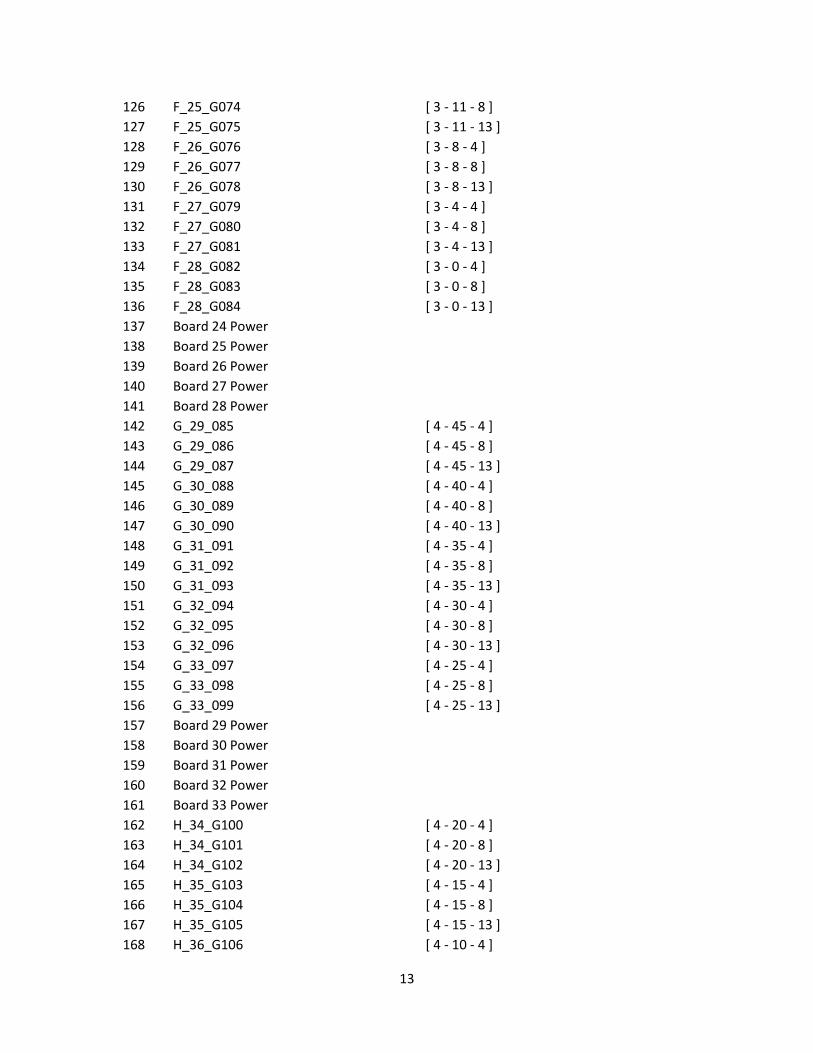
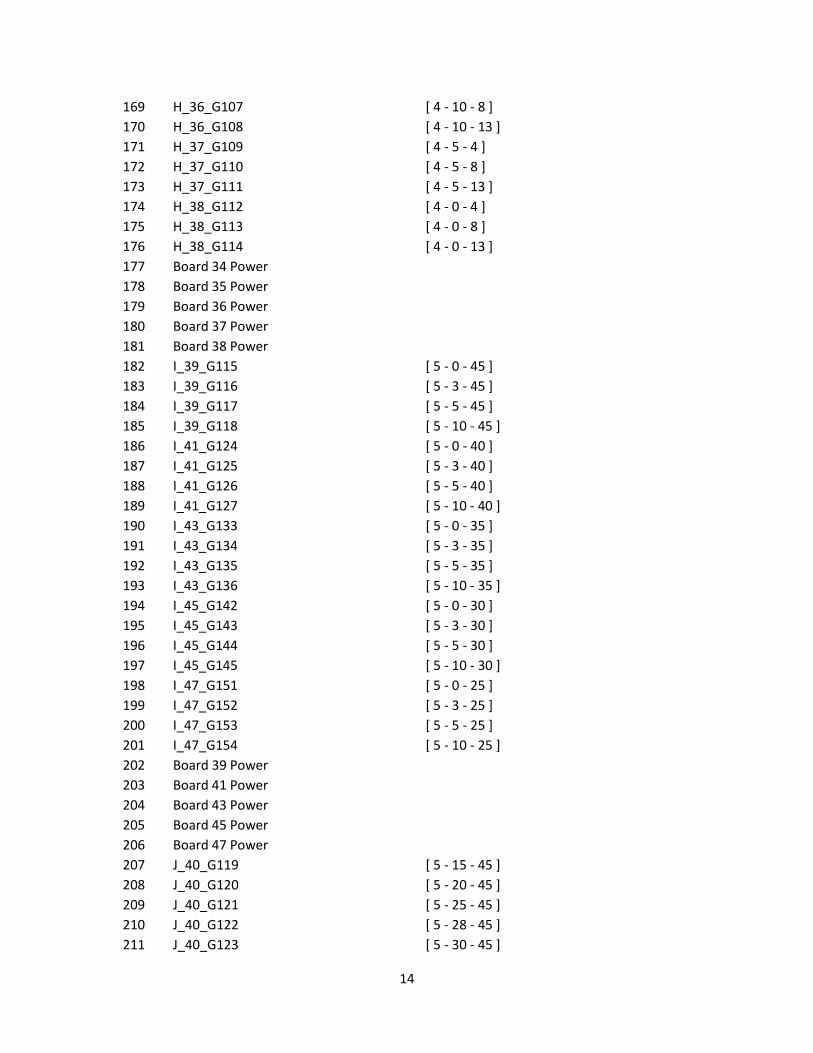
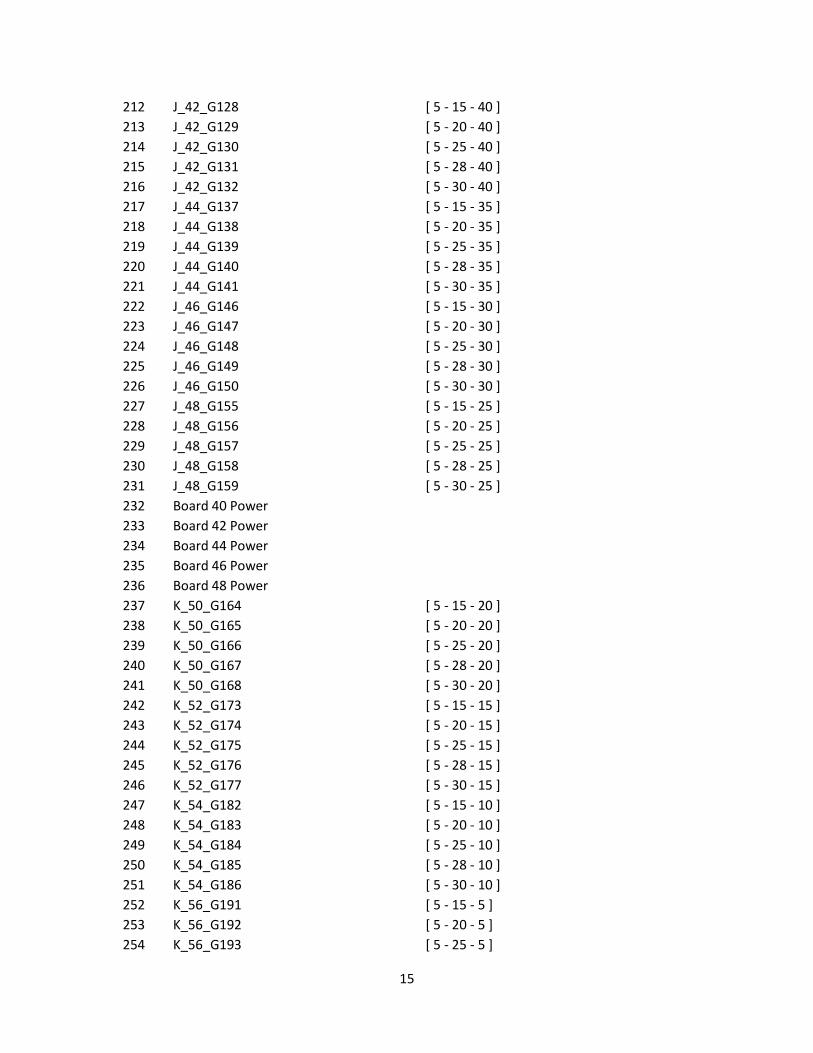
Table 3 File structure for time histories of data collected at the Wind Engineering Research Field Laboratory (WERFL) on 4th Street
Column # Name Local Coordinates 1 Internal 1 2 Internal 2 3 Calibration Check 4 13 ft 3 Cup (Master) 5 Internal Power 6 Cal Check Power 7 8 ft North 8 8 ft West 9 8 ft Vertical
10 13 ft North 11 13 ft West 12 13 ft Vertical 13 33 ft North 14 33 ft West 15 33 ft Vertical 16 70 ft North 17 70 ft West 18 70 ft Vertical 19 160 ft North 20 160 ft West 21 160 ft Vertical 22 13 ft Temp 23 13 ft Rel. Humidity 24 13 ft Bar 25 13 ft 3-Cup 26 13 ft Vane 27 30 ft Building North 28 30 ft Building West 29 30 ft Building Vertical 30 A_01_G001 [ 1 - 30 - 4 ] 31 A_01_G002 [ 1 - 30 - 8 ] 32 A_01_G003 [ 1 - 30 - 13 ] 33 A_02_G004 [ 1 - 26 - 4 ] 34 A_02_G005 [ 1 - 26 - 8 ] 35 A_02_G006 [ 1 - 26 - 13 ] 36 A_03_G007 [ 1 - 23 - 4 ] 37 A_03_G008 [ 1 - 23 - 8 ] 38 A_04_G009 [ 1 - 23 - 13 ] 39 A_04_G010 [ 1 - 19 - 4 ]
11
40 A_04_G011 [ 1 - 19 - 8 ] 41 A_04_G012 [ 1 - 19 - 13 ] 42 Board 1 Power 43 Board 2 Power 44 Board 3 Power 45 Board 4 Power 46 B_05_G013 [ 1 - 15 - 4 ] 47 B_05_G014 [ 1 - 15 - 8 ] 48 B_05_G015 [ 1 - 15 - 13 ] 49 B_06_G016 [ 1 - 11 - 4 ] 50 B_06_G017 [ 1 - 11 - 8 ] 51 B_06_G018 [ 1 - 11 - 13 ] 52 B_07_G019 [ 1 - 8 - 4 ] 53 B_07_G020 [ 1 - 8 - 8 ] 54 B_07_G021 [ 1 - 8 - 13 ] 55 B_08_G022 [ 1 - 4 - 4 ] 56 B_08_G023 [ 1 - 4 - 13 ] 57 B_08_G024 [ 1 - 4 - 8 ] 58 B_09_G025 [ 1 - 0 - 4 ] 59 B_09_G026 [ 1 - 0 - 8 ] 60 B_09_G027 [ 1 - 0 - 13 ] 61 Board 5 Power 62 Board 6 Power 63 Board 7 Power 64 Board 8 Power 65 Board 9 Power 66 C_10_G028 [ 2 - 45 - 4 ] 67 C_10_G029 [ 2 - 45 - 8 ] 68 C_10_G030 [ 2 - 45 - 13 ] 69 C_11_G031 [ 2 - 40 - 4 ] 70 C_11_G032 [ 2 - 40 - 8 ] 71 C_11_G033 [ 2 - 40 - 13 ] 72 C_12_G034 [ 2 - 35 - 4 ] 73 C_12_G035 [ 2 - 35 - 8 ] 74 C_12_G036 [ 2 - 35 - 13 ] 75 C_13_G037 [ 2 - 30 - 4 ] 76 C_13_G038 [ 2 - 30 - 8 ] 77 C_13_G039 [ 2 - 30 - 13 ] 78 C_14_G040 [ 2 - 25 - 4 ] 79 C_14_G041 [ 2 - 25 - 8 ] 80 C_14_G042 [ 2 - 25 - 13 ] 81 Board 10 Power 82 Board 11 Power
12
83 Board 12 Power 84 Board 13 Power 85 Board 14 Power 86 D_15_G043 [ 2 - 20 - 4 ] 87 D_15_G044 [ 2 - 20 - 8 ] 88 D_15_G045 [ 2 - 20 - 13 ] 89 D_16_G046 [ 2 - 15 - 4 ] 90 D_16_G047 [ 2 - 15 - 8 ] 91 D_16_G048 [ 2 - 15 - 13 ] 92 D_17_G049 [ 2 - 10 - 4 ] 93 D_17_G050 [ 2 - 10 - 8 ] 94 D_17_G051 [ 2 - 10 - 13 ] 95 D_18_G052 [ 2 - 5 - 4 ] 96 D_18_G053 [ 2 - 5 - 8 ] 97 D_18_G054 [ 2 - 5 - 13 ] 98 D_19_G055 [ 2 - 0 - 4 ] 99 D_19_G056 [ 2 - 0 - 8 ]
100 D_19_G057 [ 2 - 0 - 13 ] 101 Board 15 Power 102 Board 16 Power 103 Board 17 Power 104 Board 18 Power 105 Board 19 Power 106 E_20_G058 [ 3 - 30 - 4 ] 107 E_20_G059 [ 3 - 30 - 8 ] 108 E_20_G060 [ 3 - 30 - 13 ] 109 E_21_G061 [ 3 - 26 - 4 ] 110 E_21_G062 [ 3 - 26 - 8 ] 111 E_21_G063 [ 3 - 26 - 13 ] 112 E_22_G064 [ 3 - 23 - 4 ] 113 E_22_G065 [ 3 - 23 - 8 ] 114 E_22_G066 [ 3 - 23 - 13 ] 115 E_23_G067 [ 3 - 19 - 4 ] 116 E_23_G068 [ 3 - 19 - 8 ] 117 E_23_G069 [ 3 - 19 - 13 ] 118 Board 20 Power 119 Board 21 Power 120 Board 22 Power 121 Board 23 Power 122 F_24_G070 [ 3 - 15 - 4 ] 123 F_24_G071 [ 3 - 15 - 8 ] 124 F_24_G072 [ 3 - 15 - 13 ] 125 F_25_G073 [ 3 - 11 - 4 ]
13
126 F_25_G074 [ 3 - 11 - 8 ] 127 F_25_G075 [ 3 - 11 - 13 ] 128 F_26_G076 [ 3 - 8 - 4 ] 129 F_26_G077 [ 3 - 8 - 8 ] 130 F_26_G078 [ 3 - 8 - 13 ] 131 F_27_G079 [ 3 - 4 - 4 ] 132 F_27_G080 [ 3 - 4 - 8 ] 133 F_27_G081 [ 3 - 4 - 13 ] 134 F_28_G082 [ 3 - 0 - 4 ] 135 F_28_G083 [ 3 - 0 - 8 ] 136 F_28_G084 [ 3 - 0 - 13 ] 137 Board 24 Power 138 Board 25 Power 139 Board 26 Power 140 Board 27 Power 141 Board 28 Power 142 G_29_085 [ 4 - 45 - 4 ] 143 G_29_086 [ 4 - 45 - 8 ] 144 G_29_087 [ 4 - 45 - 13 ] 145 G_30_088 [ 4 - 40 - 4 ] 146 G_30_089 [ 4 - 40 - 8 ] 147 G_30_090 [ 4 - 40 - 13 ] 148 G_31_091 [ 4 - 35 - 4 ] 149 G_31_092 [ 4 - 35 - 8 ] 150 G_31_093 [ 4 - 35 - 13 ] 151 G_32_094 [ 4 - 30 - 4 ] 152 G_32_095 [ 4 - 30 - 8 ] 153 G_32_096 [ 4 - 30 - 13 ] 154 G_33_097 [ 4 - 25 - 4 ] 155 G_33_098 [ 4 - 25 - 8 ] 156 G_33_099 [ 4 - 25 - 13 ] 157 Board 29 Power 158 Board 30 Power 159 Board 31 Power 160 Board 32 Power 161 Board 33 Power 162 H_34_G100 [ 4 - 20 - 4 ] 163 H_34_G101 [ 4 - 20 - 8 ] 164 H_34_G102 [ 4 - 20 - 13 ] 165 H_35_G103 [ 4 - 15 - 4 ] 166 H_35_G104 [ 4 - 15 - 8 ] 167 H_35_G105 [ 4 - 15 - 13 ] 168 H_36_G106 [ 4 - 10 - 4 ]
14
169 H_36_G107 [ 4 - 10 - 8 ] 170 H_36_G108 [ 4 - 10 - 13 ] 171 H_37_G109 [ 4 - 5 - 4 ] 172 H_37_G110 [ 4 - 5 - 8 ] 173 H_37_G111 [ 4 - 5 - 13 ] 174 H_38_G112 [ 4 - 0 - 4 ] 175 H_38_G113 [ 4 - 0 - 8 ] 176 H_38_G114 [ 4 - 0 - 13 ] 177 Board 34 Power 178 Board 35 Power 179 Board 36 Power 180 Board 37 Power 181 Board 38 Power 182 I_39_G115 [ 5 - 0 - 45 ] 183 I_39_G116 [ 5 - 3 - 45 ] 184 I_39_G117 [ 5 - 5 - 45 ] 185 I_39_G118 [ 5 - 10 - 45 ] 186 I_41_G124 [ 5 - 0 - 40 ] 187 I_41_G125 [ 5 - 3 - 40 ] 188 I_41_G126 [ 5 - 5 - 40 ] 189 I_41_G127 [ 5 - 10 - 40 ] 190 I_43_G133 [ 5 - 0 - 35 ] 191 I_43_G134 [ 5 - 3 - 35 ] 192 I_43_G135 [ 5 - 5 - 35 ] 193 I_43_G136 [ 5 - 10 - 35 ] 194 I_45_G142 [ 5 - 0 - 30 ] 195 I_45_G143 [ 5 - 3 - 30 ] 196 I_45_G144 [ 5 - 5 - 30 ] 197 I_45_G145 [ 5 - 10 - 30 ] 198 I_47_G151 [ 5 - 0 - 25 ] 199 I_47_G152 [ 5 - 3 - 25 ] 200 I_47_G153 [ 5 - 5 - 25 ] 201 I_47_G154 [ 5 - 10 - 25 ] 202 Board 39 Power 203 Board 41 Power 204 Board 43 Power 205 Board 45 Power 206 Board 47 Power 207 J_40_G119 [ 5 - 15 - 45 ] 208 J_40_G120 [ 5 - 20 - 45 ] 209 J_40_G121 [ 5 - 25 - 45 ] 210 J_40_G122 [ 5 - 28 - 45 ] 211 J_40_G123 [ 5 - 30 - 45 ]
15
212 J_42_G128 [ 5 - 15 - 40 ] 213 J_42_G129 [ 5 - 20 - 40 ] 214 J_42_G130 [ 5 - 25 - 40 ] 215 J_42_G131 [ 5 - 28 - 40 ] 216 J_42_G132 [ 5 - 30 - 40 ] 217 J_44_G137 [ 5 - 15 - 35 ] 218 J_44_G138 [ 5 - 20 - 35 ] 219 J_44_G139 [ 5 - 25 - 35 ] 220 J_44_G140 [ 5 - 28 - 35 ] 221 J_44_G141 [ 5 - 30 - 35 ] 222 J_46_G146 [ 5 - 15 - 30 ] 223 J_46_G147 [ 5 - 20 - 30 ] 224 J_46_G148 [ 5 - 25 - 30 ] 225 J_46_G149 [ 5 - 28 - 30 ] 226 J_46_G150 [ 5 - 30 - 30 ] 227 J_48_G155 [ 5 - 15 - 25 ] 228 J_48_G156 [ 5 - 20 - 25 ] 229 J_48_G157 [ 5 - 25 - 25 ] 230 J_48_G158 [ 5 - 28 - 25 ] 231 J_48_G159 [ 5 - 30 - 25 ] 232 Board 40 Power 233 Board 42 Power 234 Board 44 Power 235 Board 46 Power 236 Board 48 Power 237 K_50_G164 [ 5 - 15 - 20 ] 238 K_50_G165 [ 5 - 20 - 20 ] 239 K_50_G166 [ 5 - 25 - 20 ] 240 K_50_G167 [ 5 - 28 - 20 ] 241 K_50_G168 [ 5 - 30 - 20 ] 242 K_52_G173 [ 5 - 15 - 15 ] 243 K_52_G174 [ 5 - 20 - 15 ] 244 K_52_G175 [ 5 - 25 - 15 ] 245 K_52_G176 [ 5 - 28 - 15 ] 246 K_52_G177 [ 5 - 30 - 15 ] 247 K_54_G182 [ 5 - 15 - 10 ] 248 K_54_G183 [ 5 - 20 - 10 ] 249 K_54_G184 [ 5 - 25 - 10 ] 250 K_54_G185 [ 5 - 28 - 10 ] 251 K_54_G186 [ 5 - 30 - 10 ] 252 K_56_G191 [ 5 - 15 - 5 ] 253 K_56_G192 [ 5 - 20 - 5 ] 254 K_56_G193 [ 5 - 25 - 5 ]
16
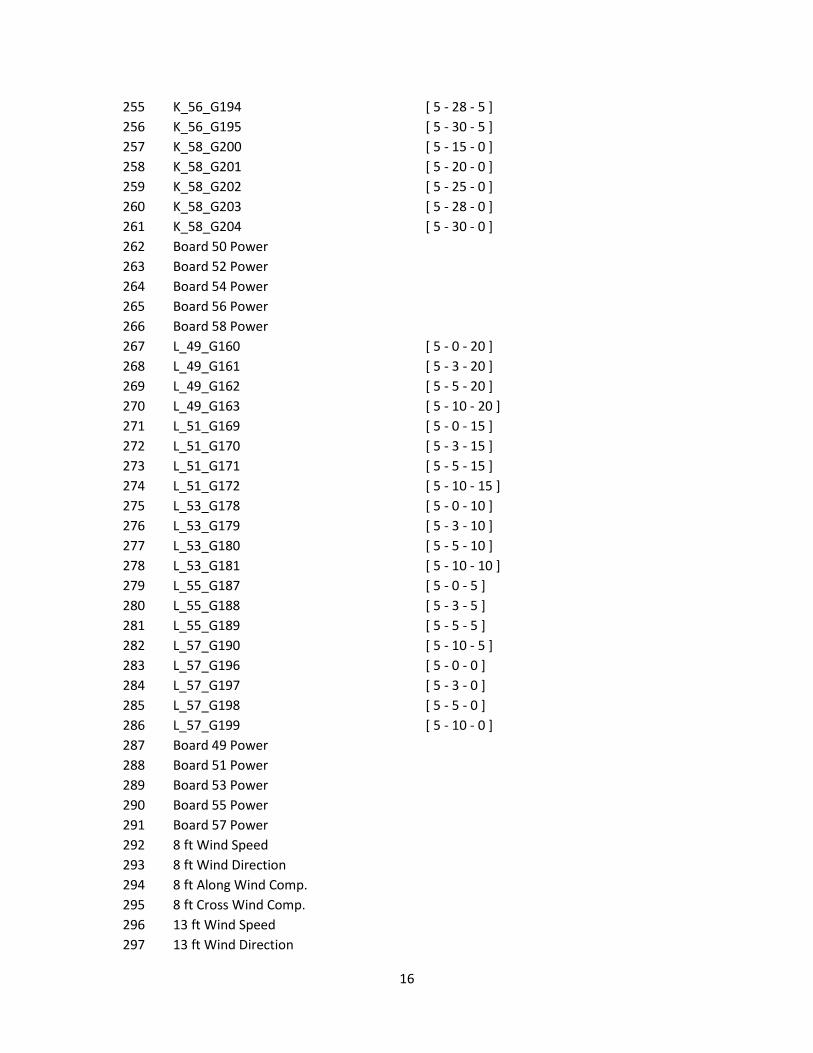
255 K_56_G194 [ 5 - 28 - 5 ] 256 K_56_G195 [ 5 - 30 - 5 ] 257 K_58_G200 [ 5 - 15 - 0 ] 258 K_58_G201 [ 5 - 20 - 0 ] 259 K_58_G202 [ 5 - 25 - 0 ] 260 K_58_G203 [ 5 - 28 - 0 ] 261 K_58_G204 [ 5 - 30 - 0 ] 262 Board 50 Power 263 Board 52 Power 264 Board 54 Power 265 Board 56 Power 266 Board 58 Power 267 L_49_G160 [ 5 - 0 - 20 ] 268 L_49_G161 [ 5 - 3 - 20 ] 269 L_49_G162 [ 5 - 5 - 20 ] 270 L_49_G163 [ 5 - 10 - 20 ] 271 L_51_G169 [ 5 - 0 - 15 ] 272 L_51_G170 [ 5 - 3 - 15 ] 273 L_51_G171 [ 5 - 5 - 15 ] 274 L_51_G172 [ 5 - 10 - 15 ] 275 L_53_G178 [ 5 - 0 - 10 ] 276 L_53_G179 [ 5 - 3 - 10 ] 277 L_53_G180 [ 5 - 5 - 10 ] 278 L_53_G181 [ 5 - 10 - 10 ] 279 L_55_G187 [ 5 - 0 - 5 ] 280 L_55_G188 [ 5 - 3 - 5 ] 281 L_55_G189 [ 5 - 5 - 5 ] 282 L_57_G190 [ 5 - 10 - 5 ] 283 L_57_G196 [ 5 - 0 - 0 ] 284 L_57_G197 [ 5 - 3 - 0 ] 285 L_57_G198 [ 5 - 5 - 0 ] 286 L_57_G199 [ 5 - 10 - 0 ] 287 Board 49 Power 288 Board 51 Power 289 Board 53 Power 290 Board 55 Power 291 Board 57 Power 292 8 ft Wind Speed 293 8 ft Wind Direction 294 8 ft Along Wind Comp. 295 8 ft Cross Wind Comp. 296 13 ft Wind Speed 297 13 ft Wind Direction
17
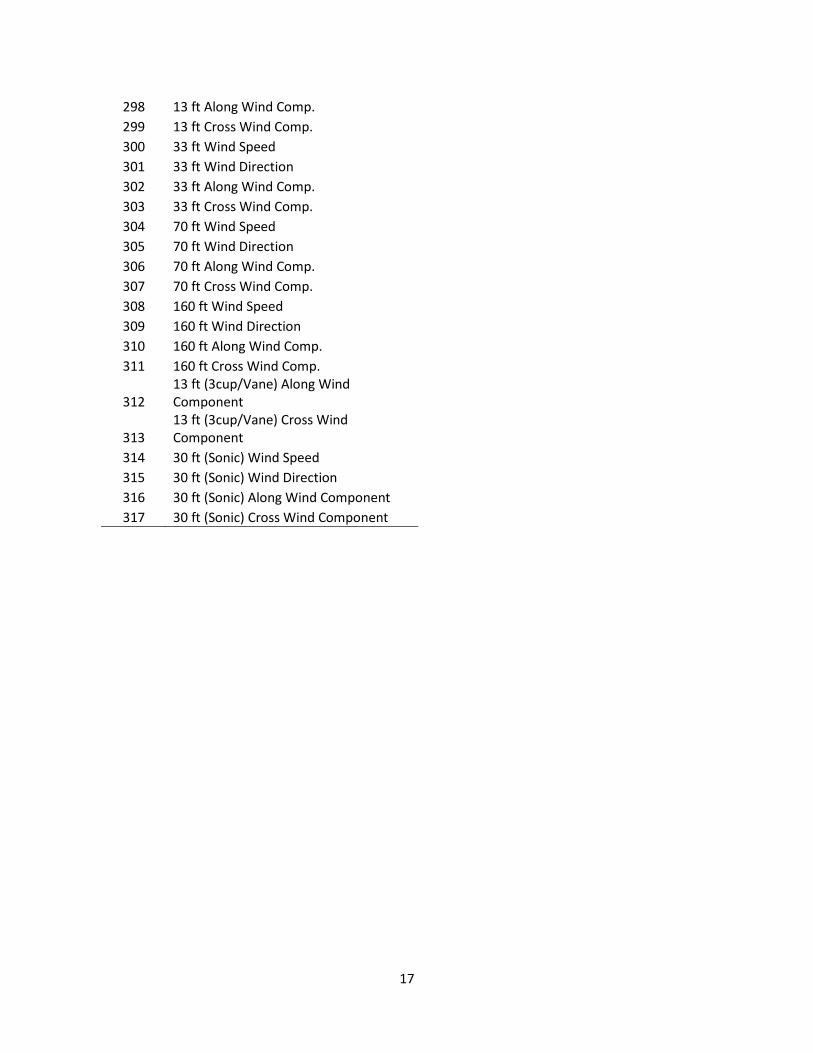
298 13 ft Along Wind Comp. 299 13 ft Cross Wind Comp. 300 33 ft Wind Speed 301 33 ft Wind Direction 302 33 ft Along Wind Comp. 303 33 ft Cross Wind Comp. 304 70 ft Wind Speed 305 70 ft Wind Direction 306 70 ft Along Wind Comp. 307 70 ft Cross Wind Comp. 308 160 ft Wind Speed 309 160 ft Wind Direction 310 160 ft Along Wind Comp. 311 160 ft Cross Wind Comp.
312 13 ft (3cup/Vane) Along Wind Component
313 13 ft (3cup/Vane) Cross Wind Component
314 30 ft (Sonic) Wind Speed 315 30 ft (Sonic) Wind Direction 316 30 ft (Sonic) Along Wind Component 317 30 ft (Sonic) Cross Wind Component
18
Table 4 Summary statistics of wind flow characteristics for selected records from WERFL.
Mode Number
Run Name Run Date
Building position
Angle of Attack
Wind Azimuth Angle
Mean Wind Speed, mph
1001.01a 276 1/9/2003 270 7.7731018 277.7731 18.28 1001.01a 277 1/9/2003 270 6.3760991 276.3761 19.46 1001.01a 279 1/9/2003 270 9.6672058 279.66721 18.13 1001.02a 620 2/9/2003 270 6.2192988 276.2193 25.18 1001.02a 623 2/9/2003 270 6.3705139 276.37051 25.4 1001.02a 958 2/27/2003 270 7.0049129 277.00491 21.8 1001.02a 966 2/27/2003 270 6.6520081 276.65201 17.97 1001.02a 1851 4/4/2003 285 352.65479 277.65479 16.74 1001.02a 1912 4/6/2003 285 351.7236 276.7236 19.97 1001.02a 1920 4/6/2003 285 354.81601 279.81601 21.04 1001.02a 1926 4/6/2003 285 352.8945 277.8945 15.37 1001.02a 2071 4/16/2003 285 354.77051 279.77051 29.93 1001.02a 2072 4/16/2003 285 352.74301 277.74301 28.56 1001.02a 2190 4/19/2003 285 352.16959 277.16959 19.02 1001.02a 2292 4/24/2003 195 81.648277 276.64828 16.71 1001.02a 2637 5/10/2003 195 83.331207 278.33121 15.99
Table 5 Malfunctioning instruments for each run.
Mode Record Malfunctioning instrument 1001.01 276 277 279 Tap 52000 1001.02 620 70’ WS & Dir 623 958 70’ WS & Dir
Tap 42004, 42008, 42013, 41504,41508, 41513,41004, 41008, 41013, 40504, 4-508, 40513, 40004, 40008, 40013
966 70’ WS & Dir Tap 42004, 42008, 42013, 41504,41508, 41513,41004, 41008, 41013,
40504, 4-508, 40513, 40004, 40008, 40013 1851 1912 70’ WS & Dir 1920 70’ WS & Dir 1926 2071 2072 70’ WS & Dir 2190 70’ WS & Dir 2292 70’ WS & Dir 2637 70’ WS & Dir
19
7. Figures
Figure 1 Roof damage from Hurricane Ike
20
Figure 2 Orientation of meteorological tower and the test building (North is towards the top of figure and the 160 ft tower has an azimuth angle of approximately 280° relative to the center of the WERFL building location).
21
Figure 3 Meteorological tower located at the Wind Engineering Research Field Laboratory (WERFL) on 4th Street.
22
Figure 4 Flat roof configuration of test structure corresponding to the data provided.
23
Figure 5 Organization of instruments and tubing for roof pressure measurements on the test structure.
24
Figure 6 Organization of instruments and tubing for wall pressure measurements on the test structure.
25
Figure 7 New pressure tap installation used for Mode 1001 data.
26
Figure 8 Tap locations on the test structure.
4
1
5 3
2x
y
x
yy
y
x
xy
x
Angle ofAttack, AOA
AOA = 0 deg.Longitudinal Axis
Transverse Axis
27
Figure 9 Plot of mean Pressure coefficients for record 620.
28
Figure 10 Plot of standard deviation pressure coefficients for record 620.