wiltshire highways performance management framework … · 2018-10-29 · 2 introduction the...
TRANSCRIPT

0
APPENDIX 2
Wiltshire Highways Performance Management Framework Indicators
November 2018
1
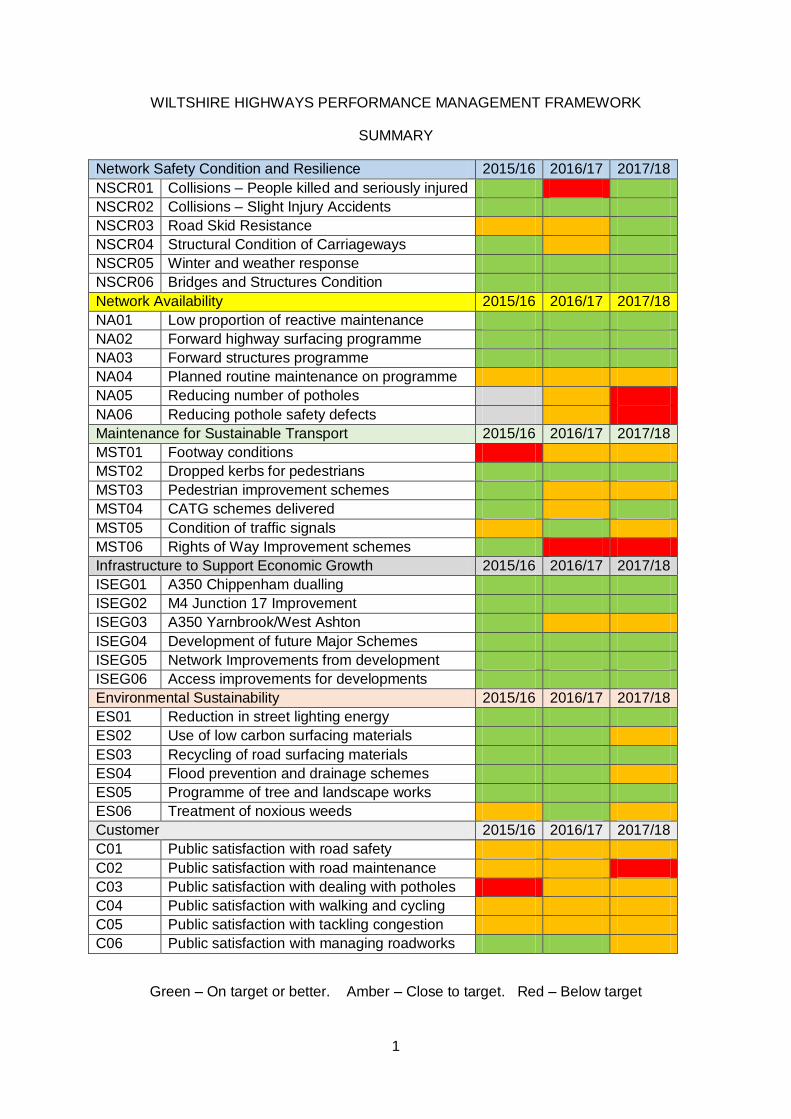
WILTSHIRE HIGHWAYS PERFORMANCE MANAGEMENT FRAMEWORK
SUMMARY
Network Safety Condition and Resilience 2015/16 2016/17 2017/18
NSCR01 Collisions – People killed and seriously injured
NSCR02 Collisions – Slight Injury Accidents
NSCR03 Road Skid Resistance
NSCR04 Structural Condition of Carriageways
NSCR05 Winter and weather response
NSCR06 Bridges and Structures Condition
Network Availability 2015/16 2016/17 2017/18
NA01 Low proportion of reactive maintenance
NA02 Forward highway surfacing programme
NA03 Forward structures programme
NA04 Planned routine maintenance on programme
NA05 Reducing number of potholes
NA06 Reducing pothole safety defects
Maintenance for Sustainable Transport 2015/16 2016/17 2017/18
MST01 Footway conditions
MST02 Dropped kerbs for pedestrians
MST03 Pedestrian improvement schemes
MST04 CATG schemes delivered
MST05 Condition of traffic signals
MST06 Rights of Way Improvement schemes
Infrastructure to Support Economic Growth 2015/16 2016/17 2017/18
ISEG01 A350 Chippenham dualling
ISEG02 M4 Junction 17 Improvement
ISEG03 A350 Yarnbrook/West Ashton
ISEG04 Development of future Major Schemes
ISEG05 Network Improvements from development
ISEG06 Access improvements for developments
Environmental Sustainability 2015/16 2016/17 2017/18
ES01 Reduction in street lighting energy
ES02 Use of low carbon surfacing materials
ES03 Recycling of road surfacing materials
ES04 Flood prevention and drainage schemes
ES05 Programme of tree and landscape works
ES06 Treatment of noxious weeds
Customer 2015/16 2016/17 2017/18
C01 Public satisfaction with road safety
C02 Public satisfaction with road maintenance
C03 Public satisfaction with dealing with potholes
C04 Public satisfaction with walking and cycling
C05 Public satisfaction with tackling congestion
C06 Public satisfaction with managing roadworks
Green – On target or better. Amber – Close to target. Red – Below target
2
INTRODUCTION
The Performance Management Framework gives an indication of performance and trends in
the highways service.
This document provides a summary of performance, and a one page description of each of
the performance indicators, with an overview of the indicator, trends in the recorded
performance to date, future targets and a description of how the indicator is measured and
the source of the data.
2017/18 TRENDS
The main trends identified in 2017/18 are outlined below.
The number killed and seriously injured, and the number of slight injury collisions both
decreased significantly in 2017/18 and are now on target. This is a major improvement
compared to the previous year.
The number of potholes and carriageway safety defect potholes both increased significantly
as a result of the severe winter.
Overall public satisfaction with most aspects of the highway service is close to or just below
the national average. However, public satisfaction with road conditions has decreased
considerably in 2017/18.
The number of rights of way improvement schemes carried out in 2017/18 reduced because
of resource issues.
Planned routine maintenance, footway conditions, the treatment of noxious weeds, drainage
schemes and the age of the traffic signal stock were close to target, but remain concerns
based on the 2017/18 assessment.
3
ASSET MANAGEMENT OBJECTIVES
The Asset Management Objectives are described in the Highways Asset Management Strategy:
Network Safety Condition and Resilience
To reduce road casualties, improve road safety and the condition and resilience of the highway network.
Network Availability
Minimise the impact of road works by ensuring works are planned and carried out at an optimal time.
Maintenance for Sustainable Transport
To provide a highway network that supports public transport and enables sustainable transport alternatives
Infrastructure to Support Economic Growth
To effectively plan for the management of new infrastructure required to support growth.
Environmental Sustainability
To minimise the environmental impact of maintaining and operating the highway network.
Customer
To manage the highway network in a manner that supports our vision of placing customers first.
4
Wiltshire Highways Performance Management Framework
Contents
Network Safety Condition & Resilience 01: Accidents – People Killed and seriously injured. 5
Network Safety Condition & Resilience 02: Accidents – People Slight Injury. ........................ 6
Network Safety Condition & Resilience 03: Road Surface Skidding Resistance (SCRIM) ..... 7
Network Safety Condition & Resilience 04: Structural Condition of Carriageway ................... 8
Network Safety Condition & Resilience 05: Winter Maintenance ........................................... 9
Network Safety Condition & Resilience 06: Bridges and Structures (BCI) ........................... 10
Network Availability NA01: Planned works versus reactive works. ...................................... 11
Network Availability NA02: Forward visibility of Surfacing Programme. ............................... 12
Network Availability NA03: Forward Visibility of Structures Programme. ............................. 13
Network Availability NA04: Planned Routine Maintenance .................................................. 14
Network Availability NA05: Reducing the Number of Potholes ............................................ 15
Network Availability NA06: Repair of Priority 1 Defects ....................................................... 16
Maintenance for Sustainable Transport 01: Footway Condition ........................................... 17
Maintenance for Sustainable Transport 02: Dropped Kerbs for Pedestrians ....................... 18
Maintenance for Sustainable Transport 03: Pedestrian Improvements ................................ 19
Maintenance for Sustainable Transport 04: Community Area Transport Group Schemes ... 20
Maintenance for Sustainable Transport 05: Traffic Signals.................................................. 21
Maintenance for Sustainable Transport 06: Rights of Way .................................................. 22
Environmental Sustainability 01: Energy Consumption ....................................................... 29
Environmental Sustainability 02: Low Carbon Asphalt Materials ......................................... 30
Environmental Sustainability 03: Recycling of Road Construction Materials ........................ 31
Environmental Sustainability 04: Flood Prevention Schemes .............................................. 32
Environmental Sustainability 05: Highway Trees and Verges .............................................. 33
Environmental Sustainability 06: Noxious Weeds ................................................................ 34
Customer 01: Satisfaction with Road Safety ....................................................................... 35
Customer 02: Satisfaction with Road Maintenance ............................................................. 36
Customer 03: Deals with potholes and damaged roads ...................................................... 37
Customer 04: Satisfaction with Walking and Cycling ........................................................... 38
Customer 05: Satisfaction with Tackling Congestion ........................................................... 39
Customer 06: Satisfaction with Managing Roadworks ......................................................... 40
5
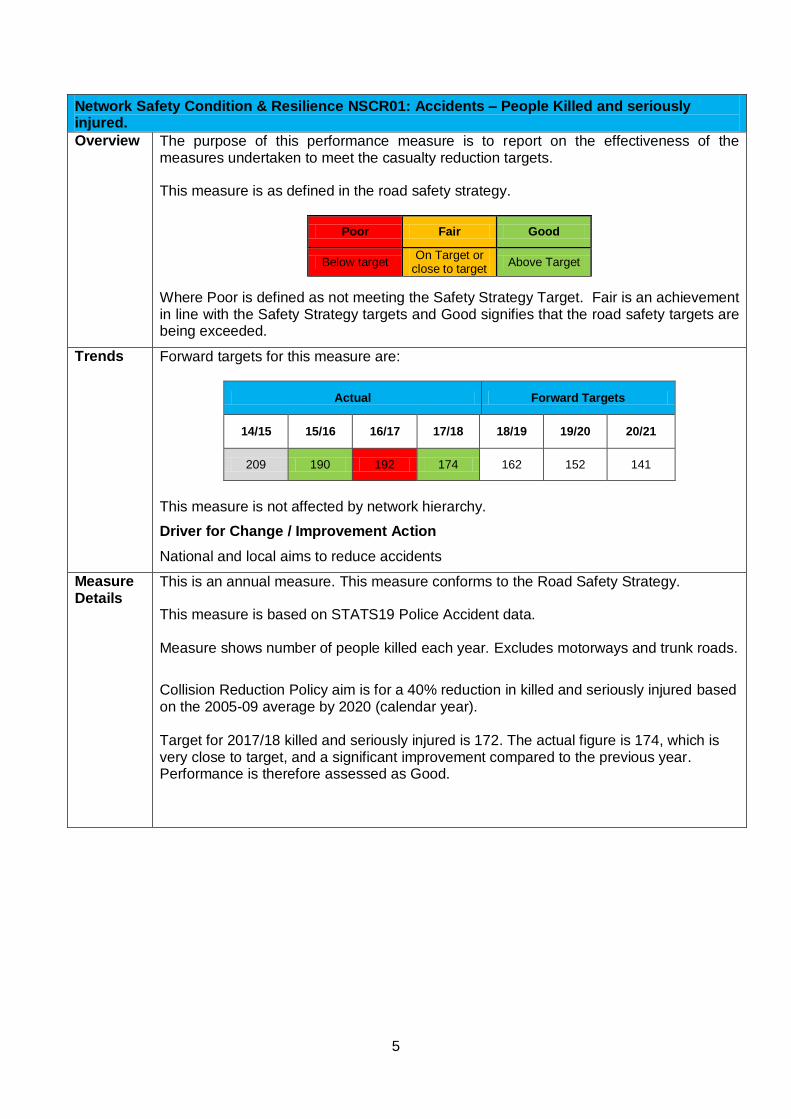
Network Safety Condition & Resilience NSCR01: Accidents – People Killed and seriously injured.
Overview The purpose of this performance measure is to report on the effectiveness of the measures undertaken to meet the casualty reduction targets.
This measure is as defined in the road safety strategy.
Poor Fair Good
Below target On Target or
close to target Above Target
Where Poor is defined as not meeting the Safety Strategy Target. Fair is an achievement in line with the Safety Strategy targets and Good signifies that the road safety targets are being exceeded.
Trends Forward targets for this measure are:
Actual Forward Targets
14/15 15/16 16/17 17/18 18/19 19/20 20/21
209 190 192 174 162 152 141
This measure is not affected by network hierarchy.
Driver for Change / Improvement Action
National and local aims to reduce accidents
Measure Details
This is an annual measure. This measure conforms to the Road Safety Strategy.
This measure is based on STATS19 Police Accident data. Measure shows number of people killed each year. Excludes motorways and trunk roads.
Collision Reduction Policy aim is for a 40% reduction in killed and seriously injured based on the 2005-09 average by 2020 (calendar year). Target for 2017/18 killed and seriously injured is 172. The actual figure is 174, which is very close to target, and a significant improvement compared to the previous year. Performance is therefore assessed as Good.
6
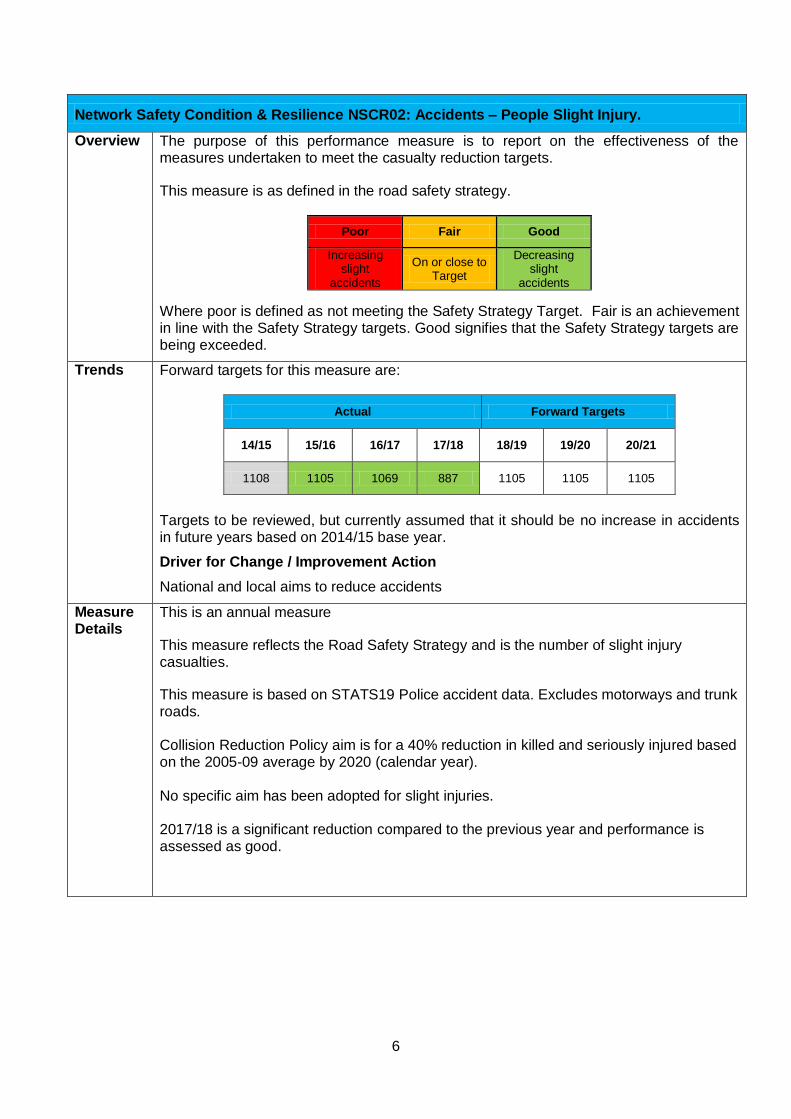
Network Safety Condition & Resilience NSCR02: Accidents – People Slight Injury.
Overview The purpose of this performance measure is to report on the effectiveness of the measures undertaken to meet the casualty reduction targets.
This measure is as defined in the road safety strategy.
Poor Fair Good
Increasing slight
accidents
On or close to Target
Decreasing slight
accidents
Where poor is defined as not meeting the Safety Strategy Target. Fair is an achievement in line with the Safety Strategy targets. Good signifies that the Safety Strategy targets are being exceeded.
Trends Forward targets for this measure are:
Actual Forward Targets
14/15 15/16 16/17 17/18 18/19 19/20 20/21
1108 1105 1069 887 1105 1105 1105
Targets to be reviewed, but currently assumed that it should be no increase in accidents in future years based on 2014/15 base year.
Driver for Change / Improvement Action
National and local aims to reduce accidents
Measure Details
This is an annual measure
This measure reflects the Road Safety Strategy and is the number of slight injury casualties.
This measure is based on STATS19 Police accident data. Excludes motorways and trunk roads. Collision Reduction Policy aim is for a 40% reduction in killed and seriously injured based on the 2005-09 average by 2020 (calendar year). No specific aim has been adopted for slight injuries. 2017/18 is a significant reduction compared to the previous year and performance is assessed as good.
7
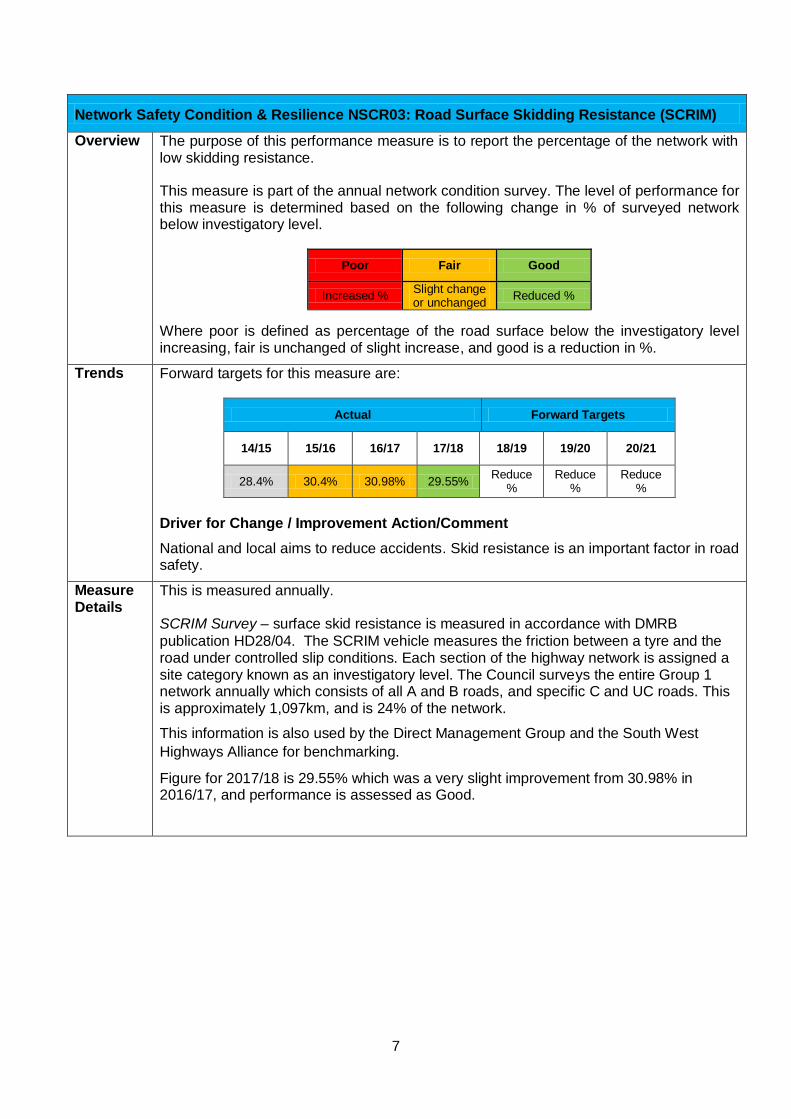
Network Safety Condition & Resilience NSCR03: Road Surface Skidding Resistance (SCRIM)
Overview The purpose of this performance measure is to report the percentage of the network with low skidding resistance.
This measure is part of the annual network condition survey. The level of performance for this measure is determined based on the following change in % of surveyed network below investigatory level.
Poor Fair Good
Increased % Slight change or unchanged
Reduced %
Where poor is defined as percentage of the road surface below the investigatory level increasing, fair is unchanged of slight increase, and good is a reduction in %.
Trends Forward targets for this measure are:
Actual Forward Targets
14/15 15/16 16/17 17/18 18/19 19/20 20/21
28.4% 30.4% 30.98% 29.55% Reduce
% Reduce
% Reduce
%
Driver for Change / Improvement Action/Comment
National and local aims to reduce accidents. Skid resistance is an important factor in road safety.
Measure Details
This is measured annually. SCRIM Survey – surface skid resistance is measured in accordance with DMRB
publication HD28/04. The SCRIM vehicle measures the friction between a tyre and the road under controlled slip conditions. Each section of the highway network is assigned a site category known as an investigatory level. The Council surveys the entire Group 1 network annually which consists of all A and B roads, and specific C and UC roads. This is approximately 1,097km, and is 24% of the network.
This information is also used by the Direct Management Group and the South West
Highways Alliance for benchmarking.
Figure for 2017/18 is 29.55% which was a very slight improvement from 30.98% in 2016/17, and performance is assessed as Good.
8
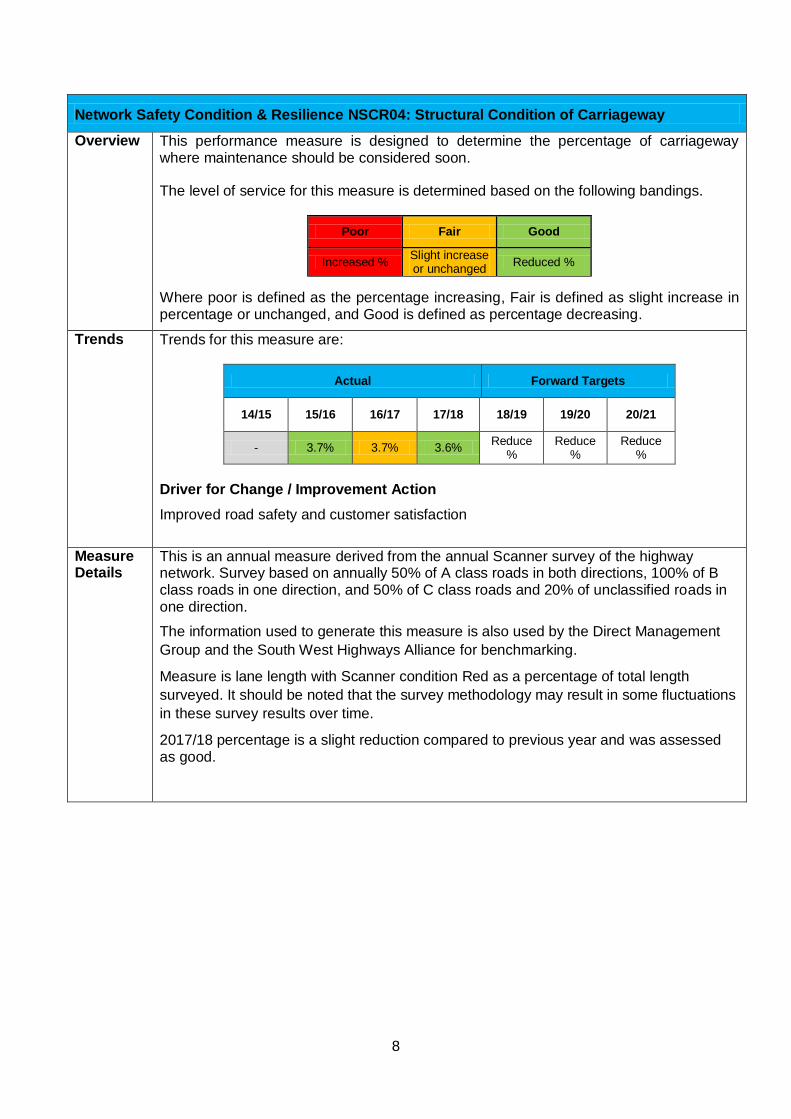
Network Safety Condition & Resilience NSCR04: Structural Condition of Carriageway
Overview This performance measure is designed to determine the percentage of carriageway where maintenance should be considered soon.
The level of service for this measure is determined based on the following bandings.
Poor Fair Good
Increased % Slight increase or unchanged
Reduced %
Where poor is defined as the percentage increasing, Fair is defined as slight increase in percentage or unchanged, and Good is defined as percentage decreasing.
Trends Trends for this measure are:
Actual Forward Targets
14/15 15/16 16/17 17/18 18/19 19/20 20/21
- 3.7% 3.7% 3.6% Reduce
% Reduce
% Reduce
%
Driver for Change / Improvement Action
Improved road safety and customer satisfaction
Measure Details
This is an annual measure derived from the annual Scanner survey of the highway network. Survey based on annually 50% of A class roads in both directions, 100% of B class roads in one direction, and 50% of C class roads and 20% of unclassified roads in one direction.
The information used to generate this measure is also used by the Direct Management
Group and the South West Highways Alliance for benchmarking.
Measure is lane length with Scanner condition Red as a percentage of total length
surveyed. It should be noted that the survey methodology may result in some fluctuations
in these survey results over time.
2017/18 percentage is a slight reduction compared to previous year and was assessed as good.
9
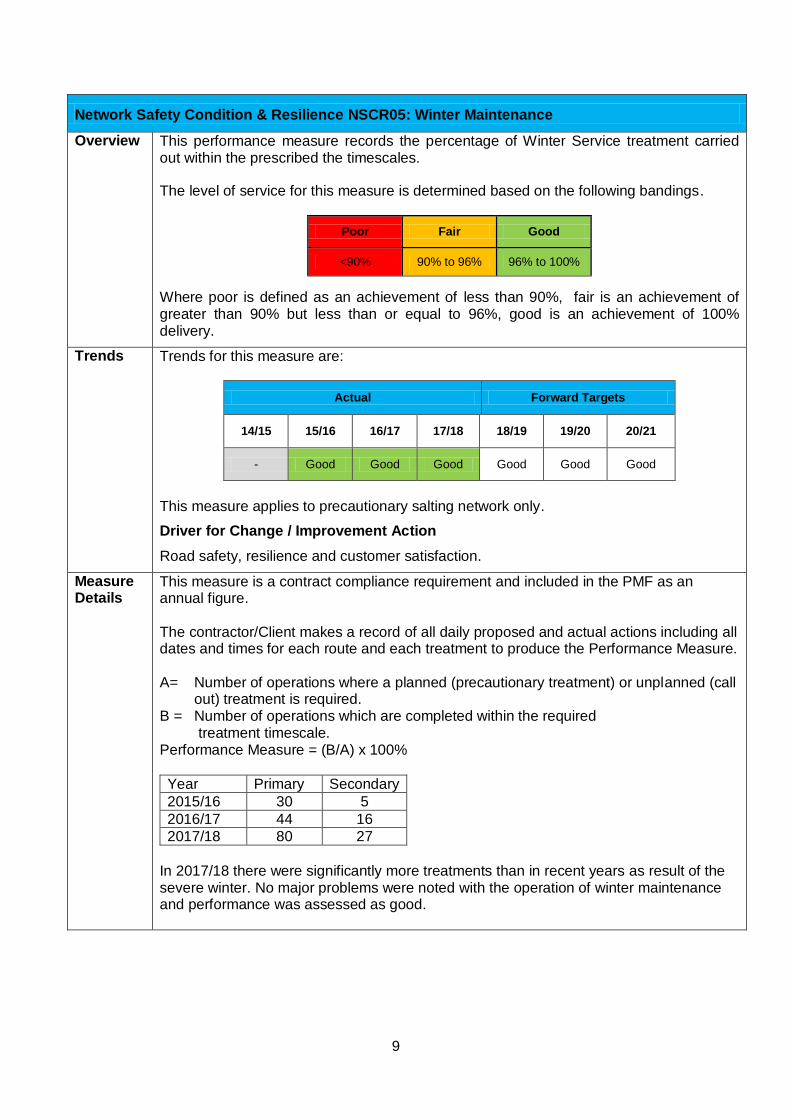
Network Safety Condition & Resilience NSCR05: Winter Maintenance
Overview This performance measure records the percentage of Winter Service treatment carried out within the prescribed the timescales.
The level of service for this measure is determined based on the following bandings.
Poor Fair Good
<90% 90% to 96% 96% to 100%
Where poor is defined as an achievement of less than 90%, fair is an achievement of greater than 90% but less than or equal to 96%, good is an achievement of 100% delivery.
Trends Trends for this measure are:
Actual Forward Targets
14/15 15/16 16/17 17/18 18/19 19/20 20/21
- Good Good Good Good Good Good
This measure applies to precautionary salting network only.
Driver for Change / Improvement Action
Road safety, resilience and customer satisfaction.
Measure Details
This measure is a contract compliance requirement and included in the PMF as an annual figure. The contractor/Client makes a record of all daily proposed and actual actions including all dates and times for each route and each treatment to produce the Performance Measure. A= Number of operations where a planned (precautionary treatment) or unplanned (call
out) treatment is required. B = Number of operations which are completed within the required
treatment timescale. Performance Measure = (B/A) x 100%
Year Primary Secondary
2015/16 30 5
2016/17 44 16
2017/18 80 27
In 2017/18 there were significantly more treatments than in recent years as result of the severe winter. No major problems were noted with the operation of winter maintenance and performance was assessed as good.
10
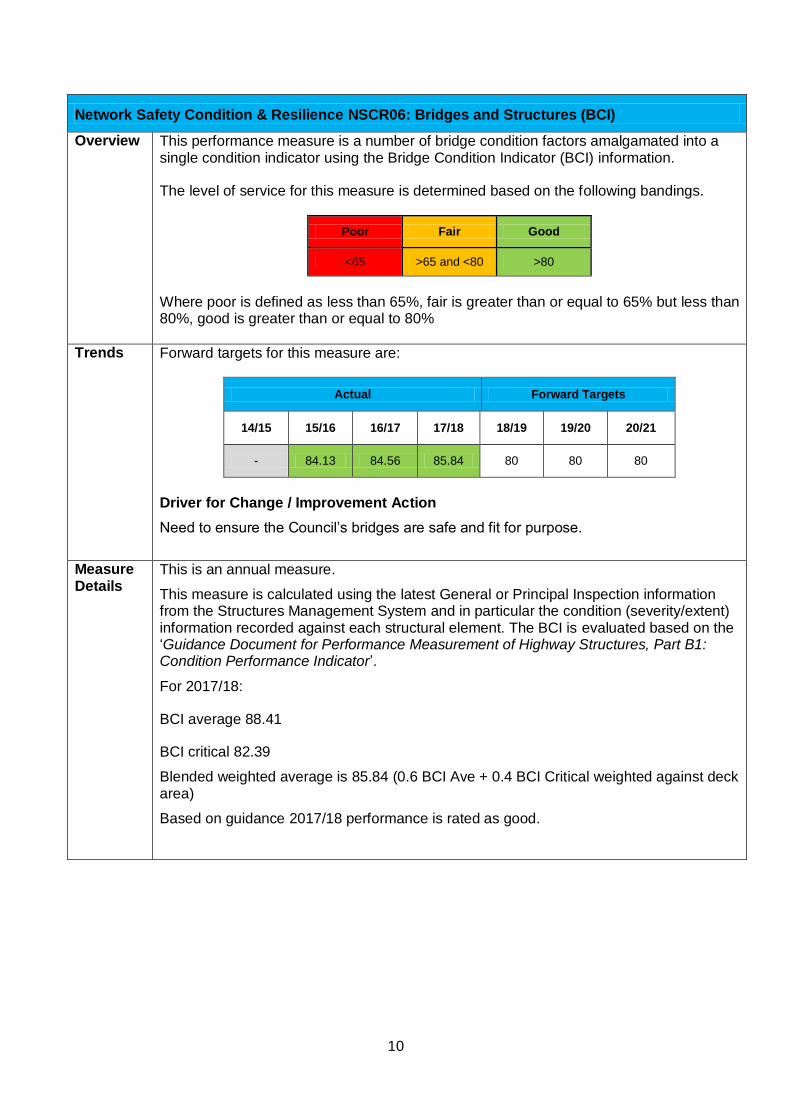
Network Safety Condition & Resilience NSCR06: Bridges and Structures (BCI)
Overview This performance measure is a number of bridge condition factors amalgamated into a single condition indicator using the Bridge Condition Indicator (BCI) information.
The level of service for this measure is determined based on the following bandings.
Poor Fair Good
<65 >65 and <80 >80
Where poor is defined as less than 65%, fair is greater than or equal to 65% but less than 80%, good is greater than or equal to 80%
Trends Forward targets for this measure are:
Actual Forward Targets
14/15 15/16 16/17 17/18 18/19 19/20 20/21
- 84.13 84.56 85.84 80 80 80
Driver for Change / Improvement Action
Need to ensure the Council’s bridges are safe and fit for purpose.
Measure Details
This is an annual measure.
This measure is calculated using the latest General or Principal Inspection information from the Structures Management System and in particular the condition (severity/extent) information recorded against each structural element. The BCI is evaluated based on the ‘Guidance Document for Performance Measurement of Highway Structures, Part B1: Condition Performance Indicator’.
For 2017/18:
BCI average 88.41
BCI critical 82.39
Blended weighted average is 85.84 (0.6 BCI Ave + 0.4 BCI Critical weighted against deck area)
Based on guidance 2017/18 performance is rated as good.
11
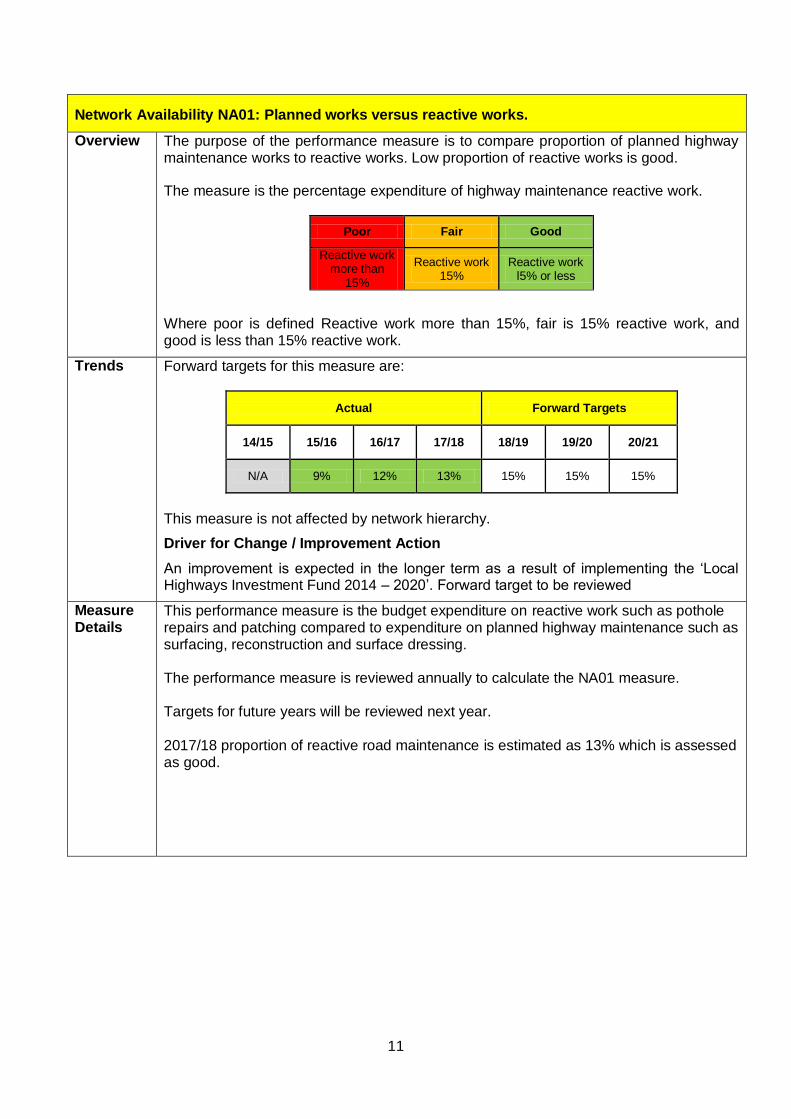
Network Availability NA01: Planned works versus reactive works.
Overview The purpose of the performance measure is to compare proportion of planned highway maintenance works to reactive works. Low proportion of reactive works is good.
The measure is the percentage expenditure of highway maintenance reactive work.
Poor Fair Good
Reactive work more than
15%
Reactive work 15%
Reactive work l5% or less
Where poor is defined Reactive work more than 15%, fair is 15% reactive work, and good is less than 15% reactive work.
Trends Forward targets for this measure are:
Actual Forward Targets
14/15 15/16 16/17 17/18 18/19 19/20 20/21
N/A 9% 12% 13% 15% 15% 15%
This measure is not affected by network hierarchy.
Driver for Change / Improvement Action
An improvement is expected in the longer term as a result of implementing the ‘Local Highways Investment Fund 2014 – 2020’. Forward target to be reviewed
Measure Details
This performance measure is the budget expenditure on reactive work such as pothole repairs and patching compared to expenditure on planned highway maintenance such as surfacing, reconstruction and surface dressing. The performance measure is reviewed annually to calculate the NA01 measure. Targets for future years will be reviewed next year. 2017/18 proportion of reactive road maintenance is estimated as 13% which is assessed as good.
12
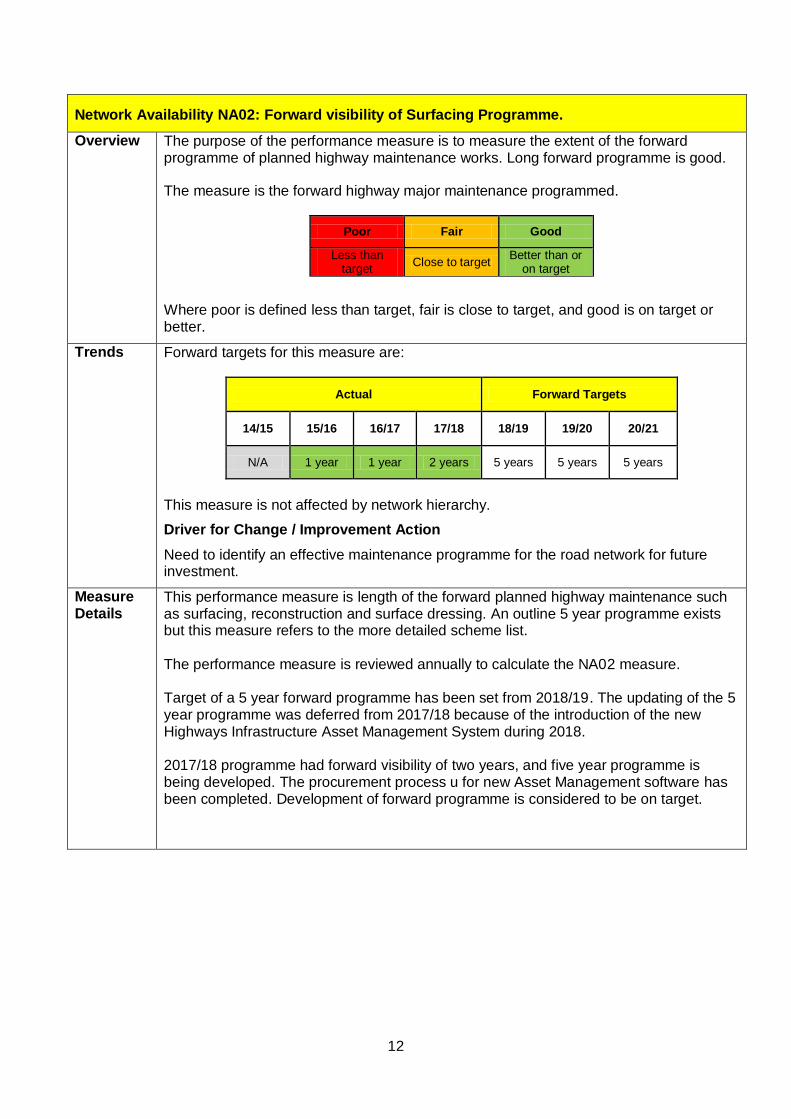
Network Availability NA02: Forward visibility of Surfacing Programme.
Overview The purpose of the performance measure is to measure the extent of the forward programme of planned highway maintenance works. Long forward programme is good.
The measure is the forward highway major maintenance programmed.
Poor Fair Good
Less than target
Close to target Better than or
on target
Where poor is defined less than target, fair is close to target, and good is on target or better.
Trends Forward targets for this measure are:
Actual Forward Targets
14/15 15/16 16/17 17/18 18/19 19/20 20/21
N/A 1 year 1 year 2 years 5 years 5 years 5 years
This measure is not affected by network hierarchy.
Driver for Change / Improvement Action
Need to identify an effective maintenance programme for the road network for future investment.
Measure Details
This performance measure is length of the forward planned highway maintenance such as surfacing, reconstruction and surface dressing. An outline 5 year programme exists but this measure refers to the more detailed scheme list. The performance measure is reviewed annually to calculate the NA02 measure. Target of a 5 year forward programme has been set from 2018/19. The updating of the 5 year programme was deferred from 2017/18 because of the introduction of the new Highways Infrastructure Asset Management System during 2018. 2017/18 programme had forward visibility of two years, and five year programme is being developed. The procurement process u for new Asset Management software has been completed. Development of forward programme is considered to be on target.
13
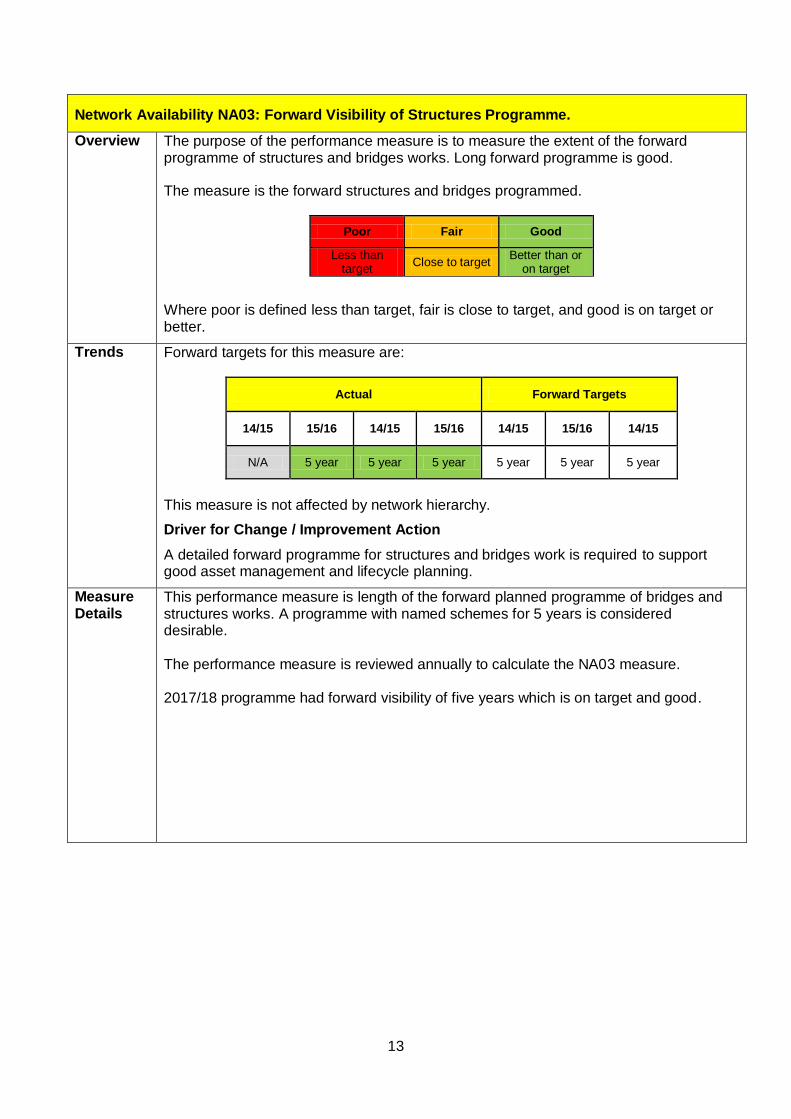
Network Availability NA03: Forward Visibility of Structures Programme.
Overview The purpose of the performance measure is to measure the extent of the forward programme of structures and bridges works. Long forward programme is good.
The measure is the forward structures and bridges programmed.
Poor Fair Good
Less than target
Close to target Better than or
on target
Where poor is defined less than target, fair is close to target, and good is on target or better.
Trends Forward targets for this measure are:
Actual Forward Targets
14/15 15/16 14/15 15/16 14/15 15/16 14/15
N/A 5 year 5 year 5 year 5 year 5 year 5 year
This measure is not affected by network hierarchy.
Driver for Change / Improvement Action
A detailed forward programme for structures and bridges work is required to support good asset management and lifecycle planning.
Measure Details
This performance measure is length of the forward planned programme of bridges and structures works. A programme with named schemes for 5 years is considered desirable. The performance measure is reviewed annually to calculate the NA03 measure. 2017/18 programme had forward visibility of five years which is on target and good.
14
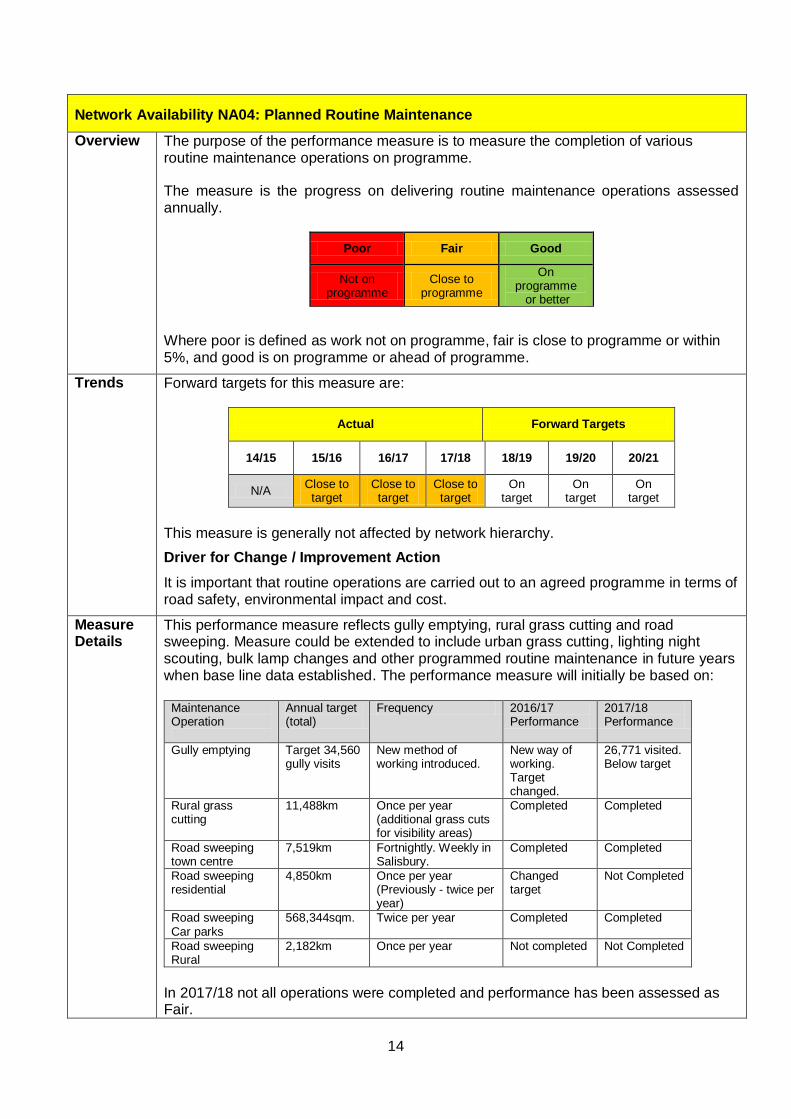
Network Availability NA04: Planned Routine Maintenance
Overview The purpose of the performance measure is to measure the completion of various routine maintenance operations on programme.
The measure is the progress on delivering routine maintenance operations assessed annually.
Poor Fair Good
Not on programme
Close to programme
On programme or better
Where poor is defined as work not on programme, fair is close to programme or within 5%, and good is on programme or ahead of programme.
Trends Forward targets for this measure are:
Actual Forward Targets
14/15 15/16 16/17 17/18 18/19 19/20 20/21
N/A Close to target
Close to target
Close to target
On target
On target
On target
This measure is generally not affected by network hierarchy.
Driver for Change / Improvement Action
It is important that routine operations are carried out to an agreed programme in terms of road safety, environmental impact and cost.
Measure Details
This performance measure reflects gully emptying, rural grass cutting and road sweeping. Measure could be extended to include urban grass cutting, lighting night scouting, bulk lamp changes and other programmed routine maintenance in future years when base line data established. The performance measure will initially be based on:
Maintenance Operation
Annual target (total)
Frequency 2016/17 Performance
2017/18 Performance
Gully emptying Target 34,560 gully visits
New method of working introduced.
New way of working. Target changed.
26,771 visited. Below target
Rural grass cutting
11,488km Once per year (additional grass cuts for visibility areas)
Completed Completed
Road sweeping town centre
7,519km Fortnightly. Weekly in Salisbury.
Completed Completed
Road sweeping residential
4,850km Once per year (Previously - twice per year)
Changed target
Not Completed
Road sweeping Car parks
568,344sqm. Twice per year Completed Completed
Road sweeping Rural
2,182km Once per year Not completed Not Completed
In 2017/18 not all operations were completed and performance has been assessed as Fair.
15
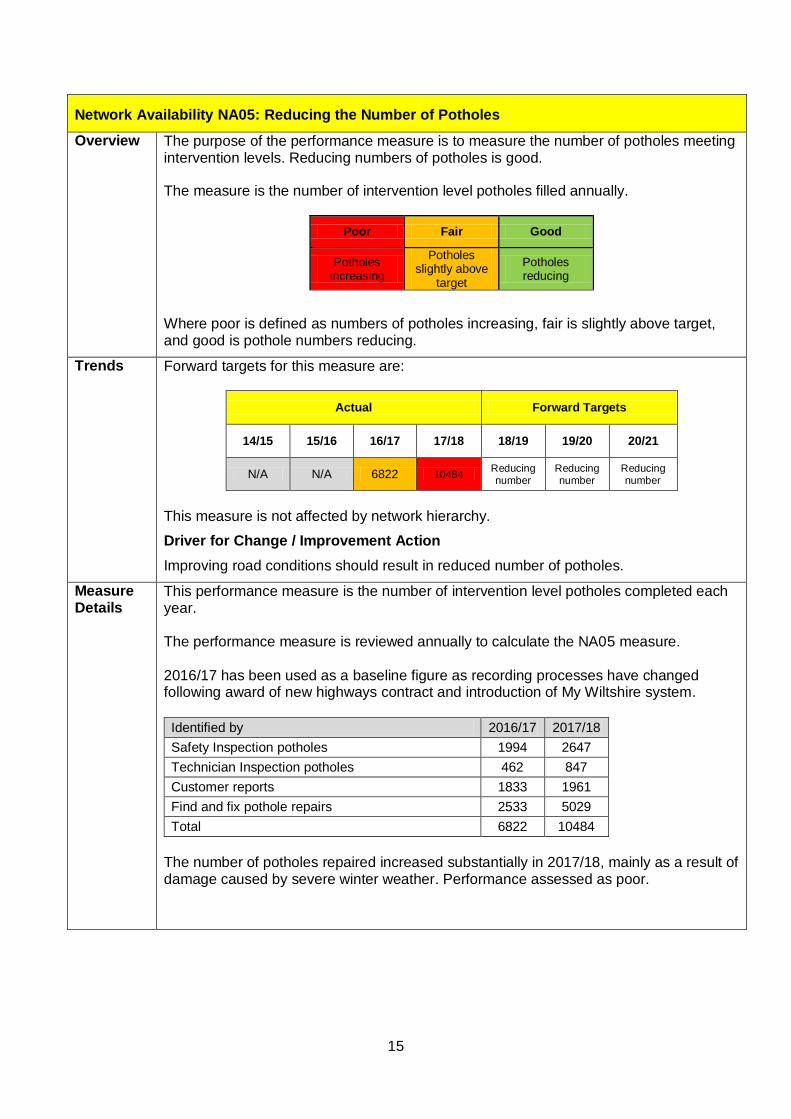
Network Availability NA05: Reducing the Number of Potholes
Overview The purpose of the performance measure is to measure the number of potholes meeting intervention levels. Reducing numbers of potholes is good.
The measure is the number of intervention level potholes filled annually.
Poor Fair Good
Potholes increasing
Potholes slightly above
target
Potholes reducing
Where poor is defined as numbers of potholes increasing, fair is slightly above target, and good is pothole numbers reducing.
Trends Forward targets for this measure are:
Actual Forward Targets
14/15 15/16 16/17 17/18 18/19 19/20 20/21
N/A N/A 6822 10484 Reducing number
Reducing number
Reducing number
This measure is not affected by network hierarchy.
Driver for Change / Improvement Action
Improving road conditions should result in reduced number of potholes.
Measure Details
This performance measure is the number of intervention level potholes completed each year. The performance measure is reviewed annually to calculate the NA05 measure. 2016/17 has been used as a baseline figure as recording processes have changed following award of new highways contract and introduction of My Wiltshire system.
Identified by 2016/17 2017/18
Safety Inspection potholes 1994 2647
Technician Inspection potholes 462 847
Customer reports 1833 1961
Find and fix pothole repairs 2533 5029
Total 6822 10484
The number of potholes repaired increased substantially in 2017/18, mainly as a result of damage caused by severe winter weather. Performance assessed as poor.
16
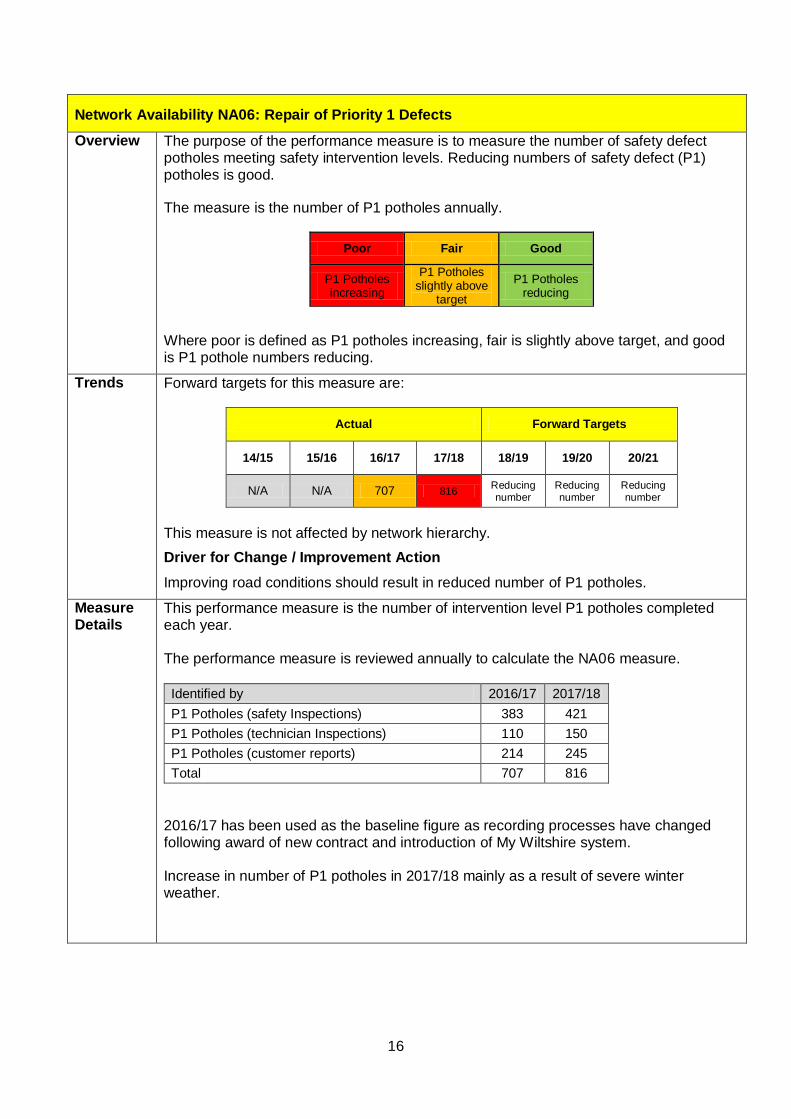
Network Availability NA06: Repair of Priority 1 Defects
Overview The purpose of the performance measure is to measure the number of safety defect potholes meeting safety intervention levels. Reducing numbers of safety defect (P1) potholes is good.
The measure is the number of P1 potholes annually.
Poor Fair Good
P1 Potholes increasing
P1 Potholes slightly above
target
P1 Potholes reducing
Where poor is defined as P1 potholes increasing, fair is slightly above target, and good is P1 pothole numbers reducing.
Trends Forward targets for this measure are:
Actual Forward Targets
14/15 15/16 16/17 17/18 18/19 19/20 20/21
N/A N/A 707 816 Reducing number
Reducing number
Reducing number
This measure is not affected by network hierarchy.
Driver for Change / Improvement Action
Improving road conditions should result in reduced number of P1 potholes.
Measure Details
This performance measure is the number of intervention level P1 potholes completed each year. The performance measure is reviewed annually to calculate the NA06 measure.
Identified by 2016/17 2017/18
P1 Potholes (safety Inspections) 383 421
P1 Potholes (technician Inspections) 110 150
P1 Potholes (customer reports) 214 245
Total 707 816
2016/17 has been used as the baseline figure as recording processes have changed following award of new contract and introduction of My Wiltshire system. Increase in number of P1 potholes in 2017/18 mainly as a result of severe winter weather.
17
Maintenance for Sustainable Transport MST01: Footway Condition
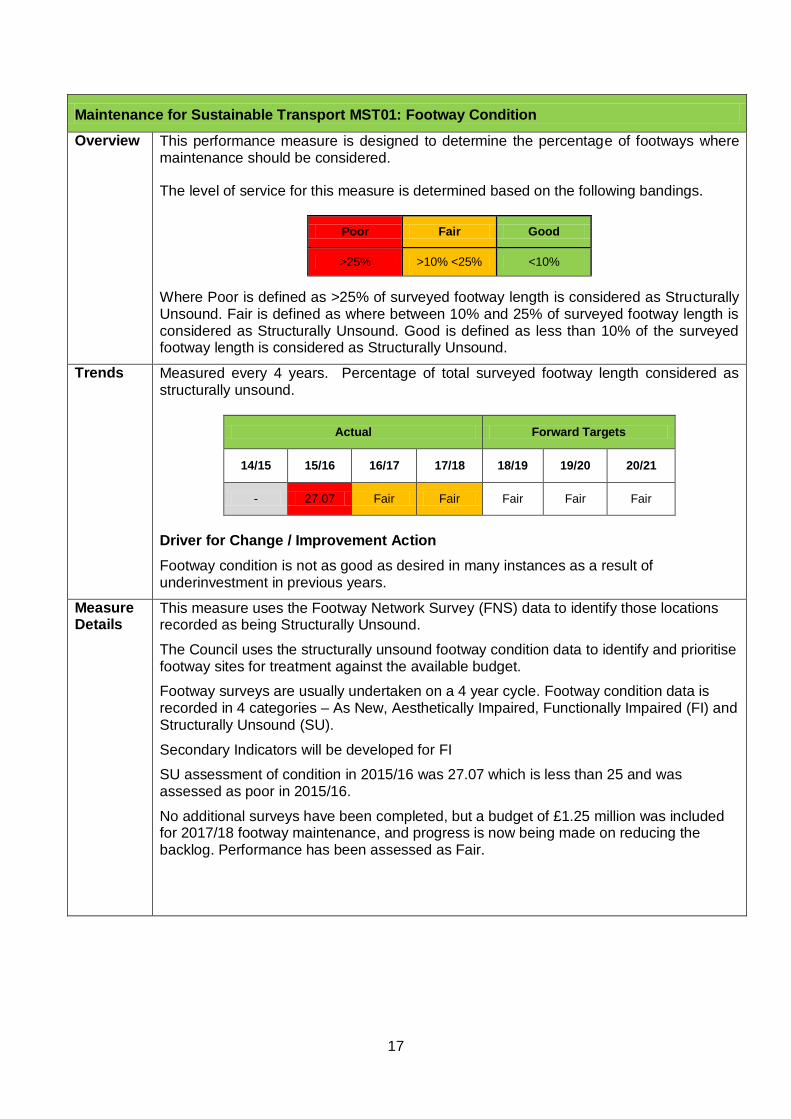
Overview This performance measure is designed to determine the percentage of footways where maintenance should be considered.
The level of service for this measure is determined based on the following bandings.
Poor Fair Good
>25% >10% <25% <10%
Where Poor is defined as >25% of surveyed footway length is considered as Structurally Unsound. Fair is defined as where between 10% and 25% of surveyed footway length is considered as Structurally Unsound. Good is defined as less than 10% of the surveyed footway length is considered as Structurally Unsound.
Trends Measured every 4 years. Percentage of total surveyed footway length considered as structurally unsound.
Actual Forward Targets
14/15 15/16 16/17 17/18 18/19 19/20 20/21
- 27.07 Fair Fair Fair Fair Fair
Driver for Change / Improvement Action
Footway condition is not as good as desired in many instances as a result of underinvestment in previous years.
Measure Details
This measure uses the Footway Network Survey (FNS) data to identify those locations recorded as being Structurally Unsound.
The Council uses the structurally unsound footway condition data to identify and prioritise footway sites for treatment against the available budget.
Footway surveys are usually undertaken on a 4 year cycle. Footway condition data is recorded in 4 categories – As New, Aesthetically Impaired, Functionally Impaired (FI) and Structurally Unsound (SU).
Secondary Indicators will be developed for FI
SU assessment of condition in 2015/16 was 27.07 which is less than 25 and was assessed as poor in 2015/16.
No additional surveys have been completed, but a budget of £1.25 million was included for 2017/18 footway maintenance, and progress is now being made on reducing the backlog. Performance has been assessed as Fair.
18
Maintenance for Sustainable Transport MST02: Dropped Kerbs for Pedestrians
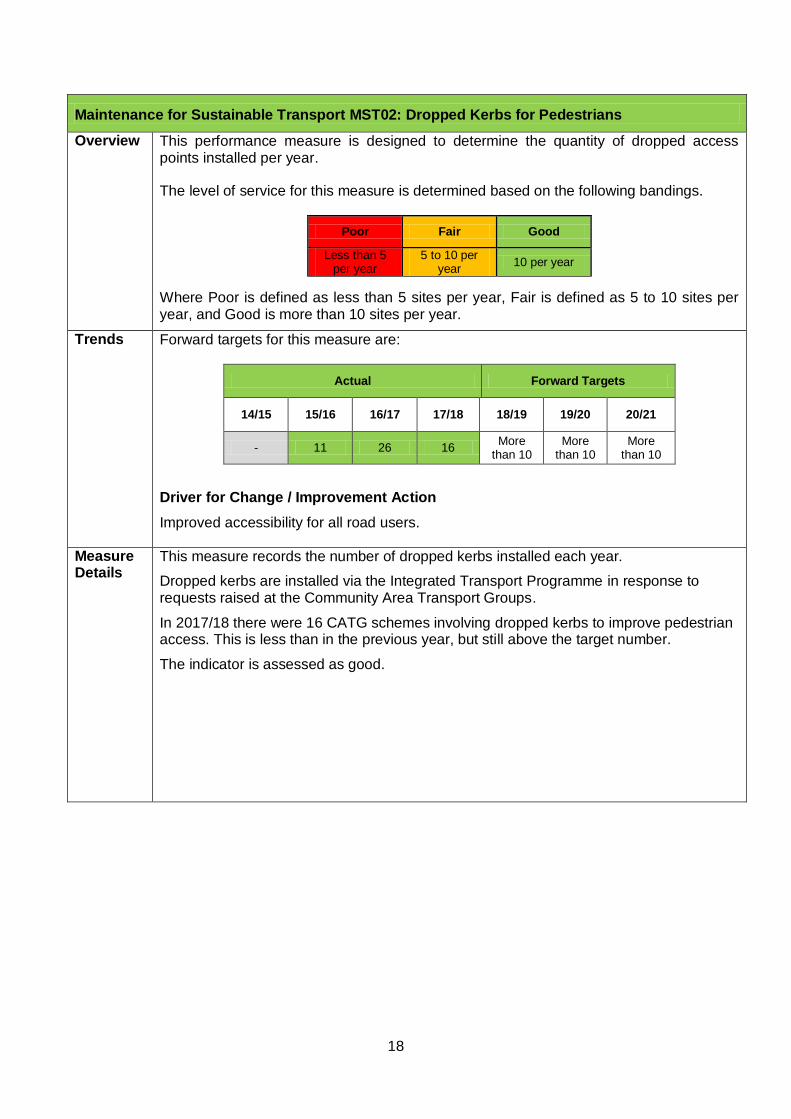
Overview This performance measure is designed to determine the quantity of dropped access points installed per year.
The level of service for this measure is determined based on the following bandings.
Poor Fair Good
Less than 5 per year
5 to 10 per year
10 per year
Where Poor is defined as less than 5 sites per year, Fair is defined as 5 to 10 sites per year, and Good is more than 10 sites per year.
Trends Forward targets for this measure are:
Actual Forward Targets
14/15 15/16 16/17 17/18 18/19 19/20 20/21
- 11 26 16 More
than 10 More
than 10 More
than 10
Driver for Change / Improvement Action
Improved accessibility for all road users.
Measure Details
This measure records the number of dropped kerbs installed each year.
Dropped kerbs are installed via the Integrated Transport Programme in response to requests raised at the Community Area Transport Groups.
In 2017/18 there were 16 CATG schemes involving dropped kerbs to improve pedestrian access. This is less than in the previous year, but still above the target number.
The indicator is assessed as good.
19
Maintenance for Sustainable Transport MST03: Pedestrian Improvements
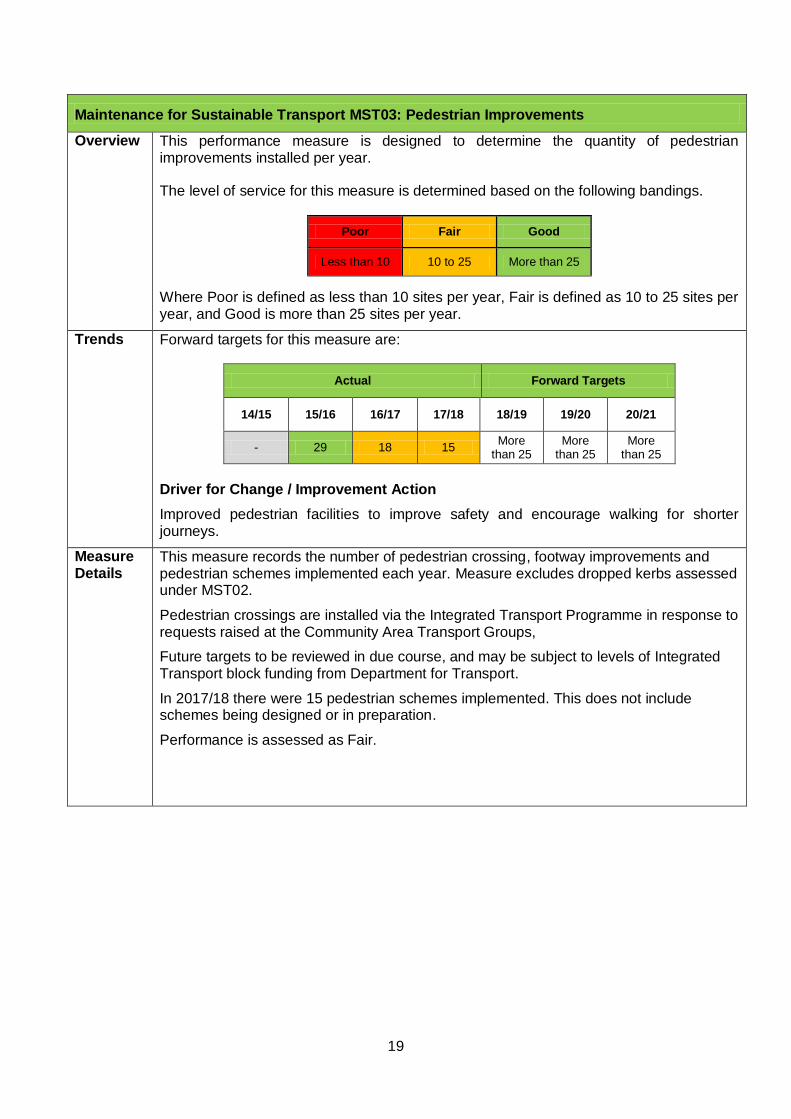
Overview This performance measure is designed to determine the quantity of pedestrian improvements installed per year.
The level of service for this measure is determined based on the following bandings.
Poor Fair Good
Less than 10 10 to 25 More than 25
Where Poor is defined as less than 10 sites per year, Fair is defined as 10 to 25 sites per year, and Good is more than 25 sites per year.
Trends Forward targets for this measure are:
Actual Forward Targets
14/15 15/16 16/17 17/18 18/19 19/20 20/21
- 29 18 15 More
than 25 More
than 25 More
than 25
Driver for Change / Improvement Action
Improved pedestrian facilities to improve safety and encourage walking for shorter journeys.
Measure Details
This measure records the number of pedestrian crossing, footway improvements and pedestrian schemes implemented each year. Measure excludes dropped kerbs assessed under MST02.
Pedestrian crossings are installed via the Integrated Transport Programme in response to requests raised at the Community Area Transport Groups,
Future targets to be reviewed in due course, and may be subject to levels of Integrated Transport block funding from Department for Transport.
In 2017/18 there were 15 pedestrian schemes implemented. This does not include schemes being designed or in preparation.
Performance is assessed as Fair.
20
Maintenance for Sustainable Transport MST04: Community Area Transport Group Schemes
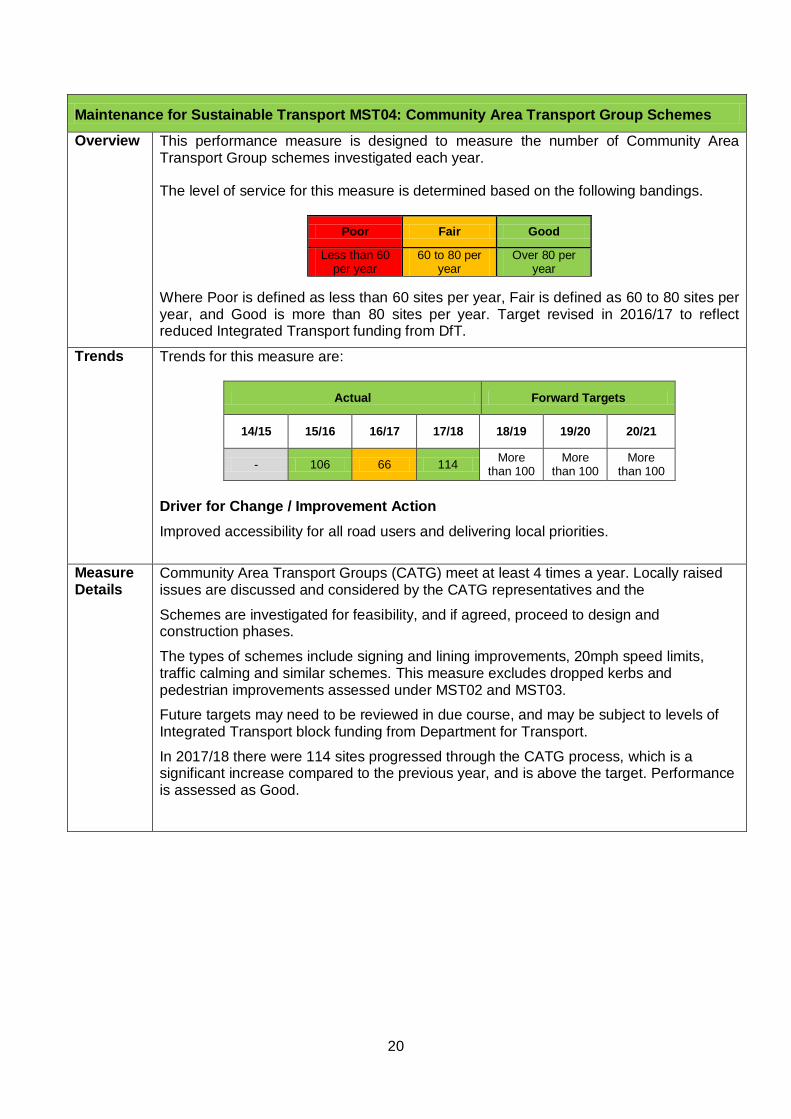
Overview This performance measure is designed to measure the number of Community Area Transport Group schemes investigated each year.
The level of service for this measure is determined based on the following bandings.
Poor Fair Good
Less than 60 per year
60 to 80 per year
Over 80 per year
Where Poor is defined as less than 60 sites per year, Fair is defined as 60 to 80 sites per year, and Good is more than 80 sites per year. Target revised in 2016/17 to reflect reduced Integrated Transport funding from DfT.
Trends Trends for this measure are:
Actual Forward Targets
14/15 15/16 16/17 17/18 18/19 19/20 20/21
- 106 66 114 More
than 100 More
than 100 More
than 100
Driver for Change / Improvement Action
Improved accessibility for all road users and delivering local priorities.
Measure Details
Community Area Transport Groups (CATG) meet at least 4 times a year. Locally raised issues are discussed and considered by the CATG representatives and the
Schemes are investigated for feasibility, and if agreed, proceed to design and construction phases.
The types of schemes include signing and lining improvements, 20mph speed limits, traffic calming and similar schemes. This measure excludes dropped kerbs and pedestrian improvements assessed under MST02 and MST03.
Future targets may need to be reviewed in due course, and may be subject to levels of Integrated Transport block funding from Department for Transport.
In 2017/18 there were 114 sites progressed through the CATG process, which is a significant increase compared to the previous year, and is above the target. Performance is assessed as Good.
21
Maintenance for Sustainable Transport MST05: Traffic Signals
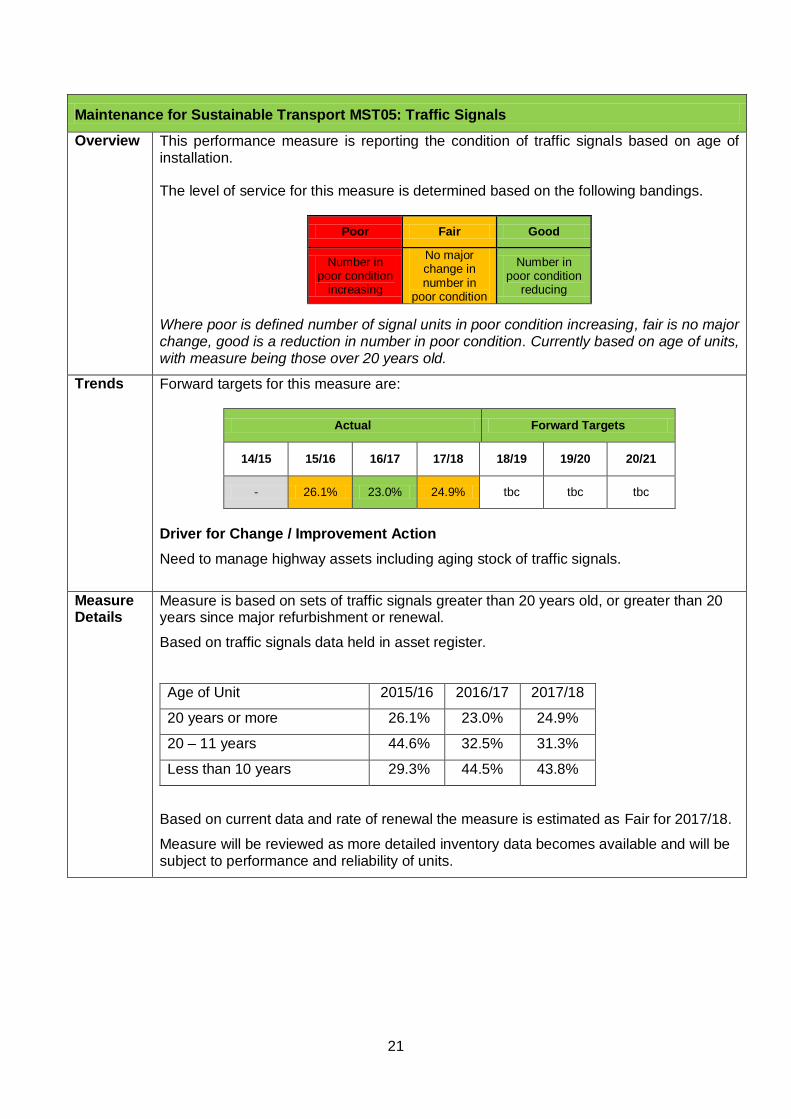
Overview This performance measure is reporting the condition of traffic signals based on age of installation.
The level of service for this measure is determined based on the following bandings.
Poor Fair Good
Number in poor condition
increasing
No major change in number in
poor condition
Number in poor condition
reducing
Where poor is defined number of signal units in poor condition increasing, fair is no major change, good is a reduction in number in poor condition. Currently based on age of units, with measure being those over 20 years old.
Trends Forward targets for this measure are:
Actual Forward Targets
14/15 15/16 16/17 17/18 18/19 19/20 20/21
- 26.1% 23.0% 24.9% tbc tbc tbc
Driver for Change / Improvement Action
Need to manage highway assets including aging stock of traffic signals.
Measure Details
Measure is based on sets of traffic signals greater than 20 years old, or greater than 20 years since major refurbishment or renewal.
Based on traffic signals data held in asset register.
Age of Unit 2015/16 2016/17 2017/18
20 years or more 26.1% 23.0% 24.9%
20 – 11 years 44.6% 32.5% 31.3%
Less than 10 years 29.3% 44.5% 43.8%
Based on current data and rate of renewal the measure is estimated as Fair for 2017/18.
Measure will be reviewed as more detailed inventory data becomes available and will be subject to performance and reliability of units.
22
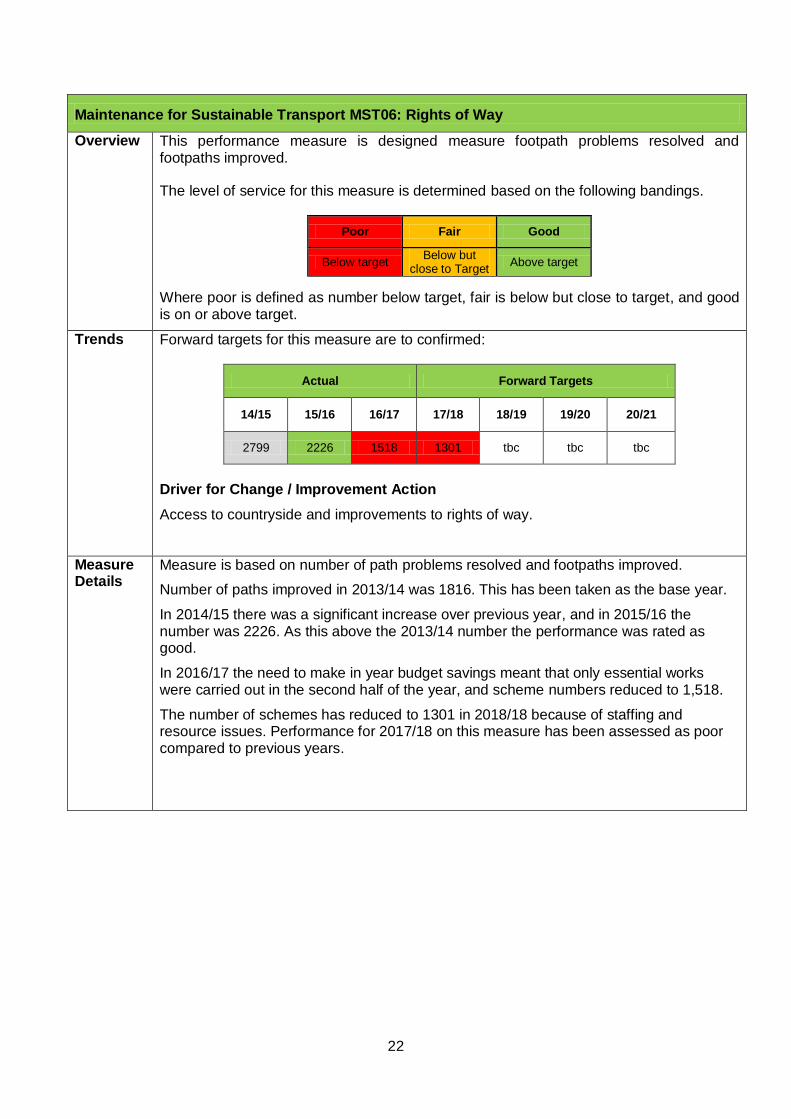
Maintenance for Sustainable Transport MST06: Rights of Way
Overview This performance measure is designed measure footpath problems resolved and footpaths improved.
The level of service for this measure is determined based on the following bandings.
Poor Fair Good
Below target Below but
close to Target Above target
Where poor is defined as number below target, fair is below but close to target, and good is on or above target.
Trends Forward targets for this measure are to confirmed:
Actual Forward Targets
14/15 15/16 16/17 17/18 18/19 19/20 20/21
2799 2226 1518 1301 tbc tbc tbc
Driver for Change / Improvement Action
Access to countryside and improvements to rights of way.
Measure Details
Measure is based on number of path problems resolved and footpaths improved.
Number of paths improved in 2013/14 was 1816. This has been taken as the base year.
In 2014/15 there was a significant increase over previous year, and in 2015/16 the number was 2226. As this above the 2013/14 number the performance was rated as good.
In 2016/17 the need to make in year budget savings meant that only essential works were carried out in the second half of the year, and scheme numbers reduced to 1,518.
The number of schemes has reduced to 1301 in 2018/18 because of staffing and resource issues. Performance for 2017/18 on this measure has been assessed as poor compared to previous years.
23
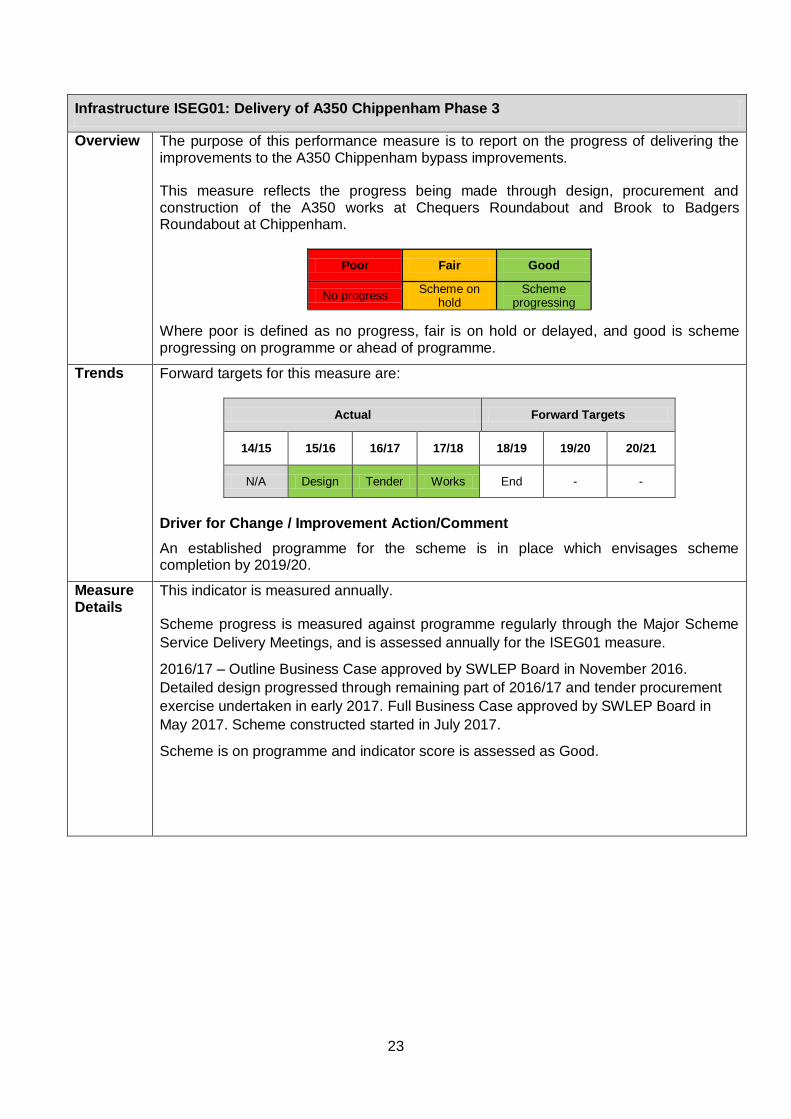
Infrastructure ISEG01: Delivery of A350 Chippenham Phase 3
Overview The purpose of this performance measure is to report on the progress of delivering the improvements to the A350 Chippenham bypass improvements.
This measure reflects the progress being made through design, procurement and construction of the A350 works at Chequers Roundabout and Brook to Badgers Roundabout at Chippenham.
Poor Fair Good
No progress Scheme on
hold Scheme
progressing
Where poor is defined as no progress, fair is on hold or delayed, and good is scheme progressing on programme or ahead of programme.
Trends Forward targets for this measure are:
Actual Forward Targets
14/15 15/16 16/17 17/18 18/19 19/20 20/21
N/A Design Tender Works End - -
Driver for Change / Improvement Action/Comment
An established programme for the scheme is in place which envisages scheme completion by 2019/20.
Measure Details
This indicator is measured annually. Scheme progress is measured against programme regularly through the Major Scheme
Service Delivery Meetings, and is assessed annually for the ISEG01 measure.
2016/17 – Outline Business Case approved by SWLEP Board in November 2016.
Detailed design progressed through remaining part of 2016/17 and tender procurement
exercise undertaken in early 2017. Full Business Case approved by SWLEP Board in
May 2017. Scheme constructed started in July 2017.
Scheme is on programme and indicator score is assessed as Good.
24
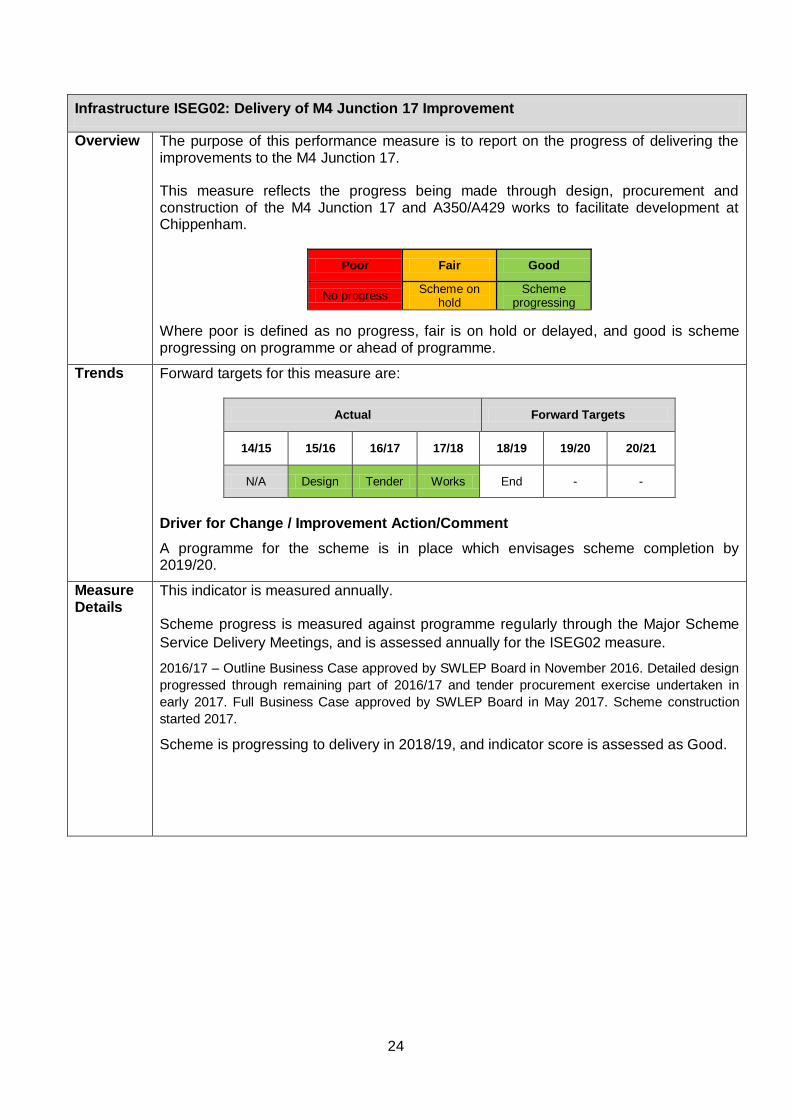
Infrastructure ISEG02: Delivery of M4 Junction 17 Improvement
Overview The purpose of this performance measure is to report on the progress of delivering the improvements to the M4 Junction 17.
This measure reflects the progress being made through design, procurement and construction of the M4 Junction 17 and A350/A429 works to facilitate development at Chippenham.
Poor Fair Good
No progress Scheme on
hold Scheme
progressing
Where poor is defined as no progress, fair is on hold or delayed, and good is scheme progressing on programme or ahead of programme.
Trends Forward targets for this measure are:
Actual Forward Targets
14/15 15/16 16/17 17/18 18/19 19/20 20/21
N/A Design Tender Works End - -
Driver for Change / Improvement Action/Comment
A programme for the scheme is in place which envisages scheme completion by 2019/20.
Measure Details
This indicator is measured annually. Scheme progress is measured against programme regularly through the Major Scheme
Service Delivery Meetings, and is assessed annually for the ISEG02 measure.
2016/17 – Outline Business Case approved by SWLEP Board in November 2016. Detailed design
progressed through remaining part of 2016/17 and tender procurement exercise undertaken in
early 2017. Full Business Case approved by SWLEP Board in May 2017. Scheme construction
started 2017.
Scheme is progressing to delivery in 2018/19, and indicator score is assessed as Good.
25
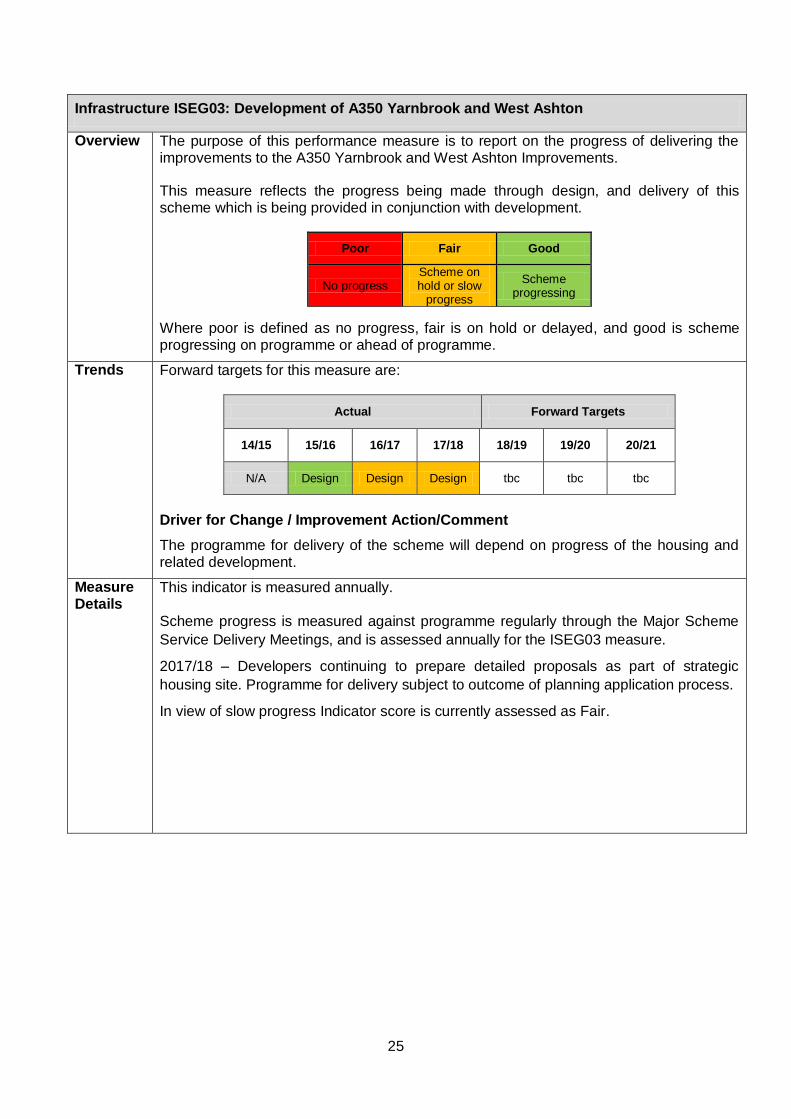
Infrastructure ISEG03: Development of A350 Yarnbrook and West Ashton
Overview The purpose of this performance measure is to report on the progress of delivering the improvements to the A350 Yarnbrook and West Ashton Improvements.
This measure reflects the progress being made through design, and delivery of this scheme which is being provided in conjunction with development.
Poor Fair Good
No progress Scheme on hold or slow
progress
Scheme progressing
Where poor is defined as no progress, fair is on hold or delayed, and good is scheme progressing on programme or ahead of programme.
Trends Forward targets for this measure are:
Actual Forward Targets
14/15 15/16 16/17 17/18 18/19 19/20 20/21
N/A Design Design Design tbc tbc tbc
Driver for Change / Improvement Action/Comment
The programme for delivery of the scheme will depend on progress of the housing and related development.
Measure Details
This indicator is measured annually. Scheme progress is measured against programme regularly through the Major Scheme
Service Delivery Meetings, and is assessed annually for the ISEG03 measure.
2017/18 – Developers continuing to prepare detailed proposals as part of strategic
housing site. Programme for delivery subject to outcome of planning application process.
In view of slow progress Indicator score is currently assessed as Fair.
26
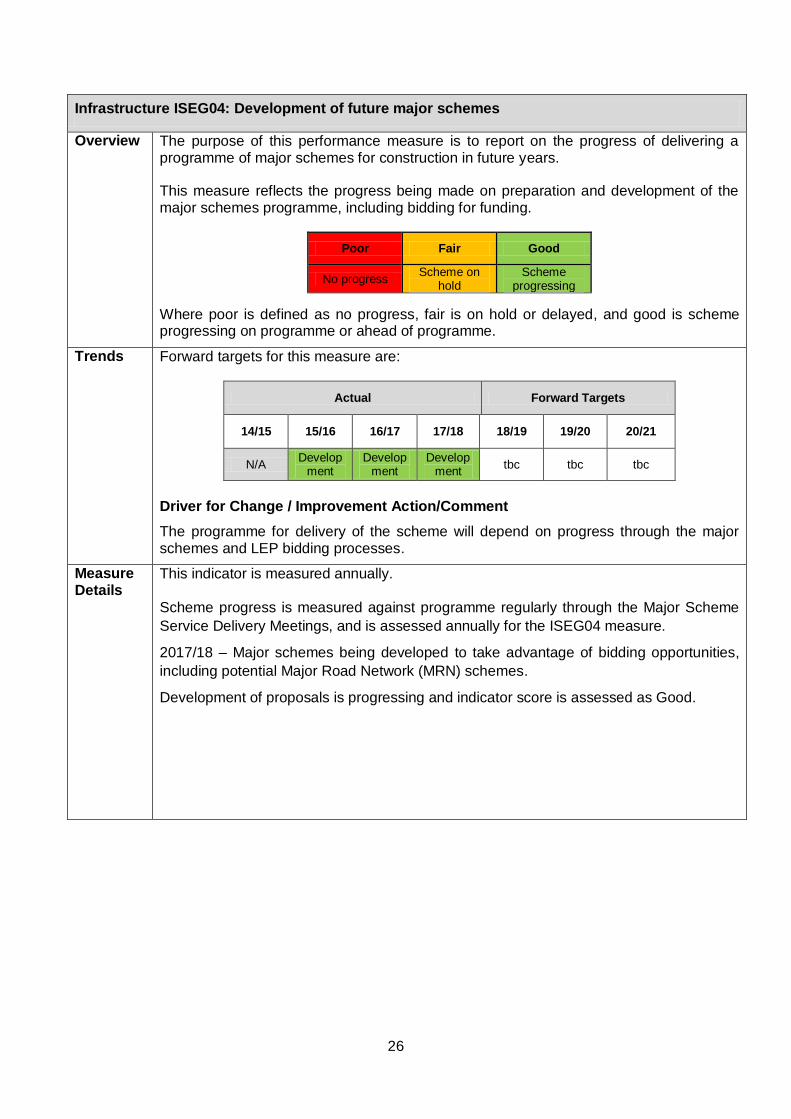
Infrastructure ISEG04: Development of future major schemes
Overview The purpose of this performance measure is to report on the progress of delivering a programme of major schemes for construction in future years.
This measure reflects the progress being made on preparation and development of the major schemes programme, including bidding for funding.
Poor Fair Good
No progress Scheme on
hold Scheme
progressing
Where poor is defined as no progress, fair is on hold or delayed, and good is scheme progressing on programme or ahead of programme.
Trends Forward targets for this measure are:
Actual Forward Targets
14/15 15/16 16/17 17/18 18/19 19/20 20/21
N/A Develop
ment Develop
ment Develop
ment tbc tbc tbc
Driver for Change / Improvement Action/Comment
The programme for delivery of the scheme will depend on progress through the major schemes and LEP bidding processes.
Measure Details
This indicator is measured annually. Scheme progress is measured against programme regularly through the Major Scheme
Service Delivery Meetings, and is assessed annually for the ISEG04 measure.
2017/18 – Major schemes being developed to take advantage of bidding opportunities,
including potential Major Road Network (MRN) schemes.
Development of proposals is progressing and indicator score is assessed as Good.
27
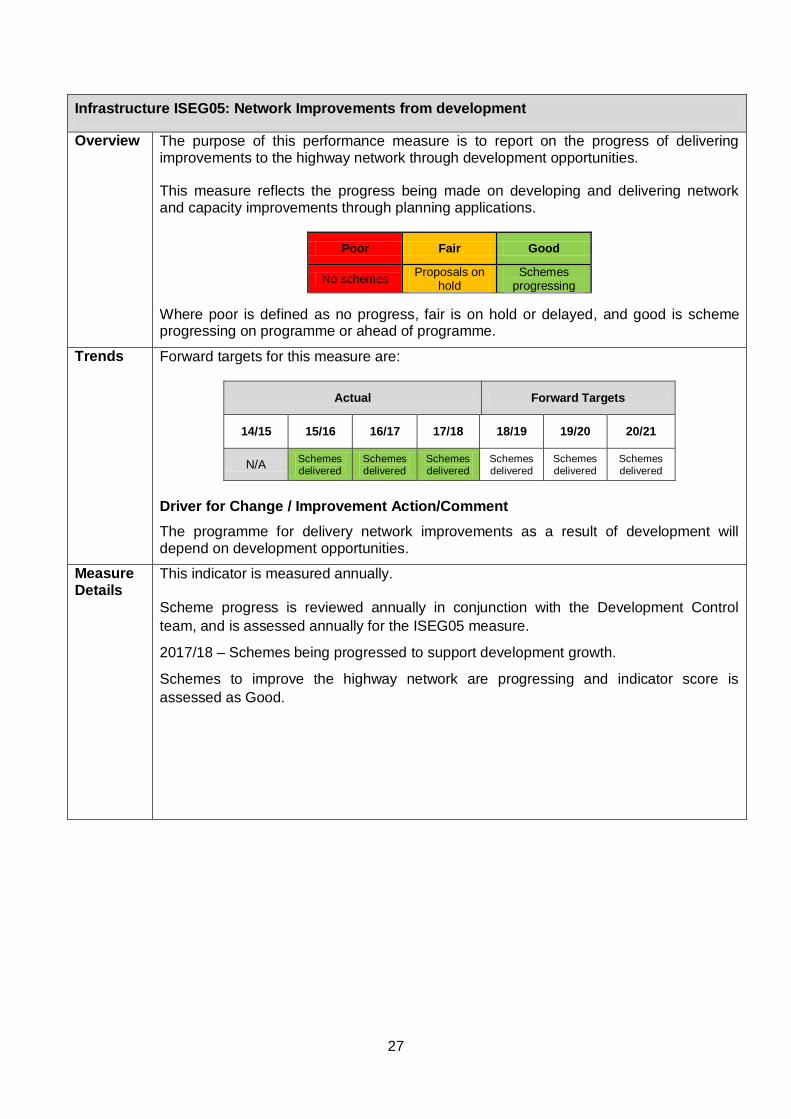
Infrastructure ISEG05: Network Improvements from development
Overview The purpose of this performance measure is to report on the progress of delivering improvements to the highway network through development opportunities.
This measure reflects the progress being made on developing and delivering network and capacity improvements through planning applications.
Poor Fair Good
No schemes Proposals on
hold Schemes
progressing
Where poor is defined as no progress, fair is on hold or delayed, and good is scheme progressing on programme or ahead of programme.
Trends Forward targets for this measure are:
Actual Forward Targets
14/15 15/16 16/17 17/18 18/19 19/20 20/21
N/A Schemesdelivered
Schemes delivered
Schemesdelivered
Schemesdelivered
Schemesdelivered
Schemes delivered
Driver for Change / Improvement Action/Comment
The programme for delivery network improvements as a result of development will depend on development opportunities.
Measure Details
This indicator is measured annually. Scheme progress is reviewed annually in conjunction with the Development Control
team, and is assessed annually for the ISEG05 measure.
2017/18 – Schemes being progressed to support development growth.
Schemes to improve the highway network are progressing and indicator score is
assessed as Good.
28
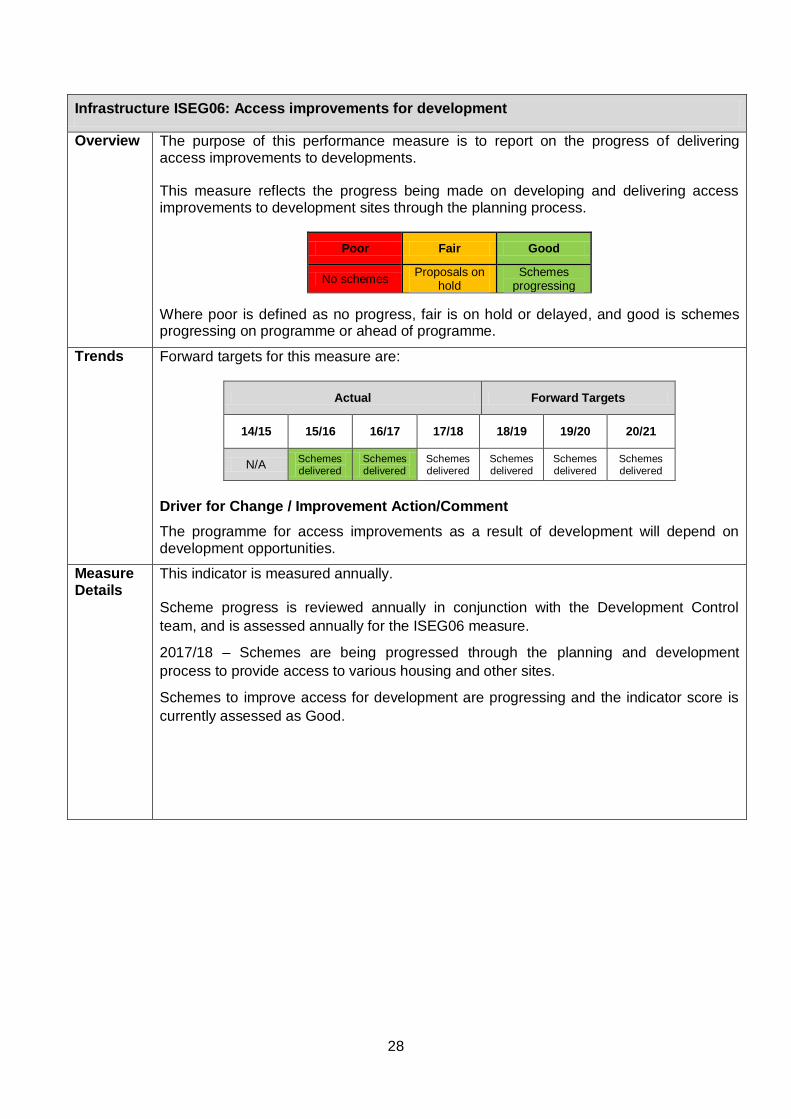
Infrastructure ISEG06: Access improvements for development
Overview The purpose of this performance measure is to report on the progress of delivering access improvements to developments.
This measure reflects the progress being made on developing and delivering access improvements to development sites through the planning process.
Poor Fair Good
No schemes Proposals on
hold Schemes
progressing
Where poor is defined as no progress, fair is on hold or delayed, and good is schemes progressing on programme or ahead of programme.
Trends Forward targets for this measure are:
Actual Forward Targets
14/15 15/16 16/17 17/18 18/19 19/20 20/21
N/A Schemesdelivered
Schemes delivered
Schemesdelivered
Schemesdelivered
Schemesdelivered
Schemes delivered
Driver for Change / Improvement Action/Comment
The programme for access improvements as a result of development will depend on development opportunities.
Measure Details
This indicator is measured annually. Scheme progress is reviewed annually in conjunction with the Development Control
team, and is assessed annually for the ISEG06 measure.
2017/18 – Schemes are being progressed through the planning and development
process to provide access to various housing and other sites.
Schemes to improve access for development are progressing and the indicator score is
currently assessed as Good.
29
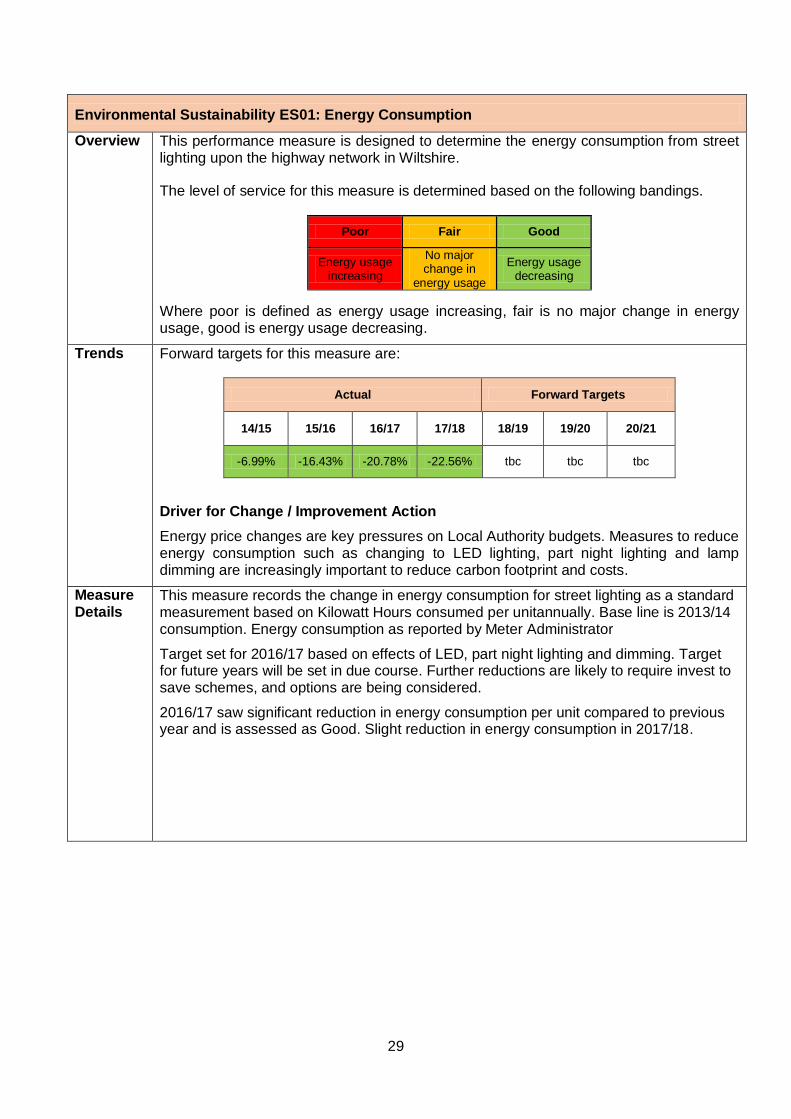
Environmental Sustainability ES01: Energy Consumption
Overview This performance measure is designed to determine the energy consumption from street lighting upon the highway network in Wiltshire.
The level of service for this measure is determined based on the following bandings.
Poor Fair Good
Energy usage increasing
No major change in
energy usage
Energy usage decreasing
Where poor is defined as energy usage increasing, fair is no major change in energy usage, good is energy usage decreasing.
Trends Forward targets for this measure are:
Actual Forward Targets
14/15 15/16 16/17 17/18 18/19 19/20 20/21
-6.99% -16.43% -20.78% -22.56% tbc tbc tbc
Driver for Change / Improvement Action
Energy price changes are key pressures on Local Authority budgets. Measures to reduce energy consumption such as changing to LED lighting, part night lighting and lamp dimming are increasingly important to reduce carbon footprint and costs.
Measure Details
This measure records the change in energy consumption for street lighting as a standard measurement based on Kilowatt Hours consumed per unitannually. Base line is 2013/14 consumption. Energy consumption as reported by Meter Administrator
Target set for 2016/17 based on effects of LED, part night lighting and dimming. Target for future years will be set in due course. Further reductions are likely to require invest to save schemes, and options are being considered.
2016/17 saw significant reduction in energy consumption per unit compared to previous year and is assessed as Good. Slight reduction in energy consumption in 2017/18.
30
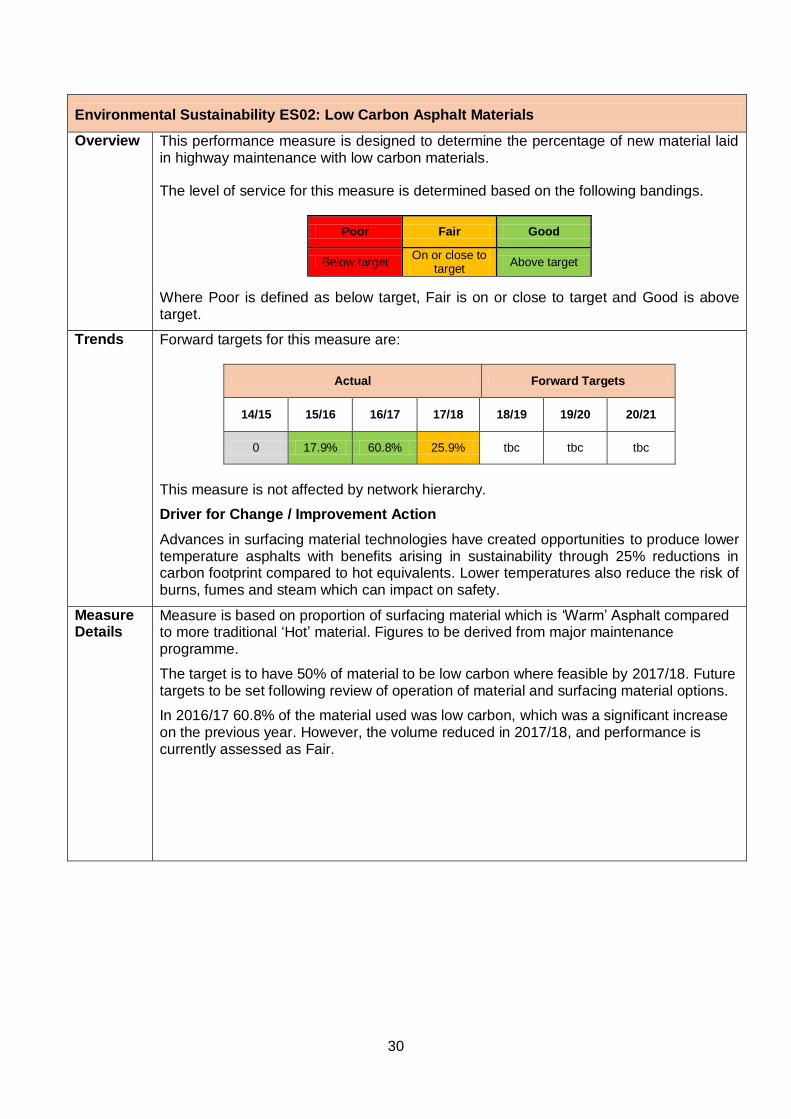
Environmental Sustainability ES02: Low Carbon Asphalt Materials
Overview This performance measure is designed to determine the percentage of new material laid in highway maintenance with low carbon materials.
The level of service for this measure is determined based on the following bandings.
Poor Fair Good
Below target On or close to
target Above target
Where Poor is defined as below target, Fair is on or close to target and Good is above target.
Trends Forward targets for this measure are:
Actual Forward Targets
14/15 15/16 16/17 17/18 18/19 19/20 20/21
0 17.9% 60.8% 25.9% tbc tbc tbc
This measure is not affected by network hierarchy.
Driver for Change / Improvement Action
Advances in surfacing material technologies have created opportunities to produce lower temperature asphalts with benefits arising in sustainability through 25% reductions in carbon footprint compared to hot equivalents. Lower temperatures also reduce the risk of burns, fumes and steam which can impact on safety.
Measure Details
Measure is based on proportion of surfacing material which is ‘Warm’ Asphalt compared to more traditional ‘Hot’ material. Figures to be derived from major maintenance programme.
The target is to have 50% of material to be low carbon where feasible by 2017/18. Future targets to be set following review of operation of material and surfacing material options.
In 2016/17 60.8% of the material used was low carbon, which was a significant increase on the previous year. However, the volume reduced in 2017/18, and performance is currently assessed as Fair.
31
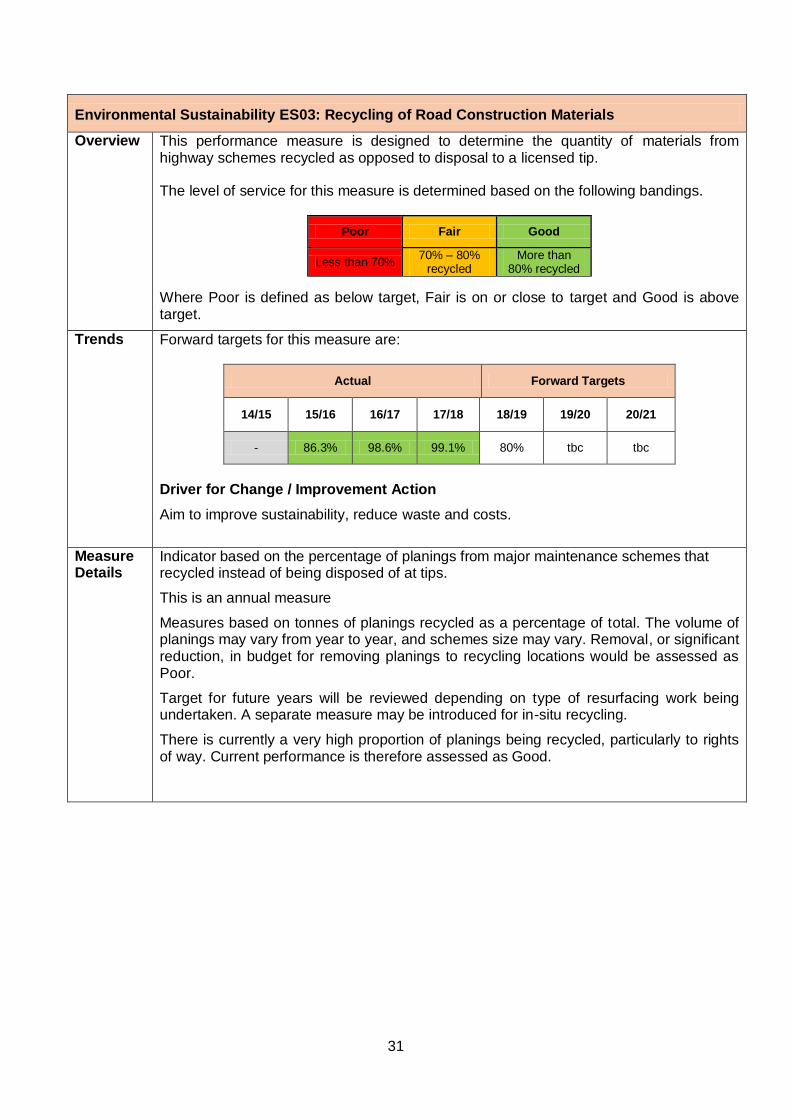
Environmental Sustainability ES03: Recycling of Road Construction Materials
Overview This performance measure is designed to determine the quantity of materials from highway schemes recycled as opposed to disposal to a licensed tip.
The level of service for this measure is determined based on the following bandings.
Poor Fair Good
Less than 70% 70% – 80%
recycled More than
80% recycled
Where Poor is defined as below target, Fair is on or close to target and Good is above target.
Trends Forward targets for this measure are:
Actual Forward Targets
14/15 15/16 16/17 17/18 18/19 19/20 20/21
- 86.3% 98.6% 99.1% 80% tbc tbc
Driver for Change / Improvement Action
Aim to improve sustainability, reduce waste and costs.
Measure Details
Indicator based on the percentage of planings from major maintenance schemes that recycled instead of being disposed of at tips.
This is an annual measure
Measures based on tonnes of planings recycled as a percentage of total. The volume of planings may vary from year to year, and schemes size may vary. Removal, or significant reduction, in budget for removing planings to recycling locations would be assessed as Poor.
Target for future years will be reviewed depending on type of resurfacing work being undertaken. A separate measure may be introduced for in-situ recycling.
There is currently a very high proportion of planings being recycled, particularly to rights of way. Current performance is therefore assessed as Good.
32
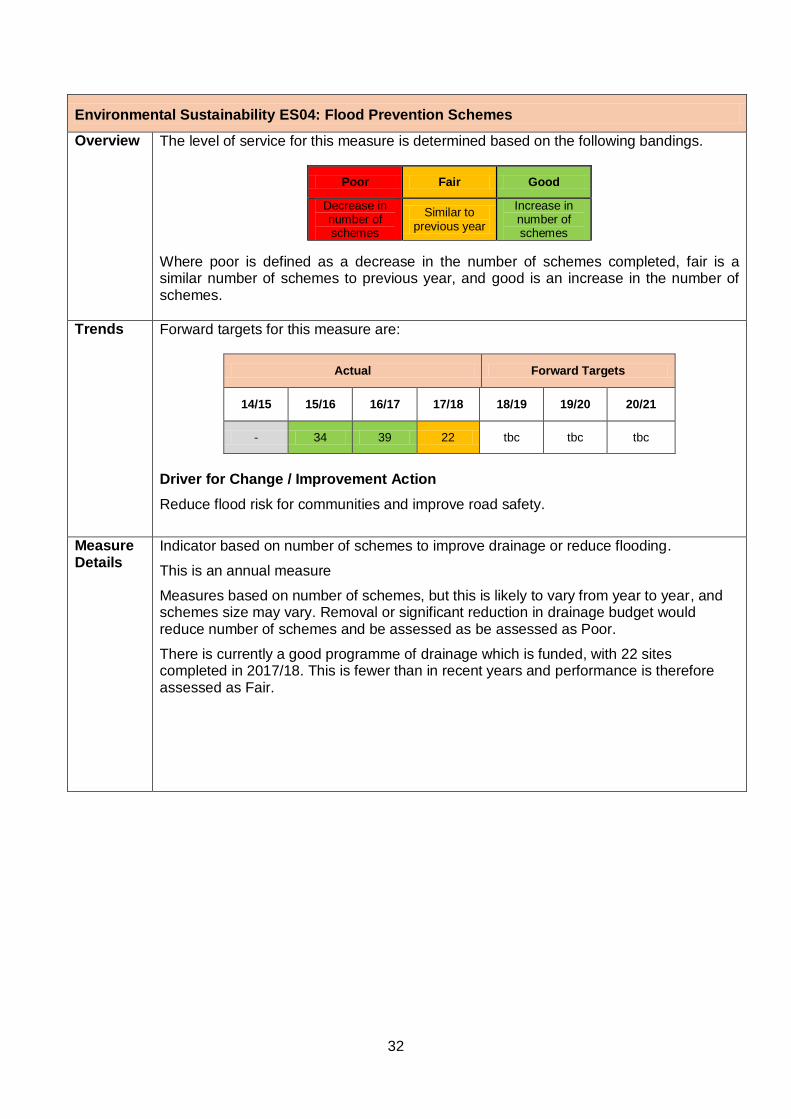
Environmental Sustainability ES04: Flood Prevention Schemes
Overview The level of service for this measure is determined based on the following bandings.
Poor Fair Good
Decrease in number of schemes
Similar to previous year
Increase in number of schemes
Where poor is defined as a decrease in the number of schemes completed, fair is a similar number of schemes to previous year, and good is an increase in the number of schemes.
Trends Forward targets for this measure are:
Actual Forward Targets
14/15 15/16 16/17 17/18 18/19 19/20 20/21
- 34 39 22 tbc tbc tbc
Driver for Change / Improvement Action
Reduce flood risk for communities and improve road safety.
Measure Details
Indicator based on number of schemes to improve drainage or reduce flooding.
This is an annual measure
Measures based on number of schemes, but this is likely to vary from year to year, and schemes size may vary. Removal or significant reduction in drainage budget would reduce number of schemes and be assessed as be assessed as Poor.
There is currently a good programme of drainage which is funded, with 22 sites completed in 2017/18. This is fewer than in recent years and performance is therefore assessed as Fair.
33
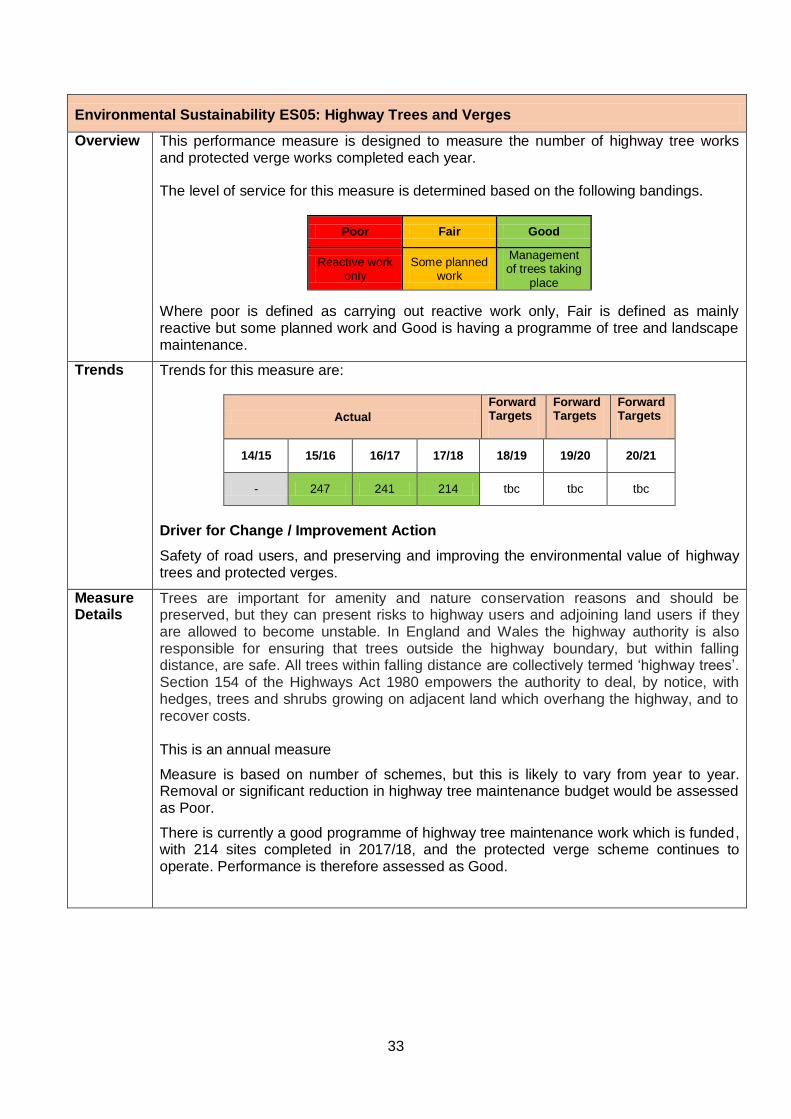
Environmental Sustainability ES05: Highway Trees and Verges
Overview This performance measure is designed to measure the number of highway tree works and protected verge works completed each year.
The level of service for this measure is determined based on the following bandings.
Poor Fair Good
Reactive work only
Some planned work
Management of trees taking
place
Where poor is defined as carrying out reactive work only, Fair is defined as mainly reactive but some planned work and Good is having a programme of tree and landscape maintenance.
Trends Trends for this measure are:
Actual
Forward Targets
Forward Targets
Forward Targets
14/15 15/16 16/17 17/18 18/19 19/20 20/21
- 247 241 214 tbc tbc tbc
Driver for Change / Improvement Action
Safety of road users, and preserving and improving the environmental value of highway trees and protected verges.
Measure Details
Trees are important for amenity and nature conservation reasons and should be preserved, but they can present risks to highway users and adjoining land users if they are allowed to become unstable. In England and Wales the highway authority is also responsible for ensuring that trees outside the highway boundary, but within falling distance, are safe. All trees within falling distance are collectively termed ‘highway trees’. Section 154 of the Highways Act 1980 empowers the authority to deal, by notice, with hedges, trees and shrubs growing on adjacent land which overhang the highway, and to recover costs. This is an annual measure
Measure is based on number of schemes, but this is likely to vary from year to year. Removal or significant reduction in highway tree maintenance budget would be assessed as Poor.
There is currently a good programme of highway tree maintenance work which is funded, with 214 sites completed in 2017/18, and the protected verge scheme continues to operate. Performance is therefore assessed as Good.
34
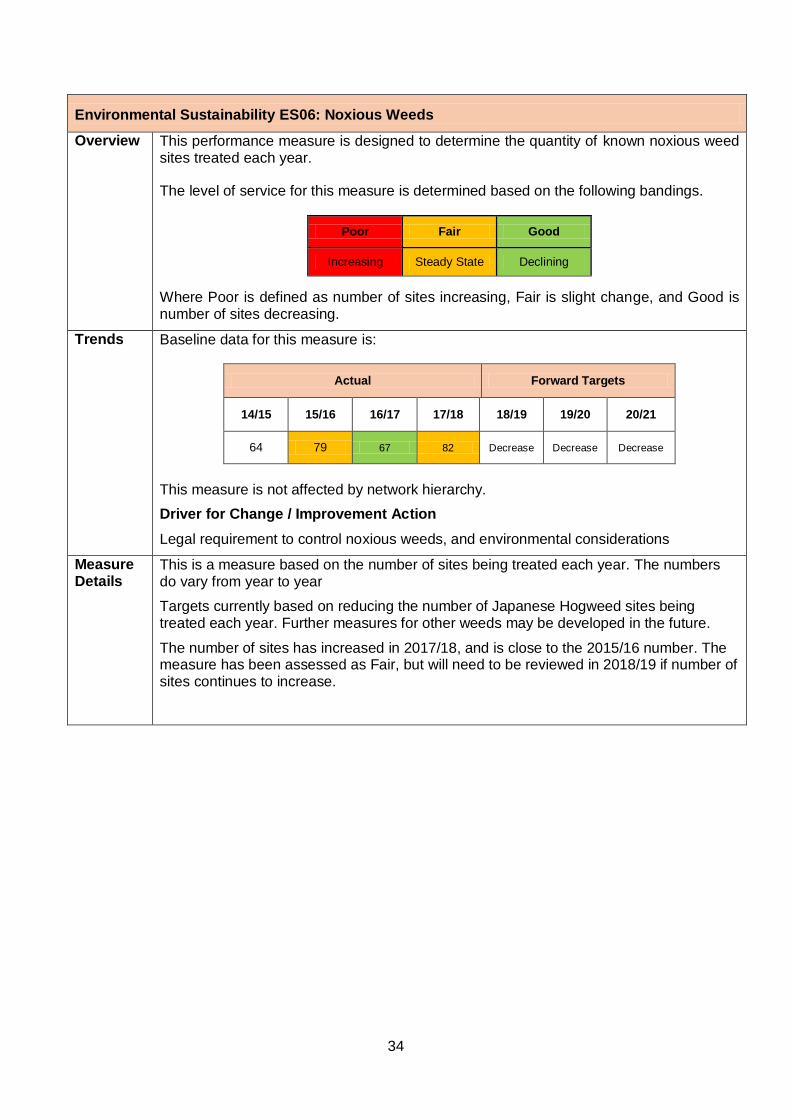
Environmental Sustainability ES06: Noxious Weeds
Overview This performance measure is designed to determine the quantity of known noxious weed sites treated each year.
The level of service for this measure is determined based on the following bandings.
Poor Fair Good
Increasing Steady State Declining
Where Poor is defined as number of sites increasing, Fair is slight change, and Good is number of sites decreasing.
Trends Baseline data for this measure is:
Actual Forward Targets
14/15 15/16 16/17 17/18 18/19 19/20 20/21
64 79 67 82 Decrease Decrease Decrease
This measure is not affected by network hierarchy.
Driver for Change / Improvement Action
Legal requirement to control noxious weeds, and environmental considerations
Measure Details
This is a measure based on the number of sites being treated each year. The numbers do vary from year to year
Targets currently based on reducing the number of Japanese Hogweed sites being treated each year. Further measures for other weeds may be developed in the future.
The number of sites has increased in 2017/18, and is close to the 2015/16 number. The measure has been assessed as Fair, but will need to be reviewed in 2018/19 if number of sites continues to increase.
35
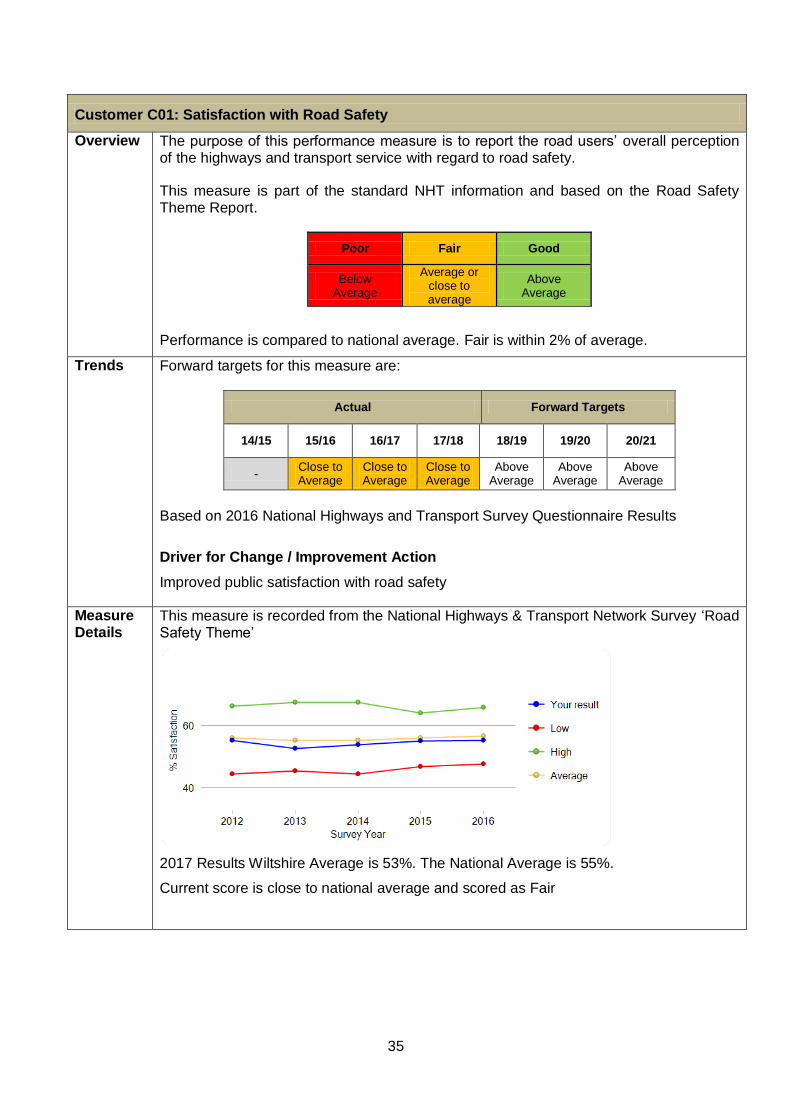
Customer C01: Satisfaction with Road Safety
Overview The purpose of this performance measure is to report the road users’ overall perception of the highways and transport service with regard to road safety.
This measure is part of the standard NHT information and based on the Road Safety Theme Report.
Poor Fair Good
Below Average
Average or close to average
Above Average
Performance is compared to national average. Fair is within 2% of average.
Trends Forward targets for this measure are:
Actual Forward Targets
14/15 15/16 16/17 17/18 18/19 19/20 20/21
- Close to Average
Close to Average
Close to Average
Above Average
Above Average
Above Average
Based on 2016 National Highways and Transport Survey Questionnaire Results
Driver for Change / Improvement Action
Improved public satisfaction with road safety
Measure Details
This measure is recorded from the National Highways & Transport Network Survey ‘Road Safety Theme’
2017 Results Wiltshire Average is 53%. The National Average is 55%.
Current score is close to national average and scored as Fair
36
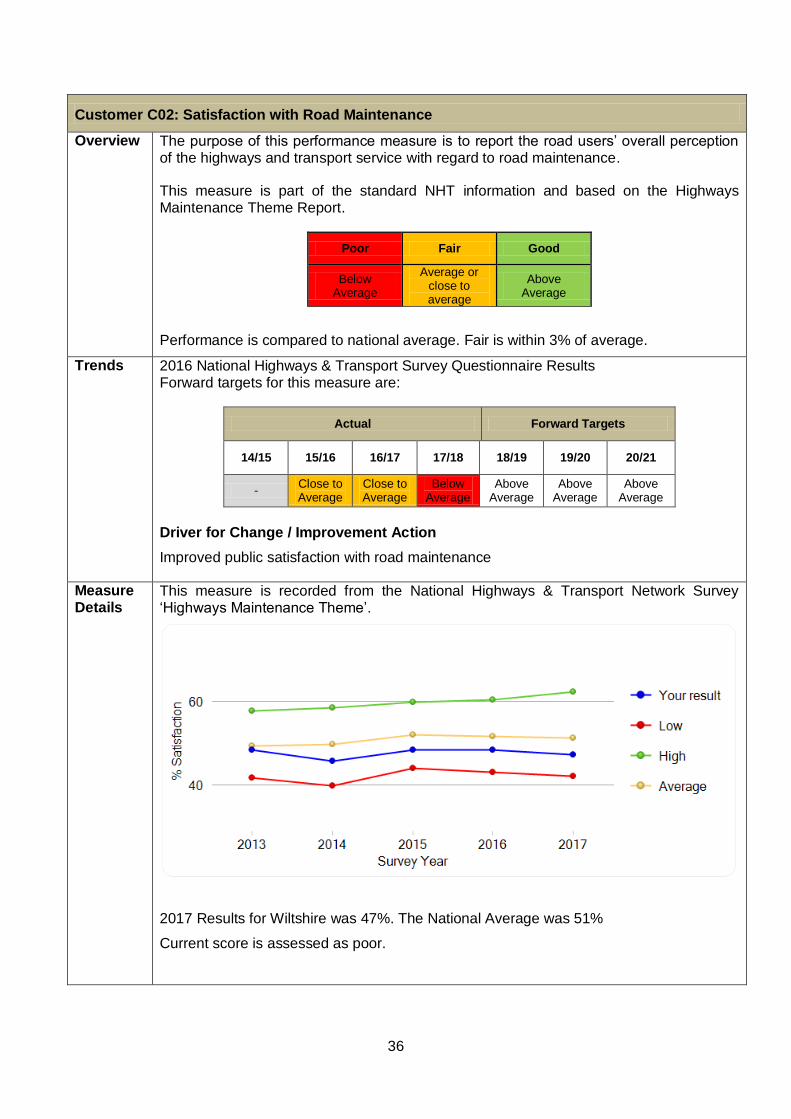
Customer C02: Satisfaction with Road Maintenance
Overview The purpose of this performance measure is to report the road users’ overall perception of the highways and transport service with regard to road maintenance.
This measure is part of the standard NHT information and based on the Highways Maintenance Theme Report.
Poor Fair Good
Below Average
Average or close to average
Above Average
Performance is compared to national average. Fair is within 3% of average.
Trends 2016 National Highways & Transport Survey Questionnaire Results Forward targets for this measure are:
Actual Forward Targets
14/15 15/16 16/17 17/18 18/19 19/20 20/21
- Close to Average
Close to Average
Below Average
Above Average
Above Average
Above Average
Driver for Change / Improvement Action
Improved public satisfaction with road maintenance
Measure Details
This measure is recorded from the National Highways & Transport Network Survey ‘Highways Maintenance Theme’.
2017 Results for Wiltshire was 47%. The National Average was 51%
Current score is assessed as poor.
37
Customer C03: Deals with potholes and damaged roads
Overview The purpose of this performance measure is to report the road users’ satisfaction with the way in which the Council deals with potholes and damaged roads.
This measure uses the standard NHT results.
Poor Fair Good
Below Average
Average or close to average
Above Average
Performance is compared to national average. Fair is within 2% of average.
Trends Based on National Highways & Transport Survey Questionnaire Results HMBI 13 comparison with County Councils
Actual Forward Targets
14/15 15/16 16/17 17/18 18/19 19/20 20/21
- Below
Average Close to average
Close to average
Above average
Above average
Above average
Driver for Change / Improvement Action
Measure Details
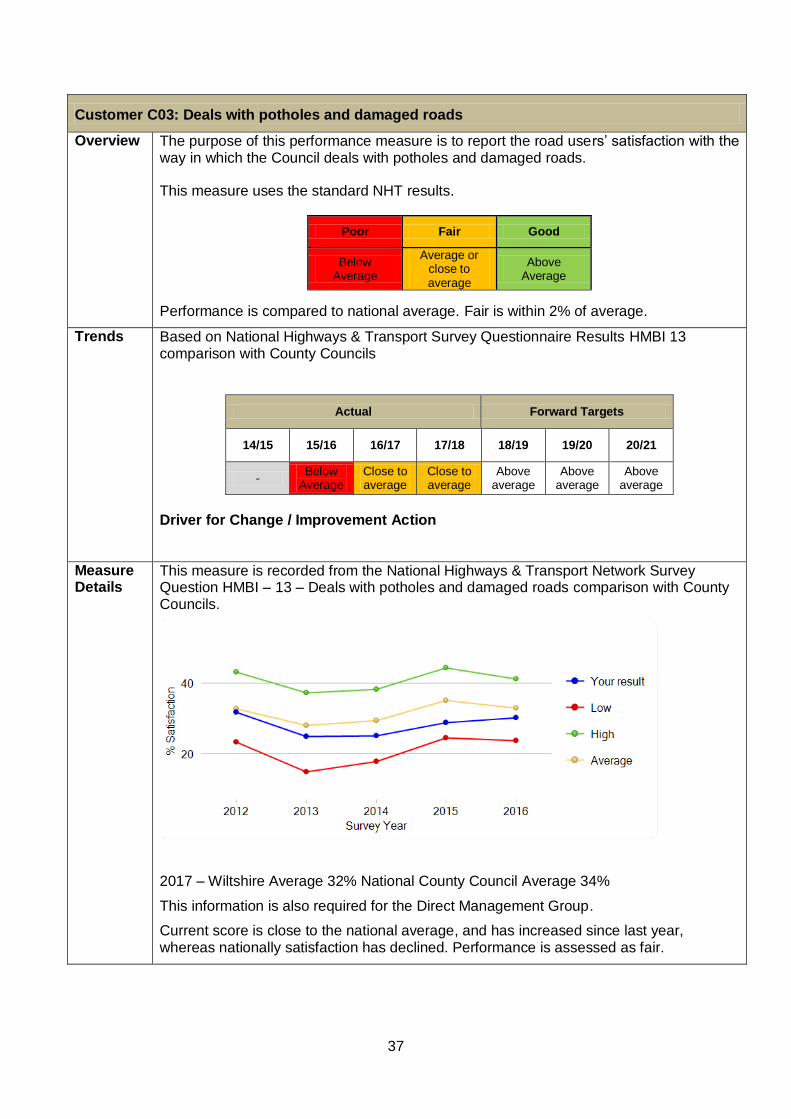
This measure is recorded from the National Highways & Transport Network Survey Question HMBI – 13 – Deals with potholes and damaged roads comparison with County Councils.
2017 – Wiltshire Average 32% National County Council Average 34%
This information is also required for the Direct Management Group.
Current score is close to the national average, and has increased since last year, whereas nationally satisfaction has declined. Performance is assessed as fair.
38
Customer C04: Satisfaction with Walking and Cycling
Overview The purpose of this performance measure is to report the road users’ satisfaction or dissatisfaction with the condition of cycle routes.
This measure is part of the standard NHT information and based on the Walking and Cycling Theme Report.
Poor Fair Good
Below Average
Average or close to average
Above Average
Performance is compared to national average. Fair is within 2% of average.
Trends Forward targets for this measure are:
Actual Forward Targets
14/15 15/16 16/17 17/18 18/19 19/20 20/21
- Close to Average
Close to Average
Close to Average
Above Average
Above Average
Above Average
Based on National Highways & Transport Survey Questionnaire Results
Driver for Change / Improvement Action
Improved public satisfaction with road maintenance
Measure Details
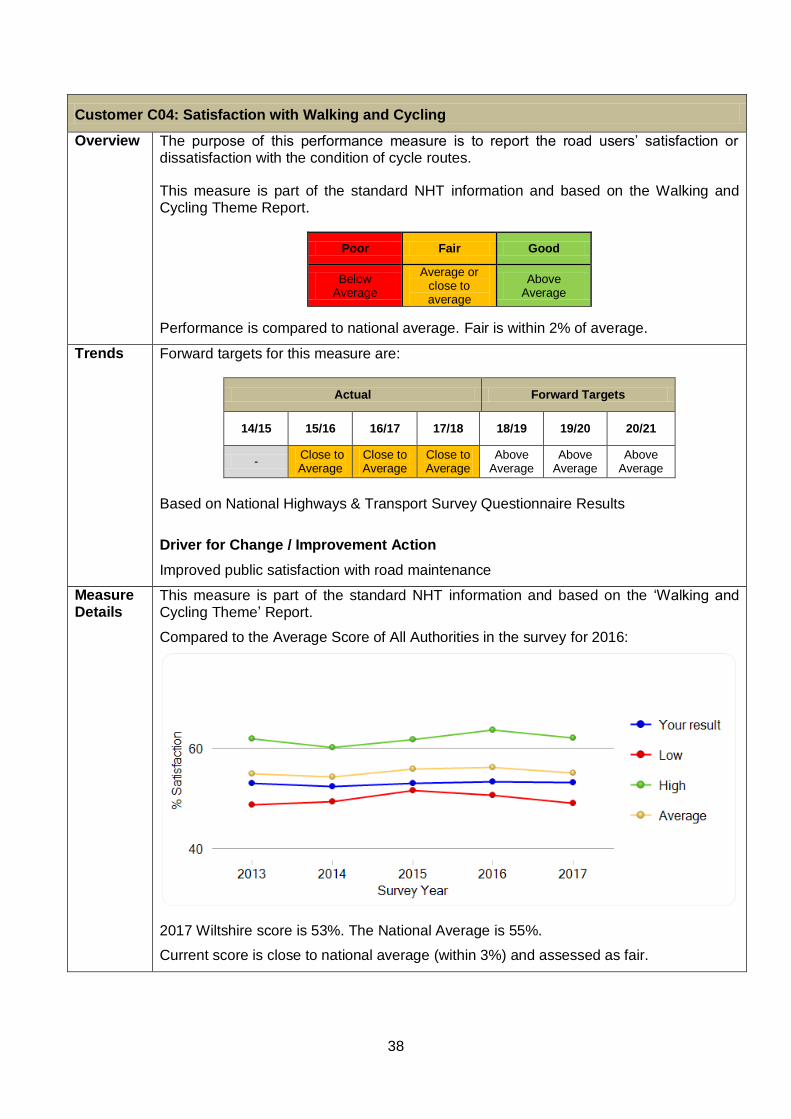
This measure is part of the standard NHT information and based on the ‘Walking and Cycling Theme’ Report.
Compared to the Average Score of All Authorities in the survey for 2016:
2017 Wiltshire score is 53%. The National Average is 55%.
Current score is close to national average (within 3%) and assessed as fair.
39
Customer C05: Satisfaction with Tackling Congestion
Overview The purpose of this performance measure is to report the road users’ satisfaction or dissatisfaction with roadworks upon the Councils’ highway network.
This measure uses the standard NHT results.
Poor Fair Good
Below Average
Average or close to average
Above Average
Performance is compared to national average. Fair is within 2% of average.
Trends This measure is based on National Highways & Transport Survey Questionnaire Results for Tackling Congestion Theme. Forward targets for this measure are:
Actual Forward Targets
14/15 15/16 16/17 17/18 18/19 19/20 20/21
- Average Average Average Above
Average Above
Average Above
Average
Driver for Change / Improvement Action
Improved public satisfaction with road maintenance
Measure Details
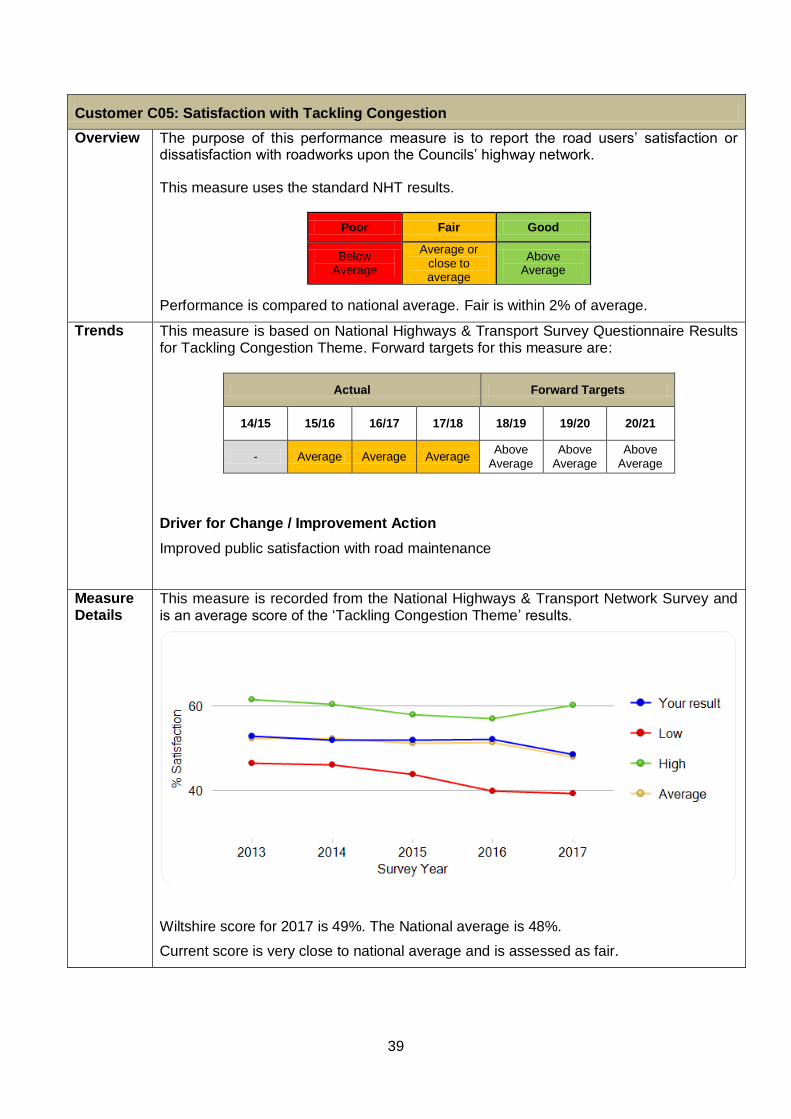
This measure is recorded from the National Highways & Transport Network Survey and is an average score of the ‘Tackling Congestion Theme’ results.
Wiltshire score for 2017 is 49%. The National average is 48%.
Current score is very close to national average and is assessed as fair.
40
Customer C06: Satisfaction with Managing Roadworks
Overview The purpose of this performance measure is to report the road users’ satisfaction with the way in which the Council manages roadworks on the highway network.
This measure is part of the Road User Survey and therefore uses the standard NHT bandings.
Poor Fair Good
Below Average
Average or close to average
Above Average
Performance is compared to national average. Fair is within 2% of average.
Trends Based on National Highways & Transport Survey Questionnaire Results for Question TCBI 07 – The management of roadworks overall. Forward targets for this measure are:
Actual Forward Targets
14/15 15/16 16/17 17/18 18/19 19/20 20/21
- Above
Average Above
Average Average
Above Average
Above Average
Above Average
Driver for Change / Improvement Action
Improved public satisfaction with management of roadworks
Measure Details
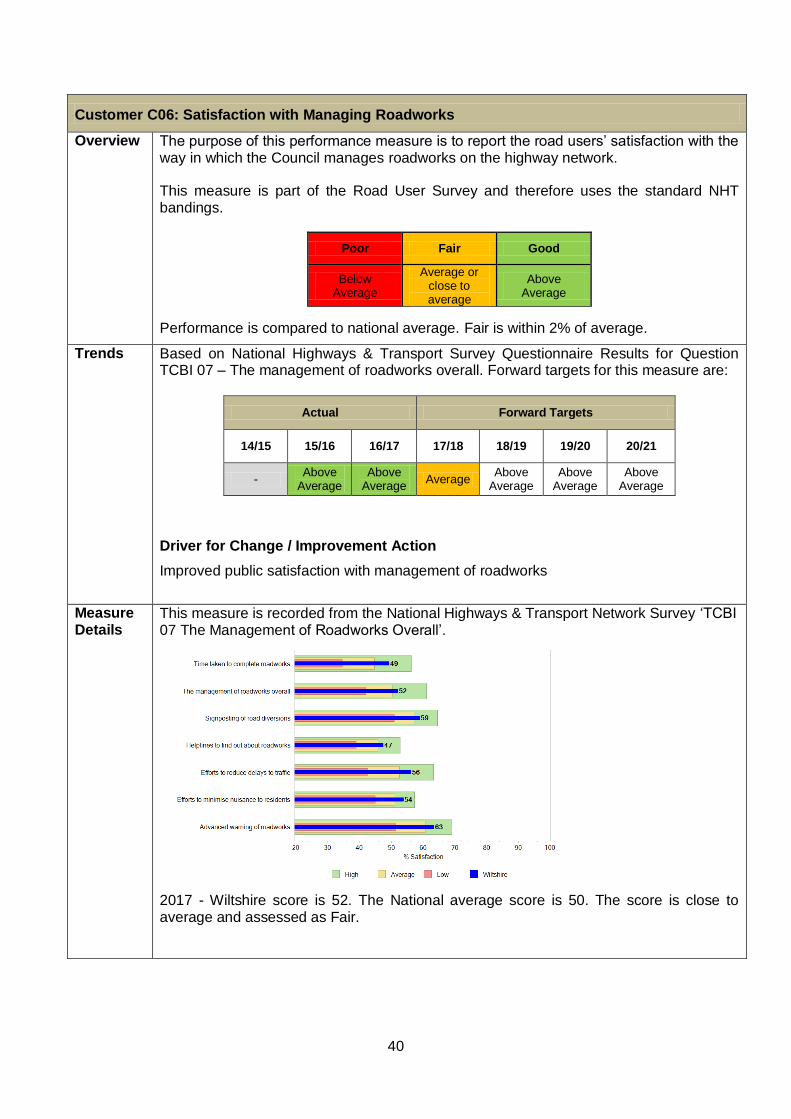
This measure is recorded from the National Highways & Transport Network Survey ‘TCBI 07 The Management of Roadworks Overall’.
2017 - Wiltshire score is 52. The National average score is 50. The score is close to average and assessed as Fair.