willing to pay: charter schools' impact on georgia property values
TRANSCRIPT
Willing to Pay: Charter
Schools’ Impact on Georgia
Property Values
Carlianne Patrick
August 18, 2015

Willing to Pay: Charter Schools’ Impact on Georgia Property Values frc.gsu.edu
ACKNOWLEDGMENTS I would like to thank Elena Andreyeva for her invaluable research assistance, as well as the Metro
Atlanta Regional Commission, the executive director of Atlanta Neighborhood Charter Schools Matt
Underwood, and Principal Brent McBride of Kingsley Charter Elementary School for their assistance in
obtaining data and background information.
Willing to Pay: Charter Schools’ Impact on Georgia Property Values frc.gsu.edu
Table of Contents
I. Introduction 1
II. Charter Schools in Georgia 2
III. Metro-Atlanta Charter School Priority Attendance Zones 5
IV. Valuing Priority One Attendance Zones 14
V. Conclusions 19
VI. References 19
About the Author 20
About the Fiscal Research Center 20
1
Willing to Pay: Charter Schools’ Impact on Georgia Property Values frc.gsu.edu
Introduction
The number of public charter schools is on the rise – both in Georgia and the United States. According
to the National Alliance for Public Charter Schools, there were more than 6,000 public charter schools
operating in the United States during the 2012-2013 school year compared to 1,500 in 1999-2000.
Georgia has followed the national trend, increasing the number of public charter schools from 18 in
1999-2000 to more than 100 in 2012-2013.1 Advocates praise charter schools for providing parents with
school choice and schools with flexibility. School choice proponents also argue that charter schools
improve local public school performance through competition. Despite their growth, charter schools
are not without their critics, who argue that public charter schools divert resources from traditional
public schools without necessarily achieving better student outcomes. Opponents in Georgia challenged
the 2009 creation of a state authorizing commission in the Supreme Court of Georgia and won, only to
see it pass in a 2012 ballot referendum. The debate in Georgia will likely continue as advocates push for
the expansion of charter school opportunities.
While there is an extensive literature on charter school achievement outcomes, relatively little is known
about how the general public values these schools. Charter schools’ effects on local property values can
help reveal this. If households value access to charter schools, then demand for homes in locations that
provide additional access to charter schools will rise. Increased demand in the area raises the price for
residences in the area. Georgia presents a unique opportunity for analysis.2 Unlike most charter schools
in the United States that have diffuse attendance areas, 13 metro-Atlanta charter schools have priority
admission zones within their designated attendance zones. This report explores this unique feature of
metro-Atlanta charter schools to identify the change in single-family residential transaction values
associated with conversion and start-up charter schools. The results suggest households are willing to
pay a premium for the increased probability of admission to charter schools in priority one admissions
zones. Estimates range from 7-13 percent, with an average increase in sales prices of approximately 10
percent.
This report begins by discussing the features and structure of charter schools in Georgia. The following
section describes the priority one attendance zones in detail. The estimated difference in single-family
residential transaction values on either side of priority admission zone borders are presented in the next
section. The final section contains concluding remarks.
1 Counting conversion and start-up charter schools as well schools in charter systems, there were over 310 charter schools in Georgia during 2012-2013. The National Alliance for Public Charter School statistics do not include schools in a charter system as they are substantially different than the conversion and start-up charter schools generally referred to as charter schools.
2 Georgia charter schools have received little rigorous study, with Henig and MacDonald’s (2002) study of Georgia charter school location choices being the only published research that I could find. The literature on charter school capitalization into property values is also relatively nascent. Although Imberman, Naretta, and O’Rourke (2014) claim theirs is the first to study the issue, two other papers also consider the effect of charter schools on property values: Horowitz et al. (2009) and Shapiro and Hassett (2013). None analyze charter schools in Georgia or charter schools with well-defined priority enrollment zones.
2
Willing to Pay: Charter Schools’ Impact on Georgia Property Values frc.gsu.edu
Charter Schools in Georgia
Charter schools are public schools with two primary features that distinguish them from traditional
public schools. The first feature is choice. Parents usually choose whether to send their student to a
charter school.3 The second is increased flexibility in exchange for increased accountability. Charter
schools receive flexibility with regards to some federal and state regulations, allowing them both
operational and programmatic flexibility. For example, charter schools may have longer school days,
require summer school, or use different instructional methods than traditional public schools. Charter
students must take the same standardized tests as traditional public school students. Student outcomes,
finances, and operations are reviewed annually by the charter school’s governing body and the
authorizing agency. Charter school contracts, or charters, may be revoked if the school does not meet
performance standards as determined by the authorizing agency.
According to the 2012-2013 Georgia Charter School Annual Report, there were 310 charter schools
operating in Georgia during the 2012-2013 school year. These schools may be divided into three broad
types (Georgia Department of Education 2013; Types of Charters):
1) Conversion Charter School: A charter school that previously existed as a local public school. The
school converted to a charter after application to an authorizing agency. A majority of the faculty
and instructional staff members and a majority of parents or guardians of students enrolled in the
petitioning school must vote by secret ballot to apply for a charter. Conversion charter schools
have an independent governing board. Generally, entrance into conversion charter schools is
guaranteed for students residing within the school attendance boundaries determined by the local
school board. If additional capacity remains at the school, then the charter determines the
attendance zone from which students may apply for enrollment into the charter.
2) Start-Up Charter School: As the name implies, start-up charter schools are schools that did not
exist prior to being authorized as a charter school. Start-up charter schools are created by a
petition brought forth by individuals, private organizations, or a state or local public entity. Start-up
charters have an independent governing board to which they are accountable as well as the
authorizing agency. Start-up charter schools may determine the attendance areas from which the
school will draw students. As discussed in more detail below, they may also outline priority
attendance zones. In Georgia, start-up charters may be further divided into two types based upon
the authorizing agency:
a) Locally-Approved Start-Up: A charter school whose petition was approved by a local board of
education. A locally-approved start-up operates under the terms of a three-way contract – a
charter among the charter petitioner, the local district, and the Georgia Board of Education.
b) State Charter School: A charter school whose petition was approved by the State Charter
Schools Commission of Georgia (SCSC). Start charter schools are independent schools, or local
education agencies, that operate under terms of a charter between the charter petitioner and
3 As discussed below, conversion charters and charter systems have a different element of choice than start-up charters in which all attendees choose enrollment over their traditional public school option. Conversion charters and charter systems replace the local, traditional public school or school system.
3
Willing to Pay: Charter Schools’ Impact on Georgia Property Values frc.gsu.edu
the SCSC. The SCSC accepts applications in cases where a petition was denied by a local board
of education or for schools that will draw students from five or more counties.
3) Charter System: A local school district that operates under a charter between the district as the
charter petitioner and the Georgia Board of Education. Schools in a charter system are different from
conversion and start-up charter schools. The district, not the school and school governing board,
have the contract with the state. The locally-elected school district board retains oversight and
management responsibilities, though some responsibilities may be allocated to the local schools. For
example, the local board of education’s responsibilities for hiring school staff and maintaining
facilities continue.
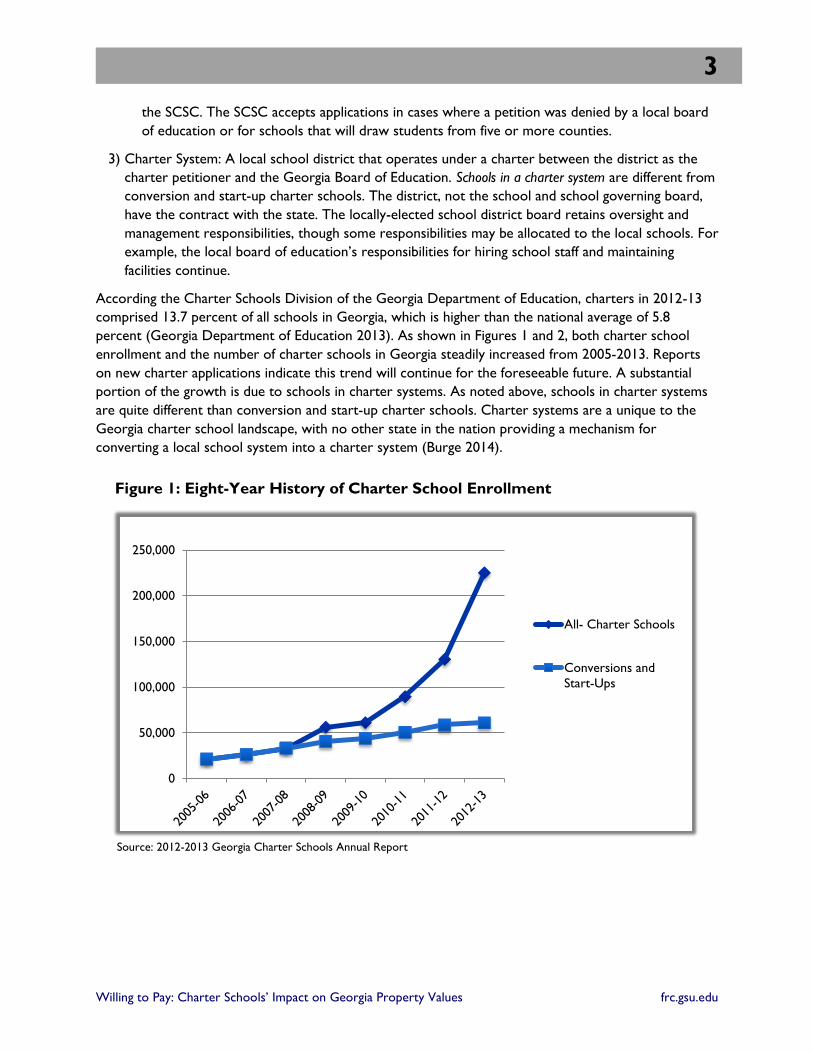
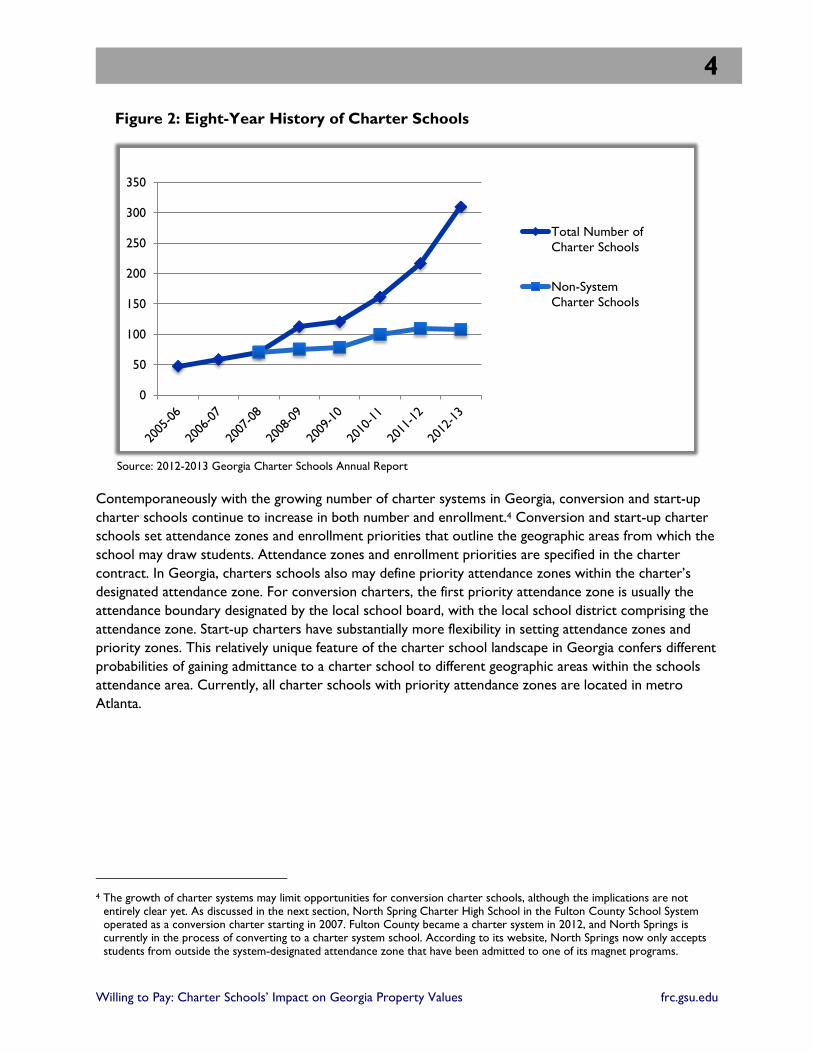
According the Charter Schools Division of the Georgia Department of Education, charters in 2012-13
comprised 13.7 percent of all schools in Georgia, which is higher than the national average of 5.8
percent (Georgia Department of Education 2013). As shown in Figures 1 and 2, both charter school
enrollment and the number of charter schools in Georgia steadily increased from 2005-2013. Reports
on new charter applications indicate this trend will continue for the foreseeable future. A substantial
portion of the growth is due to schools in charter systems. As noted above, schools in charter systems
are quite different than conversion and start-up charter schools. Charter systems are a unique to the
Georgia charter school landscape, with no other state in the nation providing a mechanism for
converting a local school system into a charter system (Burge 2014).
Figure 1: Eight-Year History of Charter School Enrollment
Source: 2012-2013 Georgia Charter Schools Annual Report
0
50,000
100,000
150,000
200,000
250,000
All- Charter Schools
Conversions and
Start-Ups
4
Willing to Pay: Charter Schools’ Impact on Georgia Property Values frc.gsu.edu
Figure 2: Eight-Year History of Charter Schools
Source: 2012-2013 Georgia Charter Schools Annual Report
Contemporaneously with the growing number of charter systems in Georgia, conversion and start-up
charter schools continue to increase in both number and enrollment.4 Conversion and start-up charter
schools set attendance zones and enrollment priorities that outline the geographic areas from which the
school may draw students. Attendance zones and enrollment priorities are specified in the charter
contract. In Georgia, charters schools also may define priority attendance zones within the charter’s
designated attendance zone. For conversion charters, the first priority attendance zone is usually the
attendance boundary designated by the local school board, with the local school district comprising the
attendance zone. Start-up charters have substantially more flexibility in setting attendance zones and
priority zones. This relatively unique feature of the charter school landscape in Georgia confers different
probabilities of gaining admittance to a charter school to different geographic areas within the schools
attendance area. Currently, all charter schools with priority attendance zones are located in metro
Atlanta.
4 The growth of charter systems may limit opportunities for conversion charter schools, although the implications are not
entirely clear yet. As discussed in the next section, North Spring Charter High School in the Fulton County School System operated as a conversion charter starting in 2007. Fulton County became a charter system in 2012, and North Springs is currently in the process of converting to a charter system school. According to its website, North Springs now only accepts students from outside the system-designated attendance zone that have been admitted to one of its magnet programs.
0
50
100
150
200
250
300
350
Total Number of
Charter Schools
Non-System
Charter Schools
5
Willing to Pay: Charter Schools’ Impact on Georgia Property Values frc.gsu.edu
Metro-Atlanta Charter School Priority Attendance Zones
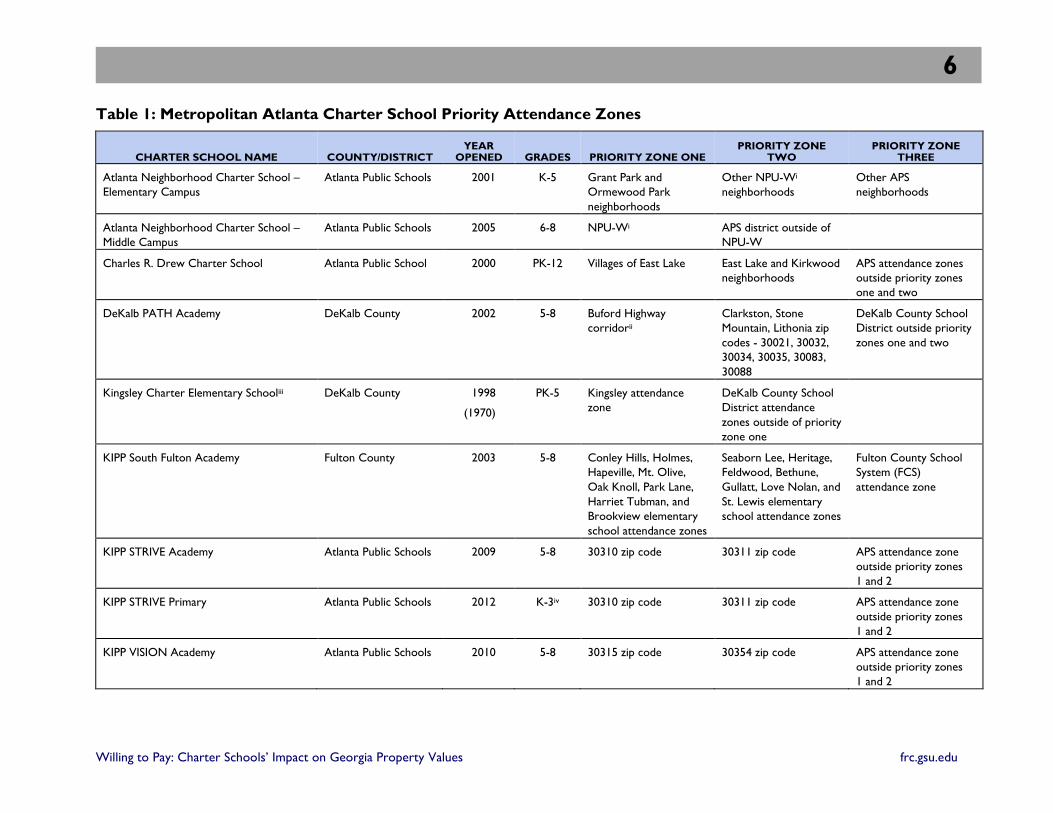
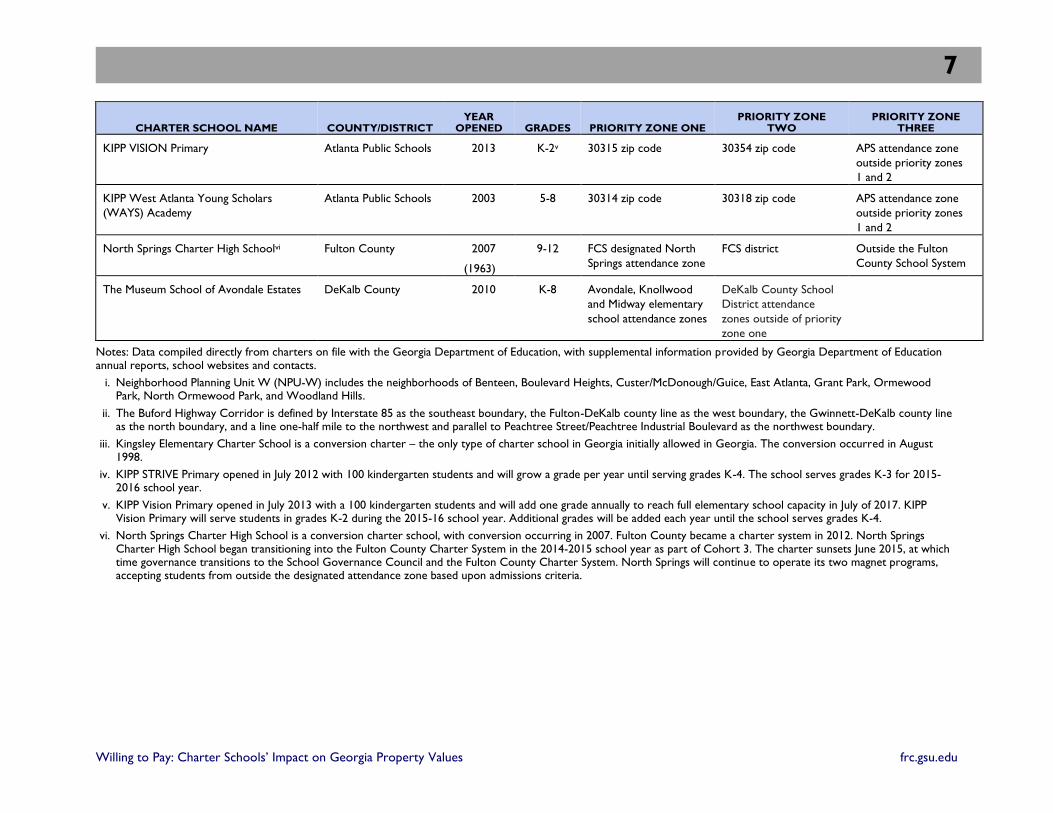
Table 1 provides details on the 13 metro-Atlanta charter schools with priority attendance zones,
including the school district in which their attendance zone(s) lie, year opened, grades served, and
priority attendance zones. The schools are all located within one of three metro-Atlanta school districts
– Atlanta Public Schools, Fulton County School System, or DeKalb County School District. Two are
conversion charter schools whose priority one zones are the local school board designated attendance
areas – Kingsley Charter Elementary School and North Springs Charter High School.5 Parents and
teachers at these conversion charters petitioned for charter status. The remaining charter schools are
start-ups whose petitioners set the attendance zone and priority zones during the charter application
process. The Atlanta Neighborhood Charter Schools, Charles R. Drew Charter School, and The
Museum School of Avondale Estates were created through local parent-driven initiatives. KIPP is a
nationwide charter school organization that worked with local parents to petition for its metro-Atlanta
charters.
5 There are number of other conversion charter schools in the metro-Atlanta area. These other conversion charters are not
included here because their charters do not designate priority enrollment zones within their designated attendance areas.
6
Willing to Pay: Charter Schools’ Impact on Georgia Property Values frc.gsu.edu
Table 1: Metropolitan Atlanta Charter School Priority Attendance Zones
CHARTER SCHOOL NAME COUNTY/DISTRICT YEAR
OPENED GRADES PRIORITY ZONE ONE PRIORITY ZONE
TWO PRIORITY ZONE
THREE
Atlanta Neighborhood Charter School –
Elementary Campus
Atlanta Public Schools 2001 K-5 Grant Park and
Ormewood Park
neighborhoods
Other NPU-Wi
neighborhoods
Other APS
neighborhoods
Atlanta Neighborhood Charter School –
Middle Campus
Atlanta Public Schools 2005 6-8 NPU-Wi APS district outside of
NPU-W
Charles R. Drew Charter School Atlanta Public School 2000 PK-12 Villages of East Lake East Lake and Kirkwood
neighborhoods
APS attendance zones
outside priority zones
one and two
DeKalb PATH Academy DeKalb County 2002 5-8 Buford Highway
corridorii
Clarkston, Stone
Mountain, Lithonia zip
codes - 30021, 30032,
30034, 30035, 30083,
30088
DeKalb County School
District outside priority
zones one and two
Kingsley Charter Elementary Schooliii DeKalb County 1998
(1970)
PK-5 Kingsley attendance
zone
DeKalb County School
District attendance
zones outside of priority
zone one
KIPP South Fulton Academy Fulton County 2003 5-8 Conley Hills, Holmes,
Hapeville, Mt. Olive,
Oak Knoll, Park Lane,
Harriet Tubman, and
Brookview elementary
school attendance zones
Seaborn Lee, Heritage,
Feldwood, Bethune,
Gullatt, Love Nolan, and
St. Lewis elementary
school attendance zones
Fulton County School
System (FCS)
attendance zone
KIPP STRIVE Academy Atlanta Public Schools 2009 5-8 30310 zip code 30311 zip code APS attendance zone
outside priority zones
1 and 2
KIPP STRIVE Primary Atlanta Public Schools 2012 K-3iv 30310 zip code 30311 zip code APS attendance zone
outside priority zones
1 and 2
KIPP VISION Academy Atlanta Public Schools 2010 5-8 30315 zip code 30354 zip code APS attendance zone
outside priority zones
1 and 2
7
Willing to Pay: Charter Schools’ Impact on Georgia Property Values frc.gsu.edu
CHARTER SCHOOL NAME COUNTY/DISTRICT YEAR
OPENED GRADES PRIORITY ZONE ONE PRIORITY ZONE
TWO PRIORITY ZONE
THREE
KIPP VISION Primary Atlanta Public Schools 2013 K-2v 30315 zip code 30354 zip code APS attendance zone
outside priority zones
1 and 2
KIPP West Atlanta Young Scholars
(WAYS) Academy
Atlanta Public Schools 2003 5-8 30314 zip code 30318 zip code APS attendance zone
outside priority zones
1 and 2
North Springs Charter High Schoolvi Fulton County 2007
(1963)
9-12 FCS designated North
Springs attendance zone
FCS district Outside the Fulton
County School System
The Museum School of Avondale Estates DeKalb County 2010 K-8 Avondale, Knollwood
and Midway elementary
school attendance zones
DeKalb County School
District attendance
zones outside of priority
zone one
Notes: Data compiled directly from charters on file with the Georgia Department of Education, with supplemental information provided by Georgia Department of Education annual reports, school websites and contacts.
i. Neighborhood Planning Unit W (NPU-W) includes the neighborhoods of Benteen, Boulevard Heights, Custer/McDonough/Guice, East Atlanta, Grant Park, Ormewood Park, North Ormewood Park, and Woodland Hills.
ii. The Buford Highway Corridor is defined by Interstate 85 as the southeast boundary, the Fulton-DeKalb county line as the west boundary, the Gwinnett-DeKalb county line as the north boundary, and a line one-half mile to the northwest and parallel to Peachtree Street/Peachtree Industrial Boulevard as the northwest boundary.
iii. Kingsley Elementary Charter School is a conversion charter – the only type of charter school in Georgia initially allowed in Georgia. The conversion occurred in August 1998.
iv. KIPP STRIVE Primary opened in July 2012 with 100 kindergarten students and will grow a grade per year until serving grades K-4. The school serves grades K-3 for 2015-2016 school year.
v. KIPP Vision Primary opened in July 2013 with a 100 kindergarten students and will add one grade annually to reach full elementary school capacity in July of 2017. KIPP Vision Primary will serve students in grades K-2 during the 2015-16 school year. Additional grades will be added each year until the school serves grades K-4.
vi. North Springs Charter High School is a conversion charter school, with conversion occurring in 2007. Fulton County became a charter system in 2012. North Springs Charter High School began transitioning into the Fulton County Charter System in the 2014-2015 school year as part of Cohort 3. The charter sunsets June 2015, at which time governance transitions to the School Governance Council and the Fulton County Charter System. North Springs will continue to operate its two magnet programs, accepting students from outside the designated attendance zone based upon admissions criteria.
8
Willing to Pay: Charter Schools’ Impact on Georgia Property Values frc.gsu.edu
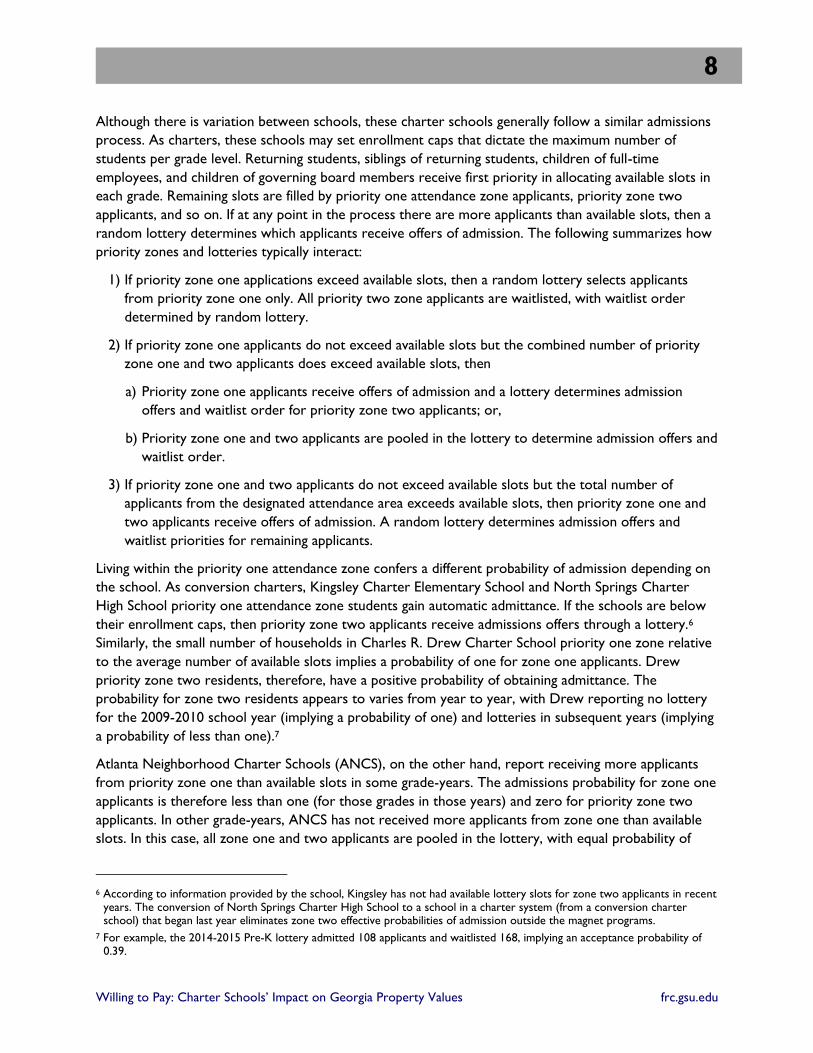
Although there is variation between schools, these charter schools generally follow a similar admissions
process. As charters, these schools may set enrollment caps that dictate the maximum number of
students per grade level. Returning students, siblings of returning students, children of full-time
employees, and children of governing board members receive first priority in allocating available slots in
each grade. Remaining slots are filled by priority one attendance zone applicants, priority zone two
applicants, and so on. If at any point in the process there are more applicants than available slots, then a
random lottery determines which applicants receive offers of admission. The following summarizes how
priority zones and lotteries typically interact:
1) If priority zone one applications exceed available slots, then a random lottery selects applicants
from priority zone one only. All priority two zone applicants are waitlisted, with waitlist order
determined by random lottery.
2) If priority zone one applicants do not exceed available slots but the combined number of priority
zone one and two applicants does exceed available slots, then
a) Priority zone one applicants receive offers of admission and a lottery determines admission
offers and waitlist order for priority zone two applicants; or,
b) Priority zone one and two applicants are pooled in the lottery to determine admission offers and
waitlist order.
3) If priority zone one and two applicants do not exceed available slots but the total number of
applicants from the designated attendance area exceeds available slots, then priority zone one and
two applicants receive offers of admission. A random lottery determines admission offers and
waitlist priorities for remaining applicants.
Living within the priority one attendance zone confers a different probability of admission depending on
the school. As conversion charters, Kingsley Charter Elementary School and North Springs Charter
High School priority one attendance zone students gain automatic admittance. If the schools are below
their enrollment caps, then priority zone two applicants receive admissions offers through a lottery.6
Similarly, the small number of households in Charles R. Drew Charter School priority one zone relative
to the average number of available slots implies a probability of one for zone one applicants. Drew
priority zone two residents, therefore, have a positive probability of obtaining admittance. The
probability for zone two residents appears to varies from year to year, with Drew reporting no lottery
for the 2009-2010 school year (implying a probability of one) and lotteries in subsequent years (implying
a probability of less than one).7
Atlanta Neighborhood Charter Schools (ANCS), on the other hand, report receiving more applicants
from priority zone one than available slots in some grade-years. The admissions probability for zone one
applicants is therefore less than one (for those grades in those years) and zero for priority zone two
applicants. In other grade-years, ANCS has not received more applicants from zone one than available
slots. In this case, all zone one and two applicants are pooled in the lottery, with equal probability of
6 According to information provided by the school, Kingsley has not had available lottery slots for zone two applicants in recent
years. The conversion of North Springs Charter High School to a school in a charter system (from a conversion charter school) that began last year eliminates zone two effective probabilities of admission outside the magnet programs.
7 For example, the 2014-2015 Pre-K lottery admitted 108 applicants and waitlisted 168, implying an acceptance probability of 0.39.
9
Willing to Pay: Charter Schools’ Impact on Georgia Property Values frc.gsu.edu
being chosen. Parents cannot know a priori whether there will be more applicants for their student’s
grade level from zone one than available slots. Thus, the expected probability of admission for ANCS
zone one applicants is higher than zone two, but still less than one.
Table 1 reveals that start-up charter priority attendance zones do not necessarily align with local school
attendance boundaries. For example, the neighborhoods of Grant Park and Ormewood Park comprise
the highest priority zone for the Atlanta Neighborhood Charter School Elementary Campus, while the
30310 zip code is the priority one zone for KIPP STRIVE Academy. Figure 3 maps priority one
attendance zones for each of the charter schools listed in Table 1.
10
Willing to Pay: Charter Schools’ Impact on Georgia Property Values frc.gsu.edu
Figure 3: Metro-Atlanta Charter School Priority 1 Attendance Zones
Atlanta
Sandy Springs
Smyrna
Marietta
East Point
Roswell
Dunwoody
Brookhaven
Peachtree Corners
College Park
Forest Park
Norcross
Johns Creek
Decatur
Chamblee
Doraville
Hapeville
Lake City
Union City
Duluth
Clarkston
Avondale Estates
Stone Mountain
Pine Lake
North Springs Charter High School
KIPP WAYS Academy
KIPP VISION
KIPP STRIVE
Kingsley Charter Elementary
KIPP South Fulton Academy
ANCS Middle CampusANCS Elementary Campus
Charles Drew Charter School
Legend
ANCS Elementary Campus Priority Zone 1
ANCS Middle Campus Priority Zone 1
The Museum at Avondale Estates Priority Zone 1
Charles Drew Priority Zone 1
DeKalb PATH Academy Priority Zone 1
Kingsley Charter Elemenatary School Priority Zone 1
KIPP South Fulton Academy Priority Zone 1
KIPP West Atlanta Young Scholars Academy PZ1
KIPP Vision Academy and Primary PZ1
KIPP STRIVE Academy and Primary PZ1
North Springs Charter High School Priority Zone 1
Counties
Cities
Interstates
US Highways
11
Willing to Pay: Charter Schools’ Impact on Georgia Property Values frc.gsu.edu
It should be clear from Table 1 and Figure 3 that charter schools do not locate at random in the metro
area. Schools with priority attendance zone are all located in either Fulton or DeKalb counties. As
noted above, they are also located within one of three local public school districts - Atlanta Public
Schools, Fulton County School System, or DeKalb County School District. Charter schools vary in their
mission, governance structure and target populations. Location choice and priority attendance areas
reflect this variation. The KIPP schools, for example, are clustered near one another, both because of
economies of scale in management from the national organization and because target populations are
clustered in that area. The non-random nature of priority attendance zones creates a challenge for
identifying the effects of these zones on property values.
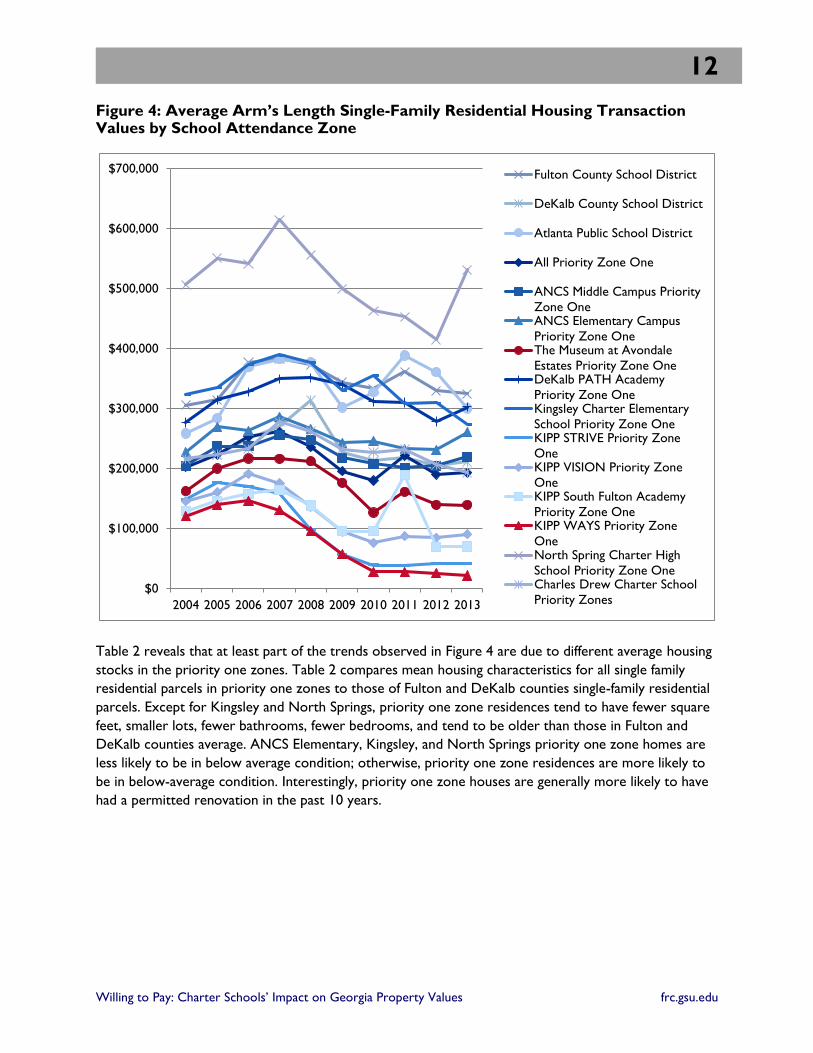
Figure 4 depicts the trends in housing values for each priority one zone, as well as the three local public
school districts in which the zones are located. Specifically, Figure 4 plots the average transaction value
for arm’s length single family residential housing sales in each geographic area from 2004 through the
first quarter of 2013.8 The sample is limited to arm’s length transactions, or transactions in which the
buyer and seller are unrelated and neither is acting under duress, in order to ensure the data reflects
the fair market value of the property. With the exception of North Springs Charter High School, single-
family residences sold for less in priority one zones than in the Atlanta and Fulton County school
districts on average. Approximately half the priority one zone average single family residences sales
prices were less than those in the DeKalb County School District. This naïve evaluation suggests a
discount is required to induce households into most priority zone one attendance zones. However,
comparing only average transaction values fails to account for the non-random nature of priority
attendance zone location and important characteristics of the properties.
8 Averages are calculated after removing all distressed transactions from the data. Distress transactions include foreclosures, short sales, and other transactions associated with loan delinquencies and default. Charles Drew priority zone one and two transactions are pooled in the chart due to the limited number of housing transactions in Charles Drew priority zone one.
12
Willing to Pay: Charter Schools’ Impact on Georgia Property Values frc.gsu.edu
Figure 4: Average Arm’s Length Single-Family Residential Housing Transaction Values by School Attendance Zone
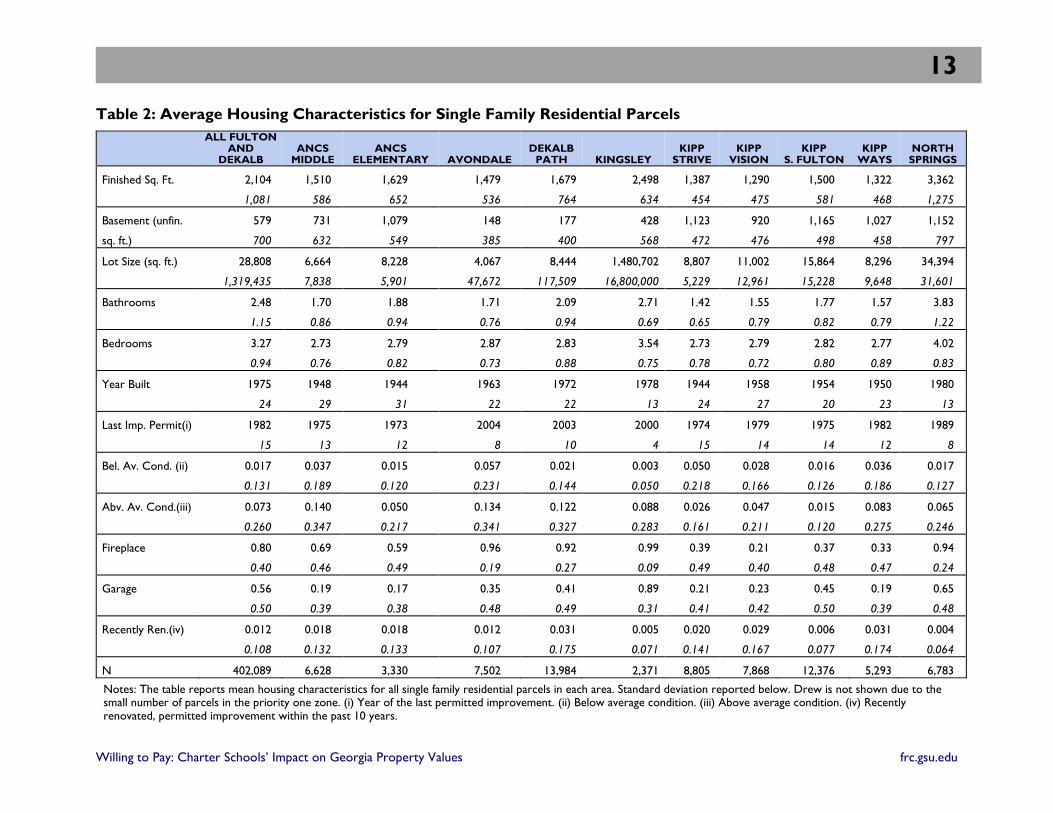
Table 2 reveals that at least part of the trends observed in Figure 4 are due to different average housing
stocks in the priority one zones. Table 2 compares mean housing characteristics for all single family
residential parcels in priority one zones to those of Fulton and DeKalb counties single-family residential
parcels. Except for Kingsley and North Springs, priority one zone residences tend to have fewer square
feet, smaller lots, fewer bathrooms, fewer bedrooms, and tend to be older than those in Fulton and
DeKalb counties average. ANCS Elementary, Kingsley, and North Springs priority one zone homes are
less likely to be in below average condition; otherwise, priority one zone residences are more likely to
be in below-average condition. Interestingly, priority one zone houses are generally more likely to have
had a permitted renovation in the past 10 years.
$0
$100,000
$200,000
$300,000
$400,000
$500,000
$600,000
$700,000
2004 2005 2006 2007 2008 2009 2010 2011 2012 2013
Fulton County School District
DeKalb County School District
Atlanta Public School District
All Priority Zone One
ANCS Middle Campus Priority
Zone OneANCS Elementary Campus
Priority Zone OneThe Museum at Avondale
Estates Priority Zone OneDeKalb PATH Academy
Priority Zone OneKingsley Charter Elementary
School Priority Zone OneKIPP STRIVE Priority Zone
OneKIPP VISION Priority Zone
OneKIPP South Fulton Academy
Priority Zone OneKIPP WAYS Priority Zone
OneNorth Spring Charter High
School Priority Zone OneCharles Drew Charter School
Priority Zones
13
Willing to Pay: Charter Schools’ Impact on Georgia Property Values frc.gsu.edu
Table 2: Average Housing Characteristics for Single Family Residential Parcels
ALL FULTON AND
DEKALB ANCS
MIDDLE ANCS
ELEMENTARY AVONDALE DEKALB
PATH KINGSLEY KIPP
STRIVE KIPP
VISION KIPP
S. FULTON KIPP
WAYS NORTH
SPRINGS
Finished Sq. Ft. 2,104 1,510 1,629 1,479 1,679 2,498 1,387 1,290 1,500 1,322 3,362
1,081 586 652 536 764 634 454 475 581 468 1,275
Basement (unfin. 579 731 1,079 148 177 428 1,123 920 1,165 1,027 1,152
sq. ft.) 700 632 549 385 400 568 472 476 498 458 797
Lot Size (sq. ft.) 28,808 6,664 8,228 4,067 8,444 1,480,702 8,807 11,002 15,864 8,296 34,394
1,319,435 7,838 5,901 47,672 117,509 16,800,000 5,229 12,961 15,228 9,648 31,601
Bathrooms 2.48 1.70 1.88 1.71 2.09 2.71 1.42 1.55 1.77 1.57 3.83
1.15 0.86 0.94 0.76 0.94 0.69 0.65 0.79 0.82 0.79 1.22
Bedrooms 3.27 2.73 2.79 2.87 2.83 3.54 2.73 2.79 2.82 2.77 4.02
0.94 0.76 0.82 0.73 0.88 0.75 0.78 0.72 0.80 0.89 0.83
Year Built 1975 1948 1944 1963 1972 1978 1944 1958 1954 1950 1980
24 29 31 22 22 13 24 27 20 23 13
Last Imp. Permit(i) 1982 1975 1973 2004 2003 2000 1974 1979 1975 1982 1989
15 13 12 8 10 4 15 14 14 12 8
Bel. Av. Cond. (ii) 0.017 0.037 0.015 0.057 0.021 0.003 0.050 0.028 0.016 0.036 0.017
0.131 0.189 0.120 0.231 0.144 0.050 0.218 0.166 0.126 0.186 0.127
Abv. Av. Cond.(iii) 0.073 0.140 0.050 0.134 0.122 0.088 0.026 0.047 0.015 0.083 0.065
0.260 0.347 0.217 0.341 0.327 0.283 0.161 0.211 0.120 0.275 0.246
Fireplace 0.80 0.69 0.59 0.96 0.92 0.99 0.39 0.21 0.37 0.33 0.94
0.40 0.46 0.49 0.19 0.27 0.09 0.49 0.40 0.48 0.47 0.24
Garage 0.56 0.19 0.17 0.35 0.41 0.89 0.21 0.23 0.45 0.19 0.65
0.50 0.39 0.38 0.48 0.49 0.31 0.41 0.42 0.50 0.39 0.48
Recently Ren.(iv) 0.012 0.018 0.018 0.012 0.031 0.005 0.020 0.029 0.006 0.031 0.004
0.108 0.132 0.133 0.107 0.175 0.071 0.141 0.167 0.077 0.174 0.064
N 402,089 6,628 3,330 7,502 13,984 2,371 8,805 7,868 12,376 5,293 6,783
Notes: The table reports mean housing characteristics for all single family residential parcels in each area. Standard deviation reported below. Drew is not shown due to the small number of parcels in the priority one zone. (i) Year of the last permitted improvement. (ii) Below average condition. (iii) Above average condition. (iv) Recently renovated, permitted improvement within the past 10 years.
14
Willing to Pay: Charter Schools’ Impact on Georgia Property Values frc.gsu.edu
In order to identify the effect of priority attendance zones on residential property values, estimates need
to control for the observable differences in single-family residences described above. However, it is
likely that the characteristics in Table 2 do not capture all important features affecting property values.
There are likely important unobservable neighborhood characteristics that also influence sales prices
during the period (e.g., access to amenities and jobs, style of housing, number of foreclosures in the
areas, etc.). The estimates in the next section control for these unobservables by exploiting the sharp
change in admission probability created by priority attendance zones boundaries. Specifically, the
estimated effects are obtained by limiting the sample to sales within close proximity to the border
between priority one and two attendance zones. Residences close to the border should be similar in
observable and unobservable ways, reducing the potential for biased estimates.
Valuing Priority One Attendance Zones
The difference in household willingness-to-pay for single-family residences in charter school priority
enrollment zones provides an estimate of how much households value access to charter schools.
Willingness-to-pay is the dollar value households place upon the access to charter schools conferred by
priority enrollment zones. If households value access to charter schools, then demand for homes in
locations with priority enrollment will rise. Although households with children may be the driving force
behind increased demand in these areas, families must compete with other households in the market.
Increased demand in the area raises property values as reflected in sales prices. Households will not pay
more for a home in priority enrollment zones unless the difference in price is less than or equal to their
dollar valuation of the characteristics of those locations.
As demonstrated above, simply comparing average transaction values in priority one zones with county
or school district averages does not reveal what, if any, price differences exist because of differences in
the housing stock and neighborhoods that also affect property values. In order to estimate the effect of
location in the priority one attendance zone, the value of sales transactions in the zone must be
compared with transactions for similar houses in similar neighborhoods. Including observable property
characteristics in regression analysis provides estimates of differences in transaction values holding
constant those attributes for which data is available.
However, it is unlikely that data may be obtained for all property and neighborhood characteristics
influencing housing values. Residences located close to one another are likely to be similar with respect
to many important factors for which data is either difficult or impossible to obtain. For example, homes
located within 0.2 miles of each other will have very similar access to employment opportunities,
transportation networks, parks, shopping and dining. The neighbors with whom residents interact will
also be similar, and it is likely that household willingness-to-pay also reflects how much they value living
near particular types of people (where type is unquantifiable). The estimates in the following sections,
therefore, compare transaction values for priority zone one residences with priority zone two sales that
occur within very close proximity.
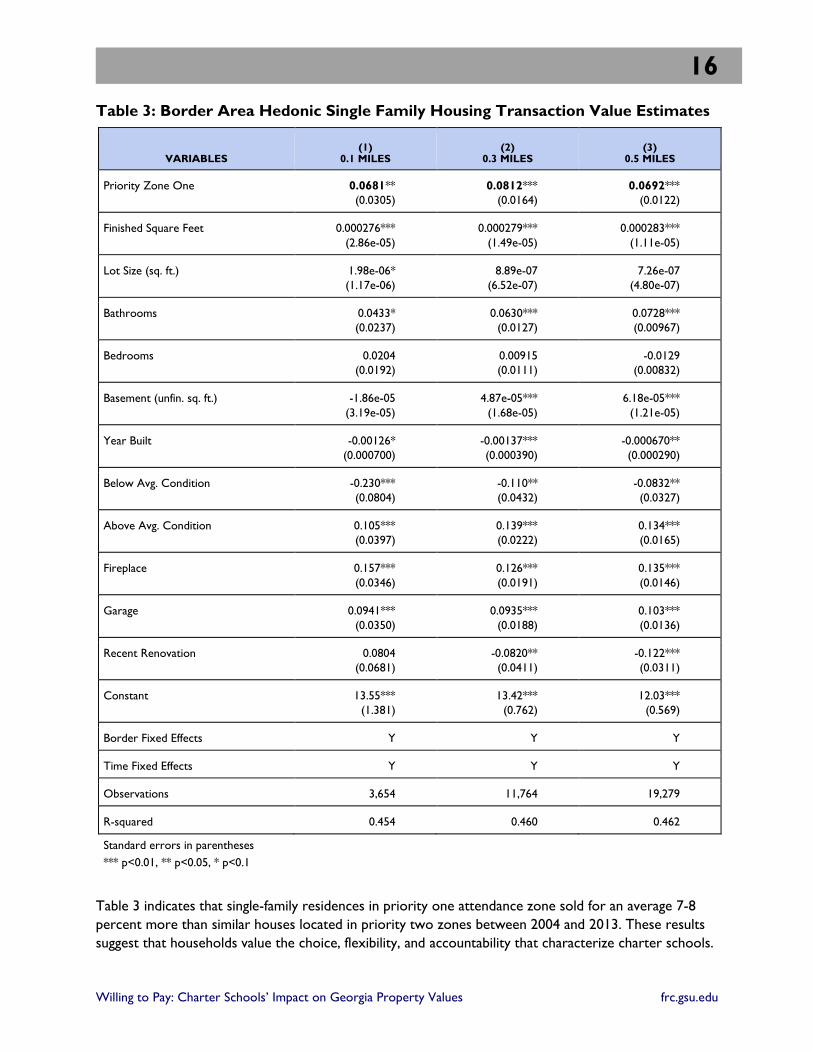
Table 3 reports the difference in the log transaction value controlling for observable property
characteristics, the specific border area in the property is located, the date that the transaction
occurred, and whether the property is located in priority zone one. The variable of interest is the
priority zone one variable, which estimates the effect of being on the priority one side of the border
15
Willing to Pay: Charter Schools’ Impact on Georgia Property Values frc.gsu.edu
between priority zones one and two. The inclusion of variables indicating the border areas in which the
property is located controls for unobservable characteristics unique to a particular charter school, but
common across areas within close proximity to the border (e.g. access, neighbors, etc.). This ensures
that the effect of being located in priority zone one is estimated by comparing the sale price for
residences within the same border area. Including control variables for the transaction date accounts for
fluctuations in housing prices over time. With the other controls, this means that the priority zone one
variable captures differences in transaction values for similar houses within the same border area that
sold at approximately the same time. The sample is limited to arm’s length, single-family residential
transactions, ensuring that prices reflect fair market value. Table 3 presents results for three samples
“close” to the border – 0.1 miles, 0.3 miles, and 0.5 miles.
16
Willing to Pay: Charter Schools’ Impact on Georgia Property Values frc.gsu.edu
Table 3: Border Area Hedonic Single Family Housing Transaction Value Estimates
VARIABLES (1)
0.1 MILES (2)
0.3 MILES (3)
0.5 MILES
Priority Zone One 0.0681**
(0.0305)
0.0812***
(0.0164)
0.0692***
(0.0122)
Finished Square Feet 0.000276***
(2.86e-05)
0.000279***
(1.49e-05)
0.000283***
(1.11e-05)
Lot Size (sq. ft.) 1.98e-06*
(1.17e-06)
8.89e-07
(6.52e-07)
7.26e-07
(4.80e-07)
Bathrooms 0.0433*
(0.0237)
0.0630***
(0.0127)
0.0728***
(0.00967)
Bedrooms 0.0204
(0.0192)
0.00915
(0.0111)
-0.0129
(0.00832)
Basement (unfin. sq. ft.) -1.86e-05
(3.19e-05)
4.87e-05***
(1.68e-05)
6.18e-05***
(1.21e-05)
Year Built -0.00126*
(0.000700)
-0.00137***
(0.000390)
-0.000670**
(0.000290)
Below Avg. Condition -0.230***
(0.0804)
-0.110**
(0.0432)
-0.0832**
(0.0327)
Above Avg. Condition 0.105***
(0.0397)
0.139***
(0.0222)
0.134***
(0.0165)
Fireplace 0.157***
(0.0346)
0.126***
(0.0191)
0.135***
(0.0146)
Garage 0.0941***
(0.0350)
0.0935***
(0.0188)
0.103***
(0.0136)
Recent Renovation 0.0804
(0.0681)
-0.0820**
(0.0411)
-0.122***
(0.0311)
Constant 13.55***
(1.381)
13.42***
(0.762)
12.03***
(0.569)
Border Fixed Effects Y Y Y
Time Fixed Effects Y Y Y
Observations 3,654 11,764 19,279
R-squared 0.454 0.460 0.462
Standard errors in parentheses
*** p<0.01, ** p<0.05, * p<0.1
Table 3 indicates that single-family residences in priority one attendance zone sold for an average 7-8
percent more than similar houses located in priority two zones between 2004 and 2013. These results
suggest that households value the choice, flexibility, and accountability that characterize charter schools.
17
Willing to Pay: Charter Schools’ Impact on Georgia Property Values frc.gsu.edu
The fact that households on either side of the priority zone border have access to the charter schools
with different probabilities also indicates that households value the increased probability of admission to
charter schools associated with the being located in priority one zones.
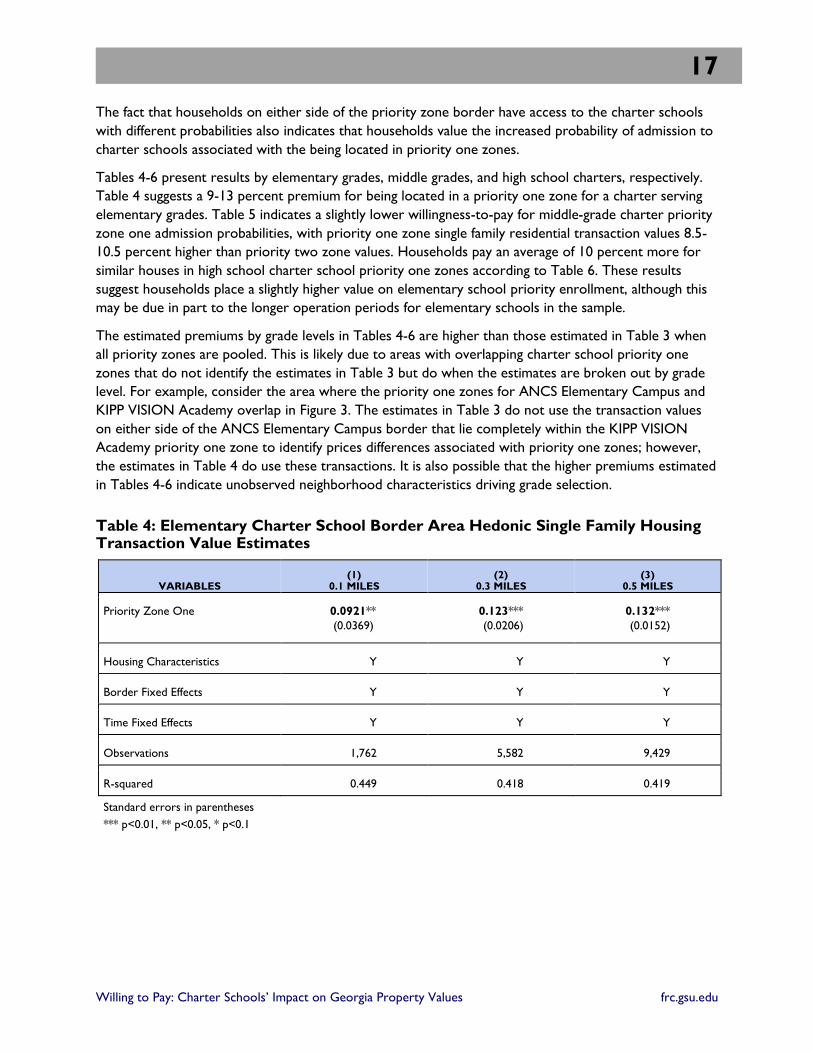
Tables 4-6 present results by elementary grades, middle grades, and high school charters, respectively.
Table 4 suggests a 9-13 percent premium for being located in a priority one zone for a charter serving
elementary grades. Table 5 indicates a slightly lower willingness-to-pay for middle-grade charter priority
zone one admission probabilities, with priority one zone single family residential transaction values 8.5-
10.5 percent higher than priority two zone values. Households pay an average of 10 percent more for
similar houses in high school charter school priority one zones according to Table 6. These results
suggest households place a slightly higher value on elementary school priority enrollment, although this
may be due in part to the longer operation periods for elementary schools in the sample.
The estimated premiums by grade levels in Tables 4-6 are higher than those estimated in Table 3 when
all priority zones are pooled. This is likely due to areas with overlapping charter school priority one
zones that do not identify the estimates in Table 3 but do when the estimates are broken out by grade
level. For example, consider the area where the priority one zones for ANCS Elementary Campus and
KIPP VISION Academy overlap in Figure 3. The estimates in Table 3 do not use the transaction values
on either side of the ANCS Elementary Campus border that lie completely within the KIPP VISION
Academy priority one zone to identify prices differences associated with priority one zones; however,
the estimates in Table 4 do use these transactions. It is also possible that the higher premiums estimated
in Tables 4-6 indicate unobserved neighborhood characteristics driving grade selection.
Table 4: Elementary Charter School Border Area Hedonic Single Family Housing Transaction Value Estimates
VARIABLES (1)
0.1 MILES (2)
0.3 MILES (3)
0.5 MILES
Priority Zone One 0.0921**
(0.0369)
0.123***
(0.0206)
0.132***
(0.0152)
Housing Characteristics Y Y Y
Border Fixed Effects Y Y Y
Time Fixed Effects Y Y Y
Observations 1,762 5,582 9,429
R-squared 0.449 0.418 0.419
Standard errors in parentheses
*** p<0.01, ** p<0.05, * p<0.1
18
Willing to Pay: Charter Schools’ Impact on Georgia Property Values frc.gsu.edu
Table 5: Middle Grades Charter School Border Area Hedonic Single Family Housing Transaction Value Estimates
VARIABLES (1)
0.1 MILES (2)
0.3 MILES (3)
0.5 MILES
Priority Zone One 0.0850**
(0.0355)
0.0999***
(0.0199)
0.105***
(0.0148)
Housing Characteristics Y Y Y
Border Fixed Effects Y Y Y
Time Fixed Effects Y Y Y
Observations 2,798 8,922 14,745
R-squared 0.361 0.341 0.334
Standard errors in parentheses
*** p<0.01, ** p<0.05, * p<0.1
Table 6: Charter High School Border Area Hedonic Single Family Housing Transaction Value Estimates
VARIABLES (1)
0.1 MILES (2)
0.3 MILES (3)
0.5 MILES
Priority Zone One 0.109
(0.0775)
0.106***
(0.0306)
0.101***
(0.0205)
Housing Characteristics Y Y Y
Border Fixed Effects Y Y Y
Time Fixed Effects Y Y Y
Observations 425 1,738 3,220
R-squared 0.464 0.453 0.480
Standard errors in parentheses
*** p<0.01, ** p<0.05, * p<0.1
Taken together, the estimates in Tables 3-6 indicate that households value charter school priority zone
one admission probabilities and are willing to pay a premium for housing located within these zones. As
Bayer et al. (2007) discuss, it is possible that households sort along these priority attendance zone
boundaries. Households on either side of the boundary are, therefore, unobservably different and part
of the estimated effect is households’ willingness-to-pay for neighbors. If that is the case, then the
estimates are the combined premium for increased charter school admission probabilities and the type
of neighbors that value them. Further research is needed to identify the causal effects of charter school
admission priority zones.
19
Willing to Pay: Charter Schools’ Impact on Georgia Property Values frc.gsu.edu
Conclusions
The number of charter schools, and students enrolled in charter schools, has steadily increased in
Georgia over the past decade. The trend is likely to continue into the foreseeable future. The charter
school landscape in Georgia mirrors the national landscape in many important ways, but it also has
unique features – charter systems and priority admission zones within designated attendance areas. This
report exploits the latter feature to estimate households’ willingness-to-pay for increased probability of
admission to charter schools. The results indicate a significant premium associated with being located in
priority one zones compared to similar single-family residences in priority two zones. This suggests
households value access to charter schools and the type of neighbors located in priority one attendance
zones. Traditional public schools also rely on property tax revenue for funding. These results, therefore,
suggest another channel (besides competition) through which charter schools may help improve
traditional public schools – increased revenue.
The estimated premiums are associated with start-up and conversion charter school priority attendance
zones only, with the majority of the sample consisting of start-up charters. These estimates, therefore,
do not indicate anything about how households value the other unique feature of the charter landscape
in Georgia – charter systems. Schools in a charter system differ substantially from conversion and start-
up charter schools along a number of important dimensions. The growth of charter systems may also
limit opportunities for conversion charters. Having established that households do value priority one
attendance zone, future research should investigate changes in property values associated with schools
in charter systems. Unfortunately, the Fulton and DeKalb county charter systems efforts are too nascent
to identify what, if any, affect they may have.
References Bayer, Patrick F. Ferreira, R. McMillan. 2007. A Unified Framework for Measuring Preferences for
Schools and Neighborhoods. Journal of Political Economy 115(4): 558-638.
Burge, John D. 2014. “Georgia Charter Schools and Charter Systems Annual Report, 2012-2013.”
Presentation to the Charter Committee of the State Board of Education, January 14. Last accessed
June 30, 2015, http://www.pathacademy.org/wp-content/uploads/2014/01/4-2012-13-Annual-Report-
PPT-2014-01-14.pdf.
Georgia Charter School Association. 2015. "Types of Charters | Georgia Charter Schools Association."
Georgia Charter Schools Association. Last accessed June 30, 2015,
http://www.gacharters.org/schools/types-of-charters/.
Georgia Department of Education. 2013. “Chartering in Georgia: The Charter School Division Annual
Report for 2012-2013.”
Henig, Jeffrey R. and Lori L. Taylor. 1996. “Locational Decisions of Charter Schools: Probing the Market
Metaphor,” Social Science Quarterly 84: 962-980.
Horowitz, John, Stanley Keil and Lee Spector. 2009. “Do Charter School Affect Property Values?” The
Review of Regional Studies 39(3): 297-316.
Imberman, Scott, Michael Naretta, and Margaret O’Rourke. 2014. “The Value of Charter Schools:
Evidence from Housing Prices,” working paper.
National Alliance for Public Charter Schools, 2012-2013 U.S. estimates,
http://dashboard.publiccharters.org/dashboard/schools/page/overview/year/2013.
20
Willing to Pay: Charter Schools’ Impact on Georgia Property Values frc.gsu.edu
About the Author
CARLIANNE PATRICK is an Assistant Professor of Economics at the Andrew
Young School of Policy Studies at Georgia State University and an affiliated faculty
member of the Center for State and Local Finance. Patrick is the recipient of the
Dean's Early Career Award and is an International Council of Economic Development
Certified Economic Developer. Her research interests include urban and regional
economics, public finance, and economic development policy. She holds a Ph.D. from
Ohio State University.
About the Fiscal Research Center
Established in 1995, the Fiscal Research Center (FRC) provides nonpartisan research, technical assistance
and education in the evaluation and design of state tax and economic policy. FRC’s responsibilities
include developing estimates for tax-related fiscal notes, writing the Georgia State Tax Expenditure
Budget, supporting the state’s economist, and conducting policy and academic research on a variety of
topics associated with state tax policy issues.
FRC Reports, Policy Briefs, and other publications maintain a position of neutrality on public policy
issues in order to safeguard the academic freedom of the authors. Thus, interpretations or conclusions
in FRC publications should be understood to be solely those of the author(s).
For more information on the Fiscal Research Center, visit our website at: frc.gsu.edu.