why south africa? - international housing solutions · immigration and intensified the subjugation...
TRANSCRIPT

Why South Africa?
A Background Briefing Book for Potential Institutional Investors Compiled by: M. Leanne Lachman Lachman Associates LLC March 2012
International Housing Solutions S.a r.l. 37 rue, d’Anvers Luxembourg, L-1130 Contact: Soula Proxenos Phone: +1 202 333 3612 Email: [email protected]

Table of Contents
2 Lachman Associates, LLC
Section 1: Executive Summary 3Section 2: Country Profile – CIA World Factbook 7Section 3: Comparative Country Rankings 13Section 4: South Africa’s Economic Base 19Section 5: External Evaluations 28
• OECD 29• International Monetary Fund 30
Section 6: Social Issues 33• Unemployment 34• Education/Skills Shortage 36• AIDS 37
Section 7: South African Real Estate 38• Commercial 39• Housing 44
Section 8: References 53

Executive Summary Executive Summary
Section 1
3 Lachman Associates, LLC

Executive Summary
The Republic of South Africa has had nearly 18 years to demonstrate that it can function effectively as a democracy. While doing so, it swiftly transitioned from a pariah on the world’s stage to a positive force in global economics and politics. Change occurred relatively quietly until the World Cup in 2010, at which point the entire globe took a fresh look at South Africa. With a Baa1 rating from Moody’s and a BBB from Standard & Poors, and with the highest commercial property returns in the IPD Index for seven of the nine years through 2011, South Africa’s economy is sound. Furthermore, the property and construction industries have strong long-term demand and good yield potential. The real estate market’s most important driver is the broad change in land use patterns as the country normalizes after over a century of apartheid. Specifically:
• Black Africans, who represent, nearly 80% of South Africa’s 50 million residents, can now own property and are anxious to do so. Many also want to move up to better quality housing.
• Today, Black African families (and not just primary workers) can live within the municipal boundaries of cities – where more and more contemporary jobs are concentrated. As urbanization continues – from 62% today to an expected 71% by 2030 – it will generate housing demand for another 7.9 million people in cities and suburbs.
• Center cities, which had little or no housing, are attracting both new residential development and redevelopment of formerly commercial buildings into rental and for-sale housing.
• As remote mines and farms mechanize and reduce employment, their former workers are stranded in “homelands” without much productive economic activity nearby. To reduce the country’s high unemployment, relocation is essential. However, relocatees need affordable homes, so workforce housing development is literally a tool to reduce unemployment.
• Government is still the dominant land owner, but large tracts are being made available for residential and commercial development.
The global recession that began in 2007 severely curtailed South Africa’s export volumes, particularly automotive products. The resulting downward spiral in the local economy generated a loss of more than 750,000 jobs. The situation would have been even worse had there not been so much infrastructure, stadium, and other construction activity for the 2010 FIFA World Cup.
“South Africa’s business infrastructure is well established, with secure financial systems, good road, rail and airport infrastructure, advanced IT systems and a good communications network. The country is open to foreign direct investment and the country remains popular with both corporate business and private individuals.” -- Broll Property Group, February 2011
4 Lachman Associates, LLC

Because South Africa’s financial institutions were largely insulated from the high leverage prevalent in Europe and the United States, the country righted itself quickly, exiting the recession in the third quarter of 2009 – although job losses continued through the first quarter of 2010. According to the International Monetary Fund, real GDP grew by 2.9% in 2010, 3.1% in 2011 and is expected to expand by 2.5% in 2012. Inflation is likely to be in the 5-6% range, well below the historic average. South African consumer confidence improved as the recession ended, but global economic problems continue to be a source of concern.
As described in Section 4, South Africa’s economic base consists of five major industries, all of which operate at first-world levels of sophistication:
1. Top-quality financial services – banks that are expanding aggressively through sub-Saharan Africa; life and casualty insurance companies; and the 18th largest stock exchange in the world. Thanks to its recognized competency in financial servicing, South Africa is a receiving country for business process outsourcing (BPO).
2. Mineral production – as the world’s largest producer of platinum and one of the leaders in gold, diamonds, base metals, and coal. For these reasons, China is an increasingly important trading partner.
3. Diversified manufacturing, dominated by six sectors: a. Automobile assembly and parts production. More and
more right-hand drive vehicles produced in South Africa are being exported by multinationals.
b. Chemicals. c. Metals, including steel production. d. Textiles and clothing.
e. Internet and cellular telephone penetration is among the highest in the world.
f. Agriprocessing, which is expanding rapidly.
4. Tourism has benefited enormously from the country’s liberation. Directly and with its multiplier effects, tourism accounts for 9% of employment and 8.6% of GDP.
5. Agriculture was the second mainstay of apartheid South Africa’s economy (after mining) and still accounts for over 600,000 jobs – despite expanded mechanization.
South Africa advertises itself as the “Gateway to Africa,” and global companies use it as their springboard to do business elsewhere on the continent. This adds to office, warehouse, and hotel demand.
South Africa is considered a middle-income country; however, the wealth profile is polarized. Average income figures are deceptive because they mask the large, poor population base that has only recently been enfranchised and allowed to live wherever they wish. Over time, rural-to-urban migration, improved education and training, creation of workforce housing, and job generation will erode unemployment and raise incomes. In the interim, social support from the government is critically important – particularly the Older Persons Grant, which provides R1440 per month to men and women over 60, and the more than 2.5-2.8 million housing units the government has given to poor families.
Demographically, South Africa’s 50 million people are young – with 31% under 15 years old and only 7.3% over 60. Despite the fact that universal education through the 10th grade was not mandated until 1994, South Africa has a literate population.
5 Lachman Associates, LLC
English is widely spoken throughout the country, even though it is the first language of less than 10% of the populace.
The remainder of this briefing book provides an overview of South Africa to familiarize potential investors with the country’s economic characteristics. It is a compilation of materials produced by sources deemed to be objective and perceptive. Briefly:
• Section 2 is excerpted from the CIA’s World Factbook and capsulizes geography, government, the economy, communications, and transportation.
• Section 3 contains diverse charts comparing demographic and economic characteristics of South Africa with those of the BRIC countries (Brazil, Russia, India, China), as well as Mexico, the U.S., and the U.K.
• Section 4 describes the country’s economic base.
• Section 5 consists of excerpts from two reports – OECD’s 2010 Economic Survey and a 2011 International Monetary Fund Executive Board assessment.
• Section 6 addresses three serious social issues: unemployment, the education and skills shortage, and AIDS.
• Section 7 focuses on South Africa’s real estate market, much of which is institutional grade. Property values have risen dramatically, and income returns on commercial properties remain at or above 8% year in and year out. Strong pent-up and evolving residential demand will support high construction volumes for middle-, moderate-, and low-income households.
• Section 8 is a bibliography that allows readers to access referenced web sites and explore topics in more depth.
Lachman Associates, LLC 6

Country Profile – CIA World Factbook Section 2
7 Lachman Associates, LLC

South Africa Country Profile Excerpted From CIA – The World Factbook (Updated 3/1/12) Background: After the British seized the Cape of Good Hope area in 1806, many of the Dutch settlers (the Boers) trekked north to found their own republics. The discovery of diamonds (1867) and gold (1886) spurred wealth and immigration and intensified the subjugation of the native inhabitants. The Boers resisted British encroachments, but were defeated in the Boer War (1899-1902). The resulting Union of South Africa operated under a policy of apartheid - the separate development of the races. The 1990s brought an end to apartheid politically and ushered in black majority rule.
Geography
Area: land: 1,219,090 sq km note: includes Prince Edward Islands (Marion Island and Prince Edward Island) Area comparative: slightly less than twice the size of Texas Land boundaries: total: 4,862 km border countries: Botswana 1,840 km, Lesotho 909 km, Mozambique 491 km, Namibia 967 km, Swaziland 430 km, Zimbabwe 225 km Coastline: 2,798 km Climate: mostly semiarid; subtropical along east coast; sunny days, cool nights
8 Lachman Associates, LLC

Terrain: vast interior plateau rimmed by rugged hills and narrow coastal plain Elevation extremes: lowest point: Atlantic Ocean 0 m, highest point: Njesuthi 3,408 m Natural resources: gold, chromium, antimony, coal, iron ore, manganese, nickel, phosphates, tin, rare earth elements, uranium, gem diamonds, platinum, copper, vanadium, salt, natural gas Land use: arable land: 12.1%, permanent crops: 0.79%, other: 87.11% (2005) Environment – current issues: lack of important arterial rivers or lakes requires extensive water conservation and control measures; growth in water usage outpacing supply; pollution of rivers from agricultural runoff and urban discharge; air pollution resulting in acid rain; soil erosion; desertification
People
Population: 48,810,427 (July 2012 est.) 26th in the world. 1 note: estimates for this country explicitly take into account the effects of excess mortality due to AIDS; this can result in lower life expectancy, higher infant mortality and death rates, lower population and growth rates, and changes in the distribution of population by age and sex than would otherwise be expected. Age structure: 0-14 years: 28.5%; 15-64 years: 65.8%; 65 years and over: 5.7% (2011 est.) Median age: 25 years (2011 est.) Population growth rate: -0.41% (2012 est.) Birth rate: 19.3 births/1,000 population (2012 est.) Death rate: 17.2 deaths/1,000 population (2012 est.)
Life expectancy at birth: total population: 49.4 years, male: 50.3 years, female: 48.4 years (2012 est.) 2 Religions: Protestant 36.6%, Catholic 7.1%, other Christian 36.0%, Muslim 1.5%, other 5.2%, none 15.1% (2001 census) Languages: IsiZulu 23.8%, IsiXhosa 17.6%, Afrikaans 13.3%, Sepedi 9.4%, English 8.2%, Setswana 8.2%, Sesotho 7.9%, Xitsonga 4.4%, other 7.2% (2001 census)
Government Country name: conventional long form: Republic of South Africa, conventional short form: South Africa Government type: republic Capital: Pretoria (administrative capital), Cape Town (legislative capital), Bloemfontein (judicial capital). Time difference: UTC+2 (7 hours ahead of Washington, DC during Standard Time) Administrative divisions: 9 provinces: Eastern Cape, Free State, Gauteng, KwaZulu-Natal, Limpopo, Mpumalanga, North-West, Northern Cape, Western Cape Constitution: Adopted December 1996; entered into effect on February 4, 1997.
1 The South African government's population estimate was 49.9 million in 2010 and 50.6 million in 2011. 2 The South African government's estimate of average life expectancy is 55 years.
9 Lachman Associates, LLC
Legal System: mixed system based on Roman-Dutch civil law, English common law, and customary law; accepts International Criminal Court jurisdiction. Executive branch: chief of state: President Jacob Zuma (since 9 May 2009); Deputy President Kgalema Molanthe (since 11 May 2009); note - the president is both the chief of state and head of government cabinet: Cabinet appointed by the president elections: president elected by the National Assembly for a five-year term (eligible for a second term); election last held 6 May 2009 (next to be held in 2014) Legislative branch: bicameral Parliament consisting of the National Council of Provinces (90 seats, 10 members elected by each of the nine provincial legislatures for five-year terms),which has special powers to protect regional interests, including the safeguarding of cultural and linguistic traditions among ethnic minorities; and the National Assembly (400 seats), whose members are elected by popular vote under a system of proportional representation, to serve five-year terms. Judicial branch: Constitutional Court; Supreme Court of Appeals; High Courts; Magistrate Courts Political parties and leaders: African Christian Democratic Party or ACDP [Kenneth Meshoe]; African National Congress or ANC [Jacob Zuma]; Congress of the People or COPE [Mosiuoa Lekota]; Democratic Alliance or DA [Helen Zille]; Freedom Front Plus or FF+ [Pieter Mulder]; Independent Democrats or ID [Patricia DeLille]; Inkatha Freedom Party or IFP [Mangosuthu Buthelezi]; Pan-Africanist Congress or PAC [Motsoko Pheko]; United Christian Democratic Party or UCDP [Lucas Mangope); United Democratic Movement or UDM [Bantu Holomisa]
Overview
Economy overview: South Africa is a middle-income, emerging market with an abundant supply of natural resources; well-developed financial, legal, communications, energy, and transport sectors; a stock exchange that is the 18th largest in the world; and a modern infrastructure supporting a relatively efficient distribution of goods to major urban centers throughout the region. Growth was robust from 2004 to 2007 as South Africa reaped the benefits of macroeconomic stability and a global commodities boom, but began to slow in the second half of 2007 due to an electricity crisis and the subsequent global financial crisis' impact on commodity prices and demand. GDP fell nearly 2% in 2009 but recovered in 2010-11. Unemployment remains high and outdated infrastructure has constrained growth. Daunting economic problems remain from the apartheid era - especially poverty, lack of economic empowerment among the disadvantaged groups, and a shortage of public transportation. South Africa's economic policy is fiscally conservative, focusing on controlling inflation and attaining a budget surplus. The current government largely follows these prudent policies, but must contend with the impact of the global crisis and is facing growing pressure from special interest groups to use state-owned enterprises to deliver basic services to low-income areas and to increase job growth. GDP (purchasing power parity): $554.6 billion (2011 est.) GDP – real growth rate: 3.4% (2011 est.)
10 Lachman Associates, LLC

GDP – per capita (PPP): $11,000 (2011 est.) GDP – composition by sector: agriculture: 2.5%, industry: 31.6%, services: 65.9% (2010 est.) Labor force: 17.67 million economically active (2011 est.) Labor force – by occupation: agriculture: 9%, industry: 26%, services: 65% (2007 est.) Unemployment rate: 23.9% (2011 est.) Inflation rate (consumer prices): 5% (2011 est.) Budget: revenues: $104.7 billion, expenditures: $126.3 billion (2011) Public debt: 35.6% of GDP (2011 est.) Agriculture – products: corn, wheat, sugarcane, fruits, vegetables; beef, poultry, mutton, wool, dairy products Industries: mining (world's largest producer of platinum, gold, chromium), automobile assembly, metalworking, machinery, textiles, iron and steel, chemicals, fertilizer, foodstuffs, commercial ship repair Industrial production growth rate: 4% (2011 est.) Electricity – production: 238.3 billion kWh; consumption: 212.2 billion kWh (2008 est.) Electricity – exports: 8 billion kWh; imports: 10.6 billion kWh (2009 est.) Oil – production: 192,000 bbl/day; consumption: 553,000 bbl/day (2010 est.) Natural gas – production: 1.9 billion cu m; consumption: 5.4 billion cu m (2009 est.) Natural gas – proved reserves: 27.16 million cu m (1 January 2006 est.)
Current account balance: $-16.7 billion (2011 est.) Exports: $94.2 billion (2011 est.) Exports – commodities: gold, diamonds, platinum, other metals and minerals, machinery and equipment Exports – partners: China 13.7%, U.S. 10.1%, Japan 8.7%, Germany 7.3%, UK 7.1%, India 4.3% (2010) Imports: $92.86 billion (2011 est.) Imports - commodities machinery and equipment, chemicals, petroleum products, scientific instruments, foodstuffs Imports – partners: China 13.4%, Germany 11.2%, US 7.0%, Saudi Arabia 5.3%, Japan 4.7%, Iran 4.3% (2010) Reserves of foreign exchange and gold: $50.26 billion (Dec 2011 est.) Debt – external: $47.66 billion (31 December 2011 est.) Currency (code): rand (ZAR) Exchange rates: rand per US dollar – 7.16 (2011), 7.32 (2010), 8.42 (2009), 7.96 (2008), 7.05 (2007)
Communications Telephones – main lines in use: 4.225 million (2010) Telephones – mobile cellular: 50.372 million (2010) Telephone system: general assessment: the system is the best developed and most modern in Africa. Combined fixed line and mobile cellular equals roughly 110 telephones per 100 persons. domestic: consists of carrier-equipped open-wire lines, coaxial cables, microwave radio relay links, fiber-optic cable, radiotelephone communication stations, and wireless local loops. international: country code : 27
11 Lachman Associates, LLC

Internet country code: .za Internet hosts: 3.75 million (2010) Internet users: 4.42 million (2009)
Transportation Airports: 578 (2010); 147 with paved runways Pipelines: gas 908 km; oil 980 km; refined products 1,382 km (2010) Railways: total: 20,192 km (2010) Roadways: total: 362,099 km, paved: 73,506 km (including 239 km of expressways) (2002) Ports and terminals: Cape Town, Durban, Port Elizabeth, Richards Bay, Saldanha Bay
Transnational Issues Disputes – international: South Africa has placed military along the border to apprehend the thousands of Zimbabweans fleeing economic dysfunction and political persecution; South Africa also supports large numbers of refugees and asylum seekers from the Democratic Republic of the Congo, Somalia, Burundi, and other states in Africa.3 3 The Voice of America (September 2, 2010) indicated that there were 1.5 million Zimbabweans living illegally in SA. Although some were political refugees, most were crossing the border for economic reasons. Only a tiny fraction of Zimbabwean immigrants are approved for permanent refugee status. In 2010, the South African government instituted a dispensation program for Zimbabweans who could present documentation and register with the government; this program has ended. In total, the number of illegal immigrants in South Africa is estimated to be as high as six million. This is a contributor to high unemployment among South Africans.
12 Lachman Associates, LLC

Comparative Country Rankings Section 3
13 Lachman Associates, LLC

14
Figure 3-2. Gross National Income (GNI) Per Capita in International Dollars Purchasing Power Parity – 2010
Source: World Bank, World Development Indicators Database, updated December 2011.
Figure 3-1. Current Government Bond Ratings
Moody's Standard &
Poors Rating Rating
Brazil Baa2 BBB China Aa3 AA- India Baa3 BBB- Mexico Baa1 BBB Russian Federation Baa1 BBB South Africa Baa1 BBB United Kingdom Aaa AAA United States Aaa AA+
Ratings Rank: Highest to Lowest Aaa AAA Aa3 AA+ A1 AA A2 AA- A3 A+
Baa1 A Baa2 A- Baa3 BBB+ Ba1 BBB Ba2 BBB-
Lachman Associates, LLC
Figure 3-1 Moody’s rates South African government bonds higher than those of India and Brazil. Also, S & P rates South African debt higher than that of India and equal to Brazil, the Russian Federation, and Mexico. Moody’s rates South African sovereign debt at a relatively high Baa1, but with a negative outlook. There are concerns about fiscal stability and labor unrest.
Figure 3-2 The World Bank characterizes South Africa as an upper-middle-income country, but this masks considerable income skewing: the nation has a relatively small number of wealthy households but a majority of families have low incomes. Per capita GNI in 2010 was estimated at $10,360 on a purchasing power parity basis, up from $6,610 in 2000 and $8,420 in 2005. South Africa's per capita income exceeds that of India and China.
$- $5,000
$10,000 $15,000 $20,000 $25,000 $30,000 $35,000 $40,000 $45,000 $50,000

15
Figure 3-3. Consumer Price Inflation, 2008-2010*
*Percent increase as of year end Source: International Monetary Fund
Lachman Associates, LLC
Figure 3-3 According to the International Monetary Fund, South African consumer prices rose only 3.5% in 2010, a dramatic drop in the inflation rate over the prior two years. The 2010 price increases were lower than those seen in the BRIC countries and Mexico. Moderate inflation is not unusual in developing countries.
Figure 3-4 Since the financial crisis began in 2007, the developed world's excessive mortgage debt has attracted a lot of attention. In contrast, most developing countries suffer from limited access to long-term credit, especially for home buyers. South Africa's financial institutions have a well-established mortgage infrastructure and legal protections for both lender and borrowers. Loans are available through a variety of sources targeting moderate-, middle-, and upper-income home buyers.
Figure 3-4. Outstanding Residential Mortgage Debt as Percent of GDP, 2009
5.8%
12.0%
7.0%
9.8%
2.6%
47.0%
88.5%
81.4%
0% 20% 40% 60% 80% 100%
Brazil
China
India
Mexico
Russian Federation
South Africa
United Kingdom
United States
Sources: Housing Finance Information Network (HOFINET); country estimates
0.0 2.0 4.0 6.0 8.0
10.0 12.0 14.0 16.0
Perc
ent
2008 2009 2010

16 Lachman Associates, LLC
Figure 3-5 The United Nations projects that South Africa’s population will grow from today’s 50.1 million to 54.7 million over the next 20 years -- a gain of 9.1%. Projected growth rates are higher for India, Mexico, Brazil, and the U.S., and slightly higher for the UK. When compared to the average for developed countries, South Africa's growth rate will be higher.
Figure 3-5. Population Change, 2010-2030
Source: United Nations, World Population Prospects: The 2010 Revision.
13.1%
3.9%
24.4%
19.4%
-4.6%
9.1%
11.7%
16.5%
-10% -5% 0% 5% 10% 15% 20% 25% 30%
Brazil
China
India
Mexico
Russian Federation
South Africa
United Kingdom
United States
Figure 3-6. Median Age in 2010
Figure 3-6 As is the case for most developing countries, South Africa's population is relatively young, with the 2010 median age estimated at just under 25 years. In contrast, the median age in the US, UK, and Russia is older than 35. China's median age is rapidly approaching that of the developed world, while India and Mexico are more comparable to South Africa.
29.1 34.5
25.1 26.6
37.9
24.9
39.8 36.9
0 5
10 15 20 25 30 35 40 45
Year
s
Source: United Nations, World Population Prospects: The 2010 Revision.

17
Figure 3-7. Life Expectancy at Birth, Both Sexes Combined 2010-2015
Lachman Associates, LLC
Figure 3-7 Average life expectancy in South Africa is lower than that of other countries shown in the graph, largely because of AIDS. However, widespread use of anti-retroviral treatment is generating meaningful gains in longevity. By 2025, life expectancy in South Africa is projected to reach 58.5 years.
Source: United Nations, World Population Prospects: The 2010 Revision.
74.0 73.8 66.0
77.2 69.2
53.8
80.4 78.8
0
10
20
30
40
50
60
70
80
90
Brazil China India Mexico Russian Federation
South Africa
United Kingdom
United States
Year
s

18
Figure 3-8. Percent of Population Age 15-64 2010 and 2030
Figure 3-9. Percent Change in Working-Age Population 2010-2030
Lachman Associates, LLC
Figures 3-8 and 3-9 The share of total population that is of working age is important for an adequate labor supply, and to assure there are sufficient workers to support the needs of young children and the elderly. South Africa's working-age population share is expected to increase over the next 20 years, which will also be true of Brazil, India, and Mexico. It will decline in the US, UK, and China, and most dramatically in the Russian Federation. South Africa is projected to gain more than 3.9 million people age 15 to 64 by 2030, an increase of 12.1%. India will show the biggest percentage gain, while China will see a slight drop in potential workers -- a long-term result of its one-child policy. Russia will experience a 14.0% loss, reflecting its very low current birth rates.
Source: United Nations, World Population Prospects: The 2010 Revision.
14.3%
-1.1%
31.0% 24.2%
-14.0%
12.1%
3.8% 6.3%
-20%
-10%
0%
10%
20%
30%
40%
Brazil China India Mexico Russian Federation
South Africa
United Kingdom
United States
Source: United Nations, World Population Prospects: The 2010 Revision.
67.5
72.4
64.5
64.6
72.2
65.2
66.0
66.9
68.3
68.9
67.9
67.2
65.1
67.0
61.3
61.0
54 56 58 60 62 64 66 68 70 72 74
Perc
ent
2010 2030

South Africa’s Economic Base Section 4
19 Lachman Associates, LLC

South Africa’s Economic Base With the end of apartheid in 1994, South Africa’s economy began a transition that is still underway. Among the evolutions:
• Rapid urbanization, which brings workers and their families from isolated homelands and townships to urban areas where business service, manufacturing, and retail trade jobs are located. As reflected in Figure 4-1, 3.9 million more South Africans will live in urban areas by 2020.
• Reductions in agricultural and mining employment as those industries mechanize.
• Gradual expansion of entrepreneurship, which was discouraged under apartheid. Consequently, the informal economy, which is estimated to represent almost 30% of GDP today, is smaller than in other emerging countries. Many believe this could be a source of significant employment growth.
• South African business expansion into other countries on the continent. To date, this has been most visible in financial services.
• Globalization of manufacturing, with South African companies expanding abroad (e.g., SAB Miller becoming a major brewer in China) and others being acquired by international firms.
• Tourism growing steadily – from 4% of GDP in 1988 to 8.5% in 2011. Direct and indirect employment generated by travel and tourism accounted for 9% of all jobs.
• Expansion of export markets for everything from platinum to processed foods and from wine to widgets.
• By market capitalization, the Johannesburg Stock Exchange is the 18th largest exchange in the world.
South Africa’s economy is the largest on the African continent, and given its absolute size, change is inevitably gradual. In the early, organizational years of the democracy, economic growth was modest; but this century has brought clear acceleration. As to components of GDP1, the major sectors are:
• financial services, real estate, and accommodations -- 21% • government services -- 14% • manufacturing -- 15% • wholesale and retail trade, catering, and accommodations --
12% • mining -- 5% • transport and communications -- 9% • personal services -- 5%
1 Statistics South Africa , Gross Domestic Product, P0441, issued February 28, 2012. http://www.statssa.gov.za
20 Lachman Associates, LLC
Source: United Nations, World Urbanization Prospects : The 2009 Revision.
Figure 4-1. South Africa's Urban Population
52% 55% 57% 59% 62% 64% 67%
0%
10%
20%
30%
40%
50%
60%
70%
1990 1995 2000 2005 2010 2015 2020

Financial Services
Top-quality financial services have been available in South Africa for a long time – from banks, from life and property casualty insurance companies, from the large stock exchange, and from over 900 mutual funds, which are known as unit trusts. In its July 2011 Consultation with South Africa, the International Monetary Fund made the following assessments: “Having come through the recession in reasonable shape, the financial sector is now contending with a period of low credit demand and rising costs. Proactive bank supervision, low dependency on external funding, and conservative risk management have contributed to banks’ resilience in recent years...The limited impact of the recession on impairments likely reflects the limited access to credit of low-skilled workers among whom most of the job losses were concentrated…Growth in credit declined with the fall in private investment and as banks sought to increase liquidity. But more recently, credit growth has resumed at a moderate pace…South Africa’s position in the cycle has not so far exposed the banking system to the risks associated with periods of easy external financial conditions.”2
Over 80% of South Africa’s banking sector assets are accounted for by four global banks: Standard Bank , ABSA , FNB (FirstRand), and Nedbank.
Annually since 2003, FinMark Trust has conducted a national survey to measure the access to financial services of South Africans age 16 and over. The 2011 survey revealed that 73% of South African adults were financially included (i.e., using some financial product or service from either the formal or informal sectors); 68% 2 International Monetary Fund, South Africa Staff Report for the 2011 Article IV Consultation, July 7, 2011, p. 9-10., 24-25
Lachman Associates, LLC 21
had/used formal financial products, i.e., products from either a bank or another formal financial institution such as a microfinance company, private money lender or insurance company.”3 Three-fourths of the individuals using informal products also use formal ones. In 2011, only 5.5% of adults relied exclusively on the informal sector. Manufacturing
The diversified manufacturing sector accounts for 14% of South Africa’s employment. Six industries dominate the country’s manufacturing:
• Automotive • Chemicals • Metals • Textiles, clothing and footwear • ICT and electronics • Agriprocessing
Information and communications technology (ICT) and agriprocessing will be covered later. The other four industries are highlighted below:
• Automotive The automotive industry is the single biggest contributor to South Africa’s manufacturing sector. Global car and truck manufacturers source components and assemble vehicles in South Africa for both local and international markets.
3 Finmark Trust, Finscope South Africa 2011, December 7, 2011.

Vehicle and parts manufacturing, distributing, and servicing comprise the third largest sector in the economy, after financial services and mining. The industry contributes about 6% to GDP and 12% to exports. Recessionary cuts in consumer demand hurt auto sales globally, and South Africa was not immune. Vehicle production fell from 534,000 in 2007 to 374,000 in 2009, but rose again to 472,000 in 2010. The National Association of Automobile Manufacturers of South Africa anticipates production of a million vehicles annually by 2020; current capacity is estimated at more than 500,000. Auto exports are growing: just over 110,000 units sent outside the country as recently as 2004, increasing to 284,000 by 2008. Exports fell to 175,000 in 2009 because of the recession, but shipments rebounded to 239,000 a year later, due to growth in demand from emerging markets. South African exports to Japan, Australia, the United Kingdom, and other right-hand drive locations are significant. The biggest players in the South African auto industry are Toyota, Volkswagen, Mercedes-Benz, and BMW. Many of the major multinational companies use South Africa to source components and assemble vehicles for both the local and overseas markets. Tata opened a truck plant near Pretoria in 2011. An electric car is being developed for production in 2014 or 2015.4
The auto industry is concentrated in the Port Elizabeth area of the Eastern Cape and in Gauteng, which includes greater Johannesburg and Pretoria.
4 South African Business 2011/12, p.86-87; www.southafrica.info
• Chemicals Chemical production is South Africa’s fifth largest export sector. Products include fine and specialty chemicals, polymers, pharmaceuticals, fertilizers, synthetic coal, and natural gas-based liquid fuels. The industry is complex and diversified. In 2010 the industry contributed 5% to GDP and 23% of manufacturing sales.5
Among the key players are Sasol (through Sasol Chemical Industries and Sasol Polymers), AECI, Omnia Group (Protea), and Dow Sentrachem.. Many multi-national companies operate in South Africa as manufacturers or distributors, including Air Products, Bayer, BASF, Buckman, DuPont, Huntsman Tioxide, Lanxess, Merch, and Rohm and Haas (now part of Dow).
• Metals This large, well-developed industry draws upon South Africa’s vast natural resources and comprises iron ore and steel, basic non-ferrous metals, and metal products. The metals sector represents about one-third of South Africa’s manufacturing and provides a bridge between mining and automotive parts/vehicle production.
According to the South African Iron & Steel Institute, South Africa is the world’s 21st largest crude steel producer, and manufactured 47% of the African continent’s total steel output in 2010. The industry produces a wide range of carbon and alloy primary steel products as well as semi-finished and primary stainless steel goods.
5 Chemical and Allied Industries’ Association, www.caia.co.za
22 Lachman Associates, LLC

Lachman Associates, LLC
Under apartheid, when the country tried to be as self- sufficient as possible, small metals firms were spread across South Africa. Over the last 18 years, they’ve had to adapt to competitive pricing and production standards.
• Textiles, Clothing and Footwear This sector is intensely competitive globally and has become increasingly capital intensive. South Africa’s production has focused on the local consumer. As cheap imports from China and India eroded local market share, the textile and clothing industry moved up-market and attempted to compete with exports to Europe and the U.S.
Outsourcing
South Africa’s growing strength in business process outsourcing draws heavily upon the country’s long-term sophistication in financial services. Time-zone compatibility with Europe, high rates of fluency in English, neutral English accents, and an advanced telecommunications industry also contribute to the appeal of this destination for processing of after-sales service, data capture and conversion, accounting, benefits administration, human resource functions, and website design and development. Both Cape Town and Johannesburg are call center hubs. “For international firms, South Africa slots in between near-shore locations such as Canada, Mexico, or Eastern Europe, which offer close proximity as well as cultural affinity to domestic markets, and more traditional offshore locations, such as India and the Philippines, that offer cheap labour.”6Although South Africa’s labor costs are higher, Cape Town has proven attractive for complex, voice-based services in insurance and other financial businesses. 6 www.southafrica.info
Telecommunications
South Africa offers full technological support for outsourcing. Not only is the country Africa’s leader in information and communications technology (ICT), it is the world’s 20th largest consumer of IT products and services. South Africa’s IT industry is characterized by technology leadership, particularly in the field of electronic banking services. South African companies are world leaders in pre-payment, revenue management and fraud prevention systems, and in the manufacture of set-top boxes, all exported successfully to the rest of the world.”7 Internet and cellular telephone penetration in South Africa is among the highest in the world. Because of the country’s broad geographic spread, digital microwave, satellite, and optical fiber serve as main transmission media for the network connecting the major business and population centers.
Tourism
Three-fourths of tourist activity is domestic; however, South Africa also attracted about 8.1 million foreign tourists in 2010, according to the UN World Tourism Organization. That was a 15% increase over 2009, resulting in part from the waning of the global recession and partly from the World Cup. The latter drew over 309,000 visitors, of whom 90% said they would like to return. According to the World Travel and Tourism Council, travel-related business directly accounted for 3.9% of the country’s total employment in 2011; but when indirect or multiplier effects are included, the proportion rises to 9%. Overall, travel and tourism accounts for 8.6% of GDP.
7 “ICT and Electronics in South Africa ,” www.southafrica.info
23

Tourism is heavily concentrated in Gauteng and Western Cape Provinces. According to Statistics South Africa, the origins of 2010 international visitors were as follows:
The top five individual overseas markets are the United Kingdom, the United States, Germany, the Netherlands, and France, all of which declined during the global recession. African tourism picked up the slack. Although Europeans and Americans will probably be back in large numbers, the emerging markets from the standpoint of percentage gain are Brazil, China, India, and Nigeria. Conference, convention, and business tourism is growing steadily. With its diverse topography and long coastline, South Africa serves a broad range of tourism niches – from eco- and cultural tourism through adventure, sport, and paleo-tourism. The country has 21 national parks, including the world-famous Kruger National Park, and extensive protected marine areas. The country’s private game lodges have expanded substantially in the last 13 years and many are decidedly upmarket. The luxury lodges cater almost exclusively to foreign tourists.
Mining & Quarrying
Although mines employ fewer than 350,000 people, most foreigners think of gold and diamonds as soon as South Africa is mentioned. In fact, gold and platinum generate half the revenues in this sector. As a result, mining was hit hard by the global recession.
24 Lachman Associates, LLC
The country holds the world’s biggest reserves of: • Gold • Platinum • Chrome ore • Manganese ore
It has the second largest reserves of: • Vanadium • Zirconium • Titanium
It has the world’s fourth largest coal reserve, and also produces diamonds, iron ore, nickel, phosphates, tin, uranium, copper, salt, and natural gas. “Apart from its prolific mineral reserves, South Africa’s strengths include a high level of technical and production expertise and comprehensive research and development activities. . . . Lucrative opportunities exist for downstream processing and adding value locally to iron, carbon steel, stainless steel, aluminum, platinum group metals, and gold.”8
Since 1994, mining companies have made substantial capital investments, often substituting machines for people – partly to improve productivity and partly to facilitate deeper penetration in the earth. Because mines are typically in remote parts of the country, displaced workers have to relocate to find new jobs.
Agriculture
South Africa has a dual agricultural economy, with well-developed, corporate-type farming/fishing and with subsistence-based production in remote rural areas. Thanks to its counter-seasonality, Europe is South Africa’s primary export market for a wide range of\
8 “Mining and Minerals in South Africa ,” www.southafrica.info
Origin % of Total Tourists Africa & Middle East 72Europe 16Asia/Australasia 5Americas 6Total 99
products: avocados, grapefruit, tangerines, plums, pears, table grapes, wine, fruit juices, and flowers.
Agriprocessing is an important offshoot of this industry – everything from meat and dairy processing to wine making, herbal beverages, and ostrich products.
Despite increased mechanization, agriculture still employs more than 600,000 South Africans.
Total Employment
Figure 4-2 presents information on changes in total employment by industry (both formal and informal) over the last six years. While the numbers vary from year to year, the trends show a declining share of employment in agriculture, mining, and manufacturing, and an increasing share in financial and personal services. This reflects a maturing economy. The effects of the recession are reflected in the loss of jobs between March 2009 and 2010.
Global Competitiveness
The World Economic Forum in Davos, Switzerland, evaluates 142 global economies according to a competitiveness index developed by Professor Xavier Sala-i-Martin, an expert on growth and economic development. The 2011-12 results for the top 90 economies are shown in Figure 4-3. South Africa is number 50, having moved up four slots since the 2010 rankings were issued. Although considerably below China, South Africa is now ranked above Brazil (53), India (56), Mexico (58), and Russia (66). The next highest rankings in sub-Saharan Africa are Mauritius (54), Rwanda (70), Botswana (80), and Namibia (83).9 The World Economic Forum sees this index as determining the level of a country’s productivity. The index is built on twelve pillars:
• Institutions • Infrastructure • Macroeconomic environment • Health and primary education • Higher education and training • Goods efficiency • Labor market efficiency • Financial market development • Technological readiness • Market size • Business sophistication • Innovation
Quantitative factors within these twelve pillars are grouped to create three sub-indices that aggregate up to the overall Global Competitiveness Index.
Bottom line, “the most competitive economies in the world will typically be those where concerted efforts have been made to frame policies in a comprehensive way, that is, those which recognize the importance of a broad array of factors, their interconnection, and the need to address the underlying weaknesses they reveal in a proactive way.”10 It is fair to say that South Africa is doing a good job of this, despite inherited social issues that are being addressed aggressively.
9 World Economic Forum, The Global Competitiveness Report 2011-2012, p.15. 10 World Economic Forum, The Global Competitiveness Report, 2006-2007, Executive Summary.
25 Lachman Associates, LLC

Lachman Associates, LLC 26
Figure 4-2. South African Employment by IndustryAs of First Quarter, 2006-2011
Change Change2006 2007 2008 2009 2010 2011 2006-2011 2010-2011
Agriculture (1) 886 703 799 738 658 603 (283) (55) Mining and quarrying 362 411 333 333 303 313 (49) 10 Manufacturing 1,981 1,979 1,988 1,882 1,755 1,803 (178) 48 Electricity, gas, and water supply 92 88 95 100 72 97 5 25 Construction 929 1,010 1,112 1,126 1,060 1,031 102 (29) Wholesale and retail trade 3,377 3,273 3,156 3,021 2,882 2,962 (415) 80 Transport, storage, and communication 671 701 747 757 797 727 56 (70) Financial intermediation (2) 1,326 1,470 1,667 1,725 1,681 1,631 305 (50) Community, social, and personal services 2,325 2,440 2,564 2,651 2,695 2,828 503 133 Private households and other 1,288 1,251 1,163 1,304 1,173 1,123 (165) (50) Total 13,237 13,326 13,623 13,636 13,076 13,118 (119) 42
2006 2007 2008 2009 2010 2011Agriculture (1) 6.7% 5.3% 5.9% 5.4% 5.0% 4.6%Mining and quarrying 2.7% 3.1% 2.4% 2.4% 2.3% 2.4%Manufacturing 15.0% 14.9% 14.6% 13.8% 13.4% 13.7%Electricity, gas, and water supply 0.7% 0.7% 0.7% 0.7% 0.6% 0.7%Construction 7.0% 7.6% 8.2% 8.3% 8.1% 7.9%Wholesale and retail trade 25.5% 24.6% 23.2% 22.2% 22.0% 22.6%Transport, storage, and communication 5.1% 5.3% 5.5% 5.6% 6.1% 5.5%Financial intermediation (2) 10.0% 11.0% 12.2% 12.7% 12.9% 12.4%Community, social, and personal services 17.6% 18.3% 18.8% 19.4% 20.6% 21.6%Private households and other 9.7% 9.4% 8.5% 9.6% 9.0% 8.6% Total 100.0% 100.0% 100.0% 100.0% 100.0% 100.0%
(1) Includes hunting, forestry, and fishing(2) Includes insurance, real estate, and business servicesBased on household sample surveys; includes only persons ages15-64.
Source: Statistics South Africa, Quarterly Labor Force Survey , P0210 and P0211

Lachman Associates, LLC 27
Figure 4-3. Global Competitiveness Index 2011-2012 Rankings*
*Top 90 (out of 142) countries. Source: World Economic Forum, The Global Competitiveness Report 2011-2012, p 15.
Rank Score Rank ScoreSwitzerland 1 5.74 1 1 Indonesia 46 4.38 44 54Singapore 2 5.63 3 3 Cyprus 47 4.36 40 34Sweden 3 5.61 2 4 Hungary 48 4.36 52 58Finland 4 5.47 7 6 Panama 49 4.35 53 59United States 5 5.43 4 2 South Africa 50 4.34 54 45Germany 6 5.41 5 7 Malta 51 4.33 50 52Netherlands 7 5.41 8 10 Sri Lanka 52 4.33 62 79Denmark 8 5.40 9 5 Brazil 53 4.32 58 56Japan 9 5.40 6 8 Mauritius 54 4.31 55 57United Kingdom 10 5.39 12 13 Azerbaijan 55 4.31 57 51Hong Kong SAR 11 5.36 11 11 India 56 4.30 51 49Canada 12 5.33 10 9 Slovenia 57 4.30 45 37Taiwan, China 13 5.26 13 12 Mexico 58 4.29 66 60Qatar 14 5.24 17 22 Turkey 59 4.28 61 61Belgium 15 5.20 19 18 Montenegro 60 4.27 49 62Norway 16 5.18 14 14 Costa Rica 61 4.27 56 55Saudi Arabia 17 5.17 21 28 Iran, Islamic Rep. 62 4.26 69 n/aFrance 18 5.14 15 16 Uruguay 63 4.25 64 65Austria 19 5.14 18 17 Latvia 64 4.24 70 68Australia 20 5.11 16 15 Vietnam 65 4.24 59 75Malaysia 21 5.08 26 24 Russian Federation 66 4.21 63 63Israel 22 5.07 24 27 Peru 67 4.21 73 78Luxembourg 23 5.03 20 21 Colombia 68 4.20 68 69Korea, Rep. 24 5.02 22 19 Slovak Republic 69 4.19 60 47New Zealand 25 4.93 23 20 Rwanda 70 4.19 80 n/aChina 26 4.90 27 29 Jordan 71 4.19 65 50United Arab Emirates 27 4.89 25 23 Kazakhstan 72 4.18 72 67Brunei Darussalam 28 4.78 28 32 Morocco 73 4.16 75 73Ireland 29 4.77 29 25 Bulgaria 74 4.16 71 76Iceland 30 4.75 31 26 Philippines 75 4.08 85 87Chile 31 4.70 30 30 Croatia 76 4.08 77 72Oman 32 4.64 34 41 Romania 77 4.08 67 64Estonia 33 4.62 33 35 Albania 78 4.06 88 96Kuwait 34 4.62 35 39 Macedonia, FYR 79 4.05 79 84Puerto Rico 35 4.58 41 42 Botswana 80 4.05 76 66Spain 36 4.54 42 33 Trinidad and Tobago 81 4.00 84 86Bahrain 37 4.54 37 38 Ukraine 82 4.00 89 82Czech Republic 38 4.52 36 31 Namibia 83 4.00 74 74Thailand 39 4.52 38 36 Guatemala 84 4.00 78 80Tunisia 40 4.47 32 40 Argentina 85 3.99 87 85Poland 41 4.46 39 46 Honduras 86 3.98 91 89Barbados 42 4.44 43 44 Algeria 87 3.96 86 83Italy 43 4.43 48 48 Georgia 88 3.95 93 90Lithuania 44 4.41 47 53 Lebanon 89 3.95 92 n/aPortugal 45 4.40 46 43 Greece 90 3.92 83 71
CountryGCI 2011-2012 GCI 2010-
2011 RankGCI 2009-2010
rank* CountryGCI 2011-2012 GCI 2010-2011
RankGCI 2009-2010
rank

External Evaluations • OECD • International Monetary Fund
Section 5
28 Lachman Associates, LLC

Lachman Associates, LLC 29
OECD Executive Summary of OECD Economic Surveys: South Africa, July 2010, pp. 8-9. A strong macroeconomic policy framework has helped to improve growth performance over the past two decades, but the 2008-09 downturn highlighted the limitations of the domestic demand-led growth path which has characterised South Africa in recent years. Unemployment, which had remained very high, if declining, throughout the boom years, turned up again in the recession. There is now a need both to ensure a rapid recovery from the downturn and to boost trend growth and thereby create the millions of jobs required to make full use of South Africa’s large supply of underutilised human resources.
The global downturn struck South Africa when it had already passed the boom, and the economy slowed sharply, experiencing its first recession in 17 years. The decline in output was moderated by a countercyclical policy response, made possible by past fiscal prudence, and by the resilience of the banking system, which did not experience a crisis. Growth has resumed and is projected to accelerate, but macroeconomic policy stimulus should be removed only gradually, as a self-sustaining recovery, led by the private sector, takes hold.
Evidence suggests several ways to improve South Africa’s trend growth performance. Notably, all economies experiencing successful rapid economic development in recent decades have had much higher savings and investment rates and stronger export growth than South Africa, and policy action to increase saving and strengthen export performance are therefore warranted. South
Africa should do more to resist waves of real appreciation of the rand associated with surges in private capital inflows, which are largely driven by investor sentiment towards emerging markets in general, and commodity plays in particular. Tighter and more countercyclical fiscal policy, verbal and foreign intervention, and liberalisation of capital outflows all have a role to play. Another key to better trend growth is reform of the regulatory environment. South Africa has low levels of competition and relatively restrictive product market regulation, which hampers more broad based innovation. OECD research suggests that lowering barriers to entrepreneurship could substantially boost South Africa’s long-term growth rate.
The macroeconomic framework is strong, but can be improved. South Africa has a good track record of fiscal prudence, but, as in other countries, fiscal discipline was eroded in the cyclical upswing. South Africa would therefore benefit from stronger fiscal institutions to prevent unwarranted fiscal expansion when the economy is strong. The monetary policy framework is sound, but could be refined to bolster the credibility of the inflation targets and to exploit scope for limiting exchange rate fluctuations, to the extent this is compatible with achieving the primary goal of keeping inflation within the target range.
Labour market reforms should complement improved macroeconomic policies to deliver higher employment. A greater level of co-ordination of wage bargaining focusing on wage and price moderation as the ultimate goal, with the government providing a voice for labour market outsiders, could deliver greater wage moderation and increase the credibility of the inflation target.

Limiting the legal extension of sectoral bargains would also foster wage moderation and lead to stronger job creation, particularly among smaller and medium sized firms. Other important measures to raise unemployment over the long term include improved basic education, reduced spatial mismatches between jobseekers and jobs, and better access to credit for small enterprises. Within an overall employment strategy, measures should be targeted at tackling youth unemployment. These could include job search assistance, training-based wage subsidies, age-differentiated minimum wages and extended probationary periods for young workers.
International Monetary Fund Public Information Notice (PIN) No. 11/115 August 25, 2011
Excerpts from: “2011 Article IV Consultation with South Africa” 1
On July 25, 2011, the Executive Board of the International Monetary Fund (IMF) concluded the Article IV consultation with South Africa.
Background Over the last two decades, South Africa has become increasingly integrated into the global economy, which has allowed output growth to converge to the world average level. But this integration has also exposed South Africa to global business cycles. Prudent countercyclical monetary and fiscal policies, together with a flexible exchange rate, have helped dampen the adverse effects of
30 Lachman Associates, LLC
financial institutions in managing the associated risks. And although transfer programs have lifted the most vulnerable from extreme poverty, progress in social indicators has lagged behind macroeconomic achievements. Over the last year, South Africa’s has continued to recover from the 2008–09 recession led by solid consumption growth. Although its gross domestic product (GDP) now exceeds the pre-crisis peak, output remains below potential. Inflation has remained contained, partly reflecting the negative output gap, rand appreciation, and, until recently, moderate domestic food prices. The current account has strengthened on account of favorable terms of trade, which offset a faster recovery in import than in export volumes. Fiscal and monetary policies have remained supportive. In cyclically adjusted terms, the deficit swung from a surplus in fiscal year 2007/08 (April-March) to a deficit in 2009/10, and staff estimates the deficit at some 4 percent in 2010/11. Spending growth moderated in 2010, and became more tilted toward current spending, mainly reflecting above-budgeted increases in wages. Monetary policy provided additional stimulus, with a 150-basis-point cut in the policy rate in 2010. These cuts have brought the policy rate to 5.5 percent, its lowest level in more than 30 years.
1 Under Article IV of the IMF's Articles of Agreement, the IMF holds bilateral discussions with members, usually every year. A staff team visits the country, collects economic and financial information, and discusses with officials the country's economic developments and policies. On return to headquarters, the staff prepares a report, which forms the basis for discussion by the Executive Board. At the conclusion of the discussion, the Managing Director, as Chairman of the Board, summarizes the views of Executive Directors, and this summary is transmitted to the country's authorities. An explanation of any qualifiers used in summings up can be found here: http://www.imf.org/external/np/sec/misc/qualifiers.htm.
31 Lachman Associates, LLC
With public debt at manageable levels and contained demand pressure, the authorities’ fiscal plans call for fairly gradual fiscal consolidation. This would result in gross national government debt peaking at around 43 percent of GDP in 2013/14. Although this path would not pose immediate risks to fiscal sustainability, it could constrain fiscal space to deal with future shocks. On monetary policy, although further interest rate cuts are no longer on the horizon and headline inflation has been picking up, the timing for starting the tightening cycle remains unclear because most of the increase in headline inflation reflects cost-push factors and uncertainty in the external environment is high.
Having come through the recession in reasonable shape, the financial sector is now contending with a period of low credit demand and rising costs. Banks have remained well capitalized and liquid, with well contained market risks. The move toward a “twin peaks” regulatory and supervisory framework over the next few years, which strives to concentrate prudential authority at one peak and market conduct authority at another, bodes well for further improving the consolidated supervision of financial groups.
The medium-term outlook envisages South Africa growing on par with the world economy. Growth should rise to 4 percent a year in 2011 and 2012, underpinned by solid domestic demand. Over the next 12 months, the output gap is set to close and there is a possibility that headline inflation will breach the top of the target range. The expected recovery in investment will likely cause the current account deficit to gradually further widen to about 5–6 percent over the medium term.
Executive Board Assessment Executive Directors commended the authorities for the prudent macroeconomic policies which, together with a flexible exchange
rate and sound financial sector, have mitigated the output drop during the global recession. Directors noted that the key challenges ahead are to support the ongoing recovery and raise growth to reduce high unemployment and inequality. In this regard, Directors welcomed the authorities’ New Growth Path which focuses on these priorities.
Directors supported a broadly neutral fiscal stance for 2011/12 and welcomed the prudent fiscal policy guidelines included in the 2011 budget. They agreed that, over the medium term, a tighter fiscal stance than currently contemplated would be useful to rebuild policy buffers and contain public debt at moderate levels. Directors encouraged the authorities to rebalance the composition of public spending to help support higher potential growth, and called for moderation in public wage growth.
Directors endorsed South Africa’s inflation targeting framework, noting that it has kept inflation expectations well anchored. While recognizing the difficulties in determining the precise timing for starting the tightening cycle in light of the uncertain global environment, Directors encouraged the authorities to remain vigilant about the pass through of high international food and fuel prices. In this context, they noted that a pronounced increase in wages or inflation expectations would call for policy tightening sooner than currently envisaged.
As a policy response to capital inflows, Directors supported continued exchange rate flexibility and further accumulation of international reserves, and a gradual recalibration in the fiscal-monetary policy mix over the medium term. Directors noted that, while capital flow management measures are an option, their costs and effectiveness should be carefully considered.

Lachman Associates, LLC 32
Directors stressed that increased product and labor market flexibility is critical to improve competitiveness and inequality. They encouraged the authorities to take decisive steps to improve the wage-bargaining framework to better align wages to productivity levels, and to contain public sector wage increases to avoid distortions in the private sector wage setting. They also supported more ambitious efforts to remove barriers to entry in key industries to facilitate greater product market competition.
Directors noted that the banking system remains sound, with banks being liquid and well capitalized. Nevertheless, continued vigilance would be important in light of the moderate impaired advances on bank balance sheets, the banks’ dependence on domestic short-term wholesale deposits, high household indebtedness, and the renewed tensions in the international financial markets. Directors agreed that the shift toward a “twin peaks” regulatory and supervisory framework envisaged over the next few years would further improve the consolidated supervision of financial groups and lift the status of market conduct regulation and supervision.

Social Issues • Unemployment • Education/Skills Shortage • AIDS
Section 6
33 Lachman Associates, LLC

Unemployment South Africa’s very high unemployment is largely attributable to residential patterns dictated by apartheid, to the transition to a globally competitive economy since 1994, and to demographics. As shown in figure 6-1, the unemployment rate among working age South Africans (15-64) has stayed above 23% for a decade. At the end of 2011, the overall unemployment rate was 23.9% of the working-age population (15-64). When those who have given up looking for work are included, nearly 37% of the workforce was without employment. Male unemployment trended down until 2007 and then reversed with the recession. By the fourth quarter of 2011, it was down again, to 21.8%. Female unemployment is consistently higher. Adcorp, a private employment and outsourcing firm , noted in February 2012 that : “Temporary work now represents 3.87 million workers, or 30.1% of the workforce.” 1 Proposed legislation could drastically alter the situation for temporary workers by requiring that their jobs be made permanent and that they be provided with the same medical and pension benefits as their permanent peers. Businesses contend this will hamper job creation. 1 “Adcorp Employment Index Report,” February 2012, p. 1.
34 Lachman Associates, LLC
The financial impact of unemployment on households is not quite as dire as one might presume because an indeterminate number of unemployed people live within families receiving Older Persons Grants . This government program assures monthly income to men and women over 60. In 2011, the payment was R1,140 per month, or R13,680 per year. Under apartheid, this social grant system was only available to whites; but it became universal in democratic South Africa. Over 10 million South African citizens - nearly one-in five - receive social grants of one kind or another. 2 An unintended consequence of the expanded social grant coverage is that young people who live with older parents or grandparents can get along without a job – if their elders are willing to support them. Such young people can also be discriminating about the pay they find acceptable: their so-called “resistance wage” can be higher than if they were living independently. Examples abound of younger people who do not look seriously for jobs until their grandparents die and they are forced to be self-supporting.
2“Adcorp Employment Index Report,” December 2011, p. 2.
Figure 6-1. South African Unemployment Rates
Source: Statistics South Africa
Unemployment Rates as of the First QuarterFourth
Quarter2002 2003 2004 2005 2006 2007 2008 2009 2010 2011 2011
Male 24.4% 25.5% 22.6% 20.4% 19.4% 19.3% 20.6% 21.2% 23.2% 22.2% 21.8%Female 31.5% 33.6% 30.7% 28.6% 27.3% 28.4% 26.9% 26.2% 27.5% 28.2% 26.5%Total 27.7% 29.3% 26.4% 24.2% 23.1% 23.6% 23.5% 23.5% 25.2% 25.0% 23.9%

In reflecting on this unique social program, the authors of a 2006 Harvard study observed: “This policy may be part of the reason that South Africa has been able to withstand persistent high unemployment rates with relatively little social unrest.”3
In addition to government support for older citizens, 60% of employees in the formal sector are covered by pension plans. Unionization is extensive – about 25% of formal sector employees – so that keeps wages and benefits relatively high. Nonetheless, private pensions are skewed toward higher-income workers. Two-thirds of South Africans reach retirement age without a funded pension benefit and rely instead on the Older Persons Grant.
Among the apartheid-related issues contributing to today’s unemployment are the following:
• Agriculture and mining were major employment categories in pre-democratic South Africa. Both have declined as mechanization replaced humans. When mines become extremely deep, machines can remove ore that hand labor cannot reach.
Mining and agricultural activities occur outside urban areas – and often at remote locations. Consequently, workers losing their jobs are not close to contemporary, replacement employment. In fact, some traditional homelands were placed near mines and large farms; because of their distant and stigmatized locations, employers are unlikely to migrate to the former homelands.
• Apartheid meant apartness, so urban areas were intentionally low density and sprawling, with far out townships created for black residents. Black Africans were not allowed to enter central business districts unless they were working there.
3 Banerjee, Abhijit , et . al., “Why Has Unemployment Risen in the New South Africa?” p. 59.
Lachman Associates, LLC 35
Close-in residential development was limited. This urban layout does not easily accommodate today’s growth in office service jobs. A lot more workforce housing is needed near commercial employment centers.
• Compulsory education through the 10th grade was not mandated until 1994. Therefore, today’s youngest job seekers may be better prepared than other people with prior work experience but minimal formal education. As discussed in the next section, education remains South Africa’s Achilles' heel.
The structural shift in South Africa’s economic base away from agriculture and toward sophisticated manufacturing and financial services carries a bias toward skilled labor, and it takes time to train and retrain a large share of the workforce. That process is underway but progressing more slowly than was hoped.
• Prejudice does not disappear by fiat. As a result, many non-black employers do not believe black Africans can perform available jobs. In turn, many blacks believe they will be discriminated against and don’t apply for jobs that may be offered by non-prejudiced whites.
• Under apartheid, black Africans were discouraged from entrepreneurial activities, so South Africa’s informal economy is smaller and less vibrant than in other developing countries. Nonetheless, the informal economy provides subsistence or second jobs to unskilled or semi-skilled workers. Traditionally, a high proportion of South Africa’s informal jobs have been domestic employment, and those positions are gradually declining.

Over 30% of the unemployment increase is attributable to demographics, particularly the entry of women and young people into the labor force. Just under 60% of unemployed persons have never worked before, and most are young. About two-thirds report looking for jobs for over a year. (Some may have unrealistic wage expectations – and are holding to those views because they are living with parents or grandparents who are providing support.) Needless to say, large numbers of unemployed, male youth lead to higher crime, especially theft.
The job search process can be expensive and intimidating for people located at some distance from central cities and close-in suburbs, where financial and government jobs tend to be concentrated. Again, creation of affordable urban housing is a critical piece of the employment puzzle.
Education/Skills Shortage
Despite consuming over 20% of South Africa’s budget, education remains “in crisis” and will probably take a generation to fix. Half of all students drop out of school before taking the matriculation exam. Of those who sat for the exam in November 2010, the pass rate was 68% -- even though the required pass mark is only 30-40%. As reported in The Economist, “Two-thirds of state schools have no library or computer; 90% have no science laboratory; more than half of all pupils either have no text books or have to share them.”4 Public schooling did not become mandatory for blacks until 1994, and the country has been severely challenged to provide adequate schools and, more importantly, teachers for all its young people. Sadly, the South African Democratic Teachers Union focuses on pay increases and reduction of teaching hours instead of such issues 4 “South African Schools: E for Education,” The Economist, Jan. 13, 2011.
Lachman Associates, LLC 36
as teacher quality, classroom discipline, and improvement of student performance. Training and retention of high-quality teachers should be one of the government’s top priorities. As a 2010 OECD report observes, “Employment strategies have put relatively little emphasis on basic education, the inadequate quality of which is probably the biggest factor in the skills mismatch confronting the country. Basic education is probably a bigger issue than training, but one which may take decades to turn around.”5
Only one-tenth of South African students qualify for university admission and only one-fifth of these students end up with a degree. Although blacks now constitute one-half of university students, fewer than one of 20 blacks in the relevant age bracket gets a degree, compared to almost half the whites of the same age.
Meanwhile, South Africa’s economic structure is more skill-intensive:
• When local companies began competing globally, production had to become cost-effective, which often necessitated mechanization.
• Agriculture and mining are now more capital-intensive and far less labor intensive.
• As the economy shifts from goods production to services, there is a loss of manufacturing employment.
The shortage of skilled labor, particularly people with professional and managerial capabilities, is reflected in extremely low unemployment rates in these categories. Meanwhile unemployed, unskilled labor abounds. Although both issues need to be addressed, many observers believe that the government should work on a growth strategy that provides low-skill employment.
5 OECD Economic Surveys: South Africa, 2010, p. 111.

37 Lachman Associates, LLC
HIV/AIDS
AIDS and the number of people infected with HIV are challenging social issues for South Africa. In 2009, the United Nations estimated that 5.6 million South Africans were living with HIV – roughly 11% of the population. Of those, 1.2 million are now receiving antiretroviral treatment (ART). The government plans to raise that number to 2.6 million by 2013/14. A few additional observations:
• Of the 5.6 million infected people, over one million are under 25 years of age.
• Between 1997 and 2004, the death rate among men in their 30s more than doubled.
• For women between 25 and 34, it more than quadrupled. • 1,000 people die each day from the disease. • The UN estimates that 18.9% of adults age 15 to 49 are
infected with HIV/AIDS. That summarizes the grim news, which was compounded for many years by the government’s refusal to acknowledge that HIV leads to AIDS and that herbal remedies do little to prolong life. This type of denial reinforced the stigma of AIDS and allowed the government to avoid the costs of prevention, treatment, and support of surviving family members. Thankfully, that phase is over. Affordable antiretroviral treatment is much more readily available, and infected people are encouraged to use the treatment. This will prolong life and enable workers to lead productive lives instead of using up their sick time and then wasting away in the homes of relatives who often exhaust their own resources to provide support.
Macroeconomic Impact of HIV/AIDS The Bureau for Economic Research (BER) at University of
Stellenbosch issued a major study in June 2006 focused on the broad economic impacts of AIDS on South Africa, with and without antiretroviral treatment. Among their conclusions are the following:6 “Provision of ART with a 50% uptake could reduce the impact of HIV/AIDS on economic growth by, on average, 17% between 2000 and 2020, or from a projected impact of -0.46% to -0.38%.” “On a macroeconomic level, the benefits of providing ART (in terms of economic growth ‘saved’) far outweigh the costs.” About 10% of South Africa’s adult population is covered by life insurance; burial policies are very common and more widely distributed. Although mortgage lenders cannot require borrowers to buy life insurance, the perception is that it is a prerequisite. Three out of five mortgage holders are estimated to have life insurance. Clearly, social disruption from the AIDS epidemic will be more severe than direct economic impacts. Nonetheless, the BER report observes: “Life expectancy, a key development indicator, will plunge, infant mortality will rise and the epidemic will compromise educational attainment. Furthermore, HIV/AIDS will worsen poverty and exacerbate the already skew income and wealth distribution in South Africa.… In the end, the epidemic will reverse years of hard-won development progress.”
Although new incidence of the disease is declining, the portion of the population with HIV remains high and annual HIV-related mortality will exceed 300,000 for the next five to 10 years. Nevertheless, now that more infected South Africans are receiving treatment, life expectancy is rising again.
6 University of Stellenbosch , The Macroeconomic Impact of HIV/AIDS under Alternative Intervention Scenarios (With Special Reference to ART), p. 115-117.
South African Real Estate • Commercial • Housing
Section 7
38 Lachman Associates, LLC

Commercial Real Estate in South Africa
For well over 100 years, South Africa has had an active. income-producing, commercial real estate industry with sophisticated equity and debt players. A few highlights:
• Class A office, retail, and industrial properties cater to demanding, high-quality local and international tenants.
• South African returns have been reported through the Investment Property Databank (IPD) for many years. In fact, as discussed below, South Africa has consistently outperformed IPD’s other 22 markets, primarily because income returns are very strong.
• One benefit of being isolated for so long was that advantageous lease terms (for owners) became commonplace. To cover potential inflation, for example, office leases have high annual rent increases. Even though inflation has been in check, the escalations continue.
• Shopping centers are a particularly popular concept – from enclosed super regional and regional malls, to power centers, and down to neighborhood shopping centers. Because of the convenience and security of parking, malls are important dining and entertainment centers across the country. Also, to encourage one-stop shopping, most regional and super regional malls include supermarkets.
• South Africa has a vibrant public real estate market consisting of Property Unit Trusts (PUTs), which are similar to U.S. REITs, and Property Loan Stock companies (PLSs). In 2011, South Africa’s property unit trusts returned 12.2% and property loan stocks yielded 7.7%. Since 2002, market
capitalization of South Africa’s listed property sector has grown nearly tenfold, reaching $137 billion in early 2012.
• There are no restrictions on foreign ownership of commercial properties in South Africa.
Investment Performance
IPD South Africa reported an all-property total return of 10.4% in 2011. Of that total, a strong 8.9% was income, while 1.4% was capital appreciation. From 2003 through 2009, South Africa outperformed all other national markets in the IPD databank. During 2010, only the United Kingdom and the United States had higher total returns – but they were bouncing back from declines that South African owners did not experience. Most global markets were flat. South Africa’s 2011 performance did not reach the 13.3% total return seen in 2010, but compared well with institutional real estate in other countries. Among those for which 2011 results have been released, only Canada, the U.S., and Sweden outperformed South Africa. As seen in Figure 7-1, South African institutional property investments have performed well. Income returns have hovered around 9 to 10% for the last 10 years – and only dropped a bit below that level during the recession. The IPD index covers nearly two-thirds of South African investment properties.
Good returns are reported for all major property types shown, as seen in Figure 7-2. There is little variation among retail, office, and industrial buildings. IPD does not currently calculate returns for multi-unit residential rental properties, though they plan to provide this information in the future Listed apartment funds exist, but there are not yet enough public data to calculate average yields.
39 Lachman Associates, LLC

40 Lachman Associates, LLC
Figure 7-1 SAPOA/IPD South Africa Property Index, 2001-11
Source: South Africa Property Owners Association, Investment Property Databank Ltd., 2012
Figure 7-2 IPD South Africa Total Return (%) by Property Type
Source: South Africa Property Owners Association, , Investment Property Databank Ltd., 2012
2001 2002 2003 2004 2005 2006 2007 2008 2009 2010 2011 Retail 13.2 11 17.3 26.2 32.6 27.4 25.8 11.1 8.9 13.1 10.1
Office 7.7 5.1 8.9 16.6 24.5 24.5 30.5 13.9 8 14 11.2
Industrial 7.5 8.8 17.7 24.4 33.1 31.1 35.3 18.2 8.7 13.6 11.9
Other 9.3 21.3 23.3 28.8 26 22 25.8 19.3 12.2 11.9 6.2
All Property 10.5 9.6 15.3 23.4 30.1 26.7 27.7 12.9 8.8 13.3 10.4
0
5
10
15
20
25
30
35
2001 2002 2003 2004 2005 2006 2007 2008 2009 2010 2011
Total return on all properties owned at least one year
Income return on all properties

Transparency
Jones Lang LaSalle maintains a Real Estate Transparency Index that encompasses 75 countries and territories. Their categorization involves five tiers, ranging from “Highly transparent” to “Opaque.” As one would expect, given South Africa’s inclusion in the IPD data, the country has a relatively high transparency ranking. (See Figure 7-3.) At #23, South Africa is midway in the second best tier of transparency. The BRIC counties (Brazil, Russia, India, and China), as well as Mexico, are all in the third, “semi-transparent” category.
Jones Lang LaSalle’s survey is broken out into five major categories that address unique and separate factors affecting real estate transparency around the globe. The categories are:
• Performance Measurement • Market Fundamentals • Listed Vehicles • Regulatory and Legal Environment • Transaction Process
“Survey questions have been developed for each category to capture the experience and perceptions of senior Jones Lang LaSalle or LaSalle Investment Management personnel working in each country.”1
South Africa receives a perfect 1.00 score on the Listed Vehicles Sub-index; as mentioned, the nation has numerous property unit trusts (PUTs) and property loan stocks (PLSs). On the Regulatory and Legal Sub-index, South Africa ranks seventh highest; and it places 13th in the Performance Measurement Sub-index. None of the BRIC countries appear among the top 20 nations for any of the sub-indices.
1 “Jones Lang LaSalle, Global Real Estate Transparency Index 2010, p. 38.
Property Ownership
Recent history has radically changed property ownership in South Africa, as summarized by the Oxford Business Group:
“Under the old apartheid system, outside the so-called homelands, non-whites were in principle not allowed to own property – although there were exceptions – a factor that meant over 80% of the country’s population was legally excluded from full participation in the real estate market in over 80% of the country. The repeal of this rule in 1989 released an enormous amount of pent-up demand for all kinds of property and land.”
“Yet there was still a major time lag, as many watched and waited to see how the political and social instability of the immediate post-apartheid system played out. Most market watchers say this period ended roughly with the new millennium.”2
The federal government is the largest land owner in the country. Historically, South Africa’s state-owned enterprises controlled enormous undeveloped land holdings, as well as commercial and residential properties. As those agencies are streamlined, land and buildings move into private hands.
The shift to suburban development is described by Oxford Business Group as follows: “Rising crime rates and a feeling of insecurity among many of the country’s white residents and businesses led to a flight out of many central business districts (CBDs) in the 1990s. In Johannesburg, the CBD lost many of its companies to suburbs such as Sandton, which grew astronomically, pulling in flagship companies and even the
2 Oxford, Business Group, Emerging South Africa 2006, p.110.
Lachman Associates, LLC 41

2010 Composite Rank Market
2010 Composite Score
2010 Composite Tier*
2010 Composite Rank Market
2010 Composite Score
2010 Composite Tier*
1 Australia 1.22 1 42 South Korea 3.11 3 2 Canada 1.23 1 43 Russia Tier 3 Cities 3.12 3 3 United Kingdom 1.24 1 44 Macau 3.13 3 4 New Zealand 1.25 1 45 China Tier 1 Cities 3.14 3 5 Sweden 1.25 1 46 Mexico 3.14 3 6 United States 1.25 1 47 Ukraine 3.14 3 7 Ireland 1.27 1 48 Philippines 3.15 3 8 France 1.28 1 49 India Tier 2 Cities 3.17 3 9 Netherlands 1.38 1 50 Bahrain 3.28 3
10 Germany 1.38 1 51 Argentina 3.3 3 11 Belgium 1.46 1 52 Costa Rica 3.32 3 12 Denmark 1.5 1 53 Slovenia* 3.33 3 13 Finland 1.53 2 54 China Tier 2 Cities 3.38 3 14 Spain 1.58 2 55 India Tier 3 Cities 3.39 3 15 Austria 1.71 2 56 UAE - Abu Dhabi 3.45 3 16 Singapore 1.73 2 57 Indonesia 3.46 3 17 Norway 1.75 2 58 Jordan* 3.46 3 18 Hong Kong 1.76 2 59 Oman 3.5 4 19 Portugal 1.82 2 60 Morocco 3.58 4 20 Switzerland 1.87 2 61 Croatia 3.59 4 21 Italy 1.89 2 62 Egypt 3.62 4 22 Poland 1.99 2 63 Saudi Arabia 3.66 4 23 South Africa 2.09 2 64 Qatar 3.7 4 24 Czech Republic 2.15 2 65 China Tier 3 Cities 3.73 4 25 Malaysia 2.3 2 66 Lebanon* 3.78 4 26 Japan 2.3 2 67 Panama 3.85 4 27 Hungary 2.33 2 68 Kuwait 3.9 4 28 Israel 2.38 2 69 Uruguay 3.92 4 29 Greece 2.6 3 70 Kazakhstan 3.93 4 30 Slovakia 2.61 3 71 Colombia 3.96 4 31 Russia Tier 1 Cities 2.64 3 72 Peru 4 4 32 Romania 2.68 3 73 Pakistan 4.18 4 33 Taiwan 2.71 3 74 Venezuela 4.18 4 34 Chile 2.72 3 75 Tunisia* 4.24 4 35 Russia Tier 2 Cities 2.86 3 76 Vietnam 4.25 4 36 Turkey 2.9 3 77 Dominican Republic 4.28 4 37 UAE-Dubai 2.93 3 78 Belarus 4.48 4 38 Brazil 2.95 3 79 Syria 4.65 5 39 Thailand 3.02 3 80 Sudan 4.68 5 40 Bulgaria 3.03 3 81 Algeria 4.74 5 41 India Tier 1 Cities 3.11 3
Lachman Associates, LLC 42
Figure 7-3. Real Estate Transparency Index 2010
*1 = High Transparency; 2 = Transparent; 3 = Semi-Transparent; 4 = Low Transparency; 5 = Opaque Source: Jones Lang LaSalle, LaSalle Investment Management.

stock exchange. Similar processes happened in both Cape Town and Durban.”3
Key Commercial Markets
The three largest concentrations of institutional-grade real estate are in Johannesburg, which is the financial, commercial, and manufacturing hub; Durban, which contains Africa’s largest port; and Cape Town, which houses three of the most substantial insurance firms and is a popular tourism center. Figure 7-4 summarizes the prevailing capitalization rates at the end of 2011 for various types of institutional real estate.
3 Ibid.
Retail
As is often true in other countries, prime super regional malls demand the highest prices. According to the “Broll Retail Barometer” for the fourth quarter of 2011, nominal retail sales were up 11.4% year over year. Consumption growth was projected at 4.4% for all of 2011 and 3.7% in 2012. The South African Property Owners Association (SAPOA) indicates that shopping center rents rose 5.5% or more, depending on the type of center, in 2011. Global store chains are looking to expand in South Africa, which is helping to fuel demand for space.
At year end 2011, SAPOA reports that vacancy in super regional malls was a very low 1.8%; the figure was 3.0% for regionals, 3.4% for small regionals, and 4.3% among community centers. The amount of new space being developed in 2011 was limited; the pipeline of future projects had contracted due to the 2009-10 recession. Although rents were flat in 2011, the lack of new supply suggests that there will be upward pressure on rents in 2012 and 2013. Office
The vast majority of the country’s office space is in the greater Johannesburg area, which contains well over 200 million square feet. Although the median cap rate for Johannesburg CBD buildings is shown as 11.0% in Figure 7-4, offices in prime suburban buildings sell at 9.5%, and even lower in Sandton – the most appealing business suburb. Next best is prime space in the Cape Town suburbs, where the median cap rate is 9.63%. In the Cape Town CBD, the median is 10.25% but some buildings do as well as 8.5%. Prime office buildings in suburban Pretoria sell for 9% to 10%. In general, cap rates have risen since November 2010.
43 Lachman Associates, LLC
Figure 7-4. Market Capitalization Rates
Source: SAPOA/IPD, “Capitalization and Discount Rate Survey,” November 2011
Retail Minimum Maximum Median Super Regional Mall 6.25% 14.00% 7.38% Community Shopping Center 8.00% 10.00% 9.50% Neighborhood Shopping Center 8.50% 11.00% 10.00% Office Johannesburg CBD 10.50% 12.00% 11.00% Johannesburg Prime Non-CBD 9.00% 10.50% 9.50% Pretoria CBD 10.50% 12.00% 11.00% Pretoria Prime Non-CBD 9.00% 10.50% 10.00% Cape Town CBD 8.50% 10.50% 10.25% Cape Town Prime Non-CBD 9.50% 10.00% 9.63% Durban CBD 9.50% 11.50% 11.50% Durban Prime Non-CBD 9.50% 10.50% 10.00% Port Elizabeth CBD 10.50% 14.00% 11.75% Port Elizabeth Prime Non-CBD 9.50% 11.00% 10.00% Industrial High Grade Industrial 9.00% 11.00% 10.00% Low Grade Industrial 10.50% 13.00% 12.00% Warehouse 9.50% 12.00% 11.00%

Overall, the office vacancy rate (10.4%) increased slightly in 2011. For the best quality buildings, available space is more limited. In prime buildings, vacancies are below 3%, and under 9% in other Class A properties. In Sandton, vacancies in prime and A buildings account for less than 6% of the total stock. Industrial Because the recession was particularly tough on manufacturers and retail distributors, warehousing suffered; however, both light manufacturing and distribution perked up in 2010. Overall industrial vacancy fell to 4.2% in the first half of 2011. Limited new development helped to push vacancy down, with economic issues constraining the addition of new supply. Cap rates are stable for prime manufacturing and distribution facilities. Gross rents have been flat in most markets, but are expected to trend upward in 2012.
Vacancy is lowest for high-tech/high grade industrial buildings – just 1.5% in mid-2011.They actually offer a lower cost alternative for office tenants and can benefit when companies are cutting back on operating costs.
There is a wide range in the industrial cap rates shown in Figure 7-4, which reflects the variation in building quality, ceiling heights, and locations. High grade industrial assets can sell for the same cap rates as prime Pretoria or Cape Town office buildings.
Housing in South Africa
As the number of South Africans rises and as young adults form new households, residential demand expands. Additional factors contributing to housing demand growth include:
• Housing needs resulting from apartheid-era policies. After 1994, the nation faced a backlog of unmet housing needs estimated at three million units.
• Dramatic growth in the working-age share of the population.
• Ongoing urbanization, necessitating more housing construction in cities where jobs are being created.
• A high incidence of substandard dwellings in both urban neighborhoods and rural communities, which creates replacement demand.
• The growing number of moderate- and middle-income households who want to improve their housing quality but cannot find suitable accommodations at prices they can afford because the existing inventory is too small.
The private sector has traditionally addressed demand for upscale and luxury product, and the government is active in providing new units for households at the very bottom of the income spectrum. (Even so, the government has a long way to go to satisfy the need for decent housing for the country's poorest residents.) The shortage of sound affordable housing is acute for households in the middle – working people who cannot afford most newly-built or existing, high-quality units. South African housing experts broadly portray the "affordable" market segment as households who need a house priced below R500,000 4 (approximately $66,000). These consumers have monthly incomes above R3,500 (too high to be provided free government housing) up to R16,000-R21,000 (approximately $2,100-$2,800). 4 Kecia Rust, "Challenges in South Africa's housing finance & delivery network: Navigating the gap," a presentation to FinMark Forum, 24 February 2011.
Lachman Associates, LLC 44

Surveys conducted by Statistics South Africa indicate that the country had 14.3 million households in 2010 and that nearly 3.3 million new households were formed between 2002 and 2010.5 As will be discussed, housing construction has not kept up with growth, let alone provided sufficient supply to meet pent-up demand and replace substandard stock.
5 Statistics South Africa, General Household Survey, GHS Series Volume II: Housing 2002-2009, and General Household Survey Series P0318, 2010.
Growing Demand
Demographics
South Africa is projected to add nearly 4.6 million people between now and 2030, as illustrated in Figure 7-5. Simultaneously, the working-age population will expand by nearly 4 million. As young adults form new households, they need affordable shelter choices.
Lachman Associates, LLC 45
Figure 7-5. South African Population Estimates and Projections, 1990-2030
Source: United Nations, World Population Prospects: The 2010 Revisions.
Assuming average household size remains fairly constant,6 provision of housing for 4.6 million more people over the next 20 years will require construction of a minimum of 1.24 million new housing units – just to meet growth-related demand. In maturing economies, household sizes tend to decline over time, suggesting that demand will be even higher than recent demographic trends suggest.
Urbanization creates a mismatch between the location of existing housing units and the shelter needs of families who move in search of better job opportunities. An estimated 62% of South Africans now live in urban areas. By 2030, this share is expected to exceed 71%, which means that housing will be needed for another 7.9 million people in South Africa's cities and suburbs over the next 20 years.
Estimates of demand attributable to growth or urban migration do not include replacement units. As discussed below, informal and traditional rural dwellings still comprise one quarter of South Africa's occupied housing stock, a share that has not changed much in the last decade. Many of these homes are structurally unsound and/or lack basic services, so replacement needs remain substantial.
Household Incomes and the Housing Gap
An estimated 58% of South African households had 2005 monthly incomes below R3,500 (approximately $460 per month US). Most such households are technically eligible for government-provided or government-subsidized housing, but only a fraction has been able to benefit from these programs.
6 Ibid. Surveys indicate that household size averaged 3.5-3.7 persons over the last decade.
21.3
32.7 36.7 36.8
50.1 54.7
0
10
20
30
40
50
60
1990 1995 2000 2005 2010 2015 2020 2025 2030
Mill
ions
Age 15-64 Total Population

Lachman Associates, LLC 46
At the other end of the income spectrum, 12% of households earned above R16,000 per month ($2,100) as seen in Figure 7-6. The "gap market" -- households with incomes too high to qualify for subsidies but insufficient to afford the least-expensive new homes produced in the private market – is estimated at 30% of all households.7 With an estimated 14.3 million South African households in 2010, the number in the “gap” totals nearly 4.3 million.
7 Kecia Rust, "Challenges in South Africa's housing finance & delivery network: Navigating the gap," a presentation to FinMark Forum, 24 February 2011.
Figure 7-6. South African Households by Monthly Income
Source: Centre for Affordable Housing Finance in Africa (income distribution); Statistics South Africa, General Household Survey, 2010 (number of households).
<R3,500 58%
R3,500 - R7,000
17%
R7,000 - R10,000
6%
R10,000 - R16,000
7%
R16,000+ 12%
The numbers are based on a total of 14,304,000 house-holds in 2010
8,296,320
1,716,480
2,431,680
858,240
1,001,280
Access to Housing Finance
South African consumers have greater access to financial services than any other nation on the continent. According to Finmark Trust, the vast majority of South African households have a deposit account in some type of formal financial institution, which could include a commercial bank, a credit union, a cooperative, or a government-sponsored institution.8 Only 27% of households are considered "unbanked," with no use of either formal or informal financial products.9 Once again, South Africa's sophisticated financial services sector distinguishes it from most other emerging markets.
In 2009, 13% of South African households had a mortgage, and outstanding mortgages accounted for nearly 47% of the country's GDP. Additionally, housing construction and improvements to existing homes are financed with pensions or other savings as collateral, or through unsecured micro-finance instruments. "Wholesale" financiers also provide capital to non-bank lenders targeting the lower end of the household income spectrum.
The World Bank ranks South Africa a "6" on a scale of 1 to 6, indicating a high degree of information available on household credit history. South Africa's legal system has protections for buyers, sellers, and lenders. Property registration occurs fairly quickly, and property transactions are widely reported, offering a degree of transparency.
8 CGAP and the World Bank Group, Financial Access 2010: The State of Financial Inclusion Through the Crisis, September 2010. 9 FinMark Trust, FinScope South Africa 2011, p. 5.

Number of Units (000s) Formal
Formal Informal Traditional Other Total Share
(%) 2002 8,104 1,434 1,170 306 10,708 75.7% 2003 8,439 1,452 1,210 261 11,101 76.0% 2004 8,699 1,392 1,358 262 11,449 76.0% 2005 8,553 1,895 1,320 306 11,768 72.7% 2006 9,163 1,806 1,221 286 12,190 75.2% 2007 9,389 1,918 1,244 350 12,551 74.8% 2008 9,930 1,882 1,385 153 13,197 75.2% 2009 10,430 1,845 1,417 120 13,692 76.2% 2010 10,999 1,859 1,385 61 14,243 77.2%
% Increase, 2002-2010 35.7% 29.6% 18.4% -80.1% 33.0%
Age and Physical Condition
Nearly one in four homes in 2009 was said to be at least 30 years old. Informal dwellings tend to be newer because they are temporary, at least in theory, and lack durability. In the formal stock, 30% of units were built post-2000, compared to half of informal housing. Regardless of age, informal and traditional units are much more likely to lack basic services:
• Only 37.5% had access to piped or tap water in the house or yard.
• 28.6% of these units had a flush toilet. • Just over half were connected to electric lines. • 57.5% of households living in informal units reported weak
or very weak walls in 2009, as did nearly 37% of those living in traditional dwellings.
It may be possible to renovate a portion of these units, but a high percentage should be replaced.
Lachman Associates, LLC 47
8,296,320
Existing Housing Stock
South Africa's housing stock consists predominantly of single-family detached homes. Multi-unit buildings -- flats, duplexes, and townhouses -- are far less common. Nearly70% of South African households own their homes, either in whole or in part. Another 21% rent; and the remaining 10% live rent-free, either through a formal arrangement or as squatters. Occupants have formal or informal tenure: the formal housing stock is owner-occupied or subject to a lease, whereas the informal stock consists of makeshift backyard units or shacks built without approved plans. In rural areas, the housing stock also includes "traditional" dwellings made of indigenous materials; they can have formal or informal tenure, depending upon how the underlying land is owned. Formal tenure accounts for more than three of every four South African dwellings. While formal arrangements are more extensive than they were under apartheid, the share of the total housing stock that is protected through a deed or a lease has not changed much since 2002, as Figure 7-7 shows. Informal tenure persists, even though the units tend to be physically substandard. The number of households living informally has actually increased since 2002 – at the same pace as growth of the formal stock. This suggests that the pace of formal housing construction has not been sufficient to lessen the demand for informal units, let alone eliminate them. Also, tenure differences continue to persist among the races. Over 99% of whites are formally housed. Even though the share of black South Africans living in formal housing increased from 65.8% in 2002 to 71.9% in 2010, the differences are obvious and can only be corrected by increased construction activity targeted to both low-income and working families.
Figure 7-7. Home Typology, 2002-2010
"Other" includes caravansSource: Statistics South Africa, General Household Survey.
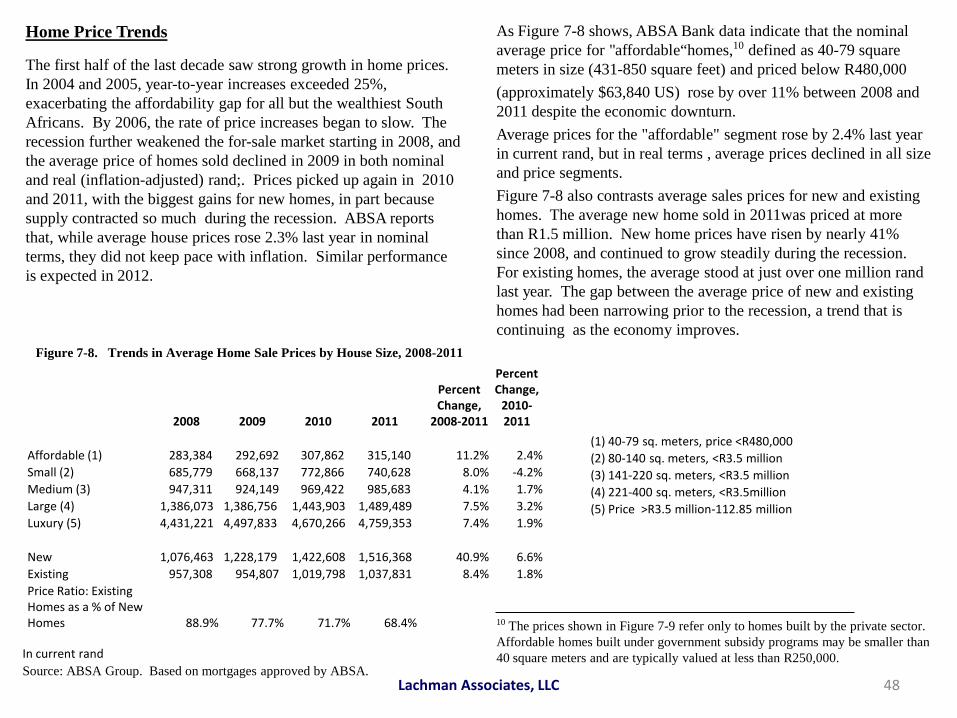
Home Price Trends
The first half of the last decade saw strong growth in home prices. In 2004 and 2005, year-to-year increases exceeded 25%, exacerbating the affordability gap for all but the wealthiest South Africans. By 2006, the rate of price increases began to slow. The recession further weakened the for-sale market starting in 2008, and the average price of homes sold declined in 2009 in both nominal and real (inflation-adjusted) rand;. Prices picked up again in 2010 and 2011, with the biggest gains for new homes, in part because supply contracted so much during the recession. ABSA reports that, while average house prices rose 2.3% last year in nominal terms, they did not keep pace with inflation. Similar performance is expected in 2012.
As Figure 7-8 shows, ABSA Bank data indicate that the nominal average price for "affordable“homes,10 defined as 40-79 square meters in size (431-850 square feet) and priced below R480,000 (approximately $63,840 US) rose by over 11% between 2008 and 2011 despite the economic downturn. Average prices for the "affordable" segment rose by 2.4% last year in current rand, but in real terms , average prices declined in all size and price segments. Figure 7-8 also contrasts average sales prices for new and existing homes. The average new home sold in 2011was priced at more than R1.5 million. New home prices have risen by nearly 41% since 2008, and continued to grow steadily during the recession. For existing homes, the average stood at just over one million rand last year. The gap between the average price of new and existing homes had been narrowing prior to the recession, a trend that is continuing as the economy improves. 10 The prices shown in Figure 7-9 refer only to homes built by the private sector. Affordable homes built under government subsidy programs may be smaller than 40 square meters and are typically valued at less than R250,000.
Lachman Associates, LLC 48
(1) 40-79 sq. meters, price <R480,000 (2) 80-140 sq. meters, <R3.5 million (3) 141-220 sq. meters, <R3.5 million (4) 221-400 sq. meters, <R3.5million (5) Price >R3.5 million-112.85 million
In current rand Source: ABSA Group. Based on mortgages approved by ABSA.
Figure 7-8. Trends in Average Home Sale Prices by House Size, 2008-2011
2008 2009 2010 2011
Percent Change,
2008-2011
Percent Change,
2010-2011
Affordable (1) 283,384 292,692 307,862 315,140 11.2% 2.4% Small (2) 685,779 668,137 772,866 740,628 8.0% -4.2% Medium (3) 947,311 924,149 969,422 985,683 4.1% 1.7% Large (4) 1,386,073 1,386,756 1,443,903 1,489,489 7.5% 3.2% Luxury (5) 4,431,221 4,497,833 4,670,266 4,759,353 7.4% 1.9%
New 1,076,463 1,228,179 1,422,608 1,516,368 40.9% 6.6% Existing 957,308 954,807 1,019,798 1,037,831 8.4% 1.8% Price Ratio: Existing Homes as a % of New Homes 88.9% 77.7% 71.7% 68.4%

10.6 11.2
13.2
15.1
11.7
9.8 9.0 9.1
4
6
8
10
12
14
16
2005 2006 2007 2008 2009 2010 2011 2012
Mortgage Lending Activity and Interest Rates
As indicated previously, South Africa has a well-developed mortgage market that demonstrated steady growth prior to the recession; however, the volume of new mortgages and re-advances (refinancings) dropped by 25% in 2008 and another 31% in 2009, according to First National Bank. 2010’s mortgage volume was lower than a year earlier, but the decline was only 3.2%. ABSA Group reported R772.4 in total outstanding home loans at the end of 2011, a rise of only 1.8% when compared to 2010. Growth in mortgage advances is expected to be in the single digits in 2012, signaling continued weakness in the housing market. The Financial Sector Charter, adopted in 2003, has encouraged greater bank participation in mortgage lending; and pension funds are also active housing lenders.
As shown in Figure 7-9, ABSA Group projects that mortgage rates will average only 9.1% in 2012, compared with an average of over 15% as recently as 2008.
Combined with relatively stable prices, a positive environment for homeownership will emerge, even if rates go up slightly next year. For-sale market conditions are likely to improve, albeit slowly. The decline in real home prices and slow growth in residential lending activity after 2008 resulted from the global recession, persistently high unemployment, rising interest rates, and increases in household debt levels, which led to credit tightening. The start of a recovery was attributable to lower inflation and interest rates, greater disposable income in an improving economy, and declining household debt ratios. A new government-sponsored mortgage guarantee program, targeted to low-income households earning R3,500 to R9,000 per month, should boost lender confidence when considering this underserved consumer group.
Renters and Rent Trends
Although only one in five South African households is a renter, provision of sound, affordable rental stock is important to sustaining economic growth. The Social Housing Foundation indicates that a majority of renters are poor, with 55% having monthly incomes of less than R3,500. Another 22% have moderate monthly incomes of R3,500-R5,000. Among all renters, 40% are said to live in slum conditions.11
Vacancy rates in rental housing are low. Rental choices are needed for an ever more mobile workforce, for employed households whose financial circumstances make homeownership problematic, and for young single persons just beginning their careers. (Single person households are not eligible for government-provided housing.) As the 2008 report from the Social Housing Foundation stated:
11 Social Housing Foundation, Supply and Demand of Rental Accommodation in South Africa, July 2008, p.1.
Lachman Associates, LLC 49
Source: Rode's Report
Figure 7-9. Average Home Mortgage Interest Rates

1 BR % 2 BR %
4Q 2006 Increase 4Q 2006 Increase 3Q 2011 3Q 2011
Johannesburg R2,269
34.9% R3,114
28.0% R3,062 R3,985
Pretoria R1,652
69.9% R2,285
53.3% R2,807 R3,504
Durban R2,185
45.5% R2,751
43.8% R3,180 R3,955
Cape Town R2,098
54.1% R2,785
48.4% R3,234 R4,133
Port Elizabeth R1,654
57.5% R2,162
39.1% R2,605 R3,008
Changes in the country's credit law, the global credit crisis, and increasing interest rates have reduced the ability of many households to finance homeownership. In addition, the shifting locus of economic growth towards sectors such as construction and transport is likely to increase the need for mobility among those in elementary occupations, and with it, flexible and affordable housing solutions. Basic demographics also favour the sector with a growing market of younger adults for whom rental tenure may be more appropriate than ownership.12
Rent growth exceeded inflation during much of the last decade, further exacerbating the housing affordability problem. This was especially notable between 2000 and 2005, when nominal flat rents for standard units increased by annual compounded rates ranging from a low of 7.5% in Pretoria to 12.4% in Port Elizabeth. During the same time period, the consumer price index rose only 4.8%.
The stagnation seen in the for-sale market during the recession was not evident in the rental sector, where rents rose dramatically. Although some variation occurred among South Africa's five largest urban areas and by unit size, rent increases exceeding 40% were seen in all the major cities except Johannesburg during the 2006 to 2011 period. However, the pace of rent increases slowed last year, falling below the rate of inflation. As seen in Figure 7-10, two-bedroom rents were highest in Cape Town during the third quarter of 2011, followed closely by Johannesburg and Durban. This represents a change from past patterns, when Johannesburg registered the highest flat rents. 13
12 Ibid., p.2. 13 Rode's Report, 2011:4. Standard quality (non-luxury) units.
Construction Activity in the Private (Unsubsidized) Market
Private housing construction peaked in 2007, when 76,661 units were completed. The four-year period 2008 through 2011 showed contraction in both new residential plan approvals and actual construction completions, as documented in Figure 7-11. (These figures do not include government-subsidized construction, which is discussed below.) Total completions dropped to 56,947 by 2009, and only 40,495 units were finished in 2010. Smaller homes have been capturing a greater share of the total market over time, a response to higher prices. Plan approvals also dropped sharply, portending a wider gap between the need for units to serve the middle market and the new deliveries. Aside from the effects of the recession in dampening demand and curtailing credit availability, the pace of housing construction has been hampered by lack of serviced plots and a shortage of skilled construction labor. In 2010, government authorities approved plans for construction of 47,079 homes --
Lachman Associates, LLC 50
Source: Rode's Report
Standard units=non-luxury
Figure 7-10. Change in Average Rents, 2006-2011

7,311 fewer than in 2009 and only 55% of 2008’s volume. Approvals edged up to over 52,200 units in 2011, but are still well below the 2007 peak. A large percentage of new units approved toward the end of the last decade have yet to be completed.
Subsidized Housing Construction
The government is the biggest single provider of new housing in South Africa. Households with monthly incomes of less than R3,500 (approximately $465) are eligible for government-subsidized housing, and about 58% of South Africans are income-qualified. A typical subsidized unit is 40 square meters (430 square feet) and is divided into two bedrooms, a living area/kitchen, and a bathroom. The government reports that 2.5-2.8 million new units were completed from 1995 through March 2011, but a 2009 survey indicated that 1.85 million households were on the waiting list for subsidized units. The average household had been on the list for nearly five years.. Although the supply of subsidized units continues to grow, the public sector cannot keep up with demand. In fiscal year 2010-11, only 121,879 units were delivered. The government has been unable to meet its goal of producing 160,000 units annually for low income households, and long wait lists will persist.
Lachman Associates, LLC 51
The 2010 Household Survey indicated that 19% of all South African households lived in state-provided or state-subsidized housing. Some of these households are renting from the original subsidy recipient, and others live rent-free. A majority of residents in state- assisted housing own their homes; however, not all these
residents would qualify if they were to apply today. In 2009, more than a third indicated that their current monthly incomes exceeded the R3,500 maximum. Only 9.7% of all households were actually receiving subsidies.
Closing the Housing Gap
As shown in Figure 7-12, resales of existing homes do not make up for the shortfall in subsidized and affordable new construction. Focusing on the period 2004 through 2009, 57% of new units were valued at less than R500,000 -- largely due to the influence of government-assisted units as a share of total production (unvalued units are generally subsidized government-built homes). However, a much smaller share of resales were valued at less than R500,000. In South Africa, inexpensive homes are rarely sold. Owners are reluctant to move, given the high cost of existing housing; and when they do move, they often rent out rather than sell their affordable homes.
Source: Statistics South Africa; ABSA Group
Uni
ts
46,033 61,285 56,713
70,682 74,688 70,005 76,661 70,058 56,947
40,679 40,495
(10,000)
40,000
90,000
140,000
2001 2002 2003 2004 2005 2006 2007 2008 2009 2010 2011
Houses <80 square meters Houses >80 square meters Flats and townhouses Total
Figure 7-11. Residential Units Completed

Lachman Associates, LLC 52
Figure 7-12. Value of New and Resale Homes Registered
The South African government estimated the unmet housing backlog at 2.1 million units in 2010. Without increased production, the gap will widen. Between 2004 and 2009, the nation added an average of 420,000 new households per year, but registrations of newly-built homes averaged less than 120,000. Moreover, the recession caused a steep drop in production between 2007 and 2009.
*As of October Source: Centre for Affordable Housing Finance in Africa
Building more units targeted at moderate- and middle-income households -- those not eligible for government subsidies but unable to find affordable units in the private market -- will help narrow the "gap”.
28,958 27,429 19,621 20,408 23,012
30,416 27,212
32,066 16,438
20,570 17,684 17,945
19,866
13,840 20,854
24,432 26,537 28,660
27,452
16,650
10,109
52,658 59,907 65,590 65,817
45,074 25,318
12,195
0%
10%
20%
30%
40%
50%
60%
70%
80%
90%
100%
2004 2005 2006 2007 2008 2009 2010*
Value of New Homes Registered
Unvalued <R250,000 R250,000 - R500,000 >R500,000
(1) Unvalued units are generally government-built, subsidized homes. (2) Comparing registrations with government production numbers suggests that not all subsidized units are registered when completed.
9,368 7,889 8,227 9,204 8,667 7,096 5,404 15,164 16,783 19,845 20,396 20,252 15,878 10,153
65,978 66,502 66,892 64,142 47,744 31,092
24,799
195,423 173,068 172,761 169,924 116,170 87,343 75,191
0%
10%
20%
30%
40%
50%
60%
70%
80%
90%
100%
2004 2005 2006 2007 2008 2009 2010*
Value of Resales Registered
Unvalued <R250,000 R250,000 - R500,000 >R500,000

References
Section 8
53 Lachman Associates, LLC

References
Absa Group, Economic Research. Housing Review, Quarter 1, 2012. http://www.absa.co.za/Absacoza/Economic-Research/Property-Research
Adcorp Holdings Limited, Adcorp Employment Index, December 2011 and February, 2012. http://www.adcorp.co.za/Industry/Pages/Adcorp'sEmploymentIndex.aspx
Adcorp Holdings Limited, Employment Quarterly, January to March 2011. http://www.adcorp.co.za/Industry/Pages/Adcorp'sEmploymentQuarterly.aspx
African Economic Outlook, South Africa, 2011. http://www.africaneconomicoutlook.org/en/countries/southern-africa/south-africa
Banerjee, Abhijit, Sebastian Galiani, Jim Levinsohn, Ingrid Woolard, “Why Has Unemployment Risen in the New South Africa?” CID Working Paper No. 134, Center for International Development at Harvard University, October 2006.
Broll/CBRE, Broll Retail Barometer: Review of Fourth Quarter 2011. www.broll.co.za
Broll/CBRE, South Africa Country Report, February 2012. www.broll.co.za
Centre for Affordable Housing Finance in Africa, a division of the FinMark Trust, Housing Finance in Africa: 2011 Yearbook, September 2011. http://www.housingfinanceafrica.org/document/2011-housing-finance-yearbook/
Clarke, George, David E. Kaplan, Vijaya Ramachandran, James Habyarimana, Mike Ingram, An Assessment of the Investment Climate in South Africa, The World Bank Group, Washington, D.C., March 2007.
Consultative Group to Assist the Poor (CGAP) and the World Bank Group, Financial Access 2010: The State of Financial Inclusion Through the Crisis, September 2010. http://www.cgap.org/gm/document-1.9.46570/FA_2010_Financial_Access_2010_Rev.pdf
Dorrington, Rob E., Leigh F. Johnson, Debbie Bradshaw, Timothy-John Daniel, The Demographic Impact of HIV/AIDS in South Africa, Cape Town: Centre for Actuarial Research, South African Medical Research Council, and Actuarial Society of South Africa, 2006. www.commerce.uct.ac.za/care
Economist Intelligence Unit http://country.eiu.com/South%20Africa
Emerging Markets Private Equity Association, EMPEA Insight Special Edition: Private Equity in Sub-Saharan Africa, Washington, D.C., November 2010. www.empea.net
Finmark Trust, Finscope South Africa 2011, December 7, 2011. www.finscope.co.za
First National Bank, Property Market Analytics. www.fnb.co.za
Global African Network, South African Business: The Guide to Business and Investment in the Republic of South Africa, 2011/12 edition. www.southafricanbusiness.co.za
Gordhan, Pravin, “2011 Budget Speech,” National Treasury, February 23, 2011. www.treasury.gov.za
Lachman Associates, LLC 54

Hawkworth, John and Gordon Cookson, The World in 2050: Beyond the BRICs, PriceWaterhouseCoopers, March 2008. http://www.pwc.com/gx/en/world-2050/pdf/world_2050_brics.pdf
Housing Finance Information Network (HOFINET), country estimates. www.hofinet.org
International Monetary Fund, South Africa Staff Report for the 2011 Article IV Consultation, Washington, D.C., No. 11/258, July 7, 2011.
Investment Property Databank (IPD), SAPOA/IPD South Africa Annual Property Index, December 31, 2011. http://www.ipd.com/OurProducts/Indices/SouthAfrica/SouthAfricaAnnualPropertyIndex/tabid/442/Default.aspx
Jones Lang LaSalle, “Deciding Where to Offshore,” September 2004. www.research.joneslanglasalle.com
Jones Lang LaSalle, Mapping the World of Transparency 2010. http://www.joneslanglasalle.com/pages/greti_home.aspx
Levinsohn, John, “Policy Brief – Policy Responses to Unemployment in SA,” Center for International Development @ Harvard University, May 2008. http://www.cid.harvard.edu/cidwp/166.html
McKinsey Quarterly, Africa’s Path to Growth: Sector by Sector, 2010. http://mckinseyquarterly.com
Mo Ibrahim Foundation, 2011 Ibrahim Index of African Governance, October 2011. www.moibrahimfoundation.org
Nedbank Group, “Guide to the Economy,” December 9, 2011. http://www.nedbankgroup.co.za/pdfs/economic/economicguide/2011Decguide.pdf
OECD Economic Surveys, South Africa, Volume 2010/11, July 2010. www.oecd.org
Oxford Business Group, Emerging South Africa 2006. www.oxfordbusinessgroup.com/publication.asp?country-38
PriceWaterhouseCoopers, 13th Annual Global CEO Survey, 1st South African Edition, 2010 . www.pwc.com/ceosurvey
Radelet, Steven, Emerging Africa: How 17 Countries are Leading the Way, Center for Global Development, Washington, D.C., 2010. www.cgdev.org
Rode & Associates Property Consultants. Rode's Report. www.rode.co.za
Rust, Kecia, "Challenges in South Africa's housing finance & delivery network: Navigating the gap," a presentation to FinMark Forum, 24 February 2011.
South Africa Property Owners Association, Cap and Discount Data Survey. November 2011. www.sapoa.org.za.
South Africa Property Owners Association, Industrial Vacancy Survey, H1 2011. www.sapoa.org.za.
South Africa Property Owners Association, Office Vacancy Survey, Q4 2011. www.sapoa.org.za
Lachman Associates, LLC 55

South Africa Property Owners Association, SAPOA Retail Trends Report, Q4 2011. www.sapoa.org.za
South Africa Property Owners Association and Investment Property Databank Ltd., SAPOA/IPD South Africa Property Index,, December 31, 2011. www.ipd.com/southafrica.
“SA Schools: E for Education,” The Economist, January 13, 2011. http://www.economist.com/node/17913496/print
Social Housing Foundation, Supply and Demand of Rental Accommodation in South Africa, July 2008. http://www.shf.org.za
South Africa Info, “South Africa’s Automotive Industry” et al, 2008/9. http://www.southafrica.info
South African Reserve Bank, Quarterly Bulletin, no. 259, March 2011. http://www.reservebank.co.za
South Africa Tourism, “Impact of 2010 FIFA World Cup.” www.southafrica.net
Statistics South Africa, General Household Survey, GHS Series Volume II: Housing 2002-2009. Report No. P0318.01. http://www.statssa.gov.za/publications/statsdownload.asp?PPN=Report-03-18-01&SCH=4733
Statistics South Africa, General Household Survey: 2010, series P0318, issued August 3, 2011. http://www.statssa.gov.za/publications/P0318/P0318June2010.pdf
Statistics South Africa , Gross Domestic Product, series P0441, issued February 28, 2012. http://www.statssa.gov.za
Statistics South Africa, Labour Force Survey, Historical Revisions, March Series, 2001 to 2007. http://www.statssa.gov.za/qlfs/docs/March_Series_Historical_Revisions.pdf
Statistics South Africa, Mid-Year Population Estimates: 2010, July 20, 2010. http://www.statssa.gov.za/publications/PO302/PO302210.pdf
Statistics South Africa, Quarterly Labour Force Survey, series P0211,Quarter 4, 2011, issued February 7, 2012. www.statssa.gov.za/Publications/P0211/P02114thQuarter2011.pdf
University of Stellenbosch Bureau for Economic Research, The Macroeconomic Impact of HIV/AIDS under Alternative Intervention Scenarios (with Specific Reference to ART) on the South African Economy, June 2006.
United Nations, Population Division, World Population Prospects: The 2010 Revision. http://esa.un.org/unpd/wpp/index.htm
United Nations, World Urbanization Prospects: The 2009 Revision. http://esa.un.org/unpd/wup/index.htm
UN World Tourism Organization, UNWTO Tourism Highlights, 2010 Edition. http://www.unwto.org/fact/menu.html
USAID, “South Africa: HIV/AIDS Health Profile,” Pretoria, February 2011. http://www.usaid.gov/our_work/global_health/aids/Countries/africa/southafrica.html
Lachman Associates, LLC 56

U. S. Central Intelligence Agency, CIA-The World Factbook, 2012. https://www.cia.gov/library/publications/the-world-factobook/geos/sf.html
Thornycroft, Peta. "Zimbabwe Refugees to be Deported From South Africa." Voice of America, September 2, 2010. www.voanews.com
World Bank, World Development Indicators Database, updated December 2011. http://data.worldbank.org/indicator
World Economic Forum, The Global Competitiveness Report, 2006-2007, ed. By Augusto Lopez-Claros, 2006. http://www.weforum.org
World Economic Forum, The Global Competitiveness Report 2011-2012, Davos, Switzerland, September 2010. http://www.weforum.org/reports/global-competitiveness-report-2011-2012
World Travel and Tourism Council, “Economic Data Search Tool,” March 12, 2012. http://www.wttc.org/eng/Tourism_Research/Economic_Data_Search_Tool
World Travel and Tourism Council, Travel and Tourism Economic Impact: South Africa, 2012. http://www.wttc.org
Lachman Associates, LLC 57