wholesale power markets in the united states
DESCRIPTION
a review of wholesale power markets in the united states of america.TRANSCRIPT

WHOLESALE ELECTRICITY MARKETDEVELOPMENTS IN THE U.S.
Paul L. Joskow
Cambridge, EnglandJuly 14, 2004
MIT CEEPRCambridge-MIT InstituteElectricity Project

THE UNITED STATES• Big country• 50 states• Diverse energy resources and costs• Electric power sector organization and regulation was
historically primarily the responsibility of the states• Federal (FERC) historical role very small and its statutory
authority modest• Liberalization involves major increase of federal over state
regulatory authority, creating state-federal tensions• No broad national commitment to liberalization of the electricity
sector. Very diverse regional views• California mess in 2000-2001 slowed down reforms in other
states• August 2003 blackout is being used by opponents of further
reform
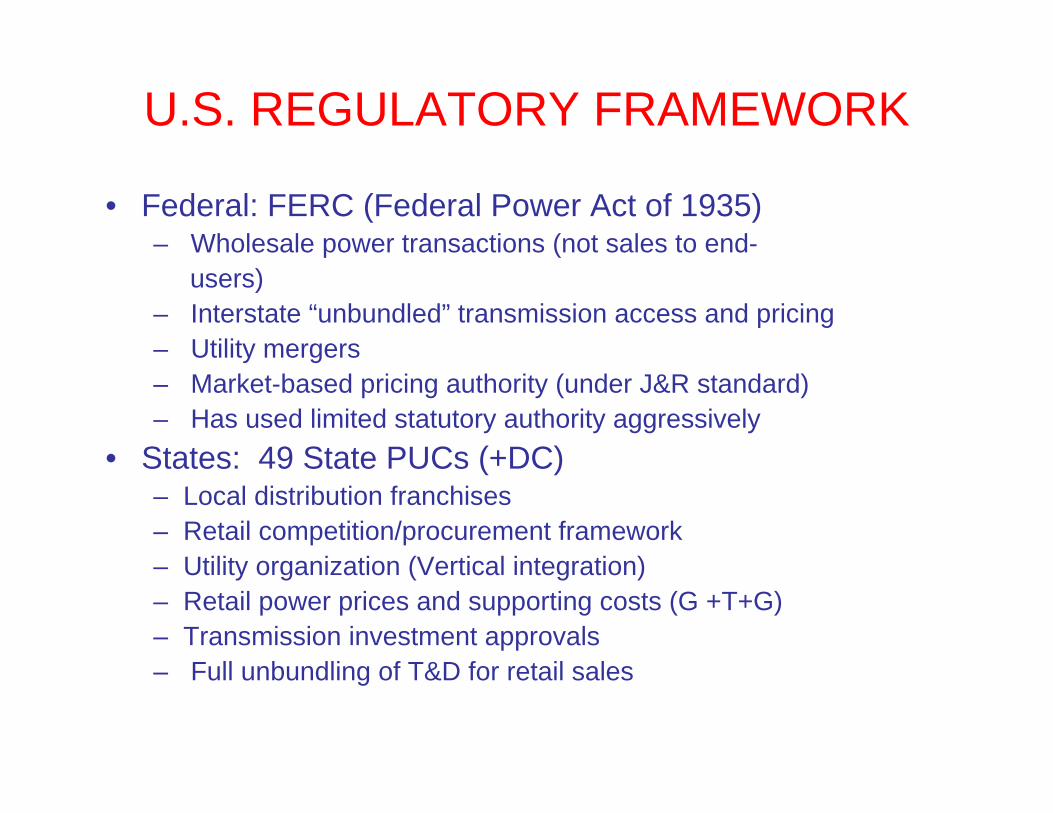
U.S. REGULATORY FRAMEWORK
• Federal: FERC (Federal Power Act of 1935)– Wholesale power transactions (not sales to end-
users)– Interstate “unbundled” transmission access and pricing– Utility mergers– Market-based pricing authority (under J&R standard)– Has used limited statutory authority aggressively
• States: 49 State PUCs (+DC)– Local distribution franchises– Retail competition/procurement framework– Utility organization (Vertical integration)– Retail power prices and supporting costs (G +T+G)– Transmission investment approvals– Full unbundling of T&D for retail sales
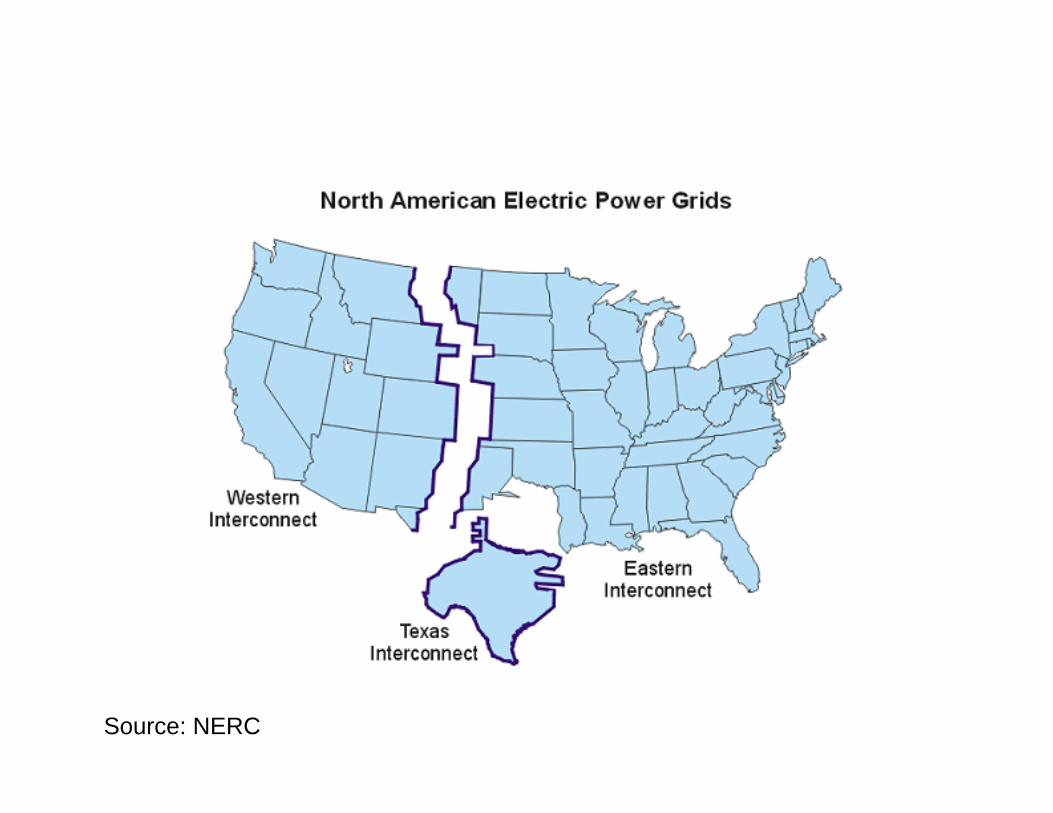
Source: NERC

Source: NERC
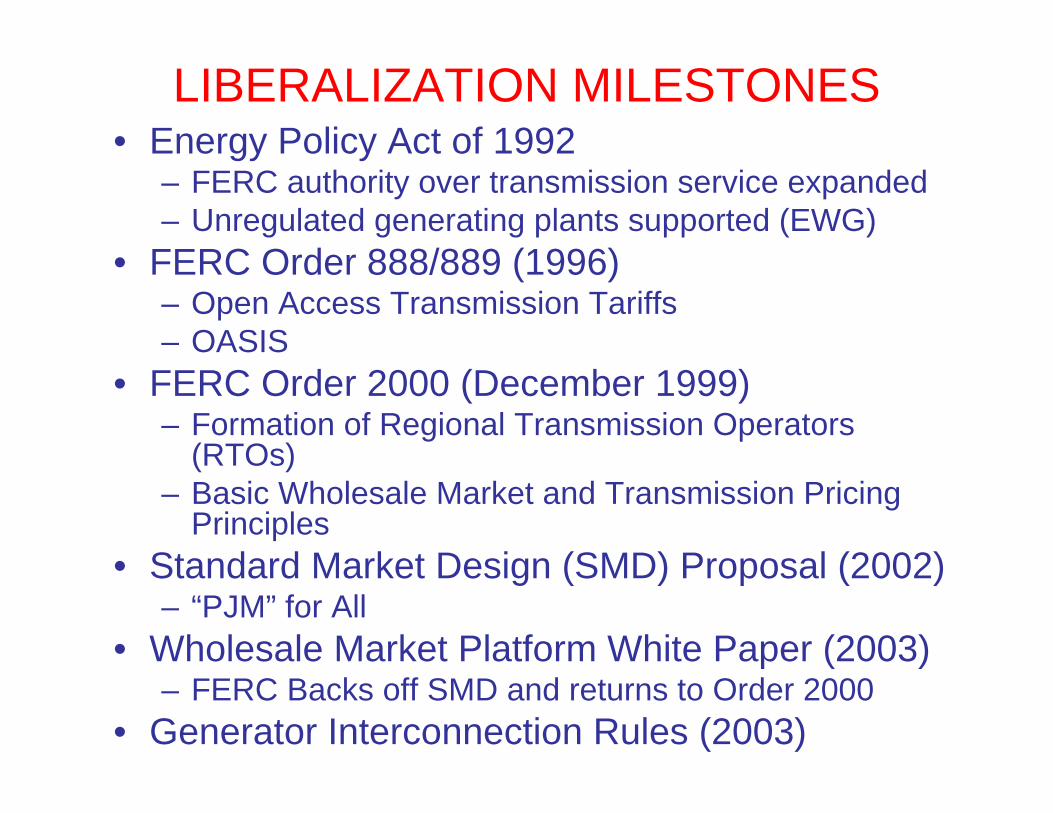
LIBERALIZATION MILESTONES• Energy Policy Act of 1992
– FERC authority over transmission service expanded– Unregulated generating plants supported (EWG)
• FERC Order 888/889 (1996)– Open Access Transmission Tariffs– OASIS
• FERC Order 2000 (December 1999)– Formation of Regional Transmission Operators
(RTOs)– Basic Wholesale Market and Transmission Pricing
Principles• Standard Market Design (SMD) Proposal (2002)
– “PJM” for All• Wholesale Market Platform White Paper (2003)
– FERC Backs off SMD and returns to Order 2000• Generator Interconnection Rules (2003)
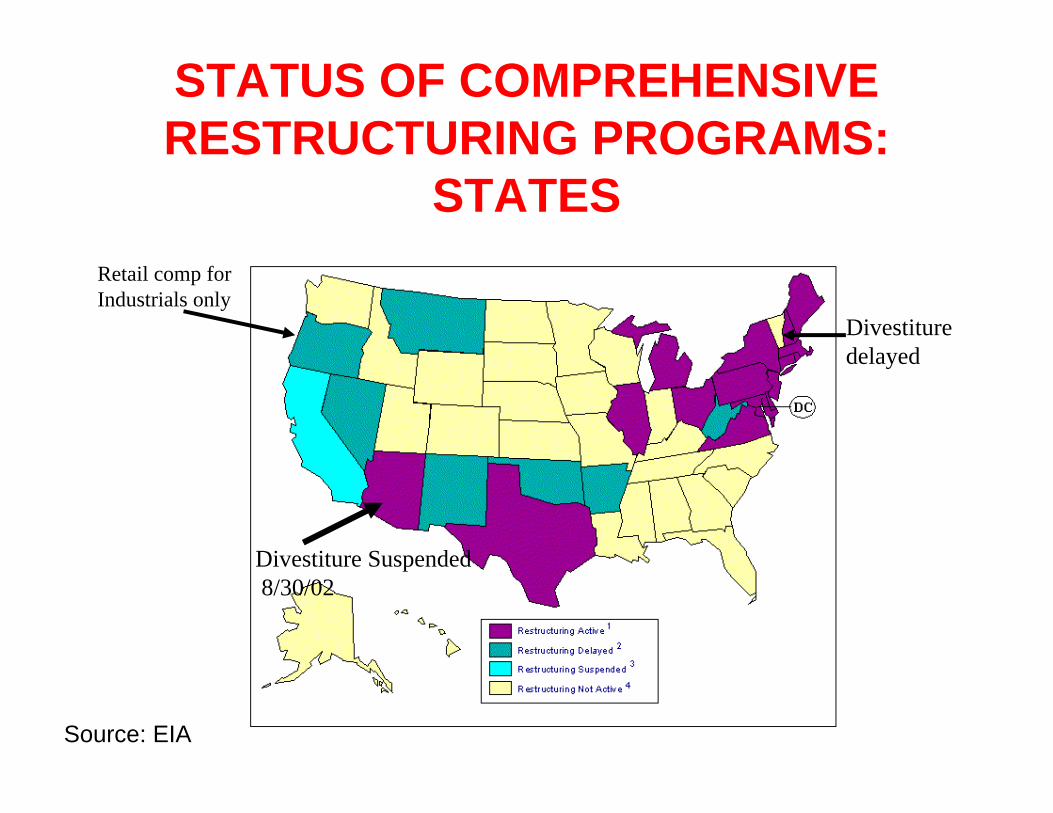
STATUS OF COMPREHENSIVE RESTRUCTURING PROGRAMS:
STATES
Divestiture Suspended8/30/02
Retail comp forIndustrials only
Divestituredelayed
Source: EIA
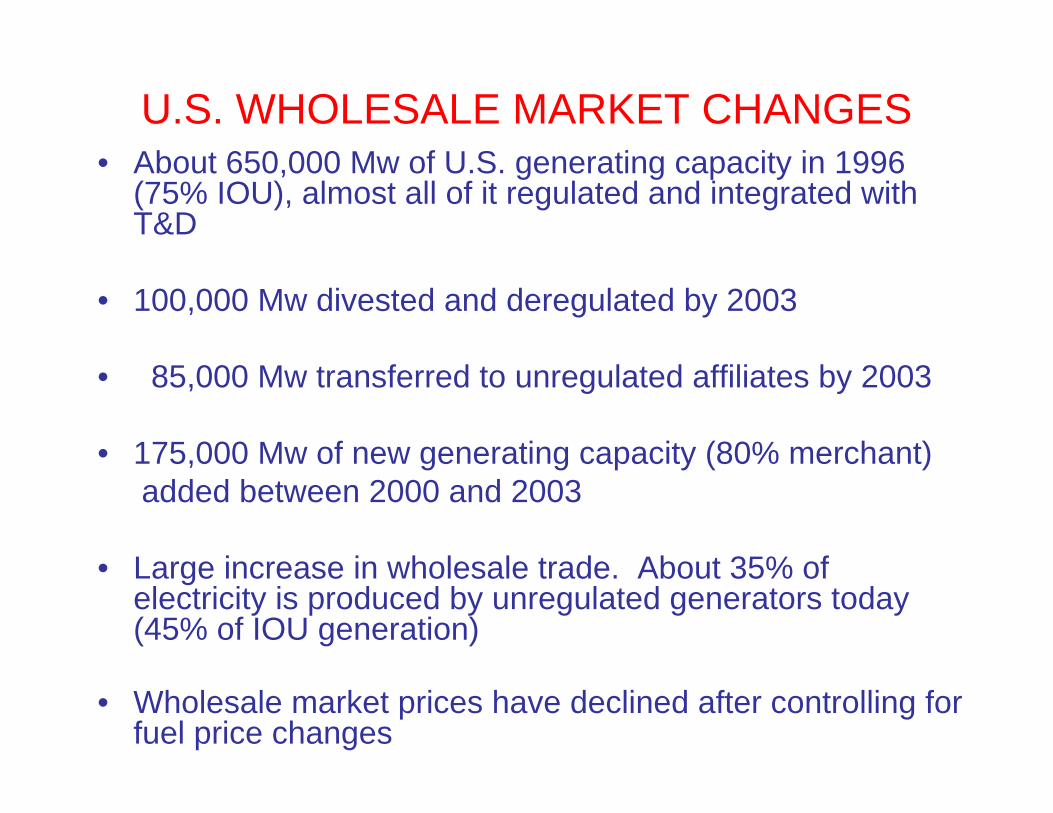
U.S. WHOLESALE MARKET CHANGES• About 650,000 Mw of U.S. generating capacity in 1996
(75% IOU), almost all of it regulated and integrated with T&D
• 100,000 Mw divested and deregulated by 2003
• 85,000 Mw transferred to unregulated affiliates by 2003
• 175,000 Mw of new generating capacity (80% merchant)added between 2000 and 2003
• Large increase in wholesale trade. About 35% of electricity is produced by unregulated generators today (45% of IOU generation)
• Wholesale market prices have declined after controlling for fuel price changes
Source: EIA
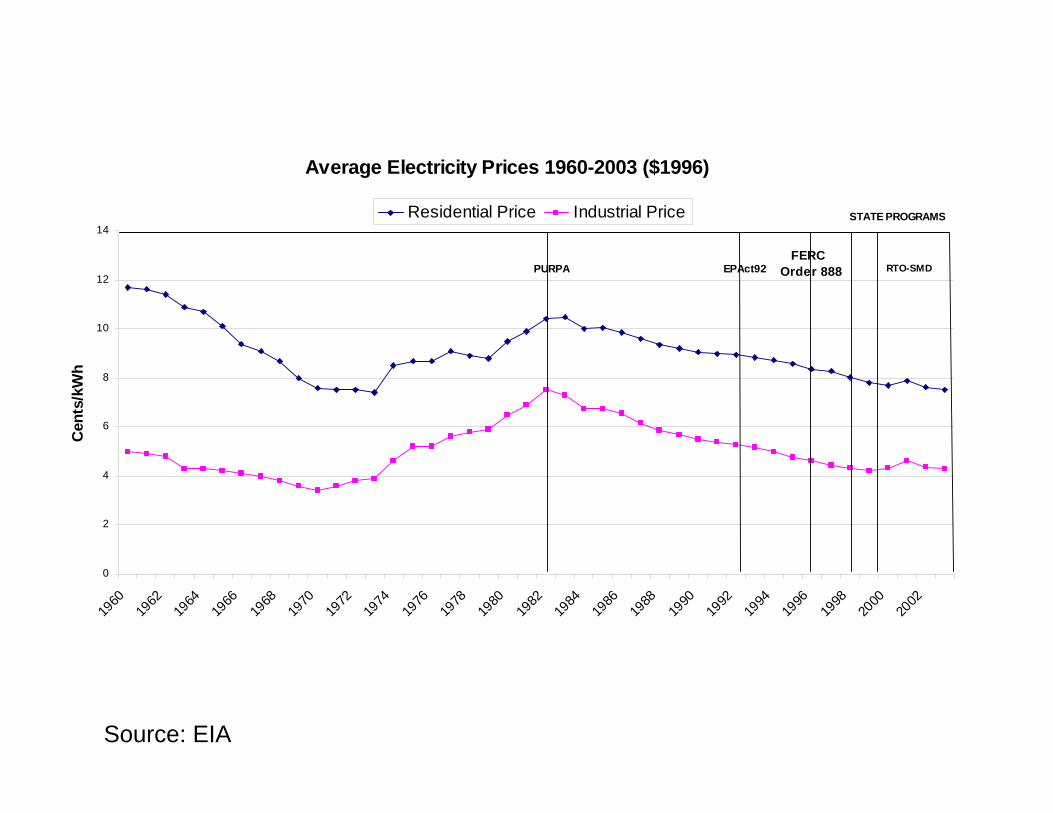
Average Electricity Prices 1960-2003 ($1996)
0
2
4
6
8
10
12
14
1960
1962
1964
1966
1968
1970
1972
1974
1976
1978
1980
1982
1984
1986
1988
1990
1992
1994
1996
1998
2000
2002
Cen
ts/k
Wh
Residential Price Industrial Price
PURPA EPAct92 FERC Order 888
STATE PROGRAMS
RTO-SMD

% Change in Nominal Residential Retail Price (1995-2002)
-25.00%
-20.00%
-15.00%
-10.00%
-5.00%
0.00%
5.00%
10.00%
U.S. ALL MASS MAINE NY PENN NJ IL CA TX OH
LIBERALIZATION IS NOW MOVING FORWARD SLOWLY
• Restructuring and competition at wholesale and retail levels is still in transition and varies widely from state to state and region to region
• Development of important wholesale market institutions is incomplete in large portions of the country
• No comprehensive Federal restructuring, competition and deregulation initiatives have been passed by Congress
• States have taken their own individual paths with FERC trying to knit together consistent transmission access, pricing and wholesale market rules
• Vertically integrated regulated monopoly model and competitive models are trying to operate simultaneously but very uneasily on the same physical networks
• Incompatible market and regulatory structures operating on the same physical electric power network creates very significant challenges!

Source: EIA

FOCUS ON THE NORTHEASTERN MARKETS
• New England, New York and PJM• Best articulations of FERC’s RTO and SMD
visions• Retail competition in all states but Vermont• Continued state commitments to restructuring
and competition• Several years of experience • California and MISO will adopt similar market
designs• PJM expanding West to include portions of Ohio,
West Virginia, Indiana, and Virginia as well as Northern Illinoid
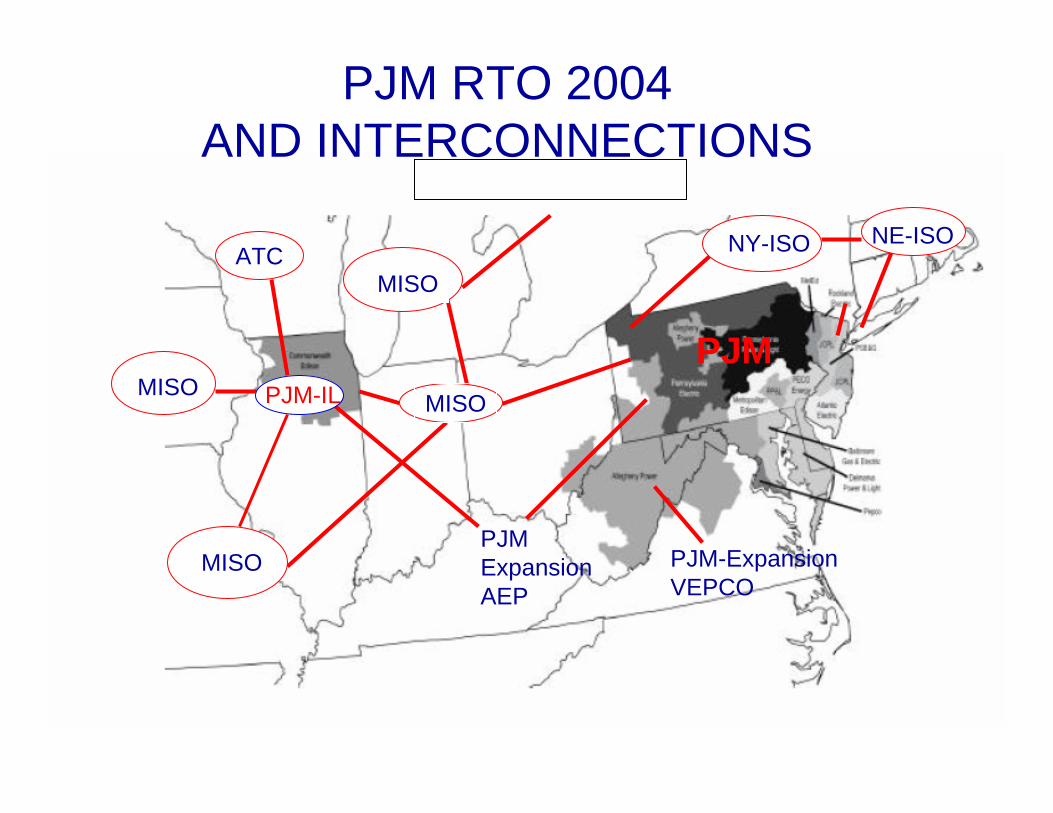
PJM RTO 2004AND INTERCONNECTIONS
PJM-ExpansionVEPCO
PJMExpansionAEP
NE-ISONY-ISO
PJM
MISO
MISO
MISO
PJM-IL MISO
ATC
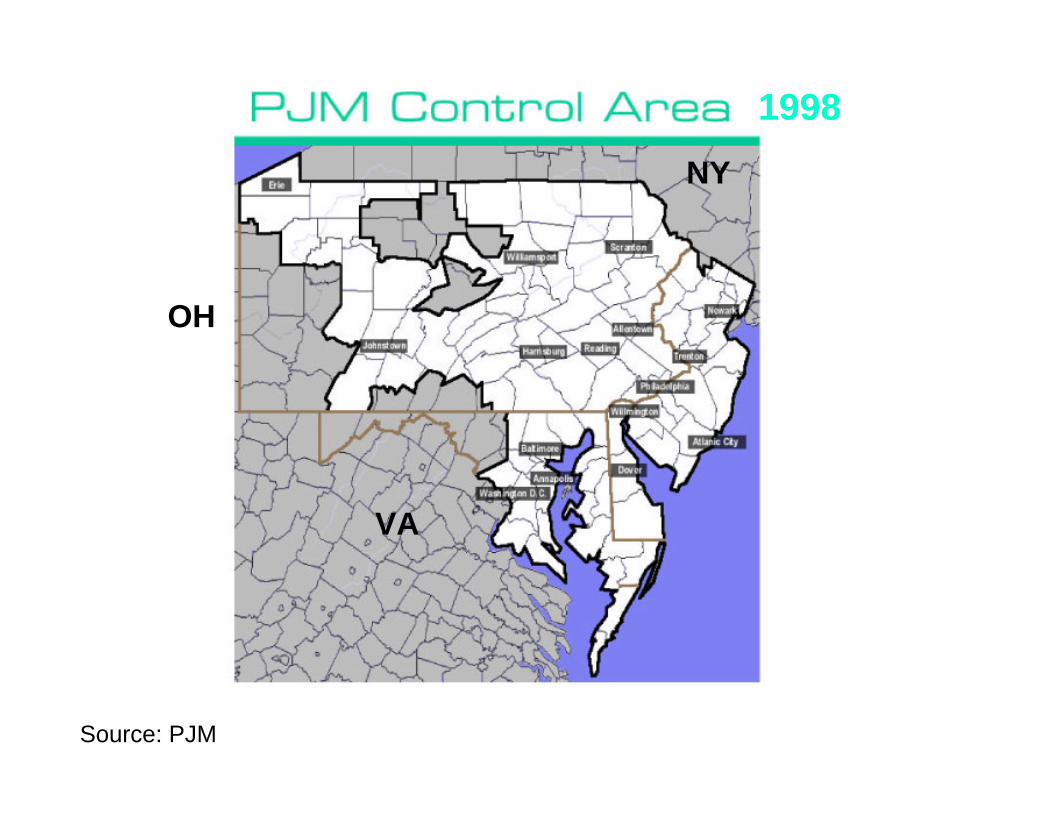
1998NY
VA
OH
Source: PJM
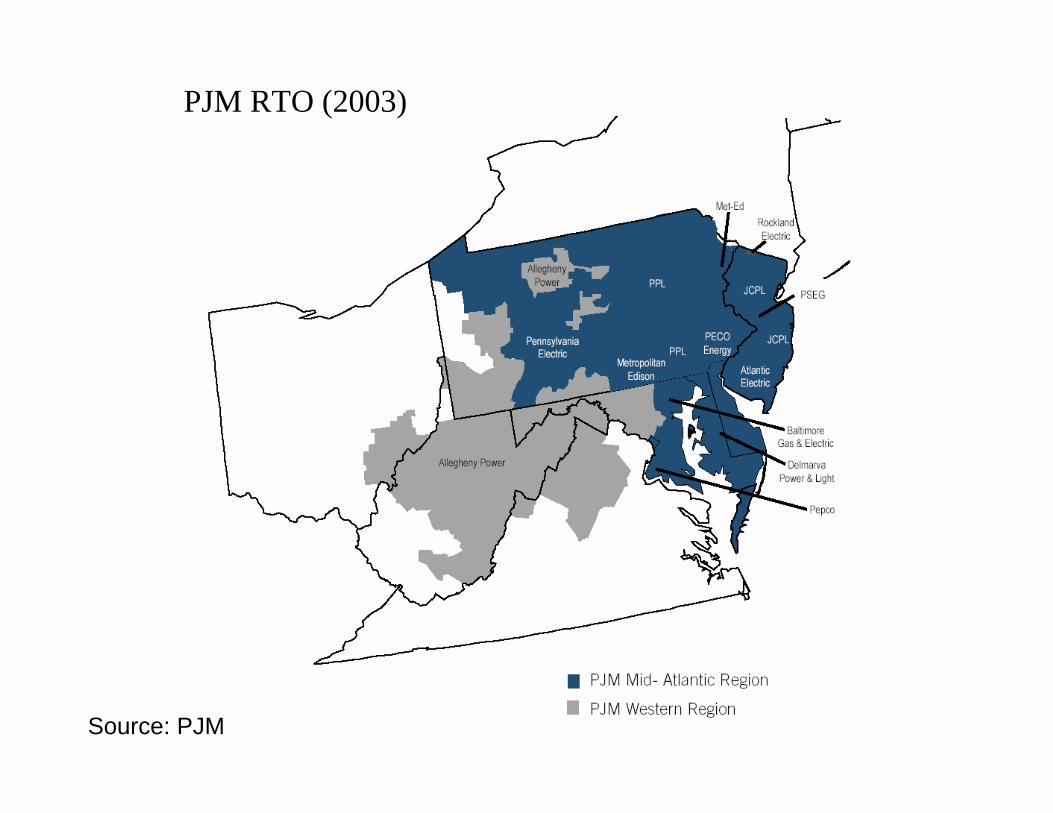
PJM RTO (2003)
Source: PJM
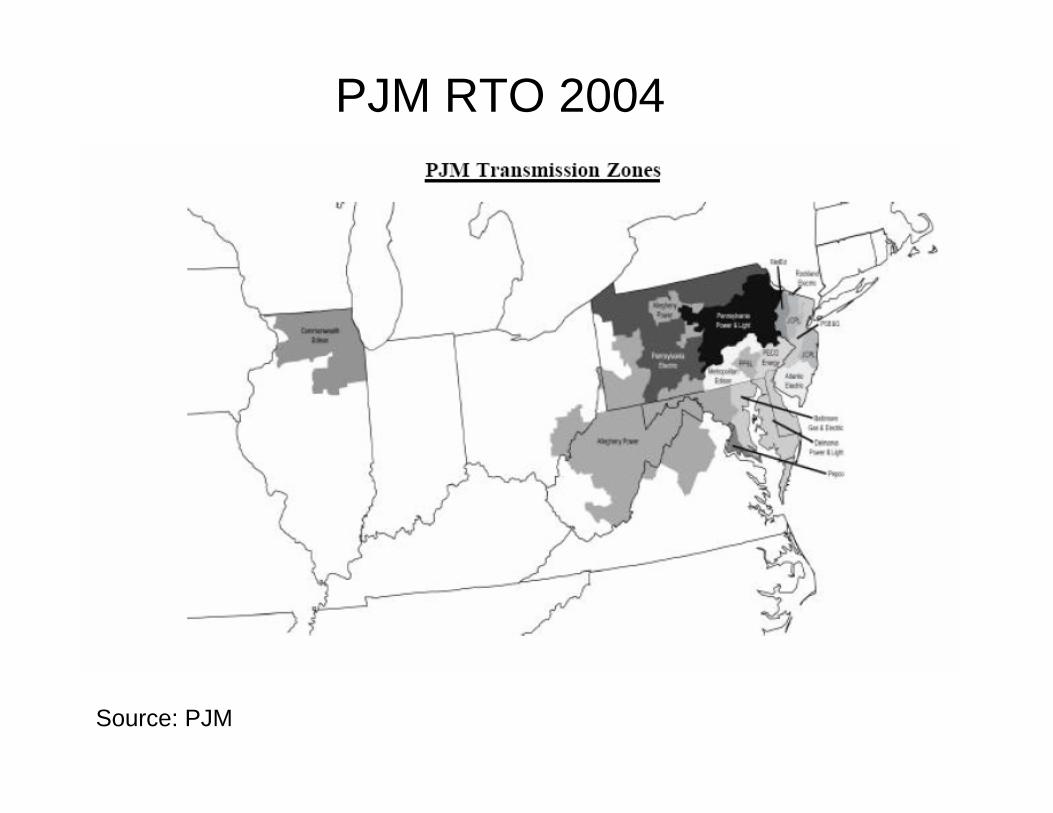
PJM RTO 2004
Source: PJM
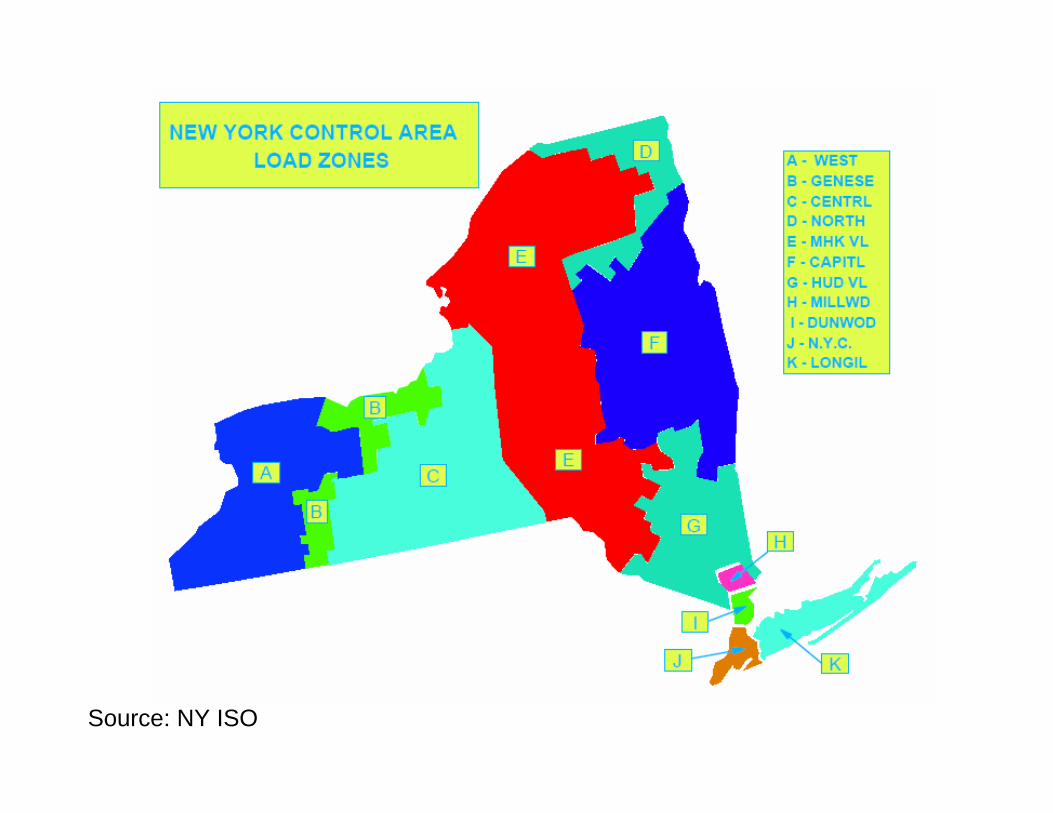
Source: NY ISO
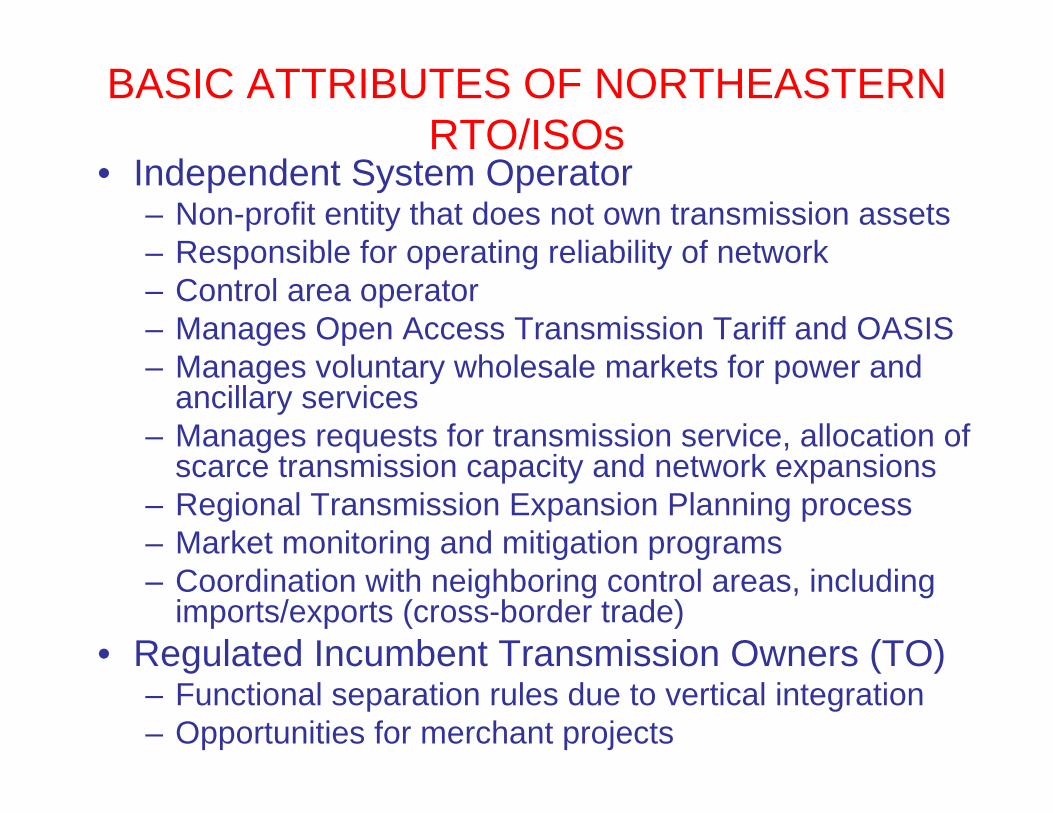
BASIC ATTRIBUTES OF NORTHEASTERN RTO/ISOs
• Independent System Operator– Non-profit entity that does not own transmission assets– Responsible for operating reliability of network– Control area operator– Manages Open Access Transmission Tariff and OASIS– Manages voluntary wholesale markets for power and
ancillary services– Manages requests for transmission service, allocation of
scarce transmission capacity and network expansions– Regional Transmission Expansion Planning process– Market monitoring and mitigation programs– Coordination with neighboring control areas, including
imports/exports (cross-border trade)• Regulated Incumbent Transmission Owners (TO)
– Functional separation rules due to vertical integration– Opportunities for merchant projects

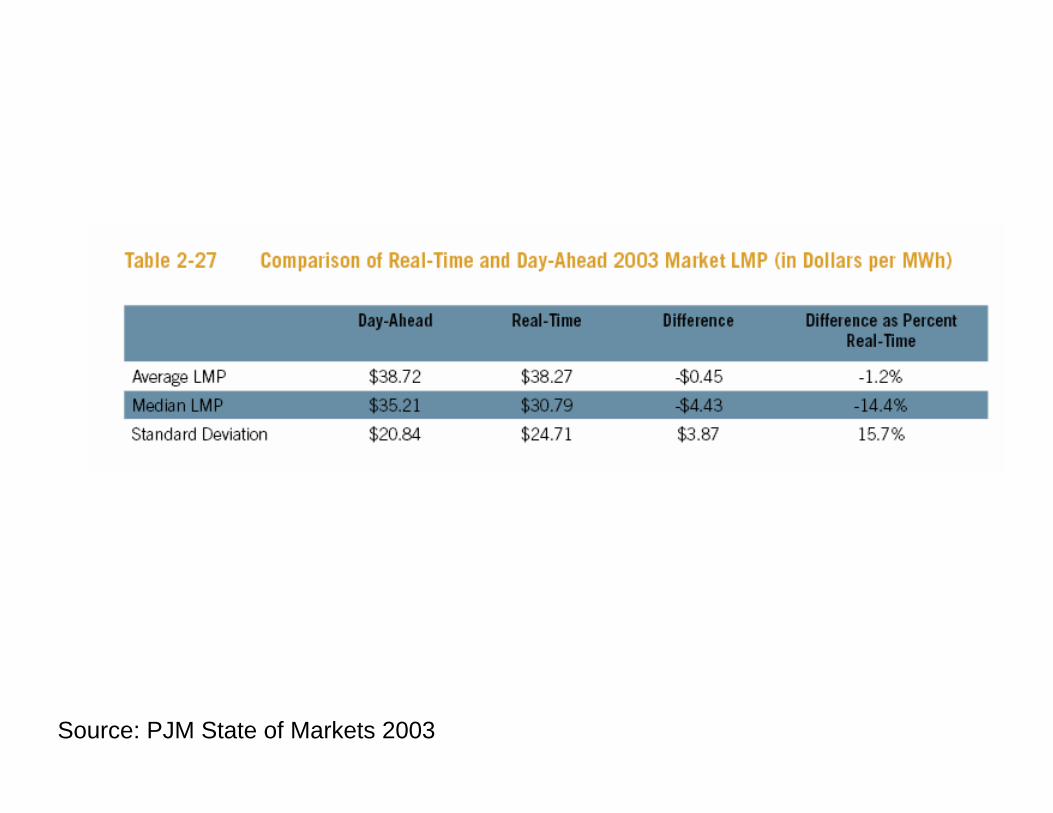
BASIC FEATURES OF WHOLESALE MARKET DESIGN
• Security constrained bid-based dispatch using state-estimator network model– Day-ahead hourly markets – Real-time market (adjustments, imbalances, 5-minutes)– Self-scheduling permitted subject to imbalance and congestions
charges• Resulting LMPs calculated at each bus
– Marginal cost of congestion– Marginal cost of losses (not yet in PJM)
• Market-based provision of ancillary services integrated with day-ahead and real-time energy markets
• All transmission service customers must pay costs of congestion based on differences in LMPs between source and sink of power transactions– Day-ahead– Real-time
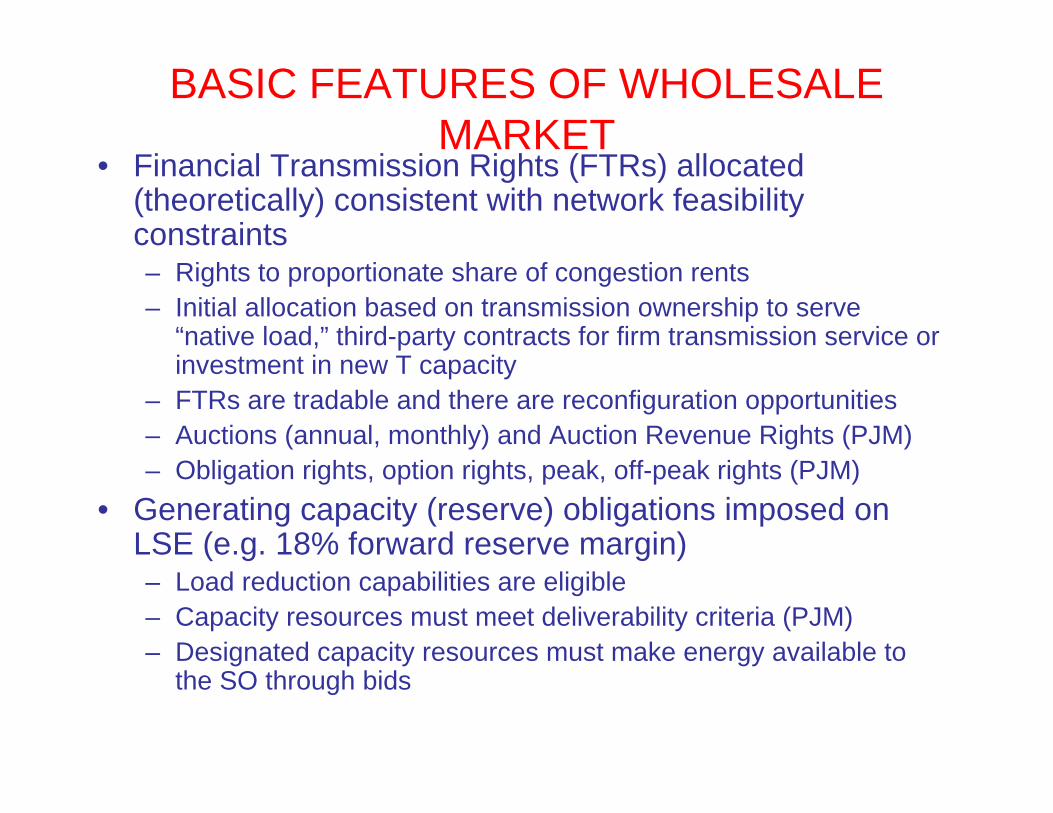
BASIC FEATURES OF WHOLESALE MARKET
• Financial Transmission Rights (FTRs) allocated (theoretically) consistent with network feasibility constraints– Rights to proportionate share of congestion rents– Initial allocation based on transmission ownership to serve
“native load,” third-party contracts for firm transmission service or investment in new T capacity
– FTRs are tradable and there are reconfiguration opportunities– Auctions (annual, monthly) and Auction Revenue Rights (PJM)– Obligation rights, option rights, peak, off-peak rights (PJM)
• Generating capacity (reserve) obligations imposed on LSE (e.g. 18% forward reserve margin)– Load reduction capabilities are eligible– Capacity resources must meet deliverability criteria (PJM)– Designated capacity resources must make energy available to
the SO through bids

MARKET MONITORING AND MITIGATION
• $1000/MWh general bid cap• Local market power mitigation rules
– Bid caps– RMR contracts– Must-offer restrictions– Interaction with computation of market prices
• Must offer requirements• Ex-post bid/price adjustments• Monitoring of individual market participant
behavior and market performance
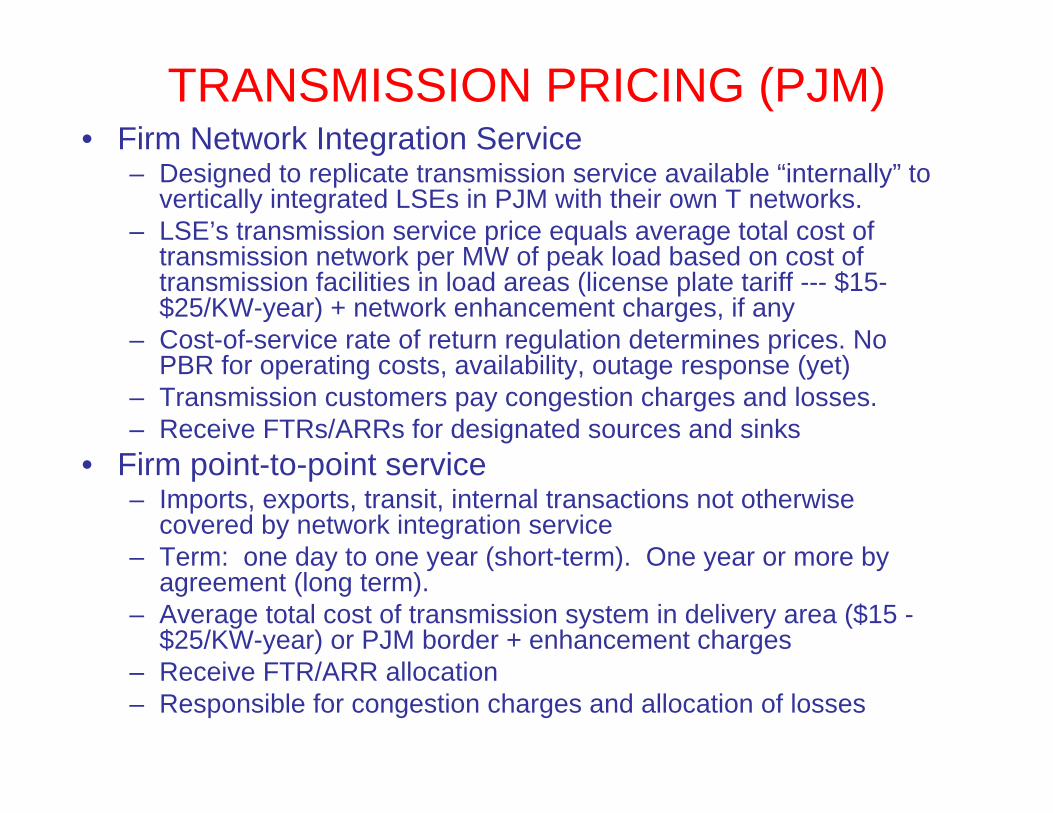
TRANSMISSION PRICING (PJM)• Firm Network Integration Service
– Designed to replicate transmission service available “internally” to vertically integrated LSEs in PJM with their own T networks.
– LSE’s transmission service price equals average total cost of transmission network per MW of peak load based on cost of transmission facilities in load areas (license plate tariff --- $15-$25/KW-year) + network enhancement charges, if any
– Cost-of-service rate of return regulation determines prices. No PBR for operating costs, availability, outage response (yet)
– Transmission customers pay congestion charges and losses.– Receive FTRs/ARRs for designated sources and sinks
• Firm point-to-point service– Imports, exports, transit, internal transactions not otherwise
covered by network integration service– Term: one day to one year (short-term). One year or more by
agreement (long term).– Average total cost of transmission system in delivery area ($15 -
$25/KW-year) or PJM border + enhancement charges– Receive FTR/ARR allocation– Responsible for congestion charges and allocation of losses
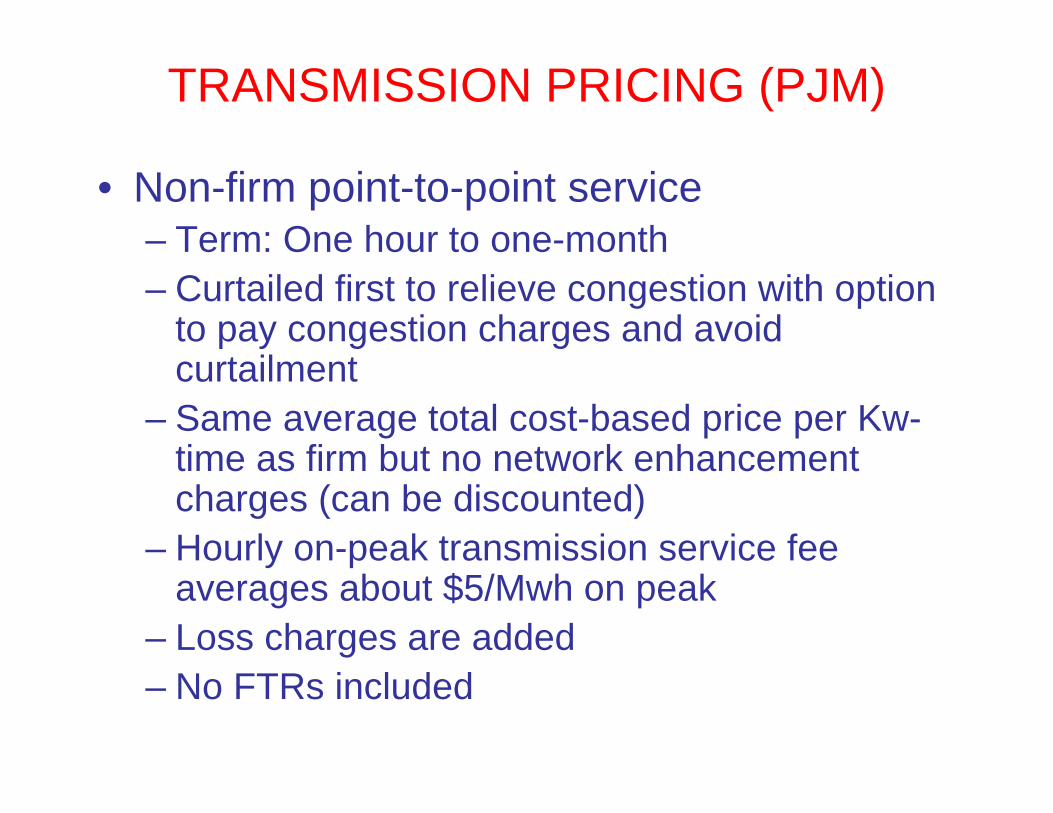
TRANSMISSION PRICING (PJM)
• Non-firm point-to-point service– Term: One hour to one-month– Curtailed first to relieve congestion with option
to pay congestion charges and avoid curtailment
– Same average total cost-based price per Kw-time as firm but no network enhancement charges (can be discounted)
– Hourly on-peak transmission service fee averages about $5/Mwh on peak
– Loss charges are added– No FTRs included
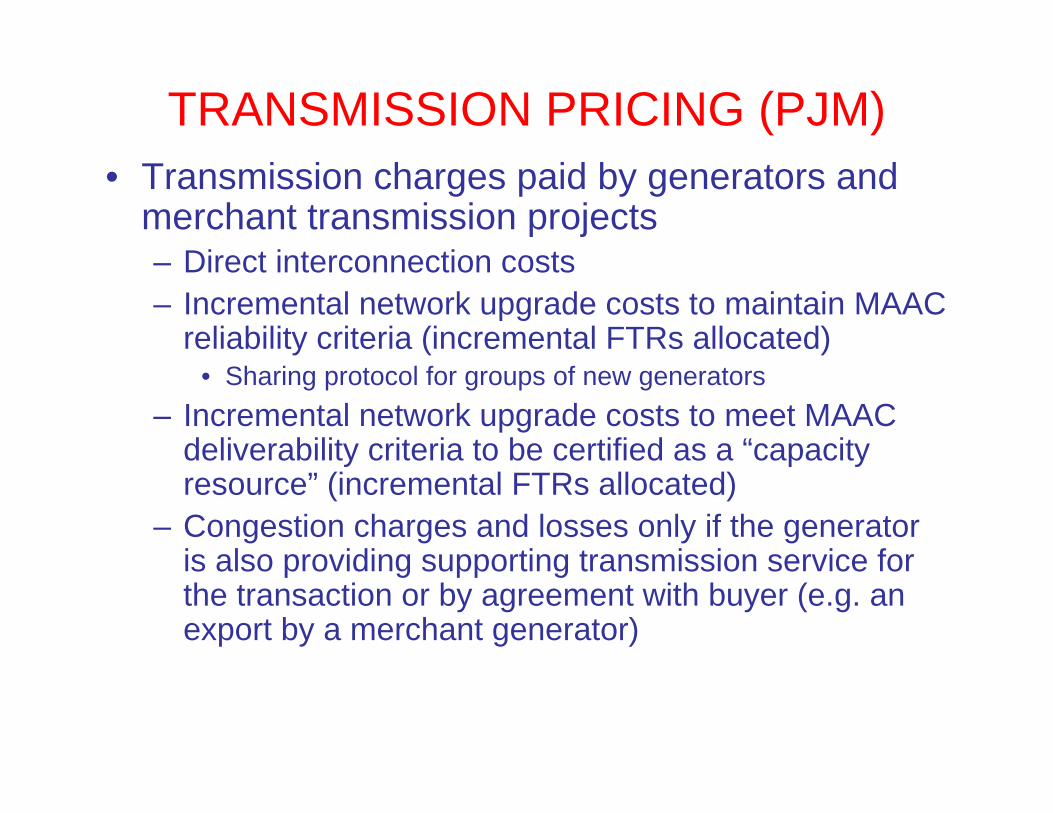
TRANSMISSION PRICING (PJM)• Transmission charges paid by generators and
merchant transmission projects – Direct interconnection costs– Incremental network upgrade costs to maintain MAAC
reliability criteria (incremental FTRs allocated)• Sharing protocol for groups of new generators
– Incremental network upgrade costs to meet MAAC deliverability criteria to be certified as a “capacity resource” (incremental FTRs allocated)
– Congestion charges and losses only if the generator is also providing supporting transmission service for the transaction or by agreement with buyer (e.g. an export by a merchant generator)
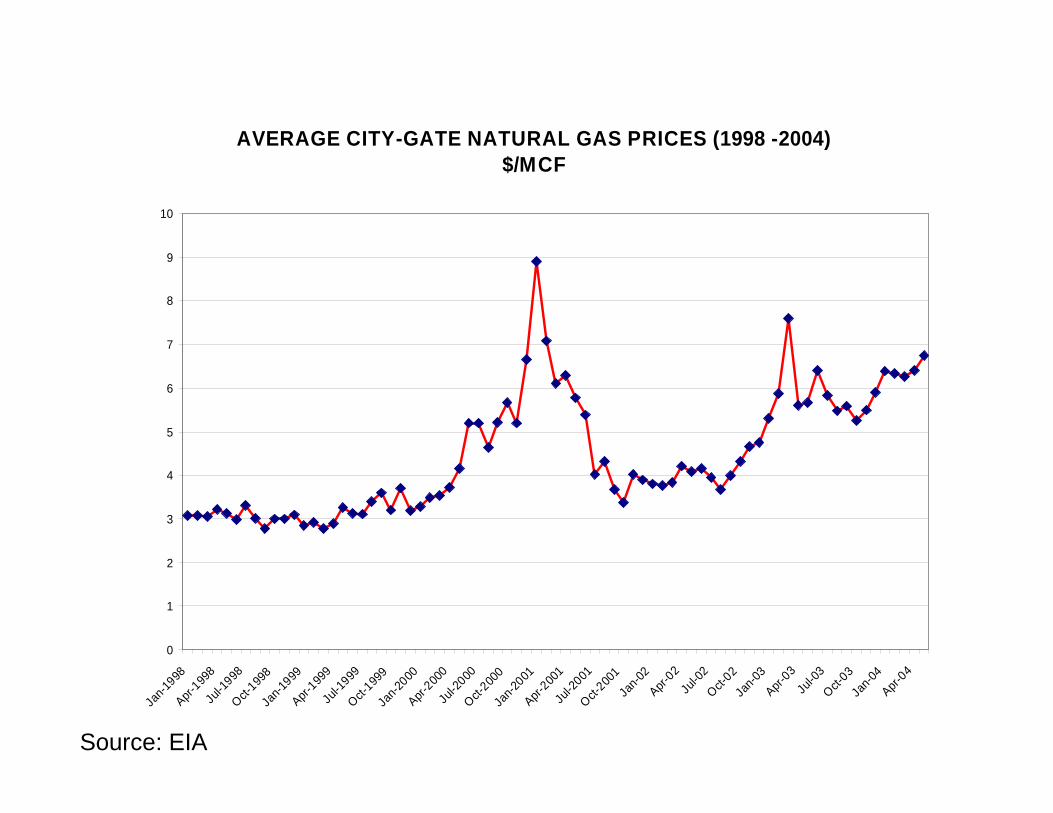
AVERAGE CITY-GATE NATURAL GAS PRICES (1998 -2004) $/MCF
0
1
2
3
4
5
6
7
8
9
10
Jan-1
998Apr-
1998
Jul-1
998Oct-
1998
Jan-1
999Apr-
1999
Jul-1
999Oct-
1999
Jan-2
000Apr-
2000
Jul-2
000Oct-
2000
Jan-2
001Apr-
2001
Jul-2
001Oct-
2001
Jan-0
2Apr-
02Ju
l-02
Oct-02
Jan-0
3Apr-
03Ju
l-03
Oct-03
Jan-0
4Apr-
04
Source: EIA
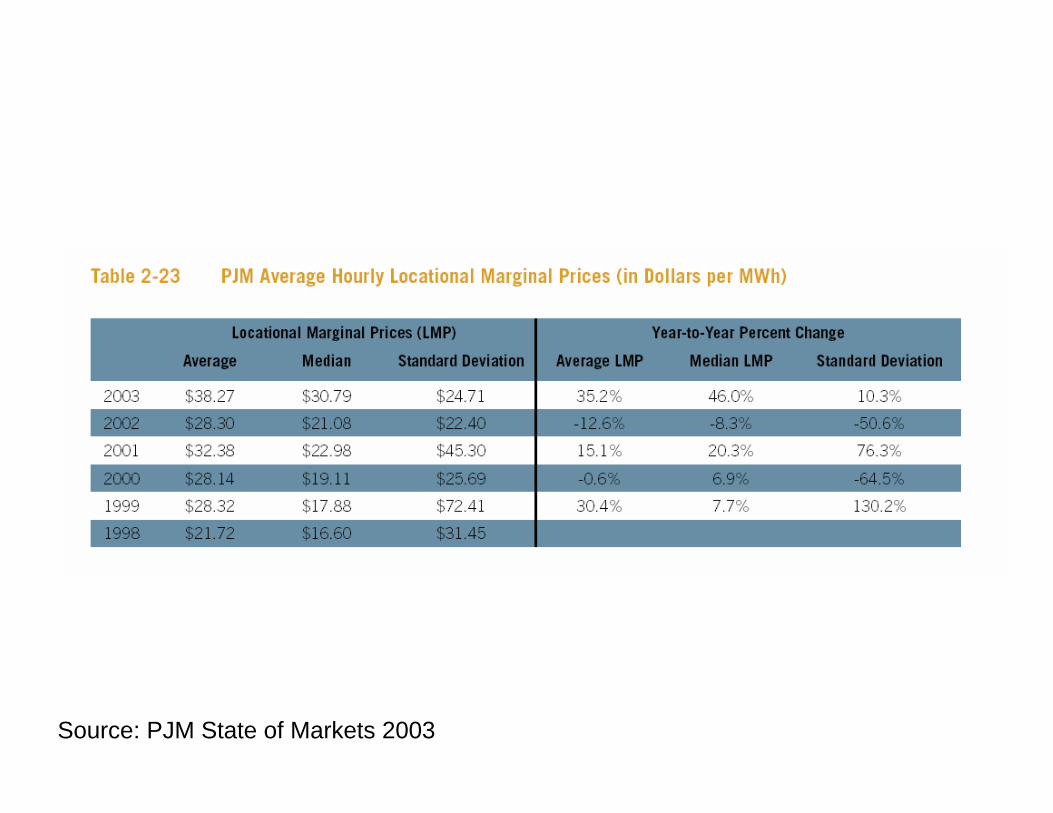
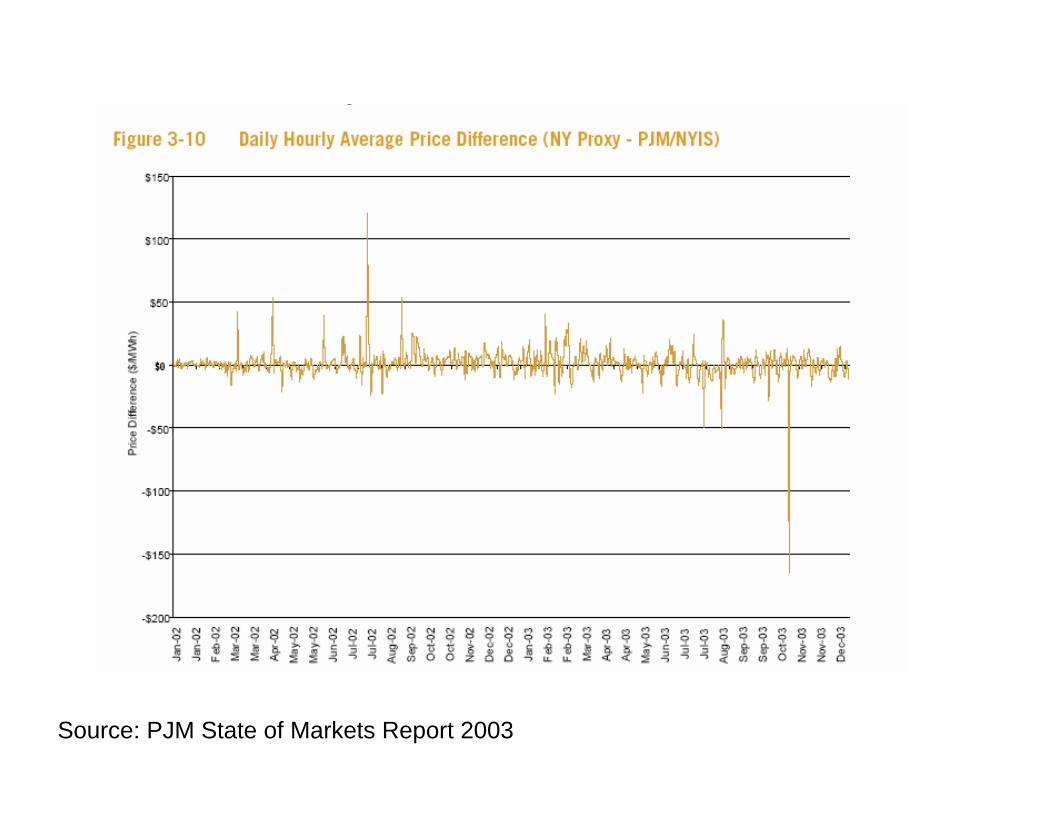
Source: PJM State of Markets 2003

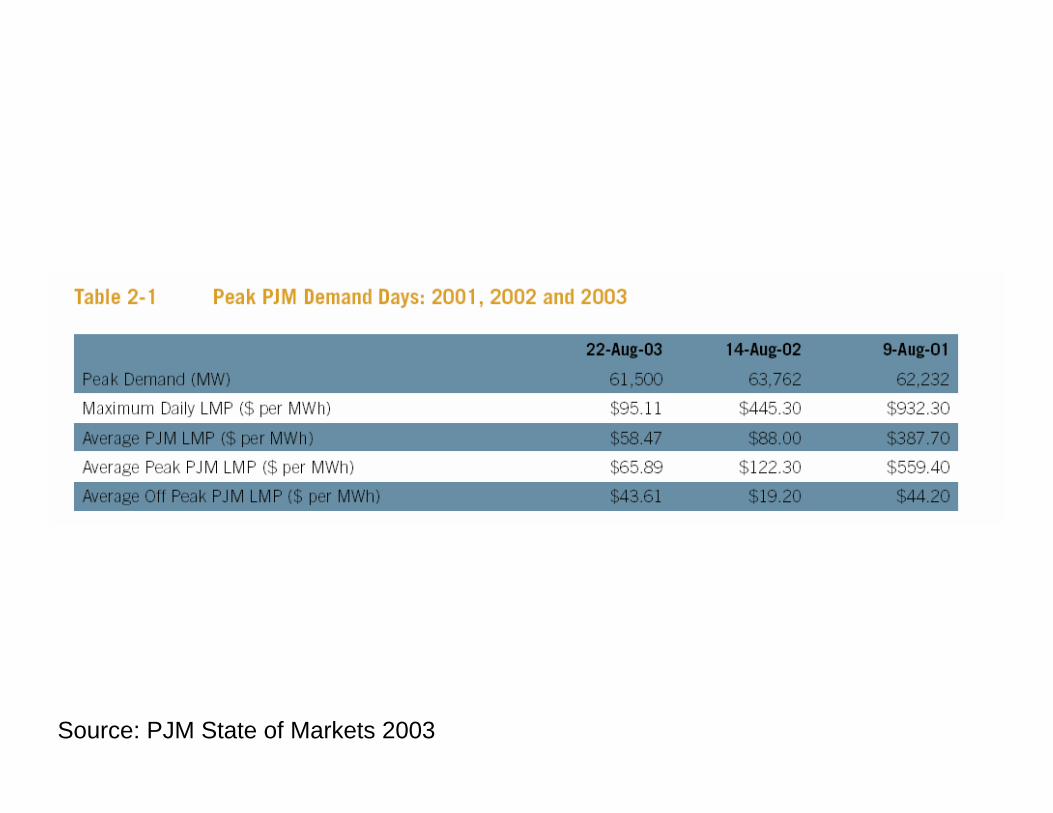
Source: PJM State of Markets 2003
Source: PJM State of Markets 2003
Source: PJM State of Markets 2003

Source: PJM State of Markets 2003

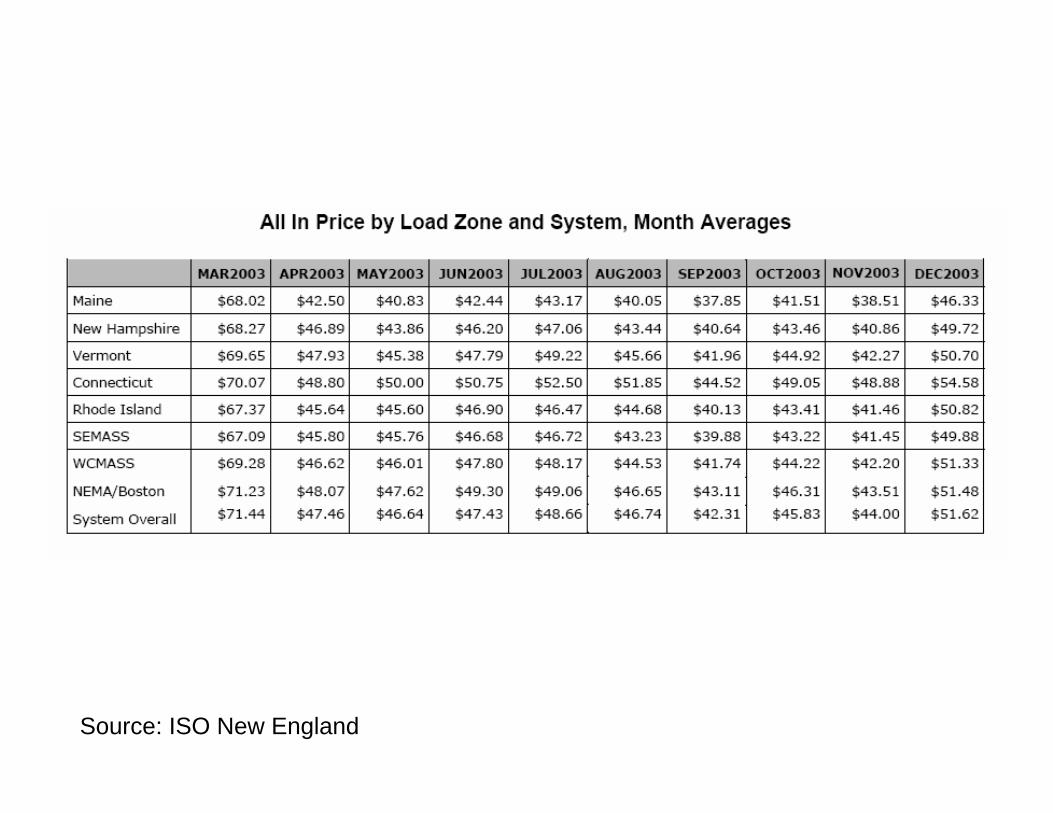
Source: ISO New England
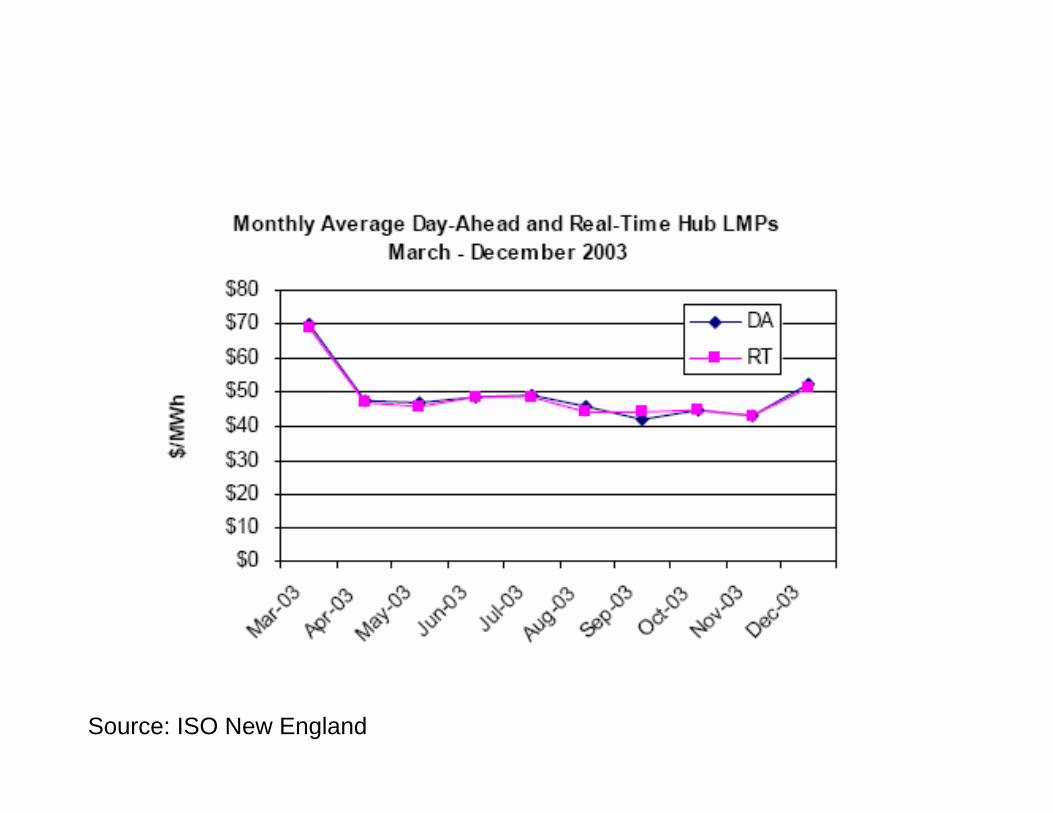
Source: ISO New England
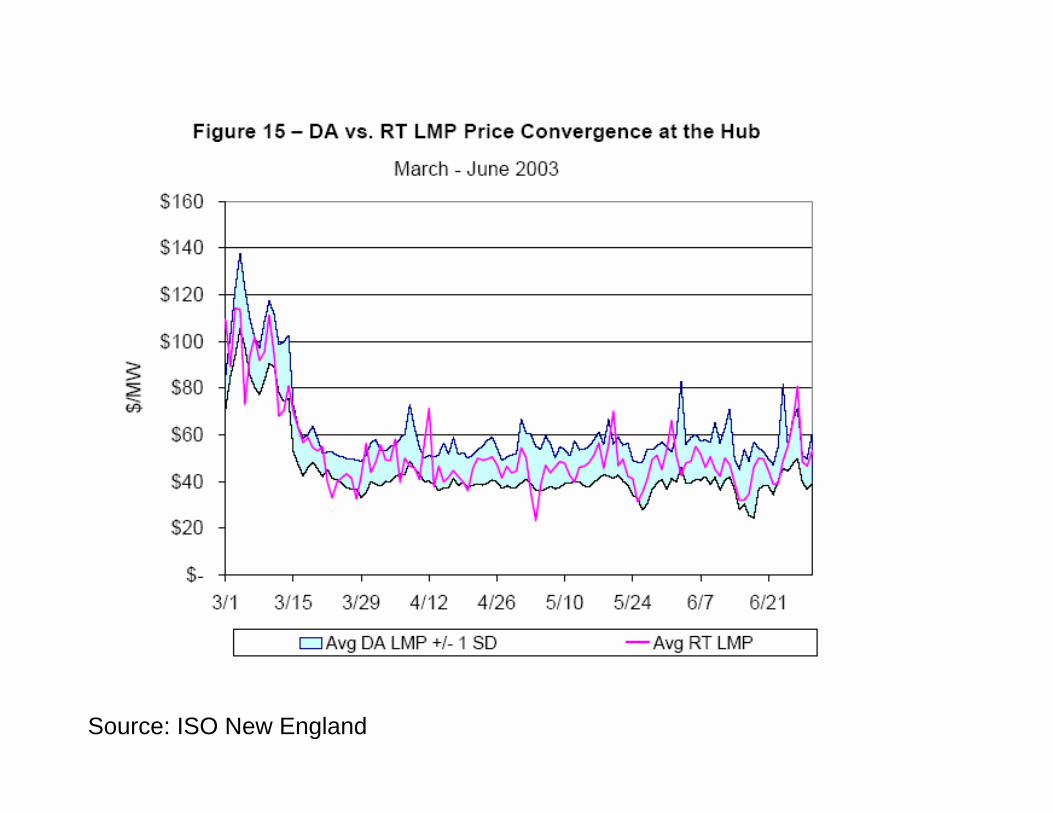
Source: ISO New England
Source: ISO New England
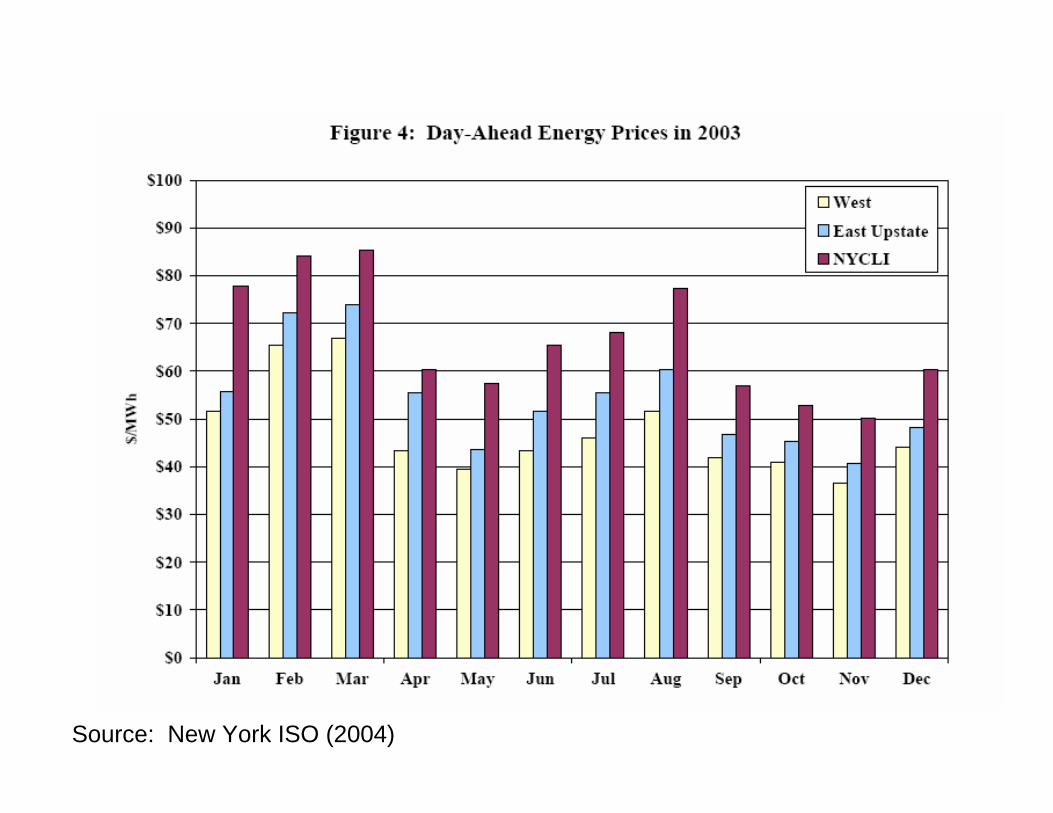
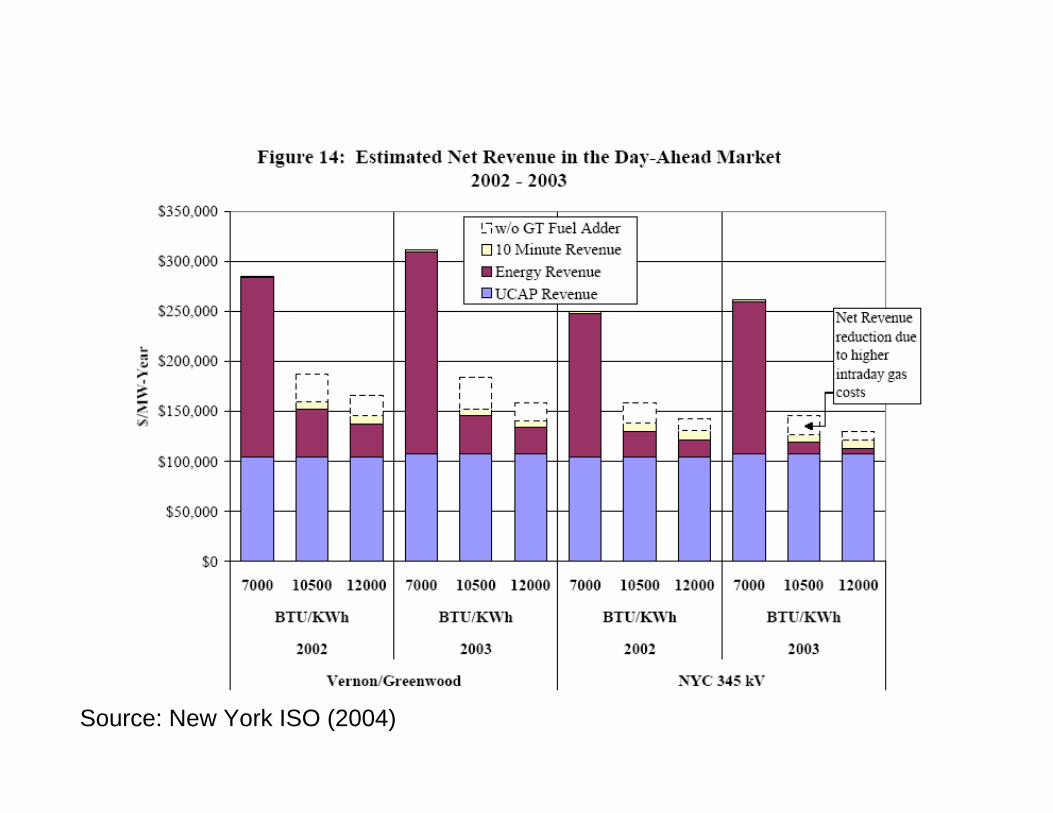
Source: New York ISO (2004)

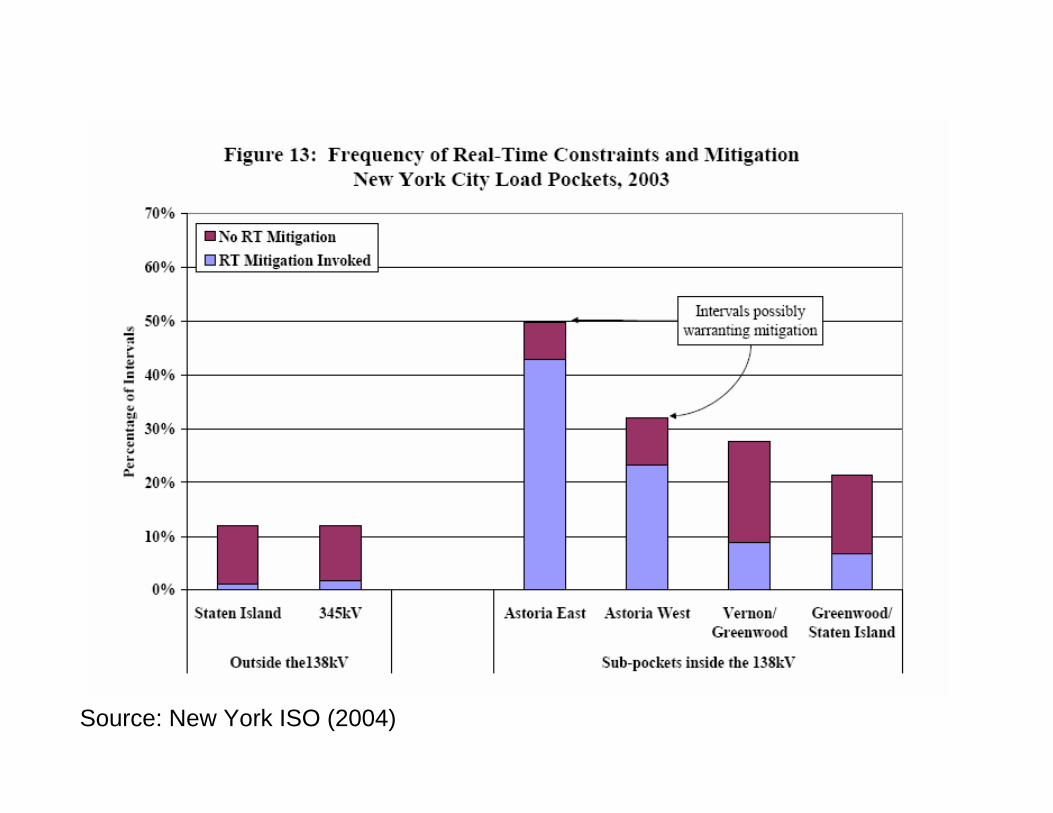
Source: New York ISO (2004)

Source: New York ISO

Source: New York ISO (2004)

Source: New York ISO (2004)
Source: New York ISO (2004)
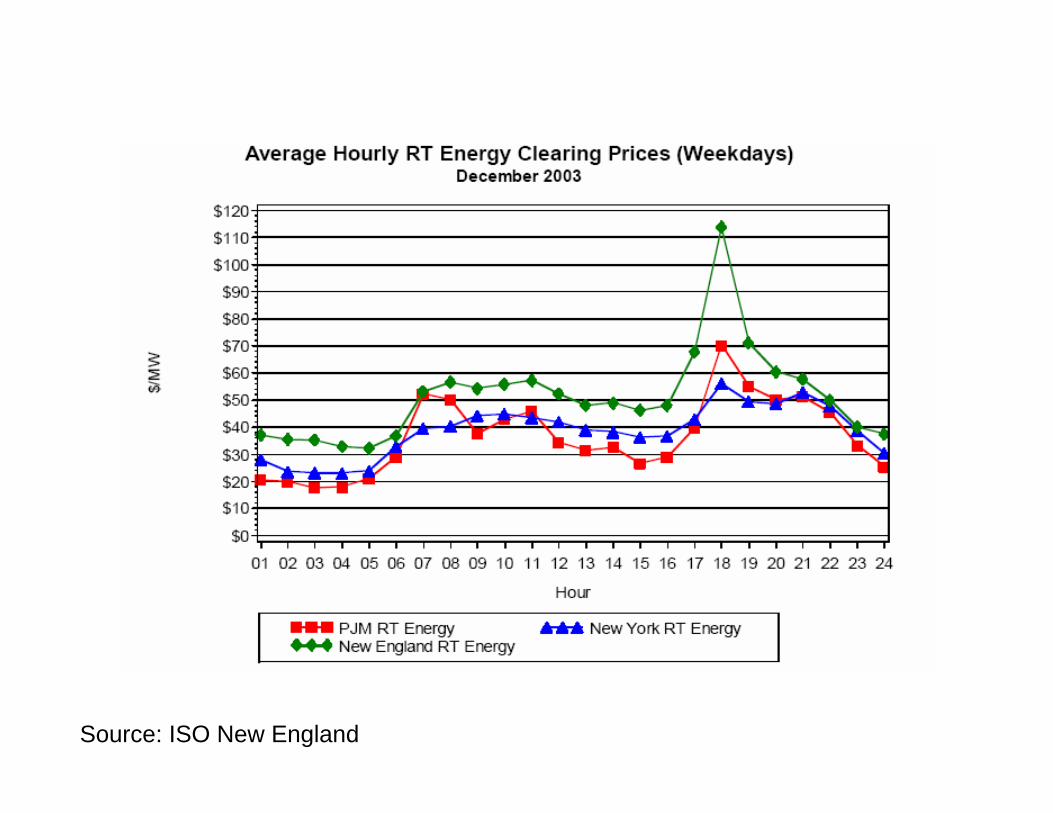
Source: ISO New England
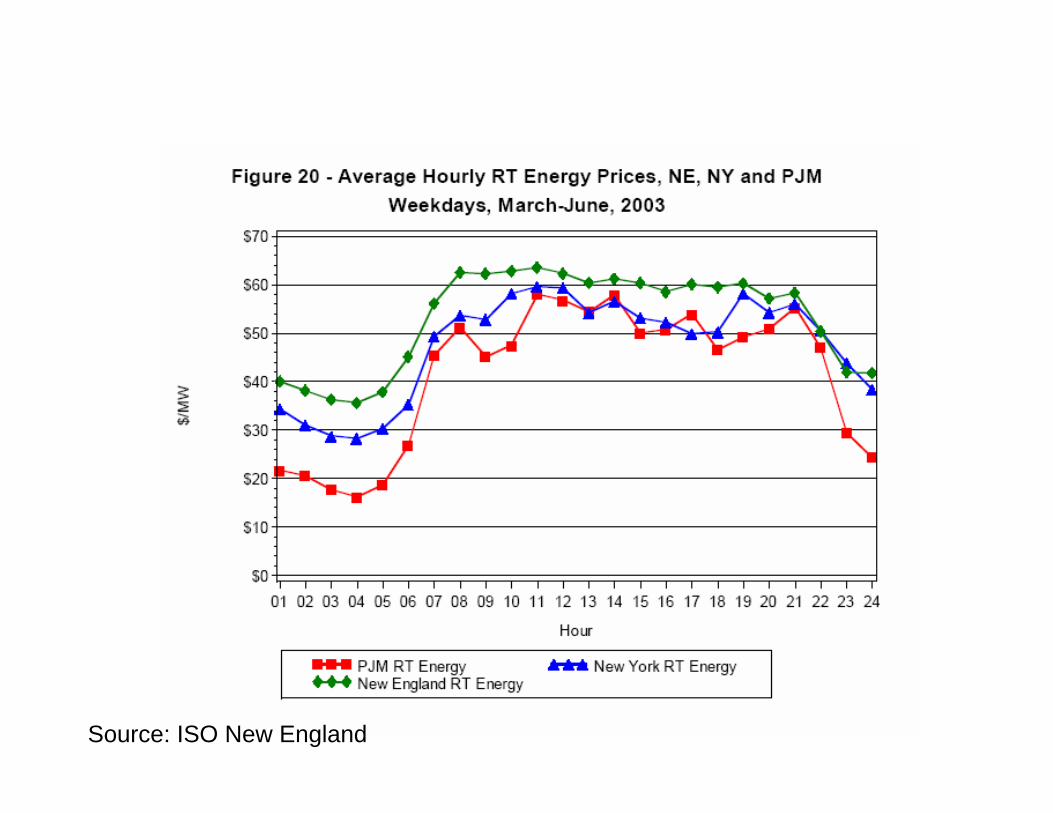
Source: ISO New England
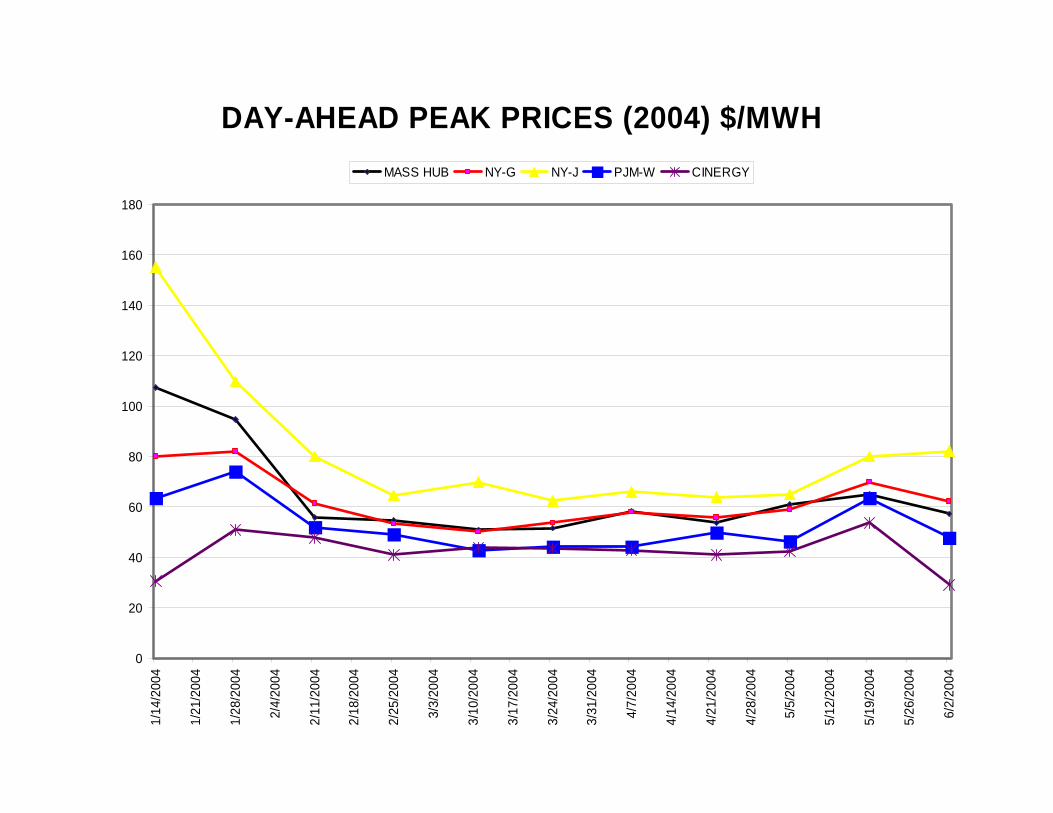
DAY-AHEAD PEAK PRICES (2004) $/MWH
0
20
40
60
80
100
120
140
160
180
1/14
/200
4
1/21
/200
4
1/28
/200
4
2/4/
2004
2/11
/200
4
2/18
/200
4
2/25
/200
4
3/3/
2004
3/10
/200
4
3/17
/200
4
3/24
/200
4
3/31
/200
4
4/7/
2004
4/14
/200
4
4/21
/200
4
4/28
/200
4
5/5/
2004
5/12
/200
4
5/19
/200
4
5/26
/200
4
6/2/
2004
MASS HUB NY-G NY-J PJM-W CINERGY
Source: PJM State of Markets Report 2003

FORWARD MARKETS$/Mwh 6x16 Contract
(June 30, 2004)Delivery July 04 Aug 04 Q4-04 June 05 Cal 05 Cal 06Location
MA Hub 70.0 72.0 62.75 61.0 64.75 60.0
NY Zone A 61.25 63.0 - - 55.75 -NY Zone G 74.0 76.0 - - 66.25 -NY Zone J 99.0 100.0 - - 83.25 -
PJM West 64.6 67.0 50.25 53.25 52.5 49.75
Cinergy 52.3 54.8 40.8 46.3 45.9 43.0
Source: Platt’s Megawatt Daily, June 30, 2004

Average Net Revenues/MW-year (1999-2003)Total Energy Only
CT: $60,000 $36,000CC: $90,000 $60,640
Source: PJM State of Markets 2003

SCARCITY RENTS PRODUCED DURINGOP-4 CONDITIONS ($1000 Price Cap)
($/Mw-Year)YEAR ENERGY OPERATING OP-4 HOURS/
MC=50 MC=100 RESERVES (Price Cap Hit)
2002 $ 5,070 $ 4,153 $ 4,723 21 (3)
2001 $15,818 $14,147 $11,411 41 (15)
2000 $ 6,528 $ 4,241 $ 4,894 25 (5)
1999 $18,874 $14,741 $19,839 98 (1)
Mean $ 11,573 $ 9,574 $10,217 46 (6)
Peaker Fixed-Cost Target: $60,000 - $70,000/Mw-year
Source: New York ISO (2004)

Source: New York ISO (2004)
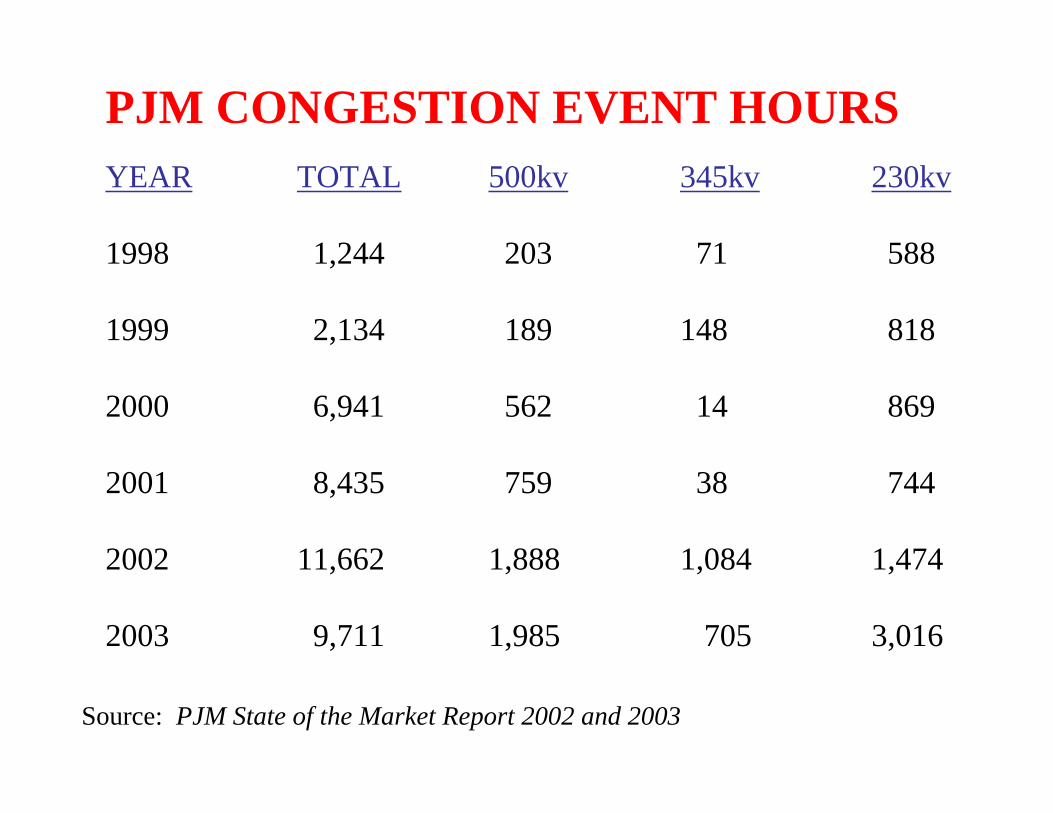
PJM CONGESTION EVENT HOURSYEAR TOTAL 500kv 345kv 230kv
1998 1,244 203 71 588
1999 2,134 189 148 818
2000 6,941 562 14 869
2001 8,435 759 38 744
2002 11,662 1,888 1,084 1,474
2003 9,711 1,985 705 3,016
Source: PJM State of the Market Report 2002 and 2003
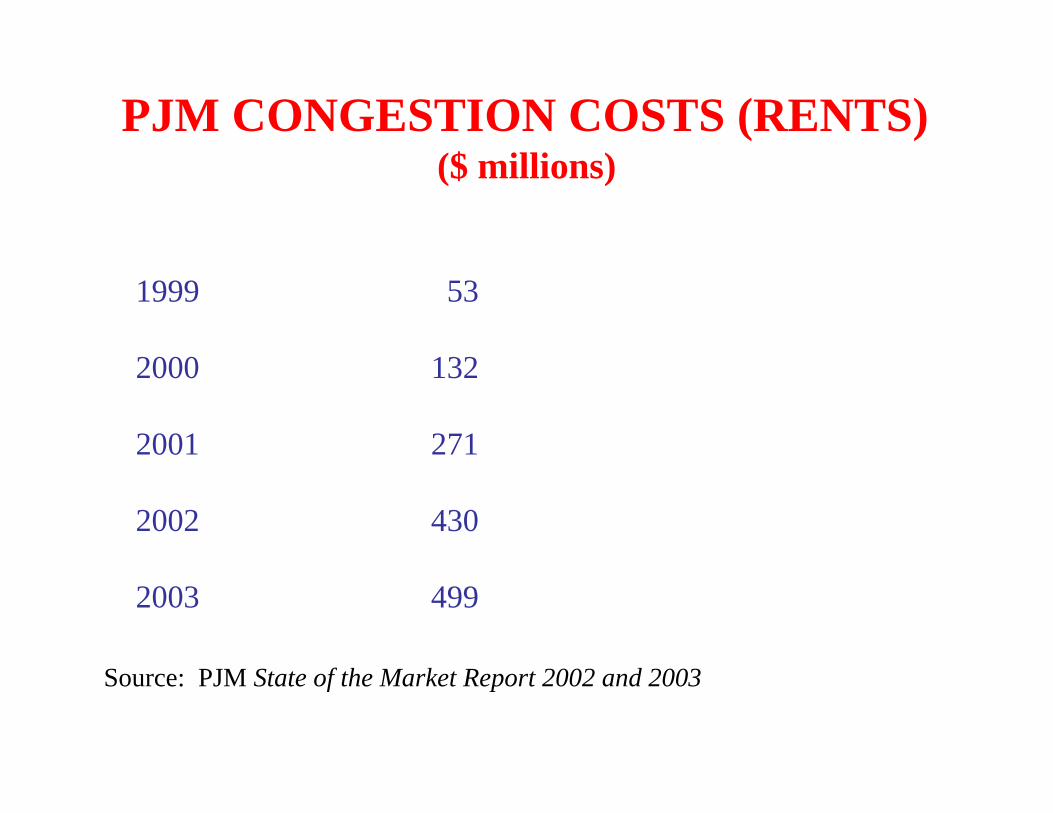
PJM CONGESTION COSTS (RENTS)($ millions)
1999 53
2000 132
2001 271
2002 430
2003 499
Source: PJM State of the Market Report 2002 and 2003
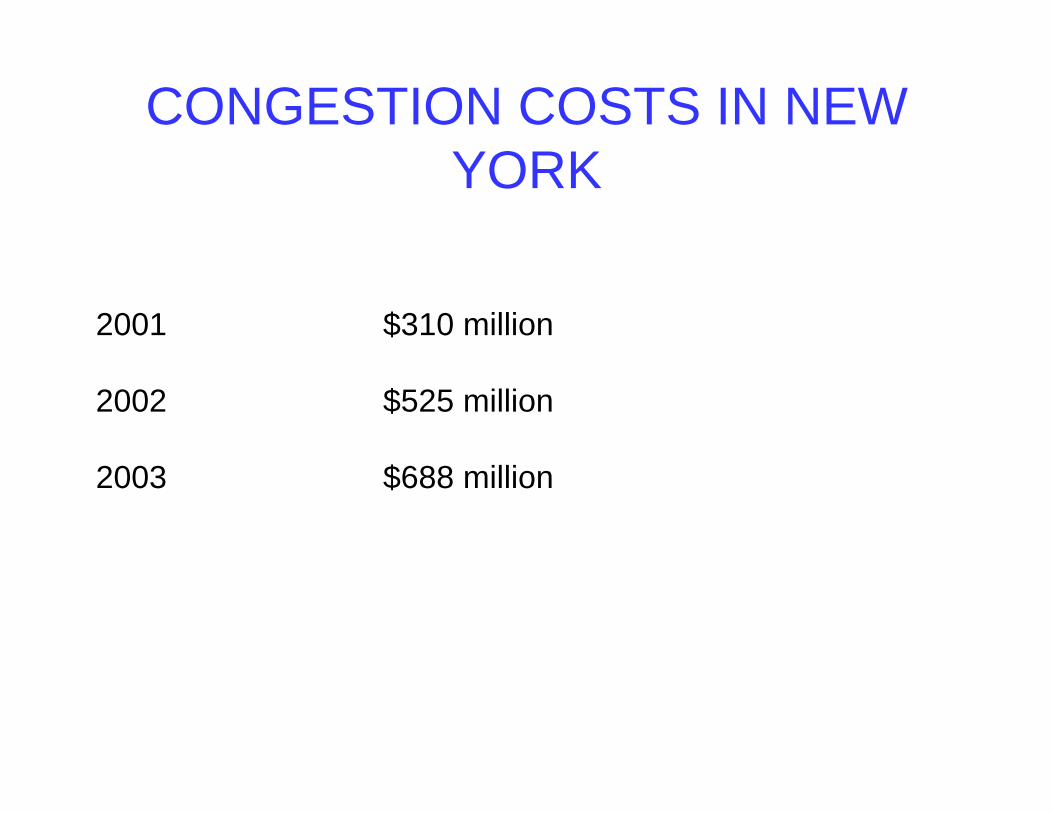
CONGESTION COSTS IN NEW YORK
2001 $310 million
2002 $525 million
2003 $688 million
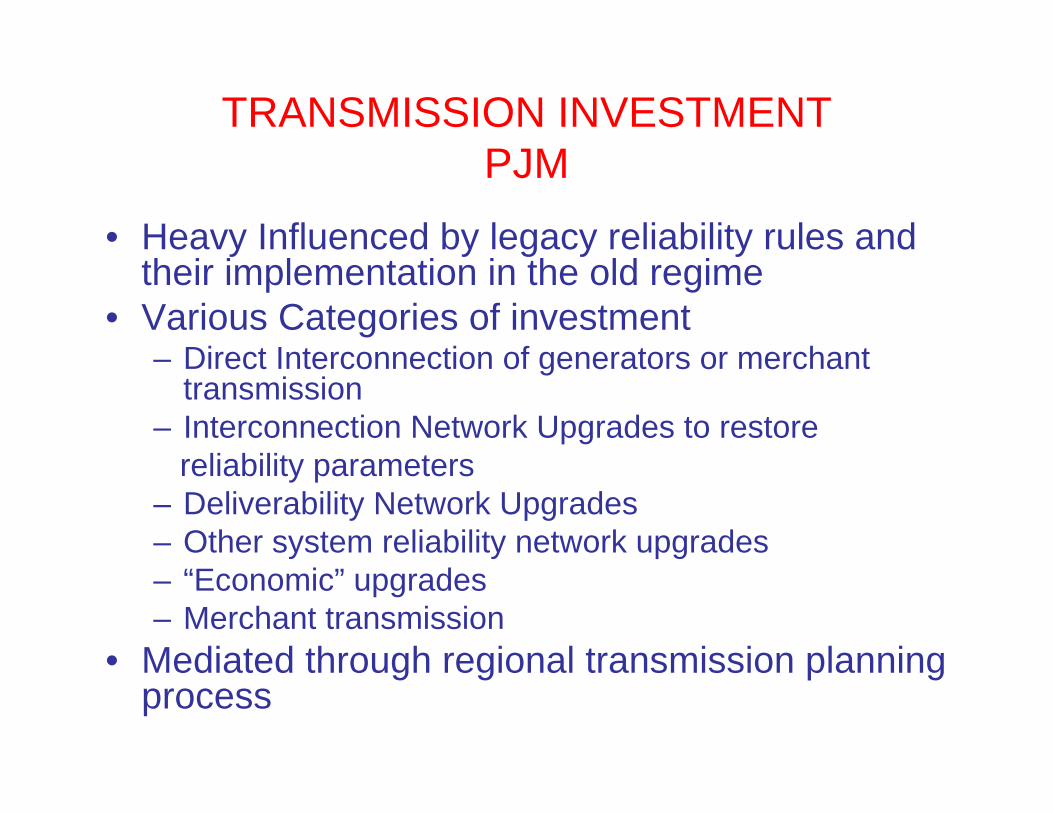
TRANSMISSION INVESTMENTPJM
• Heavy Influenced by legacy reliability rules and their implementation in the old regime
• Various Categories of investment– Direct Interconnection of generators or merchant
transmission– Interconnection Network Upgrades to restore
reliability parameters– Deliverability Network Upgrades– Other system reliability network upgrades– “Economic” upgrades– Merchant transmission
• Mediated through regional transmission planning process
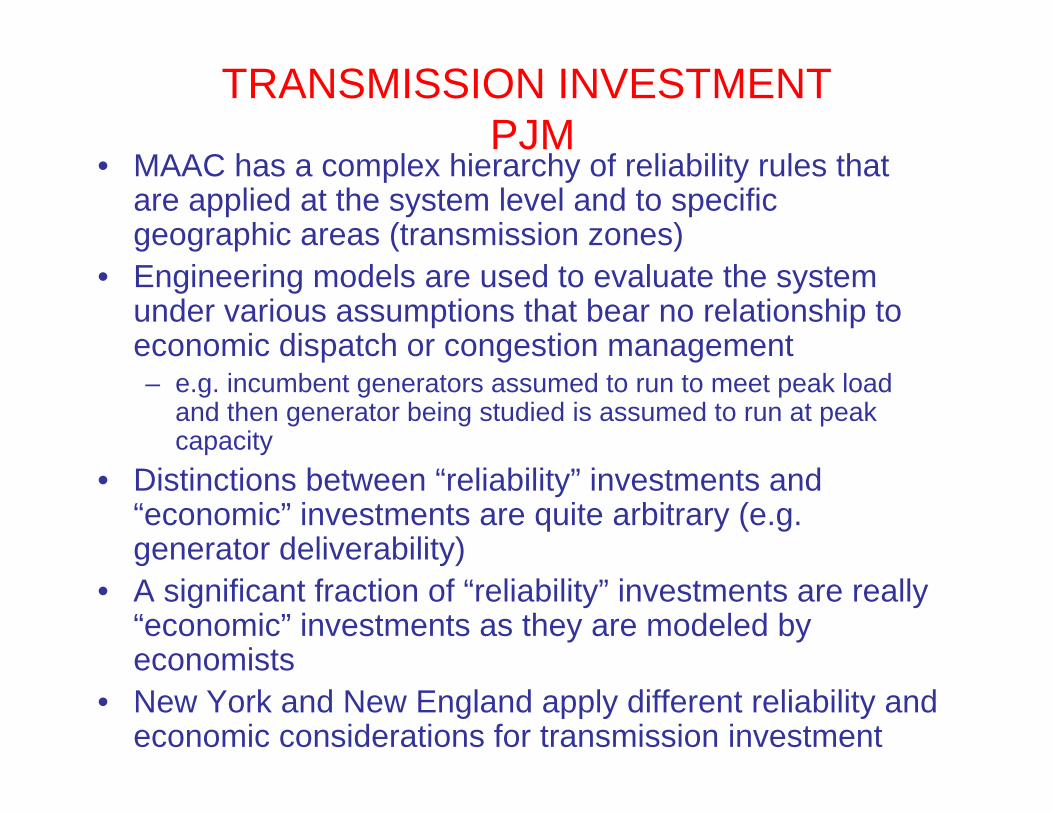
TRANSMISSION INVESTMENTPJM
• MAAC has a complex hierarchy of reliability rules that are applied at the system level and to specific geographic areas (transmission zones)
• Engineering models are used to evaluate the system under various assumptions that bear no relationship to economic dispatch or congestion management– e.g. incumbent generators assumed to run to meet peak load
and then generator being studied is assumed to run at peak capacity
• Distinctions between “reliability” investments and “economic” investments are quite arbitrary (e.g. generator deliverability)
• A significant fraction of “reliability” investments are really “economic” investments as they are modeled by economists
• New York and New England apply different reliability and economic considerations for transmission investment
PJM (MAAC) RELIABILITY RULES
• Normal system operating conditions• N-1• N-2• Multiple Facility Contingency• Generator deliverability• Deliverability to load
TRANSMISSION INVESTMENTPJM
• TO in affected area designs, owns and operates transmission facilities approved in RTEP except for merchant transmission facilities which TO may also own
• Generators pay regulated cost of service prices for:– Direct interconnection facilities– Interconnection Network upgrades (incremental FTRs)– Deliverability network upgrades (incremental FTRs)
• LSEs shares costs of other reliability mandated network upgrades
• Merchants design, own, operate and pay for new merchant facilities and get FTRs for AC enhancements
• Costs of “economic” planned transmission facilities are shared by LSEs with customers who benefit from upgrades (recent addition still in process)
TRANSMISSION INVESTMENT PLANS PJM RTEP (11/03)
• Direct interconnection: $275 million• Interconnection reliability and deliverability
network upgrades: $214 million• Other network reliability upgrades: $197 million• Economic upgrades: (in process)• Merchant
– None completed to date and several proposals withdrawn
– Most active projects are HVDC interconnects with New York or Long Island (supported by long term contract with LIPA)
– Three transformer projects (one inside the fence of a refinery and two by incumbent TO) in development
TRANSMISSION INVESTMENT PLANSISO NEW ENGLAND (11/03)
• Interconnection + Reliability + Economic Benefit: $1.5 – $3.0 billion
• Mostly “reliability”• All regulated projects
NORTHEASTERN MARKET ISSUES• Seams Issues
– Better integrate energy and ancillary services markets– Framework for expanding interconnections between control
areas (merchant is now the only option)• Local market power problems and solutions• Incentives for investment in new generating capacity• Implementation of “resource adequacy” obligations in the
presence of retail competition• Transmission investment framework• Reliability and markets relationships• Incentive regulation (PBR) to control transmission
operating costs and improve reliability of transmission facilities
• Expand demand-side participation in the wholesale market– priority curtailment contracts– real time pricing