whole body distribution of deuterated linoleic and · pdf filewhole body distribution of...
TRANSCRIPT
1
Whole Body Distribution of Deuterated Linoleic and
Alpha-Linolenic Acids and their Metabolites in the Rat
Yu Hong Lin and Norman Salem, Jr.
Section of Nutritional Neuroscience
Laboratory of Membrane Biochemistry & Biophysics
National Institute on Alcohol Abuse & Alcoholism
National Institutes of Health
Running title: Essential fatty acid metabolism in rat organs
Corresponding author and to whom reprint requests should be sent:
Norman Salem, Jr., Ph.D.
5625 Fishers Lane, Room 3N-07
Bethesda, MD 20892-9410 USA
Tel: 301-443-2393
Fax: 301-594-0035
Email: [email protected]
by guest, on May 10, 2018
ww
w.jlr.org
Dow
nloaded from
2
ABSTRACT
Little is known about the uptake or metabolism of essential fatty acids in various mammalian
organs. Thus, the distribution of deuterated alpha-linolenic acid (18:3n-3) and linoleic acid
(18:2n-6) and their metabolites was studied using a stable isotope tracer technique. Rats were
orally administered a single dose of a mixture (20 mg each) of ethyl D5-18:3n-3 and D5-18:2n-6,
and 25 tissues/animal were analyzed for D5-labeled PUFA at 4, 8, 24, 96, 168, 240, 360, 600 h
after dosing. Plasma, stomach and spleen contained the highest concentrations of labeled
precursors at the earliest time points while other internal organs and red blood cells reached their
maximal concentration at 8 h. The time-course data was consistent with liver metabolism of
EFAs, but local metabolism in other tissues could not be ruled out. Brain, spinal cord, heart,
testes and eye accumulated docosahexaenoic acid with time, whereas skin accumulated mainly
20:4n-6. jlr On average, about 16-18% of the D5-18:3n-3 and D5-18:2n-6 initial dosage was
eventually accumulated in tissues, principally in adipose, skin, and muscle. About 6.0% of D5-
18:3n-3 and 2.6% of D5-18:2n-6 were elongated/desaturated and stored mainly in muscle,
adipose and the carcass. The remaining 78% of both precursors was apparently catabolized or
excreted.
Key words
alpha-linolenic acid • linoleic acid • docosahexaenoic acid • arachidonic acid • PUFA • fatty
acid metabolism • stable isotope • GC/MS • essential fatty acid
Abbreviations
BHT, butylated hydroxytoluene
EFA, essential fatty acid
GC, gas liquid chromatography
LC-PUFA, long chain PUFA
MS, mass spectrometry
NCI, negative chemical ionization
PFB ester, pentafluorobenzyl ester
by guest, on May 10, 2018
ww
w.jlr.org
Dow
nloaded from
3
INTRODUCTION
Although many studies have focused upon the liver as the primary site for essential fatty acid
(EFA) metabolism in mammals, relatively little is known about other organs with respect to their
uptake of EFA precursors and products or the manner in which these fatty acids are distributed to
them. In most human studies, the blood compartment is the only sample available and liver
activity must be inferred from plasma analysis, in some cases with the aid of mathematical
modeling (1-3). However, efforts to understand and model human EFA metabolism depend
upon a rigorous description of EFA metabolism in several organ systems. Although this cannot
be achieved in humans for ethical reasons, animal studies allow a complete description of the
role of various organs in processing EFAs in vivo. Such a description would include the uptake
of the EFA precursors, linoleic acid (18:2n-6) and α–linolenic acid (18:3n-3), into various organs
as well as their metabolism to various products along the n-3 and n-6 EFA pathways.
Previous investigations include stable isotope studies in primates and have provided analysis of
EFA uptake and metabolism of the liver, nervous system, and blood stream (4) and, in some
cases, other internal organs such as the heart, lung and kidney (5). Fu and Sinclair provided a
description of the radiolabeling of many guinea pig tissues with 14C-18:2n-6 (6) and 14C-18:3n-3
(7). Whole body balance methods for the analysis of EFA retention in various tissues and β-
oxidation (8) as well as those based on breath test using various 14C-labeled EFAs led to the
conclusion that the fate of the bulk of the EFAs was β-oxidation (9).
It would be valuable to extend these studies to a description of EFA uptake and metabolism to all
of the major tissues in mammals under well controlled and defined dietary conditions. This
information is a first step in the understanding of the EFA requirements and ability to elaborate
and utilize long chain polyunsaturates of various organs and tissues throughout the body. The
present study was thus designed to investigate the incorporation and metabolism of stable
isotope-labeled EFAs into various rat tissues over an extended period. A single oral dose of both 2H5-18:3n-3 and 2H5-18:2n-6 was given to young adult male rats consuming a defined diet
containing 15% of total fatty acids as 18:2n-6 and 3% as 18:3n-3. Negative chemical ionization
by guest, on May 10, 2018
ww
w.jlr.org
Dow
nloaded from
4
GC/MS analysis was used for the quantification of the precursors and their individual
metabolites in 25 components from 4 to 600 h after dosing.
by guest, on May 10, 2018
ww
w.jlr.org
Dow
nloaded from

5
MATERIALS AND METHODS
Animals and diet
All animal procedures were carried out in accordance with the NIH animal care and welfare
guidelines, and the protocol was approved by the NIAAA Animal Care and Use Committee.
Time-pregnant, female Long-Evans hooded rats on the third day of gestation were obtained from
Charles River (Portage, MI, USA) at the age of 13 wks and maintained in our animal facility
under conventional conditions with controlled temperature 22°C and illumination (12 h; 06:00–
18:00); food and water were provided ad libitum. They were immediately placed on a pelleted
custom diet upon arrival, which was modified from the AIN-93G formulation (10) as previously
described (11). In brief, lipid extracted casein was used, carbohydrate sources were modified
and fat sources (10 wt %) were controlled. Fat sources were 77 g of hydrogenated coconut oil,
18 g of safflower oil and 5 g flaxseed oil per kg of diet. The fatty acid distribution in the fat was
77% saturated fatty acids, 4% monounsaturated fatty acid, 15% linoleate, 3% α-linolenate and
only traces of longer chain EFAs (C20 and C22). The male offspring were weaned onto the
same diet at three weeks of age. At seven weeks of age, 9 rats with a body weight of 186 ± 7 g
(mean ± SD) were fasted over night and administrated a single oral dose of 20 mg each of 2H5-
18:3n-3 and 2H5-18:2n-6 ethyl ester using olive oil as the vehicle, or vehicle oil only for control
animal. The animals were then maintained ad libitum on the above-described diet for the
remainder of this “pulse-chase” type of experiment. One animal was euthanized at each of the
following time points after dosing with the isotopic tracers: 4, 8, 24, 96, 168, 240, 360 and 600 h.
A control animal was euthanized at 0 h. Each rat was dissected into a total of 25 components as
detailed below.
Isotope and chemicals
Deuterium-labeled ethyl linolenate (2H5-17, 17, 18, 18, 18-18:3n-3) and deuterium-labeled ethyl
linoleate (2H5-17, 17, 18, 18, 18-18:2n-6) were obtained from Cambridge Isotope Laboratories
(Andover, MA); isotope purities were greater than 95% for the former and 98% for the latter. No
long chain (>C18) PUFA was found. Chemical purity was greater than 95% as determined by
TLC and GC.
by guest, on May 10, 2018
ww
w.jlr.org
Dow
nloaded from
6
Tissue collection
Rats were asphyxiated in carbon dioxide after fasting overnight prior to sacrifice with the
exception of those sacrificed at 4 and 8 h who were given access to food immediately after
dosing. Blood was drawn by cardiac puncture when rats were unconscious and separated into
plasma and red blood cell (RBC) at 1800 g × 10 min at 4°C. The head was severed at the neck,
and the brain and eyes (with associated glands) were removed. The body was placed on ice
during this second stage of dissection. Gall bladders were removed prior to liver and other
abdominal tissues collection so as to avoid contamination with bile fluid. The thymus, salivary
and thyroid glands were dissected out. Abdominal organs collected include the heart, lung, liver,
pancreas, kidney, spleen, bladder, and testis. The gastrointestinal tract (GI, from duodenum to
anus) was emptied and rinsed with ice cold saline (0.85% NaCl); the stomach was subsequently
removed and treated similarly. The spinal cord was then separated from the vertebrae.
Subsequently, skin with fur was collected from both the skull and carcass, visible subcutaneous
fat and visceral fat were pooled, and muscle (skeletal muscle and chest), and bones (short-carpal
bones; irregular-vertebrae, long-humerus, radius, ulna, femur, tibia; flat-scapula, ilium) with
periosteum and marrow were collected. The brown adipose under the neck skin and along the
vertebrae was collected. The remaining carcass contained the skull, ribs, cartilage, paws, tail and
the remaining parts not listed above. After dissection, organs were carefully washed with cold
normal saline, blotted, wrapped frozen on dry ice, then stored in a -80°C freezer until analysis.
Each of the 25 components listed in Table 1 were analyzed individually. In some cases, for
graphical purposes, individual tissues were combined to make 11 categories including adipose,
skeleton, circulatory system, digestive system, muscle, nervous system, respiratory system, skin,
urogenital system and the remaining carcass, as detailed in Figure 1. Excretions were not
collected.
Homogenization, lipid extraction of various tissues and derivatization reactions
Large organs/tissues were thoroughly diced into fine pieces at 4°C prior to extraction. Organs
were homogenized in methanol containing 0.2 mM BHT (10 mL for 1 g of tissue); one aliquot of
homogenate (about 100 mg of tissue wet wt) was used for total lipid extraction. A motor-
powered, small tissue homogenizer was used for tissue disruption (Omni International, Marietta,
GA). Bones were cut into smaller pieces, cooled with liquid nitrogen and pulverized into a fine
by guest, on May 10, 2018
ww
w.jlr.org
Dow
nloaded from
7
powder with a mortar and pestle over dry ice. One g of this bone powder was placed in 10 mL
methanol-BHT, and sonicated for 10 min (12). The skin/fur was cut to separate the skin from fur
and the subcutaneous fat, which was combined with the white adipose tissue. Skin samples of
about 1 × 1 cm2 containing both epidermis and dermis, were taken from various parts of the rat
body and diced into < 3 × 3 mm2 pieces, mixed completely, and then homogenized (10 mL of
methanol-BHT for 1 g skin sample). One gram of fur from various areas was cut into lengths of
less than 3 mm over dry ice and sonicated in 10 mL of methanol-BHT for 20 min. The carcass
was handled similarly to bone; after freezing on dry ice and powdering with a mortar and pestle,
5 g of carcass powder was sonicated in 50 mL methanol-BHT. White adipose tissue from
different body locations was diced, well mixed, and about 0.25 g of adipose was homogenized in
5 mL of chloroform-methanol (2:1)-BHT solution.
One aliquot of homogenate or sonicate from each tissue was used to extract total lipids of the
tissues according to Folch (13). The total lipid extract was dried under a stream of nitrogen and
transmethylated using boron trifluoride in methanol (14 g/L; Sigma Chemical, St. Louis, MO) as
described by Morrison and Smith (14) and modified by Salem et al (15). The internal standard,
22:3n-3 ethyl ester (60 nmol/sample) was added to each sample prior to lipid extraction. A
separate aliquot of the homogenate was hydrolyzed and derivatized with PFB reagent
(pentafluorobenzyl bromide, diisopropylamine in acetonitrile (1:100:1000, v/v/v) to form fatty
acid PFB-ester for GC/MS negative chemical ionization (NCI) analysis (16) for deuterium-
labeled fatty acids. For GC/MS analysis, 2.5 nmol/sample of 22:3n-3 ethyl ester was added at
the beginning of the lipid extraction as internal standard.
GC/MS analysis
Agilent 5973 mass spectrometer equipped with an Agilent 6890 GC Plus LAN system (Agilent
Technologies, Inc., Wilmington, DE) was used for the quantification of deuterated fatty acids.
An aliquot of 1 µl fatty acid PFB ester per sample was injected onto a DB-FFAP (free fatty acid
phase) capillary column (as above) interfaced directly into the NCI using methane as the reagent
gas. The GC oven temperature was programmed from 125ºC to 245ºC at 8ºC followed by
holding for 37 min. Selected ion monitoring (SIM) of the base peak (M-PFB) for the analytes of
interest, both the precursors and the main metabolites, were carried out with continuous
by guest, on May 10, 2018
ww
w.jlr.org
Dow
nloaded from
8
monitoring and quantitated according to a previously reported method (17). For measurement of
unlabeled fatty acid concentrations in tissues for the calculation of enrichment, GC/FID analysis
was performed on an Agilent 6890 Plus LAN system as previously described (15).
Data Analysis
Isotopically labeled essential fatty acid data was expressed as the concentration, in nmol per g of
tissue wet wt or, for plasma and red blood cells, as nmol per mL. Since animals were sacrificed
over a period of 25 d while still being fed non-labeled food and growing, initial body weight and
tissue weight was lower than at the end of the experiment (Figure 1, bottom). Thus, the fatty
acid concentration values were normalized to the body weight by multiplying the concentration
values by the ratio of the tissue weight at each time point to the initial (time=0) tissue weight.
The amount of each labeled fatty acid per tissue was obtained by multiplying the concentration
by the weight of the whole tissue. The distribution of each labeled fatty acid in the rat whole
body was computed as a percentage by dividing the amount of the labeled fatty acid in a
particular tissue by the sum of the labeled fatty acid in all of the organs/tissues × 100 at each
time point. Areas under the curves were obtained by integrating the area under the curves as a
function of time using a trapezoid estimation method (18).
by guest, on May 10, 2018
ww
w.jlr.org
Dow
nloaded from
9
RESULTS
Tissue dissection
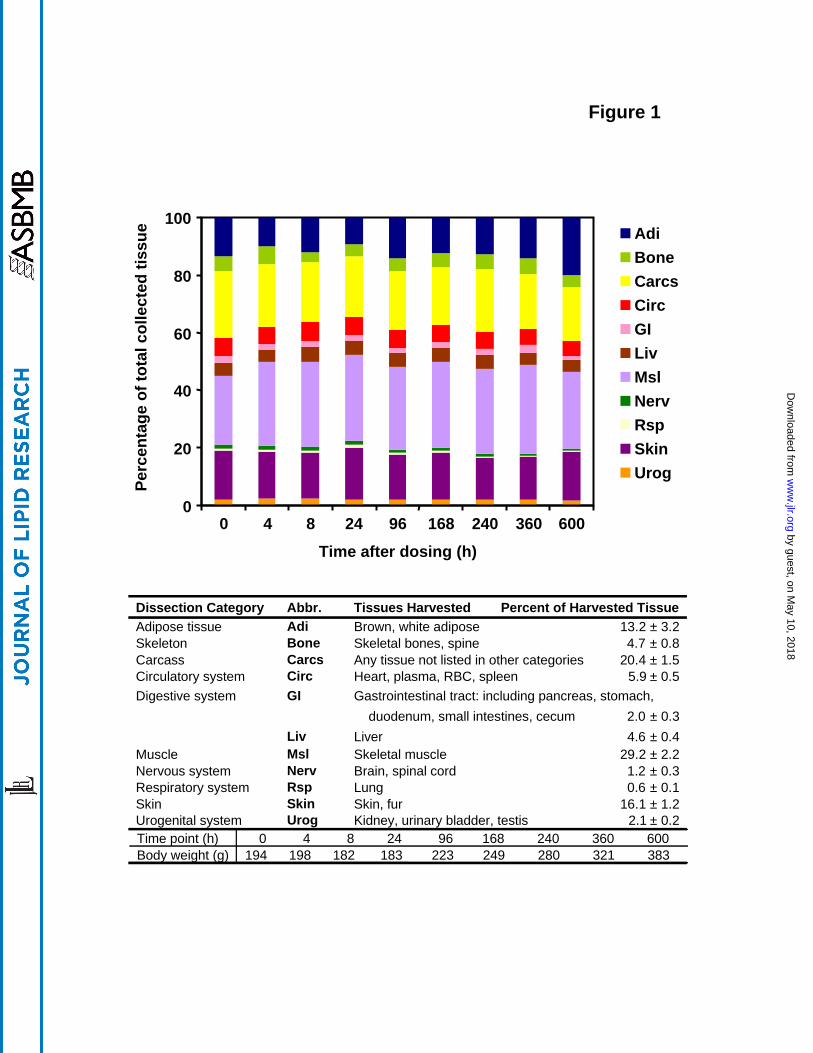
Animals were dissected into 25 components which may be sub-grouped into 11 biological
systems (Figure 1). The proportion of total rat body weight that was recovered in harvested
tissues at the various time points was 82 ± 5 % (n=9). Of this total collected tissue, the largest
components were muscle (29 ± 2%), skin (16 ± 1%), adipose (13 ± 3%), bone (4.8 ± 0.8%), and
liver (4.6 ± 0.4%), while the remaining carcass composed 20 ± 1%. The weight of the
circulatory system, nervous system, respiratory system, urogenital system and remaining
digestive system comprised the remaining ~ 12% of total tissue wet weight (Figure 1). Over the
4 wk duration of the experiment, body weight increased about 2-fold from 194 to 383 g. Over
this period, there was an increased percentage of tissue as adipose, but the proportion of various
organs and tissues in the various biological systems was relatively constant. The tissue
distribution of precursors and their main intermediates as well as the metabolic end-products
were identified and determined in all 25 components harvested, as presented below.
Time-course of deuterated n-3 EFA concentrations in principal organs
The appearance and disappearance of 2H5-18:3n-3 in various tissues and its major in vivo
metabolites are presented in Figure 2 as bar graphs at various time points after a single oral dose
of 2H5-18:3n-3. The precursor was at its maximal concentration (Cmax in nmol/g or nmol/mL) at
the first experimental time point of 4 h in the stomach (112), plasma (15.6) and spleen (12.4) and
decreased sharply by 8 h. However, several other tissues also achieved Cmax precursor
concentrations around 8 h including the red blood cell (2.6), liver (403), heart (27.8), kidney
(47.3), lung (20.2) and testes (1.7). In the eyes, 2H5-18:3n-3 showed values near 3-4 over much
of its time course with a maximum at 168 h (6.8). Very little precursor was detected in brain and
spinal cord.
A somewhat different pattern was observed for the metabolites derived from 2H5-18:3n-3 in vivo.
As the principal location of fatty acid metabolism, the liver showed the highest concentration of 2H5-20:5n-3 (17.7), 2H5-22:5n-3 (42.5), 2H5-22:6n-3 (152) compared with other organs. 2H5-
20:5n-3 was detected in liver at 4 h, reached a maxima at 8 h, maintained a high level after 24 h
by guest, on May 10, 2018
ww
w.jlr.org
Dow
nloaded from
10
and decreased more slowly than its precursor, 2H5-18:3n-3. A similar pattern was seen for
20:5n-3 in spleen (2.1), brain (0.2), spinal cord (0.6), kidney (5.1), and testis (2.6). RBC (1.0),
stomach (2.8), heart (1.8), lung (5.9) and eye (0.4) showed a slower appearance and
disappearance of 2H5-20:5n-3. For 2H5-22:5n-3, Cmax was observed at 24-96 h after dosing in
nearly all tissues. The liver 2H5-22:5n-3 peaked at 24 h and had a rather rapid disappearance
afterwards. Brain and spinal cord were somewhat unusual in that the decay of 2H5-22:5n-3 was
slow after the 96 h peak.
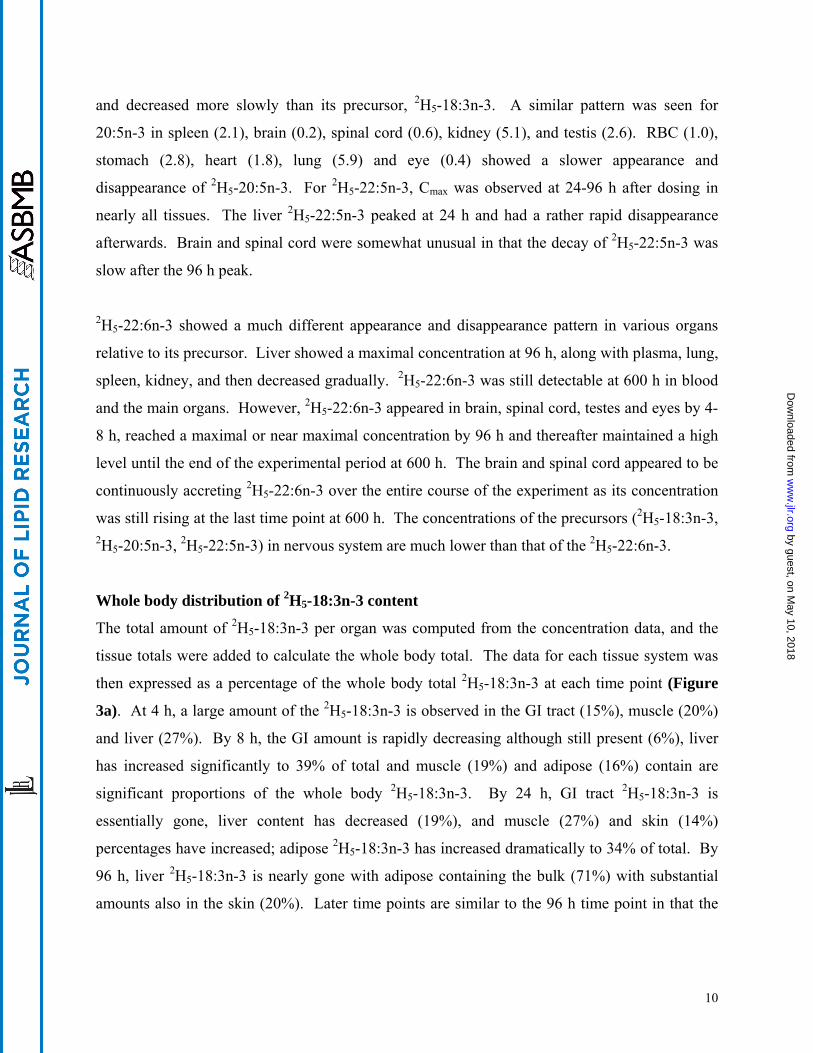
2H5-22:6n-3 showed a much different appearance and disappearance pattern in various organs
relative to its precursor. Liver showed a maximal concentration at 96 h, along with plasma, lung,
spleen, kidney, and then decreased gradually. 2H5-22:6n-3 was still detectable at 600 h in blood
and the main organs. However, 2H5-22:6n-3 appeared in brain, spinal cord, testes and eyes by 4-
8 h, reached a maximal or near maximal concentration by 96 h and thereafter maintained a high
level until the end of the experimental period at 600 h. The brain and spinal cord appeared to be
continuously accreting 2H5-22:6n-3 over the entire course of the experiment as its concentration
was still rising at the last time point at 600 h. The concentrations of the precursors (2H5-18:3n-3, 2H5-20:5n-3, 2H5-22:5n-3) in nervous system are much lower than that of the 2H5-22:6n-3.
Whole body distribution of 2H5-18:3n-3 content
The total amount of 2H5-18:3n-3 per organ was computed from the concentration data, and the
tissue totals were added to calculate the whole body total. The data for each tissue system was
then expressed as a percentage of the whole body total 2H5-18:3n-3 at each time point (Figure
3a). At 4 h, a large amount of the 2H5-18:3n-3 is observed in the GI tract (15%), muscle (20%)
and liver (27%). By 8 h, the GI amount is rapidly decreasing although still present (6%), liver
has increased significantly to 39% of total and muscle (19%) and adipose (16%) contain are
significant proportions of the whole body 2H5-18:3n-3. By 24 h, GI tract 2H5-18:3n-3 is
essentially gone, liver content has decreased (19%), and muscle (27%) and skin (14%)
percentages have increased; adipose 2H5-18:3n-3 has increased dramatically to 34% of total. By
96 h, liver 2H5-18:3n-3 is nearly gone with adipose containing the bulk (71%) with substantial
amounts also in the skin (20%). Later time points are similar to the 96 h time point in that the
by guest, on May 10, 2018
ww
w.jlr.org
Dow
nloaded from
11
major reservoirs for 2H5-18:3n-3 are primarily adipose and, to a lesser extent, skin and muscle.
Very little 2H5-18:3n-3 was detected in the nervous system.
An estimate of the amount of 2H5-18:3n-3 recovered in the whole body was made by adding up
the amounts found in the individual compartments (Figure 3b). After the initial period where it
is noted that some 2H5-18:3n-3 label was lost due to rinsing of the GI system after dissection, a
plateau was reached by 96 h and maintained until the end of the experiment at 600 h at a level of
about 20% of the initial dose.
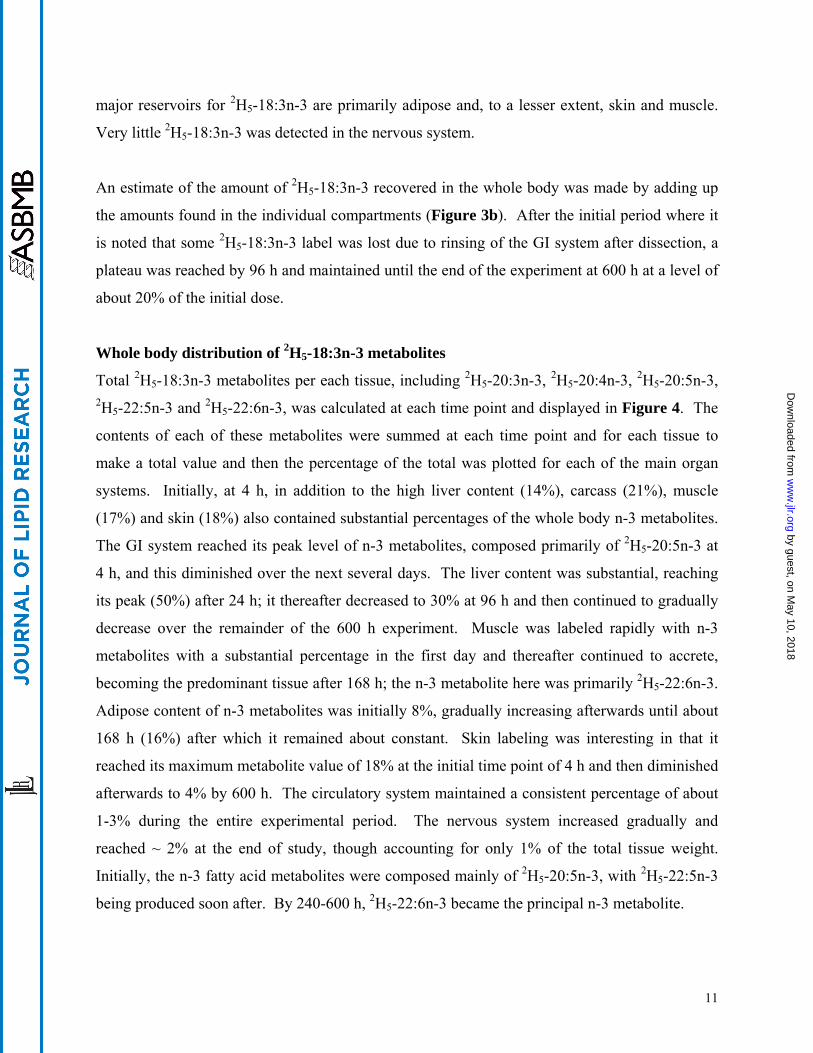
Whole body distribution of 2H5-18:3n-3 metabolites
Total 2H5-18:3n-3 metabolites per each tissue, including 2H5-20:3n-3, 2H5-20:4n-3, 2H5-20:5n-3, 2H5-22:5n-3 and 2H5-22:6n-3, was calculated at each time point and displayed in Figure 4. The
contents of each of these metabolites were summed at each time point and for each tissue to
make a total value and then the percentage of the total was plotted for each of the main organ
systems. Initially, at 4 h, in addition to the high liver content (14%), carcass (21%), muscle
(17%) and skin (18%) also contained substantial percentages of the whole body n-3 metabolites.
The GI system reached its peak level of n-3 metabolites, composed primarily of 2H5-20:5n-3 at
4 h, and this diminished over the next several days. The liver content was substantial, reaching
its peak (50%) after 24 h; it thereafter decreased to 30% at 96 h and then continued to gradually
decrease over the remainder of the 600 h experiment. Muscle was labeled rapidly with n-3
metabolites with a substantial percentage in the first day and thereafter continued to accrete,
becoming the predominant tissue after 168 h; the n-3 metabolite here was primarily 2H5-22:6n-3.
Adipose content of n-3 metabolites was initially 8%, gradually increasing afterwards until about
168 h (16%) after which it remained about constant. Skin labeling was interesting in that it
reached its maximum metabolite value of 18% at the initial time point of 4 h and then diminished
afterwards to 4% by 600 h. The circulatory system maintained a consistent percentage of about
1-3% during the entire experimental period. The nervous system increased gradually and
reached ~ 2% at the end of study, though accounting for only 1% of the total tissue weight.
Initially, the n-3 fatty acid metabolites were composed mainly of 2H5-20:5n-3, with 2H5-22:5n-3
being produced soon after. By 240-600 h, 2H5-22:6n-3 became the principal n-3 metabolite.
by guest, on May 10, 2018
ww
w.jlr.org
Dow
nloaded from
12
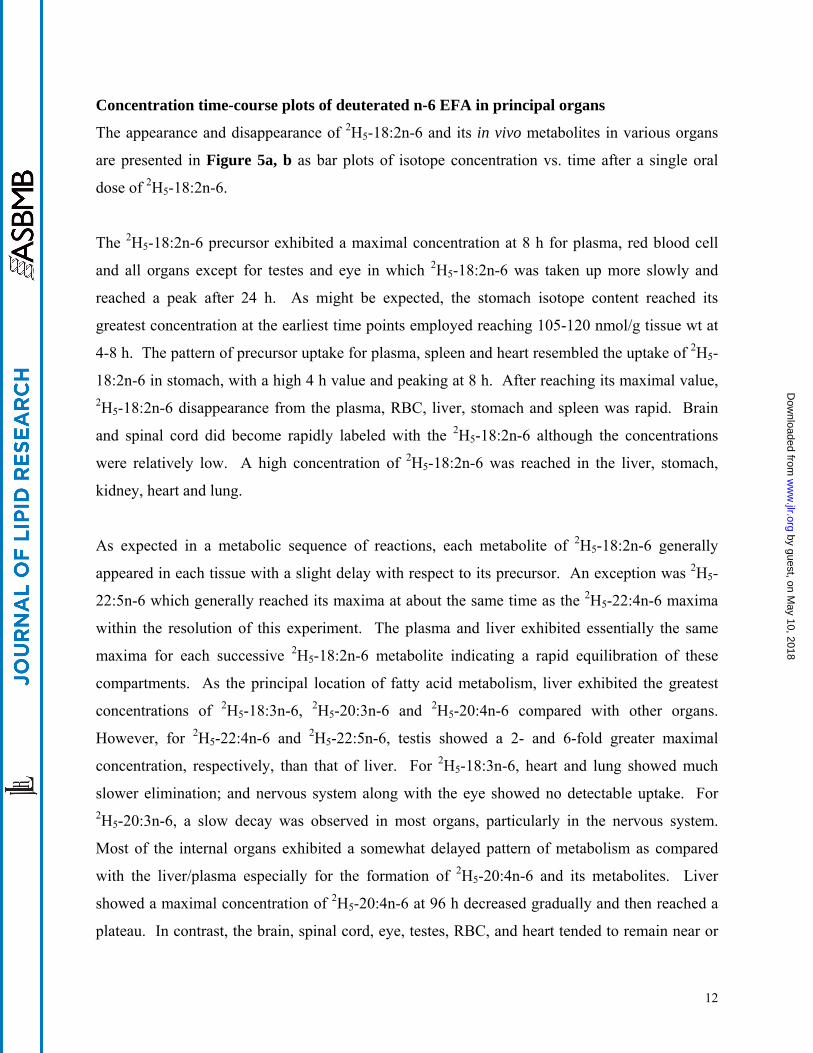
Concentration time-course plots of deuterated n-6 EFA in principal organs
The appearance and disappearance of 2H5-18:2n-6 and its in vivo metabolites in various organs
are presented in Figure 5a, b as bar plots of isotope concentration vs. time after a single oral
dose of 2H5-18:2n-6.
The 2H5-18:2n-6 precursor exhibited a maximal concentration at 8 h for plasma, red blood cell
and all organs except for testes and eye in which 2H5-18:2n-6 was taken up more slowly and
reached a peak after 24 h. As might be expected, the stomach isotope content reached its
greatest concentration at the earliest time points employed reaching 105-120 nmol/g tissue wt at
4-8 h. The pattern of precursor uptake for plasma, spleen and heart resembled the uptake of 2H5-
18:2n-6 in stomach, with a high 4 h value and peaking at 8 h. After reaching its maximal value, 2H5-18:2n-6 disappearance from the plasma, RBC, liver, stomach and spleen was rapid. Brain
and spinal cord did become rapidly labeled with the 2H5-18:2n-6 although the concentrations
were relatively low. A high concentration of 2H5-18:2n-6 was reached in the liver, stomach,
kidney, heart and lung.
As expected in a metabolic sequence of reactions, each metabolite of 2H5-18:2n-6 generally
appeared in each tissue with a slight delay with respect to its precursor. An exception was 2H5-
22:5n-6 which generally reached its maxima at about the same time as the 2H5-22:4n-6 maxima
within the resolution of this experiment. The plasma and liver exhibited essentially the same
maxima for each successive 2H5-18:2n-6 metabolite indicating a rapid equilibration of these
compartments. As the principal location of fatty acid metabolism, liver exhibited the greatest
concentrations of 2H5-18:3n-6, 2H5-20:3n-6 and 2H5-20:4n-6 compared with other organs.
However, for 2H5-22:4n-6 and 2H5-22:5n-6, testis showed a 2- and 6-fold greater maximal
concentration, respectively, than that of liver. For 2H5-18:3n-6, heart and lung showed much
slower elimination; and nervous system along with the eye showed no detectable uptake. For 2H5-20:3n-6, a slow decay was observed in most organs, particularly in the nervous system.
Most of the internal organs exhibited a somewhat delayed pattern of metabolism as compared
with the liver/plasma especially for the formation of 2H5-20:4n-6 and its metabolites. Liver
showed a maximal concentration of 2H5-20:4n-6 at 96 h decreased gradually and then reached a
plateau. In contrast, the brain, spinal cord, eye, testes, RBC, and heart tended to remain near or
by guest, on May 10, 2018
ww
w.jlr.org
Dow
nloaded from
13
at the maximal 2H5-20:4n-6 concentration for an extended period. Deuterated 22:4n-6 also
exhibited an extended plateau pattern for RBC, stomach, spinal cord, kidney, testes, eyeball,
liver and brain. 2H5-22:5n-6 accumulated in several tissues with time including the heart, brain,
spinal cord, testes, RBC and eye.
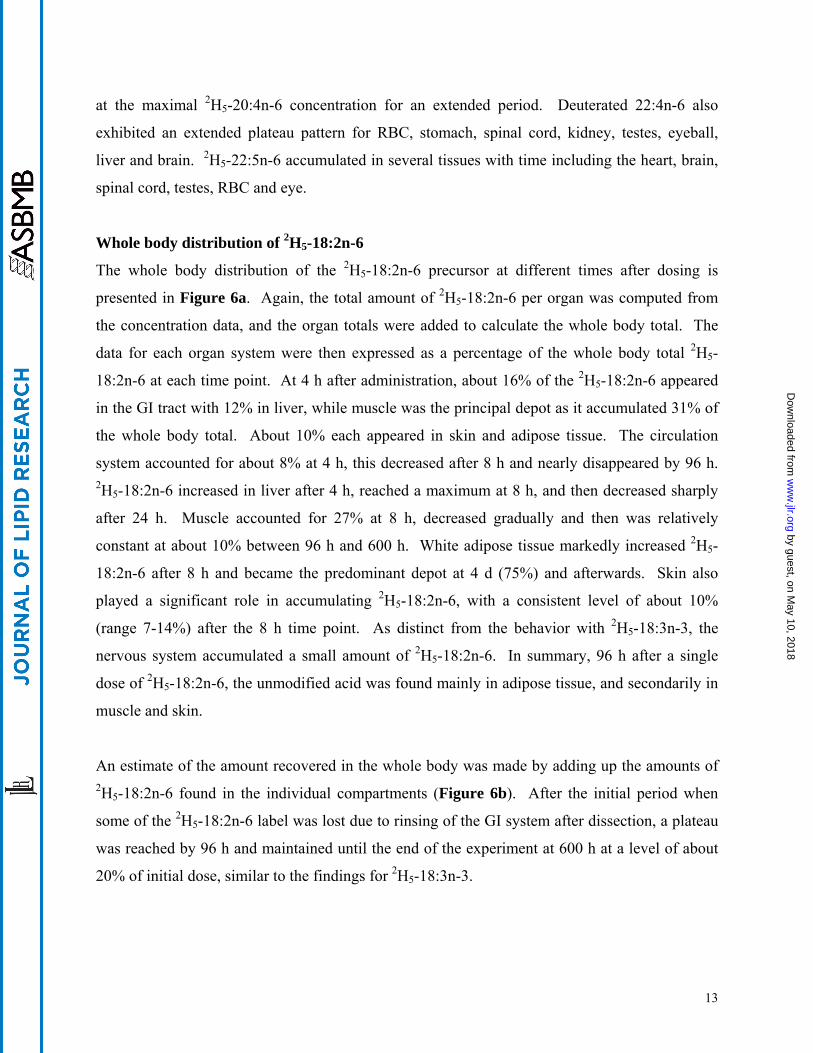
Whole body distribution of 2H5-18:2n-6
The whole body distribution of the 2H5-18:2n-6 precursor at different times after dosing is
presented in Figure 6a. Again, the total amount of 2H5-18:2n-6 per organ was computed from
the concentration data, and the organ totals were added to calculate the whole body total. The
data for each organ system were then expressed as a percentage of the whole body total 2H5-
18:2n-6 at each time point. At 4 h after administration, about 16% of the 2H5-18:2n-6 appeared
in the GI tract with 12% in liver, while muscle was the principal depot as it accumulated 31% of
the whole body total. About 10% each appeared in skin and adipose tissue. The circulation
system accounted for about 8% at 4 h, this decreased after 8 h and nearly disappeared by 96 h. 2H5-18:2n-6 increased in liver after 4 h, reached a maximum at 8 h, and then decreased sharply
after 24 h. Muscle accounted for 27% at 8 h, decreased gradually and then was relatively
constant at about 10% between 96 h and 600 h. White adipose tissue markedly increased 2H5-
18:2n-6 after 8 h and became the predominant depot at 4 d (75%) and afterwards. Skin also
played a significant role in accumulating 2H5-18:2n-6, with a consistent level of about 10%
(range 7-14%) after the 8 h time point. As distinct from the behavior with 2H5-18:3n-3, the
nervous system accumulated a small amount of 2H5-18:2n-6. In summary, 96 h after a single
dose of 2H5-18:2n-6, the unmodified acid was found mainly in adipose tissue, and secondarily in
muscle and skin.
An estimate of the amount recovered in the whole body was made by adding up the amounts of 2H5-18:2n-6 found in the individual compartments (Figure 6b). After the initial period when
some of the 2H5-18:2n-6 label was lost due to rinsing of the GI system after dissection, a plateau
was reached by 96 h and maintained until the end of the experiment at 600 h at a level of about
20% of initial dose, similar to the findings for 2H5-18:3n-3.
by guest, on May 10, 2018
ww
w.jlr.org
Dow
nloaded from
14
Whole body distribution of 2H5-18:2n-6 metabolites
The sum of the 2H5-18:2n-6 metabolites 2H5-18:3n-6, 2H5-20:3n-6, 2H5-20:4n-6, 2H5-22:4n-6, 2H5-22:5n-6 in liver began at a high level (33%) at 4 h and reached a maximum (48%) at 24 h
with a subsequent slow decay over the course of this study (Figure 7a). The n-6 metabolite
decreased in the liver after 96 h appeared to be transferred mainly to muscle, with a smaller
increment in adipose. The circulatory system maintained a percentage of 2-5% during the entire
experimental period. N-6 metabolites in the GI tract peaked at 4 h, in conformity with the early
peak in 2H5-18:2n-6, and then decreased throughout the 600 h time course of the experiment to
1.5% of the whole body total. Similar to the case for the n-3 metabolites, muscle played an
important role in the tissue distribution of n-6 metabolites with about 8-15% in the first days and
increasing to about 35% by 360-600 h. N-6 metabolites in skin were initially very low at 4 h but
thereafter increased to a level of about 14-15% from 96-240 h. The nervous system eventually
accumulated about 1% of total body n-6 metabolites mainly in the form of 2H5-20:4n-6. The
urogenital system accumulated about 3.2% by 24 h, increasing to 5.1% by 600 h mainly due to
the accretion of 2H5-22:4n-6 and 2H5-22:5n-6 in the testes, as well as 2H5-20:4n-6 in kidney. 2H5-
20:4n-6 was the major metabolite of 2H5-18:2n-6 found in the whole body throughout the time
course (Figure 7b).
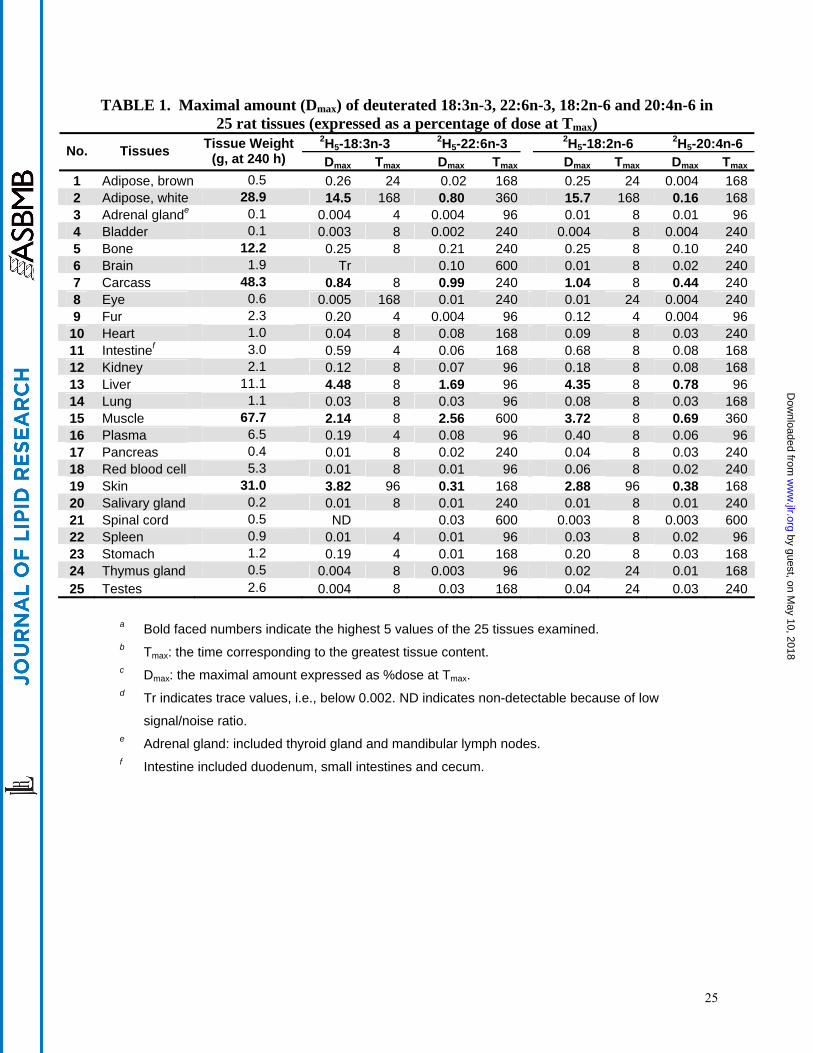
Maximal total amount of precursors and principal metabolite in various organs
The total amount of the various deuterated fatty acids in each organ at the time point (Tmax)
where it reaches its maximal value (Dmax) was calculated. Thus, this calculation was made for 2H5-18:3n-3, 2H5-22:6n-3, 2H5-18:2n-6 and 2H5-20:4n-6 and then expressed as the percentage of
total precursor dose (Table 1). White adipose tissue became the main repository for the two
precursors comprising 14.5% of the dose for the 2H5-18:3n-3 and 16% of the dose for the 2H5-
18:2n-6, although this content was not reached until 168 h after dosing. The white adipose had
much greater precursor content than did the brown adipose, likely due to its greater tissue
weight. Liver was a somewhat distant second with respect to content of unmodified EFA
precursor with 4.5 % of the 2H5-18:3n-3 dose and 4.4% of the 2H5-18:2n-6 dose at the 8 h time
point. Skin and muscle also contained a substantial percentage of precursor dose as both
isotopes were in the 2-4 % range. For both 2H5-22:6n-3 and 2H5-20:4n-6, liver and muscle were
the two major compartments with liver content peaking (1.7 and 0.8 % of dose for 2H5-22:6n-3
by guest, on May 10, 2018
ww
w.jlr.org
Dow
nloaded from
15
and 2H5-20:4n-6, respectively) after 96 h while muscle content (2.6 and 0.7 % of dose for 2H5-
22:6n-3 and 2H5-20:4n-6, respectively) was greatest after 360-600 h. The principal metabolites
in skin and adipose exhibited maxima in the 168-360 h range. The carcass also contained a
considerable amount of both precursors and major metabolites perhaps due to small muscles
(including the diaphragm and rib muscles) and bits of adipose that could not be readily dissected
out. The digestive system does not exhibit a very substantial percentage of the dose at any time
point and this is likely due to the absence of sampling at very short time points (less than 4 h). It
is noteworthy that the distribution (defined in the Data Analysis section of Methods above) of the
precursors, 2H5-18:2n-6 and 2H5-18:3n-3 is quite similar throughout the body. The values of
their metabolites are also somewhat similar, although the values for 2H5-22:6n-3 were generally
higher than those for 2H5-20:4n-6.
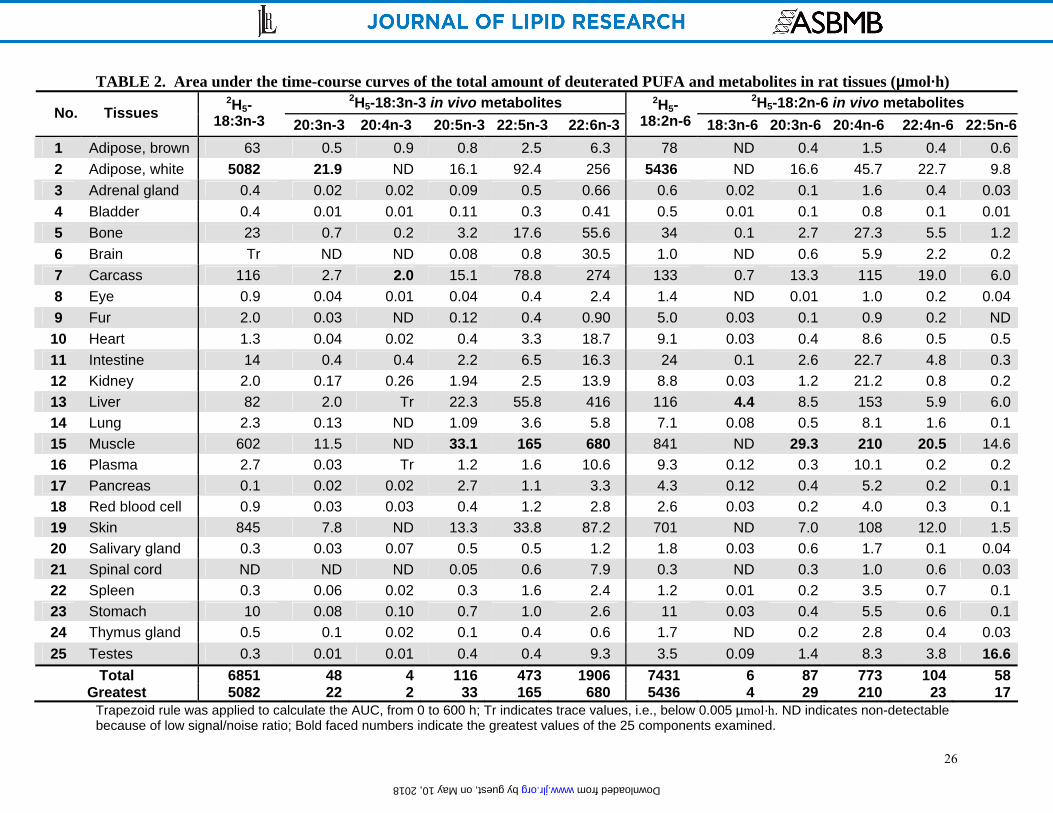
To quantify all 25 tissues with respect to the plot of the total amount/organ at each time point,
the area under the curves was calculated (Table 2). For the precursors 2H5-18:3n-3 and 2H5-
18:2n-6, expressed in unit of µmol·h, white adipose tissue accumulated the most (5082 and 5435,
respectively), followed by skin (845 and 701) and muscle (602 and 841).
The various n-3 metabolites, including 2H5-20:3n-3, 2H5-20:4n-3, 2H5-20:5n-3, 2H5-22:5n-3 and 2H5-22:6n-3, showed somewhat different accumulation in rat tissues (Table 2). The area under
the curves for the intermediate 2H5-20:3n-3 accumulated mainly in white adipose tissue (21.9),
followed by muscle (11.5) and skin (7.8). 2H5-20:5n-3 appeared mainly in muscle (33.1), but also
liver (22.3), white adipose tissue (16.1) and carcass (15.1). 2H5-22:5n-3 accumulated in muscle
(165), white adipose (92.4), carcass (78.8) and liver (55.8). Similarly, 2H5-22:6n-3 accumulated
mainly in muscle (680), liver (416), carcass (274) and white adipose (256).
For the n-6 metabolites 2H5-18:3n-6, 2H5-20:3n-6, 2H5-20:4n-6, 2H5-22:4n-6 and 2H5-22:5n-6, the
tissue accumulation exhibited localization to particular tissues (Table 2). The intermediate 2H5-
18:3n-6 accumulated mainly in liver but at a low level (4.4). 2H5-20:3n-6 appeared in muscle
(27.3), white adipose tissue (16.6) and carcass (13.3), followed by liver (8.5). 2H5-20:4n-6 (773)
was among the most highly accumulated metabolite in the body; mainly occurring in muscle
(210), liver (153), carcass (115), skin (108) and white adipose tissue (45.7). A tissue
by guest, on May 10, 2018
ww
w.jlr.org
Dow
nloaded from
16
accumulation similar to that of 2H5-20:4n-6 was observed for 2H5-22:4n-6. The n-6 end-product 2H5-22:5n-6 exhibited the unique attribute of a very high accumulation in testes (16.6) followed
by muscle (14.6), adipose (9.8) and liver (6.0).
by guest, on May 10, 2018
ww
w.jlr.org
Dow
nloaded from
17
DISCUSSION
Fate of n-3 and n-6 precursors
No previous study to our knowledge has attempted to follow the uptake and metabolism of the
essential fatty acids, 18:2n-6 and 18:3n-3, throughout all of the various tissues in a mammal.
This study systematically followed both the time course and the individual tissue accumulations
of a pulse of deuterated C18 EFA precursors along with their principal metabolites in rats
consuming a controlled and well defined diet. Due to the magnitude of this study design, it was
necessary to fix some variables such as the diet composition and the animal age, rather than to
study variations in these parameters. It must be conceded that somewhat different results may
well have been obtained had macronutrients or EFA content of the diet been altered or younger
or older animals studied. These are important variables for future study. The pulse of isotope
gives a rapid early enrichment that becomes progressively diluted with subsequent dietary EFA,
with the result that subsequent metabolism has less isotope per molecule metabolized.
In the past, many researchers have emphasized differences in metabolism for 18:2n-6 and
18:3n-3. One common observation has been the low level of 18:3n-3 in tissue complex lipids
here as there is often an abundance of 18:2n-6 in these pools (19). It is instructive then to
compare the disposition of each EFA precursor in terms of the tissue disposition, anabolic
metabolism and catabolism/excretion, and to compare the n-3 and n-6 families in these respects.
The net accumulation of the two labels in tissue pools was very similar; both approaching 20%
of the original dosage (compare figures 3B and 6B). Most of this disposition occurred within the
first 100 h after dosing with little subsequent change in the ensuing 500 h. This time course
coincides with the uptake of the C18 EFA precursors into adipose tissue, which is nearly
complete by 100 h after dosing. It is likely then that exposure to oxidative catabolism occurs
during the absorptive and circulatory phases but little catabolism occurs after deposition in
adipose. An attempt to estimate overall disposition of the two EFA precursors was made by
averaging the values for all tissues at time points between 24 and 600 h (with the period prior to
24 h excluded). The remainder of the deuterated precursors not accounted for was assumed to
have been excreted and/or catabolized although this was not directly measured. There was a
remarkable similarity for 2H5-18:2n-6 and 2H5-18:3n-3 in the percentage of dose deposited in the
by guest, on May 10, 2018
ww
w.jlr.org
Dow
nloaded from
18
various tissues (approximately 16-18%) and also the amount that was catabolized (about 79%)
(Figure 8). About twice as much of the 2H5-18:3n-3 (6%) was accumulated as its longer-chain,
more unsaturated analogues than was the 2H5-18:2n-6 (2.6%) over the course of this 600 h
experiment. This result might not be predicted from information emphasizing that the n-3 acid is
"rapidly lost" from the body. The high extent of presumed catabolism for both EFA (78.2% and
78.9%) confirms previous studies by Cunnane et al. who observed that 75-85% of C18 PUFAs
were β-oxidized (20) and served as substrates for carbon recycling and de novo lipid synthesis
(21-23). Bell et al. also observed very active catabolism of 2H5-18:3n-3 in rainbow trout (24).
Thus, from a whole body perspective, our study indicates very similar processing for the n-3 and
n-6 fatty acid precursors.
The greater accumulation of 2H5-18:3n-3 metabolites relative to those of 2H5-18:2n-6 should not
be construed, however, to indicate greater overall metabolism of the non-labeled pools. The
plasma and liver isotopic enrichment, for example, are much greater for the 2H5-18:3n-3 than for
the 2H5-18:2n-6 due to the much larger endogenous pools of the unlabeled 18:2n-6 relative to
that of 18:3n-3. At the 4 h time point, the enrichment of liver and plasma 2H5-18:3n-3 was more
than 14- and 8-fold that of the 2H5-18:2n-6, respectively. Thus, an equivalent rate of anabolic
metabolism in micromoles per unit of time at early "pulse" time points would lead to a much
greater number of deuterated metabolite molecules for the n-3 pathway. The multiple pools of
various metabolites in various tissues make it difficult to have precise calculations of rate. The
two-fold greater accumulation of 2H5-18:3n-3 metabolites relative to those of 2H5-18:2n-6 is in
fact less than the difference in enrichments, and it would likely be correct to say that there was
still more overall metabolism occurring in the n-6 pathway. The distribution of isotope label
given as a single dose in this “pulse-chase” type of study is a good indicator of the fate of a
dietary bolus of 18:2n-6 and 18:3n-3.
Tissue distribution of precursors
When accretion of the two precursors was compared in various tissues, the maximal amount of 2H5-18:2n-6 was somewhat higher than 2H5-18:3n-3 in most compartments with the exceptions
of skin and fur. This was in spite of a higher maximal enrichment of the 2H5-18:3n-3 in most
tissues including plasma and liver (data not shown). Both the 2H5-18:2n-6 and 2H5-18:3n-3
by guest, on May 10, 2018
ww
w.jlr.org
Dow
nloaded from
19
reached high concentrations in the stomach and plasma at the earliest time points consistent with
their digestive and circulatory functions. There was a somewhat extended time course for
18:2n-6 with respect to that of 18:3n-3 reflecting a somewhat slower disappearance, particularly
in the heart but that was also observed, to a lesser extent, in the testes, kidney and spleen. There
was then a rapid disappearance of labeled precursors by 100 h after dosing in most tissues with
most of the 2H5-18:3n-3 and 2H5-18:2n-6 appearing in white adipose tissue, likely reflecting
accretion in triacylglycerols, the predominant form of lipids in these cells (25,26). A fast
oxidation rate for 14C-18:3n-3 similar to that of lauric acid was observed by Leyton et al. (9).
Similarly, Cunnane et al. found that the fate of both dietary 18:2n-6 and 18:3n-3 is largely β-
oxidization (8). Of the remaining labeled fatty acid precursors, the rapid disappearance from
many tissues is due to the repeated, large influx of non-labeled fatty acids via the diet. In our
controlled diet, the daily intake of 18:2n-6 and 18:3n-3 is estimated to be 225 and 45 mg/d,
respectively. After 4 d, this unlabeled fatty acid will rapidly dilute pools of fatty acids that are
not sequestered by cells.
Our results indicate that adipose is the primary depository for the C18 EFAs, followed by muscle
and skin. This is in good agreement with the findings from dietary (8,27) and radiotracer
experiments (28,29). The white adipose tissue plays a storage role for the C18 EFA precursors
from which they may be mobilized by hormone-sensitive lipase. Thus, once an acid enters the
large pool of acids in adipose triacylglycerols, it is unlikely to exit quickly. This phenomenon
has been called "isotope trapping" when describing the slow exit of isotope from a relatively
large pool. Fu and Sinclair observed that skin played an important role in the accumulation of 2H5-18:3n-3 in the guinea pig (29). The present study of rats confirms that skin is an important
depot for 2H5-18:3n-3 (Dmax =3.8%); however, fur exhibited a low amount of 2H5- 18:3n-3
labeling (Dmax=0.2%) that was observable only at early times after dosing.
n-3 and n-6 metabolites
Only a limited amount of the labeled EFA precursors were elongated and desaturated during the
first 100 h as comparatively large amounts of the precursors were accumulated in various tissue
triacylglycerols. Limited release of precursor from these pools combines with limited amounts
of elongated/desaturated intermediates to keep overall amounts of isotopic precursors and
by guest, on May 10, 2018
ww
w.jlr.org
Dow
nloaded from
20
metabolites relatively constant from 100 to 600 h. In vitro studies have suggested that Δ-6
desaturase may be rate limiting (30,31). A comparison of the first two metabolic steps in rat
liver microsomal elongation/desaturation in vitro indicates that the Δ-6 desaturase had the lowest
reaction rate for both the n-6 and n-3 pathways (32,33). This is in agreement with the results of
studies reporting limited anabolic metabolism of 18:2n-6 and 18:3n-3 (1,34). Cunnane and
Anderson estimated that 1.4% of 18:3n-3 and 3% of 18:2n-6 were converted to LC-PUFA in rats
(8). However, Poumes-Ballihaut et al. found that about 17% of 18:3n-3 was converted to LC-
PUFA over a 5 wk period beginning at weaning (35) in pups with low n-3 fatty acid body stores.
In our study, most of the n-3 metabolite in the rat body was in the form of 2H5-22:6n-3 (Figure
4B). Similarly, we noted that in most tissues, 2H5-20:4n-6 was the predominant n-6 metabolite
(Figure 7B) with the exception of the testes where 2H5-22:5n-6 replaced 2H5-20:4n-6 as the
principal metabolite. For the n-3 pathway, the 2H5-20:5n-3 elongation product, 2H5-22:5n-3, was
found at a higher concentration than its precursor in the tissues examined, with the exception of
the testes. Upon inspection of figure 2, it is apparent that the 2H5-20:5n-3 disappeared faster than
the 2H5-22:6n-3 in several tissues including the red blood cell, liver, heart, brain, spinal cord,
testes and eye. In addition to its greater metabolism, the more rapid disappearance of 20:5n-3
may be due to the observation that 20:5n-3 is more readily β-oxidized than 20:4n-6 or 22:6n-3
(36).
Tissue distribution of metabolites
The rat liver exhibited the highest maximal concentrations (Cmax) of the 2H5-18:3n-3 metabolites 2H5-20:5n-3, 2H5-22:5n-3 and 2H5-22:6n-3 among the main organs between 8 and 96 h after
dosing. For the 2H5-18:2n-6 metabolites, the Cmax values were observed sequentially for 2H5-
18:3n-6, then 2H5-20:3n-6 and finally for 2H5-20:4n-6 in the liver over the period from 8 h to 168
h after dosing, following the expected pattern as prescribed by the known metabolic sequence.
This was consistent with the prevailing view that the liver represents the primary site of EFA
elongation/desaturation. The plasma distributions of the various labeled n-3 and n-6 metabolites
were similar to the liver time course or, in some cases, a bit delayed, as would be expected if the
liver metabolites were rapidly exported to the plasma. Similarly, the EFA metabolites time
course plots of some tissues (e.g., lung, spleen) were similar to that of the plasma, however,
others, most notably heart, exhibited a later maxima.
by guest, on May 10, 2018
ww
w.jlr.org
Dow
nloaded from
21
In brown adipose tissue, the 2H5-20:4n-6 and 2H5-22:6n-3 maximal concentrations were about
twice that in white adipose tissue, however, they both contained a similar concentration of the
C18 precursors. In general, the ratio of the principal metabolite to precursor was relatively high
for both the n-3 and n-6 fatty acids, approaching one or more in several tissues, but was much
lower in liver and plasma. One explanation for this is that in many organs the metabolites are
preferentially incorporated into phospholipids, reflecting acyltransferase selectivities (37,38) ,
rather than the precursors that eventually accumulated in adipose triacylglycerols.
Another group of tissues included the brain, spinal cord, eye, testes and red blood cell had the
characteristic that the C22 PUFAs peaked after a rather long period and then remained high.
Investigators made a similar observation in the baboon neonate and suggested that slow turnover
of RBC 22:6n-3 correlates with the brain and retinal 22:6n-3 but that plasma correlates better
with liver which secretes lipid to plasma (39). These tissues accumulate and retain these n-3 and
n-6 C22 PUFAs beyond 25 d primarily in phospholipids. This is consistent with the well known
retention of 22:6n-3 in the nervous system where it can support its vital functions (40). The
various nervous system tissues studied here did not all respond in the same manner with respect
to their content of the C18 precursors and their metabolites. The brain and spinal cord 2H5-
18:3n-3 content was essentially nil and only traces of 2H5-20:5n-3 were detected. The
observation of slightly greater levels of 2H5-22:5n-3 and much higher levels of 2H5-22:6n-3
indicates that (i) either shorter chain metabolites were very rapidly metabolized to their C22
products, or (ii) that the primary accretion mechanism for 2H5-22:6n-3 was uptake of preformed
molecules from the circulation, or (iii) 18:3n-3 and 20:5n-3 are somehow excluded from many
phospholipids and are then β-oxidized. The second conclusion is consistent with other studies
(26,41-43), although it has been proposed that 2H5-22:5n-3 may also be exported from the liver
and taken up into the brain (44).
However, an appreciable amount of 2H5-18:3n-3 was found in the eye relative to the 2H5-22:6n-3
content although the 2H5-20:5n-3 was again very low. Only the retina is nervous system tissue
and the results may have been different if only this subcomponent were analyzed. Similarly, the 2H5-18:2n-6 content in eyes was even higher than its C20 and C22 metabolites and this allows
by guest, on May 10, 2018
ww
w.jlr.org
Dow
nloaded from
22
for the possibility of local metabolism. The availability of the C18 precursors in the eye makes
possible local biosynthesis of 22:6n-3 or 20:4n-6 (45,46) which may then be supplied to the
retina. Similarly, the metabolism of 14C-18:3n-3 to 22:6n-3 has been observed after injection
into the brain (47,48) The n-6 precursor was also taken up into the brain and spinal cord to a
much greater extent than the n-3 precursor and it was of a similar order of magnitude as its
metabolites. Such preferential accretion of 18:2n-6 has been previously observed in the mouse
brain (19). However, though the nervous system accumulated and retained 2H5-22:6n-3 and 2H5-
20:4n-6 beyond 25 d, the maximal amount detected in brain only accounted for 0.1% and 0.02%
of the respective C18 precursor doses. This degree of labeling was similar to that previously
observed for sucking rats (19), the labeling of fetal rhesus brain after a dosing the mother with 13C-U-18:3n-3 (0.24%) (34) and when 14C-18:3n-3 (49) or 14C-18:2n-6 (50) were infused
intravenous in adult rats. However, a much greater uptake into mammalian brain were obtained
when the animals were dosed with preformed 22:6n-3 and 20:4n-6 in the range of 2~4.5% of the
dosages (26,34,51). In one experiment, intravenously injected 11C-20:4n-6 led to brain
radioactivity comprising 7% of the injected amount (52). Thus, it is apparent that preformed
22:6n-3 and 20:4n-6 are much better sources of brain 22:6n-3 and 20:4n-6 than their C18
precursors, and that precursor metabolism is a minor source of these brain PUFAs.
For the principal n-3 (2H5-22:6n-3) and n-6 (2H5-20:4n-6) metabolites, the organs where the
greatest amounts accumulated overall were the liver, muscle, skin and adipose. In muscle, in
particular, it was quite possible that local metabolism of the EFA precursors had occurred. In
this regard, it was also noteworthy that the concentrations of 2H5-22:4n-6 (2-fold) and 2H5-
22:5n-6 (6-fold) were greater in testes than those in liver. Although it is possible that the testes
concentrate these fatty acids against a concentration gradient, another possible interpretation of
these data is that there is local elongation/desaturation of the n-6 fatty acids in testes.
One potential application of this multi-compartmental analysis is with respect to the issue of
understanding to what extent analyses of blood in human studies may reflect stable isotope
metabolism of internal organs which cannot be sampled. A long standing issue has been, for
example, how well do plasma stable isotope metabolites reflect activity in the liver or brain from
both a qualitative and quantitative standpoint? As noted above, there is little correlation between
by guest, on May 10, 2018
ww
w.jlr.org
Dow
nloaded from
23
these compartments with respect to C18 content; however, C20 and C22 PUFAs in the brain
have a pattern that is more similar to that of the RBC than the plasma. The RBC 22:6n-3 level,
in particular, may be somewhat reflective of that of the nervous system, as has been previously
suggested in studies of the baboon (39). The plasma lipids secreted by liver provide a reasonable
reflection of rat liver metabolism although C22 PUFAs appear to have a somewhat greater
labeling in the liver. Thus, blood analyses do provide some insight into the metabolic processes
of other key organs in the rat and in non-human primates and it is reasonable then to expect a
similar situation in humans.
by guest, on May 10, 2018
ww
w.jlr.org
Dow
nloaded from
24
ACKNOWLEDGEMENTS
The authors wish to acknowledge Dr. William E. M. Lands for the valuable suggestions on the
manuscript and encouragement on this project. Thanks also to Dr. Lee Chedester and Mr.
Marshall Jones for their valuable advice and expert assistance with the animal work. This
project was funded by the Intramural Research Program of the National Institute on Alcohol
Abuse and Alcoholism, National Institutes of Health.
by guest, on May 10, 2018
ww
w.jlr.org
Dow
nloaded from
25
TABLE 1. Maximal amount (Dmax) of deuterated 18:3n-3, 22:6n-3, 18:2n-6 and 20:4n-6 in 25 rat tissues (expressed as a percentage of dose at Tmax)
2H5-18:3n-3 2H5-22:6n-3 2H5-18:2n-6 2H5-20:4n-6 No. Tissues Tissue Weight (g, at 240 h)
Dmax Tmax Dmax Tmax Dmax Tmax Dmax Tmax
1 Adipose, brown 0.5 0.26 24 0.02 168 0.25 24 0.004 1682 Adipose, white 28.9 14.5 168 0.80 360 15.7 168 0.16 1683 Adrenal glande 0.1 0.004 4 0.004 96 0.01 8 0.01 964 Bladder 0.1 0.003 8 0.002 240 0.004 8 0.004 2405 Bone 12.2 0.25 8 0.21 240 0.25 8 0.10 2406 Brain 1.9 Tr 0.10 600 0.01 8 0.02 2407 Carcass 48.3 0.84 8 0.99 240 1.04 8 0.44 2408 Eye 0.6 0.005 168 0.01 240 0.01 24 0.004 2409 Fur 2.3 0.20 4 0.004 96 0.12 4 0.004 96
10 Heart 1.0 0.04 8 0.08 168 0.09 8 0.03 24011 Intestinef 3.0 0.59 4 0.06 168 0.68 8 0.08 16812 Kidney 2.1 0.12 8 0.07 96 0.18 8 0.08 16813 Liver 11.1 4.48 8 1.69 96 4.35 8 0.78 9614 Lung 1.1 0.03 8 0.03 96 0.08 8 0.03 16815 Muscle 67.7 2.14 8 2.56 600 3.72 8 0.69 36016 Plasma 6.5 0.19 4 0.08 96 0.40 8 0.06 9617 Pancreas 0.4 0.01 8 0.02 240 0.04 8 0.03 24018 Red blood cell 5.3 0.01 8 0.01 96 0.06 8 0.02 24019 Skin 31.0 3.82 96 0.31 168 2.88 96 0.38 16820 Salivary gland 0.2 0.01 8 0.01 240 0.01 8 0.01 24021 Spinal cord 0.5 ND 0.03 600 0.003 8 0.003 60022 Spleen 0.9 0.01 4 0.01 96 0.03 8 0.02 9623 Stomach 1.2 0.19 4 0.01 168 0.20 8 0.03 16824 Thymus gland 0.5 0.004 8 0.003 96 0.02 24 0.01 16825 Testes 2.6 0.004 8 0.03 168 0.04 24 0.03 240
a Bold faced numbers indicate the highest 5 values of the 25 tissues examined. b Tmax: the time corresponding to the greatest tissue content. c Dmax: the maximal amount expressed as %dose at Tmax. d Tr indicates trace values, i.e., below 0.002. ND indicates non-detectable because of low
signal/noise ratio. e Adrenal gland: included thyroid gland and mandibular lymph nodes. f Intestine included duodenum, small intestines and cecum.
by guest, on May 10, 2018
ww
w.jlr.org
Dow
nloaded from
26
TABLE 2. Area under the time-course curves of the total amount of deuterated PUFA and metabolites in rat tissues (µmol·h) 2H5-18:3n-3 in vivo metabolites 2H5-18:2n-6 in vivo metabolites
No. Tissues 2H5-
18:3n-3 20:3n-3 20:4n-3 20:5n-3 22:5n-3 22:6n-3
2H5-18:2n-6 18:3n-6 20:3n-6 20:4n-6 22:4n-6 22:5n-6
1 Adipose, brown 63 0.5 0.9 0.8 2.5 6.3 78 ND 0.4 1.5 0.4 0.6 2 Adipose, white 5082 21.9 ND 16.1 92.4 256 5436 ND 16.6 45.7 22.7 9.8 3 Adrenal gland 0.4 0.02 0.02 0.09 0.5 0.66 0.6 0.02 0.1 1.6 0.4 0.03 4 Bladder 0.4 0.01 0.01 0.11 0.3 0.41 0.5 0.01 0.1 0.8 0.1 0.01 5 Bone 23 0.7 0.2 3.2 17.6 55.6 34 0.1 2.7 27.3 5.5 1.2 6 Brain Tr ND ND 0.08 0.8 30.5 1.0 ND 0.6 5.9 2.2 0.2 7 Carcass 116 2.7 2.0 15.1 78.8 274 133 0.7 13.3 115 19.0 6.0 8 Eye 0.9 0.04 0.01 0.04 0.4 2.4 1.4 ND 0.01 1.0 0.2 0.04 9 Fur 2.0 0.03 ND 0.12 0.4 0.90 5.0 0.03 0.1 0.9 0.2 ND
10 Heart 1.3 0.04 0.02 0.4 3.3 18.7 9.1 0.03 0.4 8.6 0.5 0.5 11 Intestine 14 0.4 0.4 2.2 6.5 16.3 24 0.1 2.6 22.7 4.8 0.3 12 Kidney 2.0 0.17 0.26 1.94 2.5 13.9 8.8 0.03 1.2 21.2 0.8 0.2 13 Liver 82 2.0 Tr 22.3 55.8 416 116 4.4 8.5 153 5.9 6.0 14 Lung 2.3 0.13 ND 1.09 3.6 5.8 7.1 0.08 0.5 8.1 1.6 0.1 15 Muscle 602 11.5 ND 33.1 165 680 841 ND 29.3 210 20.5 14.6 16 Plasma 2.7 0.03 Tr 1.2 1.6 10.6 9.3 0.12 0.3 10.1 0.2 0.2 17 Pancreas 0.1 0.02 0.02 2.7 1.1 3.3 4.3 0.12 0.4 5.2 0.2 0.1 18 Red blood cell 0.9 0.03 0.03 0.4 1.2 2.8 2.6 0.03 0.2 4.0 0.3 0.1 19 Skin 845 7.8 ND 13.3 33.8 87.2 701 ND 7.0 108 12.0 1.5 20 Salivary gland 0.3 0.03 0.07 0.5 0.5 1.2 1.8 0.03 0.6 1.7 0.1 0.04 21 Spinal cord ND ND ND 0.05 0.6 7.9 0.3 ND 0.3 1.0 0.6 0.03 22 Spleen 0.3 0.06 0.02 0.3 1.6 2.4 1.2 0.01 0.2 3.5 0.7 0.1 23 Stomach 10 0.08 0.10 0.7 1.0 2.6 11 0.03 0.4 5.5 0.6 0.1 24 Thymus gland 0.5 0.1 0.02 0.1 0.4 0.6 1.7 ND 0.2 2.8 0.4 0.03 25 Testes 0.3 0.01 0.01 0.4 0.4 9.3 3.5 0.09 1.4 8.3 3.8 16.6
Total 6851 48 4 116 473 1906 7431 6 87 773 104 58 Greatest 5082 22 2 33 165 680 5436 4 29 210 23 17
Trapezoid rule was applied to calculate the AUC, from 0 to 600 h; Tr indicates trace values, i.e., below 0.005 µmol·h. ND indicates non-detectable because of low signal/noise ratio; Bold faced numbers indicate the greatest values of the 25 components examined.
by guest, on May 10, 2018 www.jlr.org Downloaded from
27
Figure Legends Figure 1. Rats were dissected into 25 components (see Table 1) and then organized into 11
categories as depicted on the lower panel. The percentage of the total collected tissue is given
for each of these 11 organ systems at each time point between 0 and 600 h on the top panel. The
mean values (± SD) are given for n=9 rats of from 7 to 11 wk old in the middle panel. The body
weight of each rat at the time of sacrifice is also given at the bottom of the figure.
Figure 2. Time course plots of the concentrations (nmol/g wet tissue or nmol/mL for plasma
and RBC) of 2H5-18:3n-3 and its main in vivo metabolites 2H5-20:5n-3, 2H5-22:5n-3, 2H5-22:6n-3
in rat plasma, red blood cell, liver, heart, lung and brain (A); and stomach, spleen, kidney, testes,
eyeball and spinal cord (B) as a function of time over 600 h after a single oral dosing. Values
were derived from one animal at each time point.
Figure 3. Distribution of 2H5-18:3n-3 deposited in various rat organ systems vs. time. The data
were expressed as a percentage of the total recovered 2H5-18:3n-3 at each time point. The total
amount and the percent of the initial dose for 2H5-18:3n-3 is presented in the figure below.
Values were derived from one animal at each time point. The abbreviations for each organ
system are as in Figure 1.
Figure 4. Distribution of n-3 metabolites, including 2H5-20:3n-3, 2H5-20:4n-3, 2H5-20:5n-3, 2H5-
22:5n-3 and 2H5-22:6n-3, synthesized from 2H5-18:3n-3 in rat organ systems vs. time. The data
were expressed as the percentage of the total recovered n-3 deuterated metabolites at each time
point. The total amount of n-3 metabolites and 2H5-22:6n-3 derived from 2H5-18:3n-3 and the
percentage of the initial 2H5-18:3n-3 dose are presented in the figure below. Values were derived
from one animal at each time point. The abbreviations for each organ system are as in Figure 1.
by guest, on May 10, 2018
ww
w.jlr.org
Dow
nloaded from
28
Figure 5. Time course plots of the concentrations (nmol/g wet tissue or nmol/mL for plasma
and RBC) of 2H5-18:2n-6, and its principal in vivo metabolites 2H5-18:3n-6, 2H5-20:3n-6, 2H5-
20:4n-6, 2H5-22:4n-6 and 2H5-22:5n-6 in rat plasma, red blood cell, liver, heart, lung and brain
(A); and stomach, spleen, kidney, testes, eye and spinal cord (B) as a function of time over 25 d
after a single oral dosing. Values were derived from one animal at each time point.
Figure 6. Distribution of 2H5-18:2n-6 deposited in various rat organ systems vs. time. The data
were expressed as a percentage of the total recovered 2H5-18:2n-6 at each time point. The total
amount and the percent of the initial dose for 2H5-18:2n-6 is presented in the figure below.
Values were derived from one animal at each time point. The abbreviations for each organ
system are as in Figure 1.
Figure 7. Distribution of n-6 metabolites, including 2H5-18:3n-6, 2H5-20:3n-6, 2H5-20:4n-6, 2H5-
22:4n-6, 2H5-22:5n-6, synthesized from 2H5-18:2n-6 in rat organ systems vs. time. The data were
expressed as the percentage of the total recovered n-6 deuterated metabolites at each time point.
The total amount of n-6 metabolites and 2H5-20:4n-6 derived from 2H5-18:2n-6 and the
percentage of the initial 2H5-18:2n-6 dose are presented in the figure below. Values were derived
from one animal at each time point. The abbreviations for each organ system are as in Figure 1.
Figure 8. Diagram of the proportions of the 2H5-18:3n-3 (left panel) and 2H5-18:2n-6 (right
panel) dosages recovered from the rat whole body attributed to tissue deposition,
elongation/desaturation, or to β-oxidization, carbon recycling, excretion and other avenues of
loss from the body. Averaged from 1 to 25 d after the administration of precursors (mean ± SD,
n=6).
by guest, on May 10, 2018
ww
w.jlr.org
Dow
nloaded from
29
REFERENCES
1. Pawlosky, R. J., J. R. Hibbeln, J. A. Novotny, and N. Salem, Jr. 2001. Physiological
compartmental analysis of alpha-linolenic acid metabolism in adult humans. J Lipid Res.
42: 1257-1265.
2. Pawlosky, R. J., J. R. Hibbeln, Y. H. Lin, S. Goodson, P. Riggs, N. Sebring, G. L. Brown,
and N. Salem, Jr. 2003. Effects of beef- and fish-based diets on the kinetics of n-3 fatty
acid metabolism in human subjects. Am J Clin Nutr. 77: 565-572.
3. Goyens, P. L., M. E. Spilker, P. L. Zock, M. B. Katan, and R. P. Mensink. 2005.
Compartmental modeling to quantify alpha-linolenic acid conversion after longer term
intake of multiple tracer boluses. J. Lipid Res. 46: 1474-1483.
4. Sheaff, R. C., H. M. Su, L. A. Keswick, and J. T. Brenna. 1995. Conversion of alpha-
linolenate to docosahexaenoate is not depressed by high dietary levels of linoleate in young
rats: tracer evidence using high precision mass spectrometry. J. Lipid Res. 36: 998-1008.
5. Su, H. M., T. N. Corso, P. W. Nathanielsz, and J. T. Brenna. 1999. Linoleic acid kinetics
and conversion to arachidonic acid in the pregnant and fetal baboon. J Lipid Res. 40: 1304-
1312.
6. Fu, Z., N. M. ttar-Bashi, and A. J. Sinclair. 2001. 1-14C-linoleic acid distribution in various
tissue lipids of guinea pigs following an oral dose. Lipids. 36: 255-260.
by guest, on May 10, 2018
ww
w.jlr.org
Dow
nloaded from
30
7. Fu, Z. and A. J. Sinclair. 2000. Increased alpha-linolenic acid intake increases tissue alpha-
linolenic acid content and apparent oxidation with little effect on tissue docosahexaenoic
acid in the guinea pig. Lipids. 35: 395-400.
8. Cunnane, S. C. and M. J. Anderson. 1997. The majority of dietary linoleate in growing rats
is beta-oxidized or stored in visceral fat. J Nutr. 127: 146-152.
9. Leyton, J., P. J. Drury, and M. A. Crawford. 1987. Differential oxidation of saturated and
unsaturated fatty acids in vivo in the rat. Br. J Nutr. 57: 383-393.
10. Reeves, P. G., F. H. Nielsen, and G. C. Fahey, Jr. 1993. AIN-93 purified diets for
laboratory rodents: final report of the American Institute of Nutrition ad hoc writing
committee on the reformulation of the AIN-76A rodent diet. J Nutr. 123: 1939-1951.
11. Moriguchi, T., S. Y. Lim, R. Greiner, W. Lefkowitz, J. Loewke, J. Hoshiba, and N. Salem,
Jr. 2004. Effects of an n-3-deficient diet on brain, retina, and liver fatty acyl composition in
artificially reared rats. J Lipid Res. 45: 1437-1445.
12. Watkins, B. A., C. L. Shen, J. P. McMurtry, H. Xu, S. D. Bain, K. G. Allen, and M. F.
Seifert. 1997. Dietary lipids modulate bone prostaglandin E2 production, insulin-like
growth factor-I concentration and formation rate in chicks. J. Nutr. 127: 1084-1091.
13. Folch, A. C., M. Lees, and G. M. Sloane-Stanley. 1957. A simple method for isolation and
purification of total lipids from animal tissues. J Biol Chem. 226: 497-509.
14. Morrison, W. R. and L. M. Smith. 1964. Preparation of fatty acid methyl esters and
dimethyl acetals from lipids with boron tri-fluoride-methanol. J Lipid Res. 5: 600-608.
by guest, on May 10, 2018
ww
w.jlr.org
Dow
nloaded from
31
15. Salem, N., Jr., M. Reyzer, and J. Karanian. 1996. Losses of arachidonic acid in rat liver
after alcohol inhalation. Lipids. 31 Suppl: S153-S156.
16. Pawlosky, R. J., H. W. Sprecher, and N. Salem, Jr. 1992. High sensitivity negative ion GC-
MS method for detection of desaturated and chain-elongated products of deuterated linoleic
and linolenic acids. J Lipid Res. 33: 1711-1717.
17. Lin, Y. H. and N. Salem, Jr. 2005. In vivo conversion of 18- and 20-C essential fatty acids
in rats using the multiple simultaneous stable isotope method. J. Lipid Res. 46: 1962-1973.
18. Yeh, K. C. and K. C. Kwan. 1978. A comparison of numerical integrating algorithms by
trapezoidal, Lagrange, and spline approximation. J Pharmacokinet Biopharm. 6: 79-98.
19. Pawlosky, R. J., G. Ward, and N. Salem, Jr. 1996. Essential fatty acid uptake and
metabolism in the developing rodent brain. Lipids. 31 Suppl: S103-S107.
20. Cunnane, S. C. 1996. The Canadian Society for Nutritional Sciences 1995 Young Scientist
Award Lecture. Recent studies on the synthesis, beta-oxidation, and deficiency of linoleate
and alpha-linolenate: are essential fatty acids more aptly named indispensable or
conditionally dispensable fatty acids? Can. J. Physiol Pharmacol. 74: 629-639.
21. Menard, C. R., K. J. Goodman, T. N. Corso, J. T. Brenna, and S. C. Cunnane. 1998.
Recycling of carbon into lipids synthesized de novo is a quantitatively important pathway
of alpha-[U-13C]linolenate utilization in the developing rat brain. J Neurochem. 71: 2151-
2158.
by guest, on May 10, 2018
ww
w.jlr.org
Dow
nloaded from
32
22. Cunnane, S. C., M. A. Ryan, C. R. Nadeau, R. P. Bazinet, K. Musa-Veloso, and U.
McCloy. 2003. Why is carbon from some polyunsaturates extensively recycled into lipid
synthesis? Lipids. 38: 477-484.
23. Cunnane, S. C., M. A. Ryan, Y. H. Lin, S. Y. Lim, and N. Salem, Jr. 2006. Suckling Rats
Actively Recycle Carbon from {alpha}-Linolenate into Newly Synthesized Lipids Even
During Extreme Dietary Deficiency of n-3 Polyunsaturates. Pediatr Res. 59: 107-110.
24. Bell, M. V., J. R. Dick, and A. E. Porter. 2003. Pyloric ceca are significant sites of newly
synthesized 22:6n-3 in rainbow trout (Oncorhynchus mykiss). Lipids. 38: 39-44.
25. Bates, M. W. 1958. Turnover rates of fatty acids of plasma triglyceride, cholesterol ester
and phospholipid in the postabsorptive dog. Am. J. Physiol. 194: 446-452.
26. Sinclair, A. J. 1975. Incorporation of radioactive polyunsaturated fatty acids into liver and
brain of developing rat. Lipids. 10: 175-184.
27. Bourre, J. M., M. Piciotti, O. Dumont, G. Pascal, and G. Durand. 1990. Dietary linoleic
acid and polyunsaturated fatty acids in rat brain and other organs. Minimal requirements of
linoleic acid. Lipids. 25: 465-472.
28. Leyton, J., P. J. Drury, and M. A. Crawford. 1987. In vivo incorporation of labeled fatty
acids in rat liver lipids after oral administration. Lipids. 22: 553-558.
29. Fu, Z. and A. J. Sinclair. 2000. Novel pathway of metabolism of alpha-linolenic acid in the
guinea pig. Pediatr. Res. 47: 414-417.
by guest, on May 10, 2018
ww
w.jlr.org
Dow
nloaded from
33
30. Mead, J. F. 1958. The metabolism of the essential fatty acids. Am. J. Clin. Nutr.
6: 656-661.
31. Hassam, A. G., A. J. Sinclair, and M. A. Crawford. 1975. The incorporation of orally fed
radioactive gamma-linolenic acid and linoleic acid into the liver and brain lipids of
suckling rats. Lipids. 10: 417-420.
32. Marcel, Y. L., K. Christiansen, and R. T. Holman. 1968. The preferred metabolic pathway
from linoleic acid to arachidonic acid in vitro. Biochim. Biophys. Acta. 164: 25-34.
33. Sprecher, H. 1986. Comparison of omega-3 and omega-6 fatty acid metabolism. In Health
effects of polyunsaturated fatty acids in seafoods. A. P. Simopoulos, R. R. Kifer, and R. E.
Martin, editors. Academic Press, New York, NY. 353-379.
34. Sheaff Greiner, R. C., Q. Zhang, K. J. Goodman, D. A. Giussani, P. W. Nathanielsz, and J.
T. Brenna. 1996. Linoleate, alpha-linolenate, and docosahexaenoate recycling into
saturated and monounsaturated fatty acids is a major pathway in pregnant or lactating
adults and fetal or infant rhesus monkeys. J Lipid Res. 37: 2675-2686.
35. Poumes-Ballihaut, C., B. Langelier, F. Houlier, J. M. Alessandri, G. Durand, C. Latge, and
P. Guesnet. 2001. Comparative bioavailability of dietary alpha-linolenic and
docosahexaenoic acids in the growing rat. Lipids. 36: 793-800.
36. Gavino, G. R. and V. C. Gavino. 1991. Rat liver outer mitochondrial carnitine
palmitoyltransferase activity towards long-chain polyunsaturated fatty acids and their CoA
esters. Lipids. 26: 266-270.
by guest, on May 10, 2018
ww
w.jlr.org
Dow
nloaded from
34
37. Holub, B. J. 1984. 1982 Borden Award lecture. Nutritional, biochemical, and clinical
aspects of inositol and phosphatidylinositol metabolism. Can. J. Physiol Pharmacol.
62: 1-8.
38. Lands, W. E., M. Inoue, Y. Sugiura, and H. Okuyama. 1982. Selective incorporation of
polyunsaturated fatty acids into phosphatidylcholine by rat liver microsomes. J Biol Chem.
257: 14968-14972.
39. Sarkadi-Nagy, E., V. Wijendran, G. Y. Diau, A. C. Chao, A. T. Hsieh, A. Turpeinen, P.
Lawrence, P. W. Nathanielsz, and J. T. Brenna. 2004. Formula feeding potentiates
docosahexaenoic and arachidonic acid biosynthesis in term and preterm baboon neonates.
J Lipid Res. 45: 71-80.
40. Salem, N., Jr. 1989. Omega-3 fatty acids: molecular and biochemical aspects. In Current
Topics in Nutrition and Disease: New Protective Roles for Selected Nutrients. Spiller GA
and Scala J, editors. Alan R Liss, New York. 109-228.
41. Abedin, L., E. L. Lien, A. J. Vingrys, and A. J. Sinclair. 1999. The effects of dietary alpha-
linolenic acid compared with docosahexaenoic acid on brain, retina, liver, and heart in the
guinea pig. Lipids. 34: 475-482.
42. Bowen, R. A. and M. T. Clandinin. 2000. High dietary 18:3n-3 increases the 18:3n-3 but
not the 22:6n-3 content in the whole body, brain, skin, epididymal fat pads, and muscles of
suckling rat pups. Lipids. 35: 389-394.
by guest, on May 10, 2018
ww
w.jlr.org
Dow
nloaded from
35
43. Lefkowitz, W., S. Y. Lim, Y. H. Lin, and N. Salem. 2005. Where does the developing brain
obtain its docosahexaenoic acid? Relative contributions of dietary alpha-linolenic acid,
docosahexaenoic acid, and body stores in the developing rat. Pediatr Res. 57: 157-165.
44. Pawlosky, R., A. Barnes, and N. Salem, Jr. 1994. Essential fatty acid metabolism in the
feline: relationship between liver and brain production of long-chain polyunsaturated fatty
acids. J Lipid Res. 35: 2032-2040.
45. Bell, M. V., J. R. Dick, and A. E. Porter. 2003. Tissue deposition of n-3 FA pathway
intermediates in the synthesis of DHA in rainbow trout (Oncorhynchus mykiss). Lipids.
38: 925-931.
46. Bazan, H. E., M. M. Careaga, H. Sprecher, and N. G. Bazan. 1982. Chain elongation and
desaturation of eicosapentaenoate to docosahexaenoate and phospholipid labeling in the rat
retina in vivo. Biochim. Biophys. Acta. 712: 123-128.
47. Dhopeshwarkar, G. A. and C. Subramanian. 1976. Biosynthesis of polyunsaturated fatty
acids in the developing brain: I. Metabolic transformations of intracranially administered 1-
14C linolenic acid. Lipids. 11: 67-71.
48. Dwyer, B. E. and J. Bernsohn. 1979. The effect of essential fatty acid deprivation on the
metabolic transformations of [1(-14)C]linolenate in developing rat brain. Biochim. Biophys.
Acta. 575: 309-317.
49. DeMar, J. C., Jr., K. Ma, L. Chang, J. M. Bell, and S. I. Rapoport. 2005. alpha-Linolenic
acid does not contribute appreciably to docosahexaenoic acid within brain phospholipids of
adult rats fed a diet enriched in docosahexaenoic acid. J. Neurochem. 94: 1063-1076.
by guest, on May 10, 2018
ww
w.jlr.org
Dow
nloaded from
36
50. DeMar, J. C., Jr., H. J. Lee, K. Ma, L. Chang, J. M. Bell, S. I. Rapoport, and R. P. Bazinet.
2006. Brain elongation of linoleic acid is a negligible source of the arachidonate in brain
phospholipids of adult rats. Biochim. Biophys. Acta. 1761: 1050-1059.
51. Wijendran, V., M. C. Huang, G. Y. Diau, G. Boehm, P. W. Nathanielsz, and J. T. Brenna.
2002. Efficacy of dietary arachidonic acid provided as triglyceride or phospholipid as
substrates for brain arachidonic acid accretion in baboon neonates. Pediatr. Res.
51: 265-272.
52. Chang, M. C., T. Arai, L. M. Freed, S. Wakabayashi, M. A. Channing, B. B. Dunn, M. G.
Der, J. M. Bell, T. Sasaki, P. Herscovitch, W. C. Eckelman, and S. I. Rapoport. 1997. Brain
incorporation of [1-11C]arachidonate in normocapnic and hypercapnic monkeys, measured
with positron emission tomography. Brain Res. 755: 74-83.
by guest, on May 10, 2018
ww
w.jlr.org
Dow
nloaded from
0
20
40
60
80
100
0 4 8 24 96 168 240 360 600
AdiBoneCarcsCircGILivMslNervRspSkinUrog
Time after dosing (h)
Perc
enta
ge o
f tot
al c
olle
cted
tissu
e
Figure 1
Dissection Category Abbr. Tissues Harvested Percent of Harvested TissueAdipose tissue Adi Brown, white adipose 13.2 ± 3.2Skeleton Bone Skeletal bones, spine 4.7 ± 0.8Carcass Carcs Any tissue not listed in other categories 20.4 ± 1.5Circulatory system Circ Heart, plasma, RBC, spleen 5.9 ± 0.5Digestive system GI Gastrointestinal tract: including pancreas, stomach,
duodenum, small intestines, cecum 2.0 ± 0.3Liv Liver 4.6 ± 0.4
Muscle Msl Skeletal muscle 29.2 ± 2.2Nervous system Nerv Brain, spinal cord 1.2 ± 0.3Respiratory system Rsp Lung 0.6 ± 0.1Skin Skin Skin, fur 16.1 ± 1.2Urogenital system Urog Kidney, urinary bladder, testis 2.1 ± 0.2Time point (h)Body weight (g)
0 4 8 24 96 168 240 360 600194 198 182 183 223 249 280 321 383
by guest, on May 10, 2018
ww
w.jlr.org
Dow
nloaded from
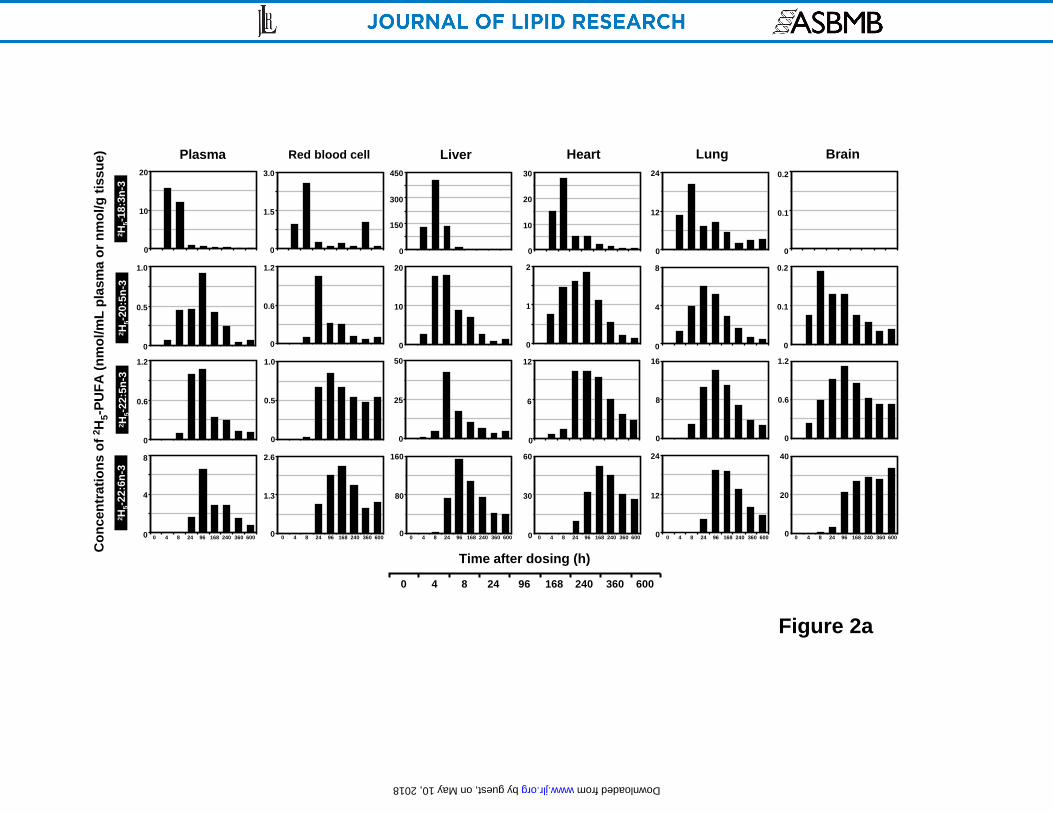
Figure 2a
0
4
8
0
0.6
1.2
0
0.5
1.0
0
10
20
0
1.3
2.6
0
1.5
3.0
0
0.6
1.2
0
0.5
1.0
0
10
20
30
0
1
2
0
6
12
0
30
60
0
12
24
0
8
16
0
4
8
0
12
24
0
0.1
0.2
0
0.1
0.2
0
0.6
1.2
0
20
40
0
10
20
0
25
50
0
80
160
0
150
300
450
Plasma Red blood cell Liver Heart Lung Brain
2 H5-1
8:3n
-32 H
5-20:
5n-3
2 H5-2
2:5n
-32 H
5-22:
6n-3
Con
cent
ratio
ns o
f 2H
5-PU
FA (n
mol
/mL
plas
ma
or n
mol
/gtis
sue)
Time after dosing (h)
0 4 8 24 96 168 240 360 600
0 4 8 24 96 168 240 360 6000 4 8 24 96 168 240 360 600 0 4 8 24 96 168 240 360 600 0 4 8 24 96 168 240 360 6000 4 8 24 96 168 240 360 600 0 4 8 24 96 168 240 360 600
by guest, on May 10, 2018 www.jlr.org Downloaded from
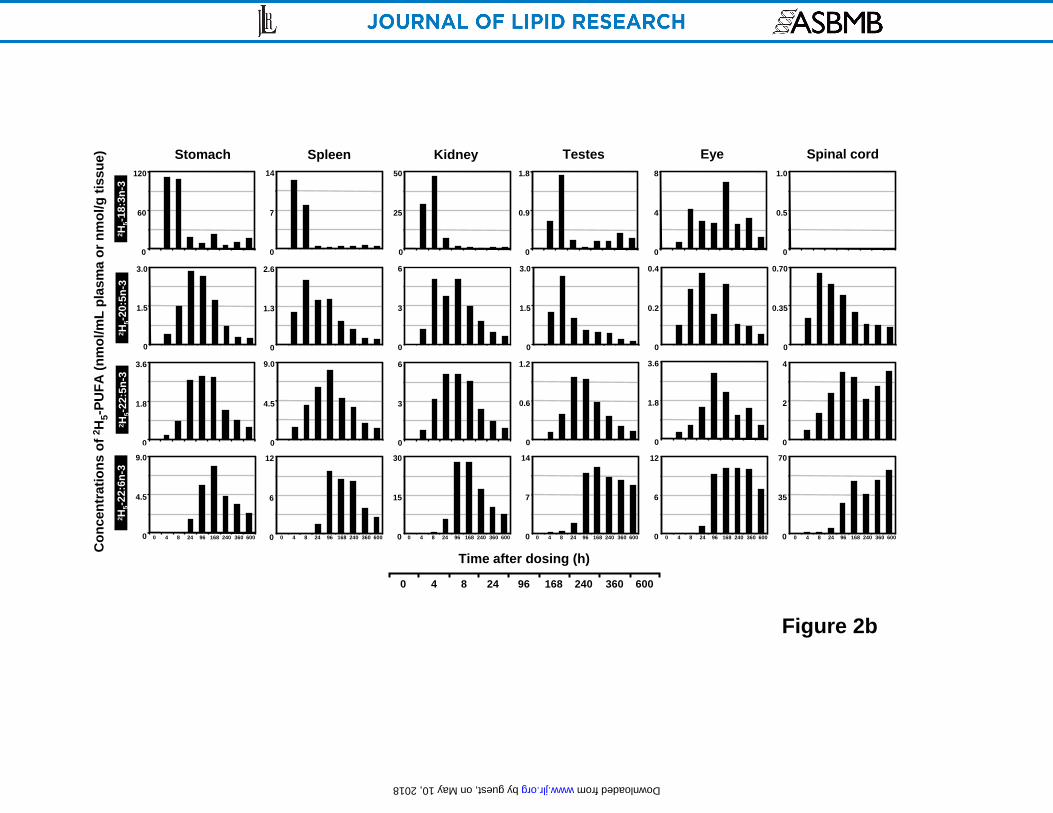
Figure 2b
0
60
120
0
1.5
3.0
0
1.8
3.6
0
4.5
9.0
0
6
12
0
4.5
9.0
0
1.3
2.6
0
7
14
0
25
50
0
3
6
0
3
6
0
15
30
0
7
14
0
0.6
1.2
0
6
12
0
1.8
3.6
0
35
70
0
2
4
0
0.35
0.70
0
0.5
1.0
0
4
8
0
0.9
1.8
0
1.5
3.0
0
0.2
0.4
Stomach Spleen Kidney Testes Eye Spinal cord
2 H5-1
8:3n
-32 H
5-20:
5n-3
2 H5-2
2:5n
-32 H
5-22:
6n-3
Con
cent
ratio
ns o
f 2H
5-PU
FA (n
mol
/mL
plas
ma
or n
mol
/gtis
sue)
0 4 8 24 96 168 240 360 6000 4 8 24 96 168 240 360 600 0 4 8 24 96 168 240 360 600 0 4 8 24 96 168 240 360 6000 4 8 24 96 168 240 360 600 0 4 8 24 96 168 240 360 600
Time after dosing (h)
0 4 8 24 96 168 240 360 600
by guest, on May 10, 2018 www.jlr.org Downloaded from

Figure 3
0
20
40
60
80
100
4 8 24 96 168 240 360 600
AdiBoneCarcsCircGILivMslNervRspSkinUrog
(A)
Dis
trib
utio
n of
tota
l 2 H5-
18:3
n-3
in ra
t bod
y (%
)
Time after dosing (h)
Perc
enta
ge o
f dos
ed 2 H
5-18
:3n-
3 (%
)
Tota
l am
ount
in w
hole
bod
y (µ
mol
)
Time after dosing (h)
0
5
10
15
20
25
0 100 200 300 400 500 6000
4
8
12
16
2H5-18:3n-3
(B)
by guest, on May 10, 2018
ww
w.jlr.org
Dow
nloaded from
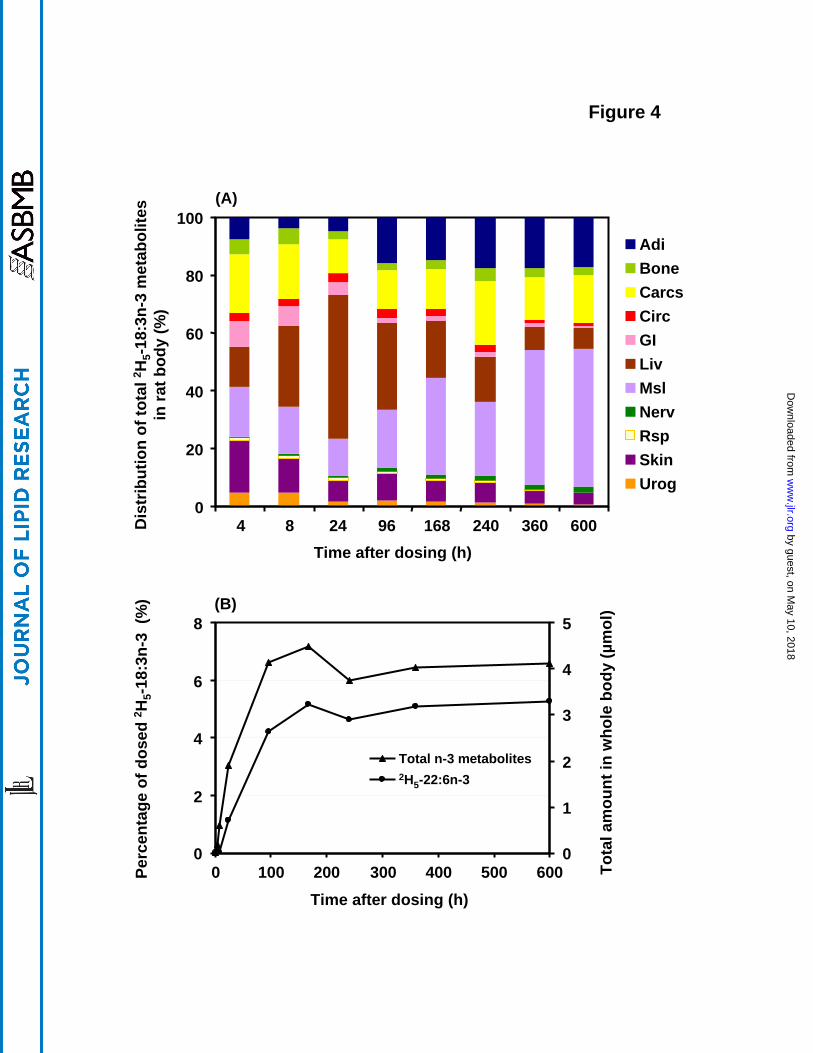
Figure 4D
istr
ibut
ion
of to
tal 2 H
5-18
:3n-
3 m
etab
olite
s in
rat b
ody
(%)
0
20
40
60
80
100
4 8 24 96 168 240 360 600
AdiBoneCarcsCircGILivMslNervRspSkinUrog
(A)
Time after dosing (h)
0
2
4
6
8
0 100 200 300 400 500 6000
1
2
3
4
5
2H5-22:6n-3Total n-3 metabolites
(B)
Perc
enta
ge o
f dos
ed 2 H
5-18
:3n-
3 (%
)
Tota
l am
ount
in w
hole
bod
y (µ
mol
)
Time after dosing (h)
by guest, on May 10, 2018
ww
w.jlr.org
Dow
nloaded from
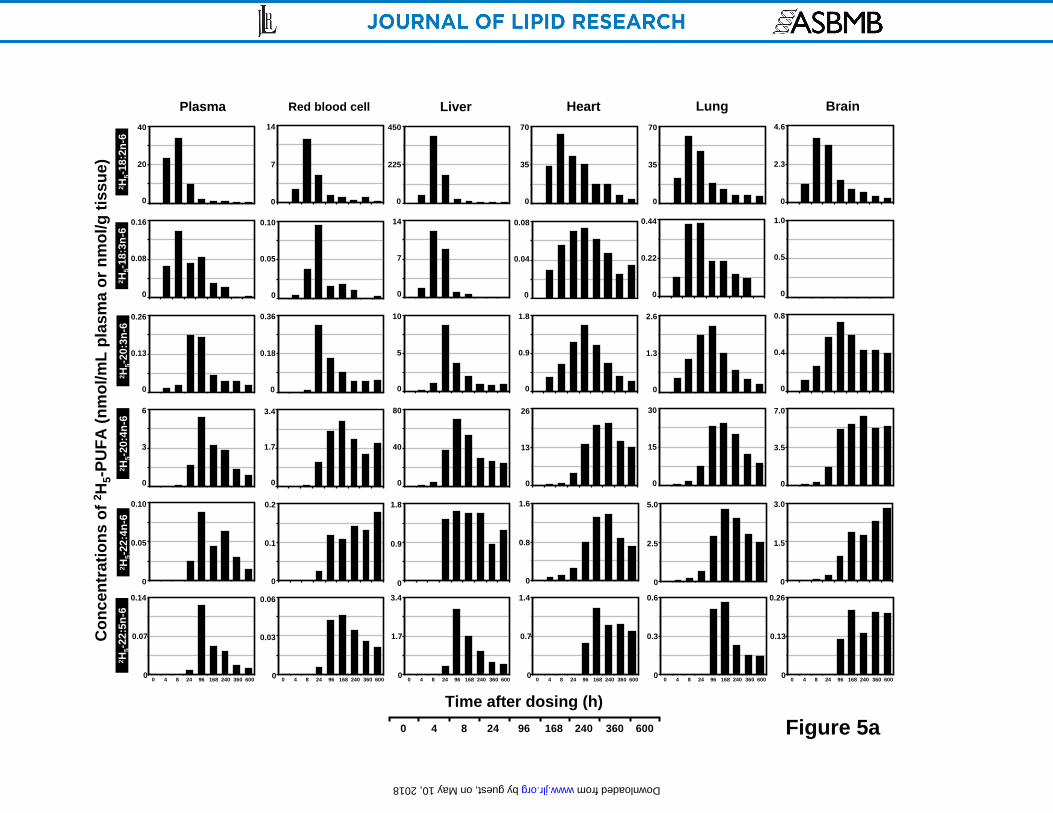
Figure 5a
0
20
40
0
0.08
0.16
0
0.13
0.26
0
3
6
0
0.05
0.10
0
2.3
4.6
0
0.5
1.0
0
0.4
0.8
0
3.5
7.0
0
1.5
3.0
0.26
0
2.5
5.0
0
15
30
0
1.3
2.6
0
0.22
0.44
0
35
70
0.6
0
35
70
0
0.04
0.08
0
0.9
1.8
0
13
26
0
0.8
1.6
1.4
0
225
450
0
7
14
0
5
10
0
40
80
0
0.9
1.8
3.4
0
0.1
0.2
0
1.7
3.4
0
0.18
0.36
0
0.05
0.10
0
7
14
0.06
000000
0.130.30.71.70.030.07
0.14
Con
cent
ratio
ns o
f 2 H5-
PUFA
(nm
ol/m
L pl
asm
a or
nm
ol/g
tissu
e)2 H
5-18:
3n-6
2 H5-2
0:4n
-62 H
5-22:
4n-6
2 H5-2
2:5n
-62 H
5-18:
2n-6
2 H5-2
0:3n
-6Plasma Red blood cell Liver Heart Lung Brain
Time after dosing (h)0 4 8 24 96 168 240 360 600
0 4 8 24 96 168 240 360 6000 4 8 24 96 168 240 360 600 0 4 8 24 96 168 240 360 600 0 4 8 24 96 168 240 360 6000 4 8 24 96 168 240 360 600 0 4 8 24 96 168 240 360 600
by guest, on May 10, 2018 www.jlr.org Downloaded from

Figure 5b
0
40
80
0
70
140
0
0.18
0.36
0
0.7
1.4
0
15
30
0
8
16
0
0.7
1.4
0
0.2
0.4
0
0.2
0.4
0
1.5
3.0
0
8
16
0
0.8
1.6
0
0.15
0.30
0
0.35
0.70
0
1.5
3.0
0
18
36
0
0.7
1.4
0
0.2
0.4
0
12
24
0
2.5
5.0
0
1.8
3.6
0
0.25
0.50
0
9
18
0
10
20
0
10
20
0
0.2
0.4
0
3
6
0
0.45
0.90
0
0.2
0.4
ND 0
0.15
0.30
0
3
6
0
3.5
7.0
0
1.2
2.4
0
3
6
0
3
6
0
7
14
Con
cent
ratio
ns o
f 2 H5-
PUFA
(nm
ol/g
tissu
e)2 H
5-18:
3n-6
2 H5-2
0:4n
-62 H
5-22:
4n-6
2 H5-2
2:5n
-62 H
5-18:
2n-6
2 H5-2
0:3n
-6Stomach Spleen Kidney Testes Eye Spinal cord
Time after dosing (h)0 4 8 24 96 168 240 360 600
0 4 8 24 96 168 240 360 6000 4 8 24 96 168 240 360 600 0 4 8 24 96 168 240 360 600 0 4 8 24 96 168 240 360 6000 4 8 24 96 168 240 360 600 0 4 8 24 96 168 240 360 600
by guest, on May 10, 2018 www.jlr.org Downloaded from
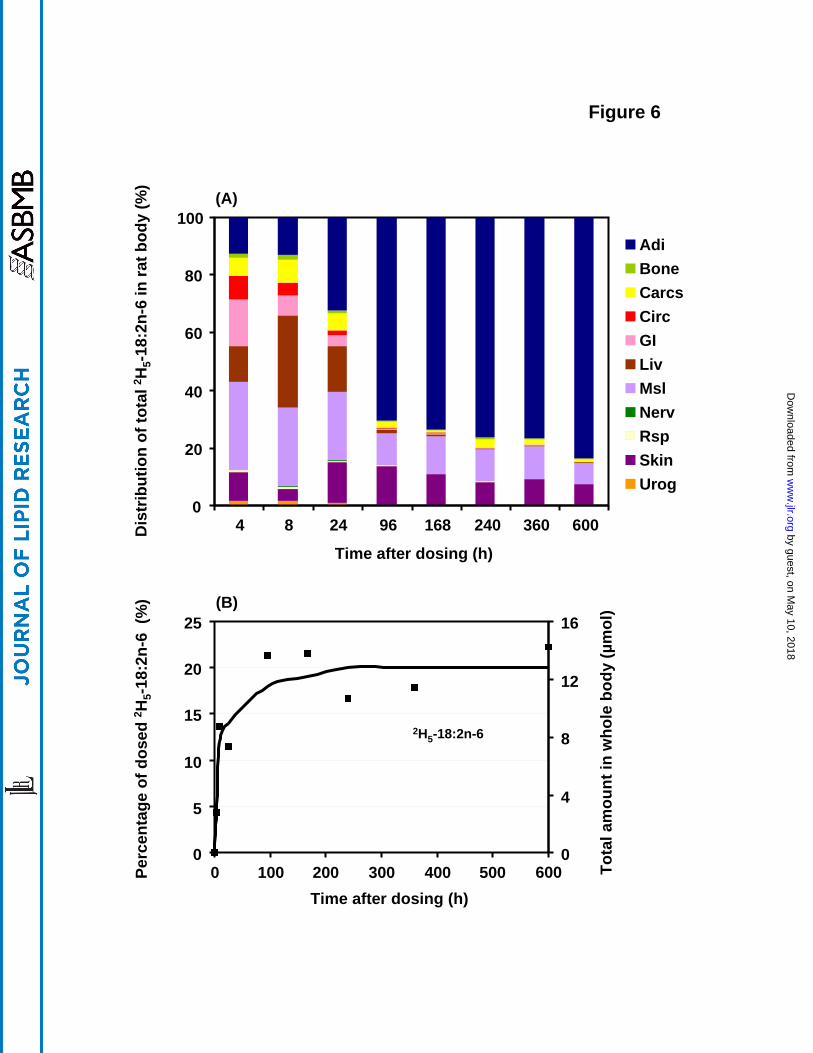
Figure 6D
istr
ibut
ion
of to
tal 2 H
5-18
:2n-
6 in
rat b
ody
(%)
Time after dosing (h)
(A)
0
20
40
60
80
100
4 8 24 96 168 240 360 600
AdiBoneCarcsCircGILivMslNervRspSkinUrog
0
5
10
15
20
25
0 100 200 300 400 500 6000
4
8
12
16
2H5-18:2n-6
(B)
Perc
enta
ge o
f dos
ed 2 H
5-18
:2n-
6 (%
)
Tota
l am
ount
in w
hole
bod
y (µ
mol
)
Time after dosing (h)
by guest, on May 10, 2018
ww
w.jlr.org
Dow
nloaded from
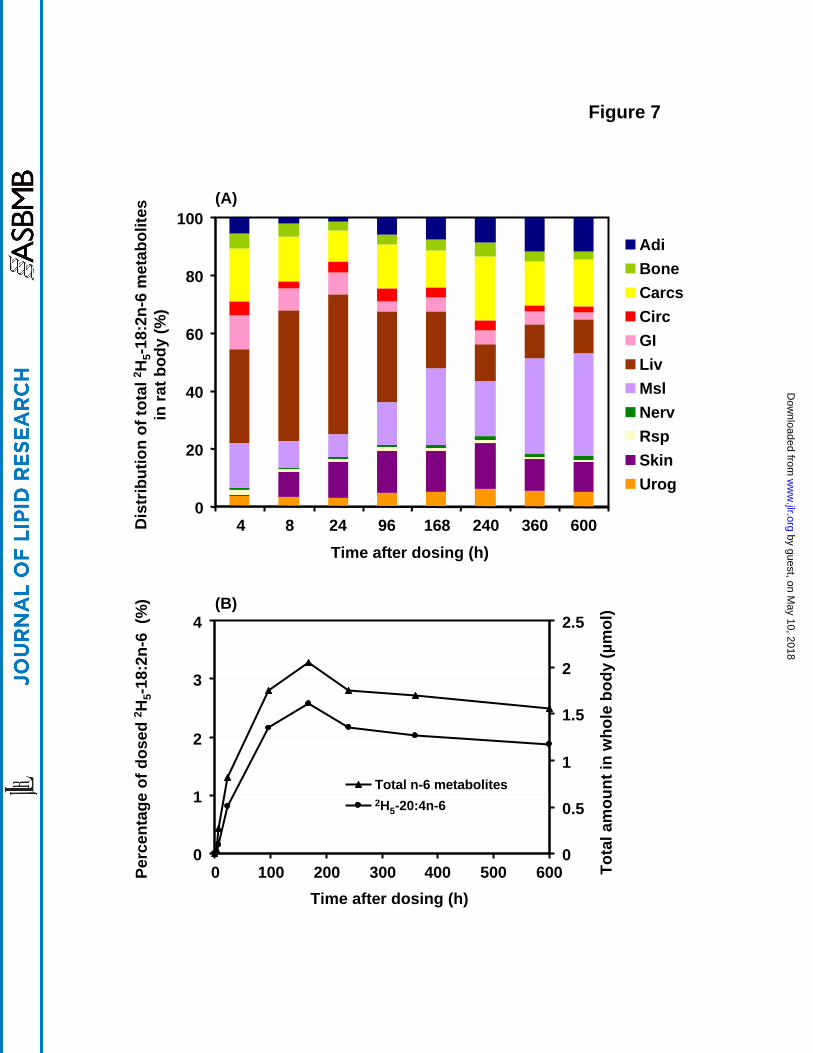
Figure 7
0
20
40
60
80
100
4 8 24 96 168 240 360 600
AdiBoneCarcsCircGILivMslNervRspSkinUrog
(A)
Dis
trib
utio
n of
tota
l 2 H5-
18:2
n-6
met
abol
ites
in ra
t bod
y (%
)
Time after dosing (h)
0
1
2
3
4
0 100 200 300 400 500 6000
0.5
1
1.5
2
2.5(B)
2H5-20:4n-6Total n-6 metabolites
Perc
enta
ge o
f dos
ed 2 H
5-18
:2n-
6 (%
)
Tota
l am
ount
in w
hole
bod
y (µ
mol
)
Time after dosing (h)
by guest, on May 10, 2018
ww
w.jlr.org
Dow
nloaded from
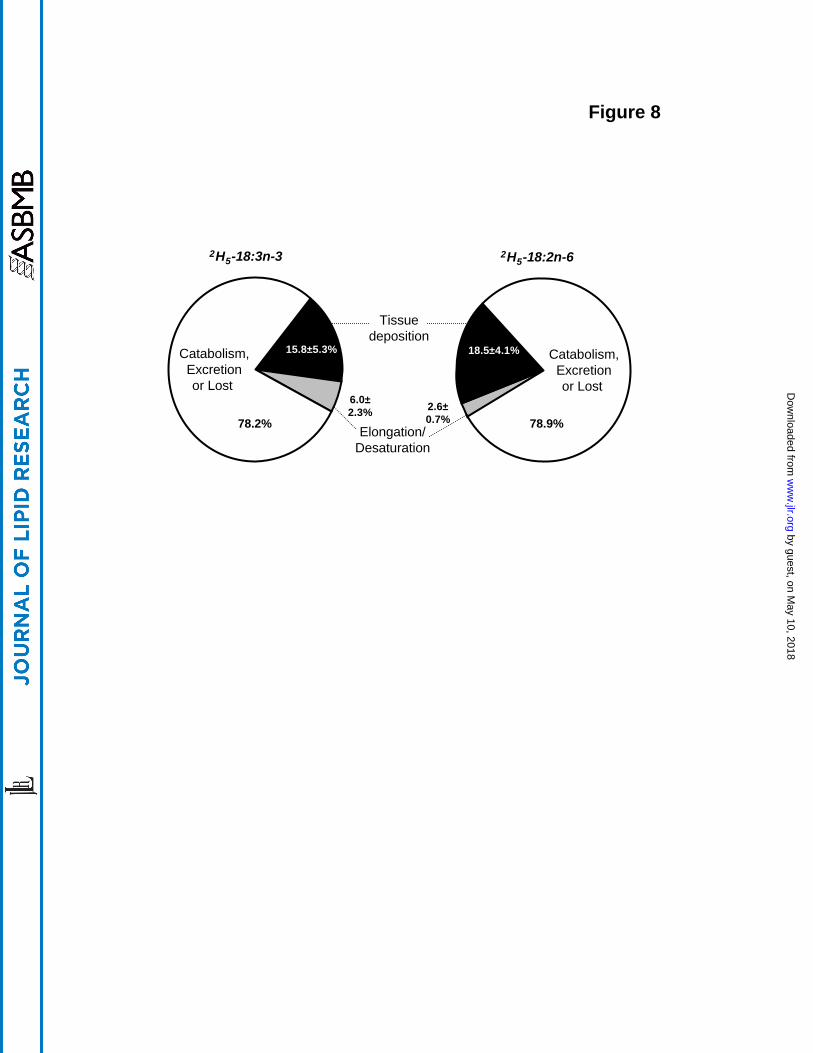
Figure 8
2H5-18:3n-3
15.8±5.3%
78.2%
6.0±2.3%
Tissue deposition
Elongation/Desaturation
2H5-18:2n-6
18.5±4.1%
2.6±0.7% 78.9%
Catabolism,Excretionor Lost
Catabolism,Excretionor Lost
by guest, on May 10, 2018
ww
w.jlr.org
Dow
nloaded from