who wears spectacles ?
TRANSCRIPT
537
a patient who had been in a position to choose his
surgeon q Is the hospital authority to ensure that noduties are performed by a doctor unless he has attainedthe particular standard of skill which the courts mightthink was requisite in the circumstances ? Must it
prescribe which duties particular doctors are to perform,instead of leaving it to the individual doctor to determinewhen he requires professional assistance from senior
colleagues ? Added point is lent to these queries by thereport of a recent action where the court said that,in allowing a junior medical officer to administer a
particular anaesthetic which had unfortunate results,the hospital authority should carry the whole liabilityfor damages.3As things are, the hospital authorities are left uncertain
of the extent of their responsibilities. Are they merelyresponsible for setting up an organisation for securingthat patients can obtain the medical services they require,while preserving the doctor-patient responsibility ? Or,are they to assume a duty to treat patients through theemployment of medical staff The patient, too, is entitledto have his position made clear. When he goes into
hospital, the average patient undoubtedly looks on him-self as a patient of " the hospital." Should he be sounfortunate as to have occasion for a claim for damages,he will almost always look to the hospital authority forredress. In England, he will find this assumption of hisrelationship with the hospital supported by the courts ;but, in Scotland, he will learn, usually to his surprise,that only the doctor can be held liable where negligencein medical treatment is alleged.The questions raised here are at present impossible to
answer, but they are of tremendous importance. The
practice of medicine is an intangible and delicate affair,and the introduction of the sort of restrictions whichseem to be implied in the present trend of the law, maywell slow down progress by placing a premium on
orthodoxy.
Special Articles
WHO WEARS SPECTACLES ?
P. G. GRAY B.Sc. Lond.
F’ron2 the <SeM6fZ Survey Davision of the Central Office ofInformation
THE information given here was obtained in the courseof the Survey of Sickness during the first fortnights ofApril and June, 1951. It will be remembered that eachmonth a randomly selected sample of 4000 civilian adults,* *aged 21 and over, are interviewed in their homes andthe results of this survey are published in the Registrar-General’s Quarterly Return for England and Wales.The sampling method employed has been describedelsewhere (Gray et al. 1950a and b). In April the samplewere asked, besides the normal questions about theirhealth, whether they wore spectacles. The June samplewere asked to give information about spectacle-wearingfor everyone in their households. The age, sex, and
relationship to the informant of everyone in the house-hold are always obtained in order to classify informantsby the type of household to which they belong. Thus,from the June sample we obtained information about13,495 persons.The answers to the spectacle question have been
classified into those who never wear spectacles, those who3. Jones v. Manchester Regional Hospital Board. See Lancet,
Aug. 11, 1951. p. 254.* In fact the full sample selected was not interviewed. The reasons
for this and the small bias resulting have already been discussed(Gray et al. 1950a and b). A comparison of the sample byage-groups with the Registrar-General’s estimates for December,1950, can be made using the parenthetical figures of table i.Good agreement will be found.
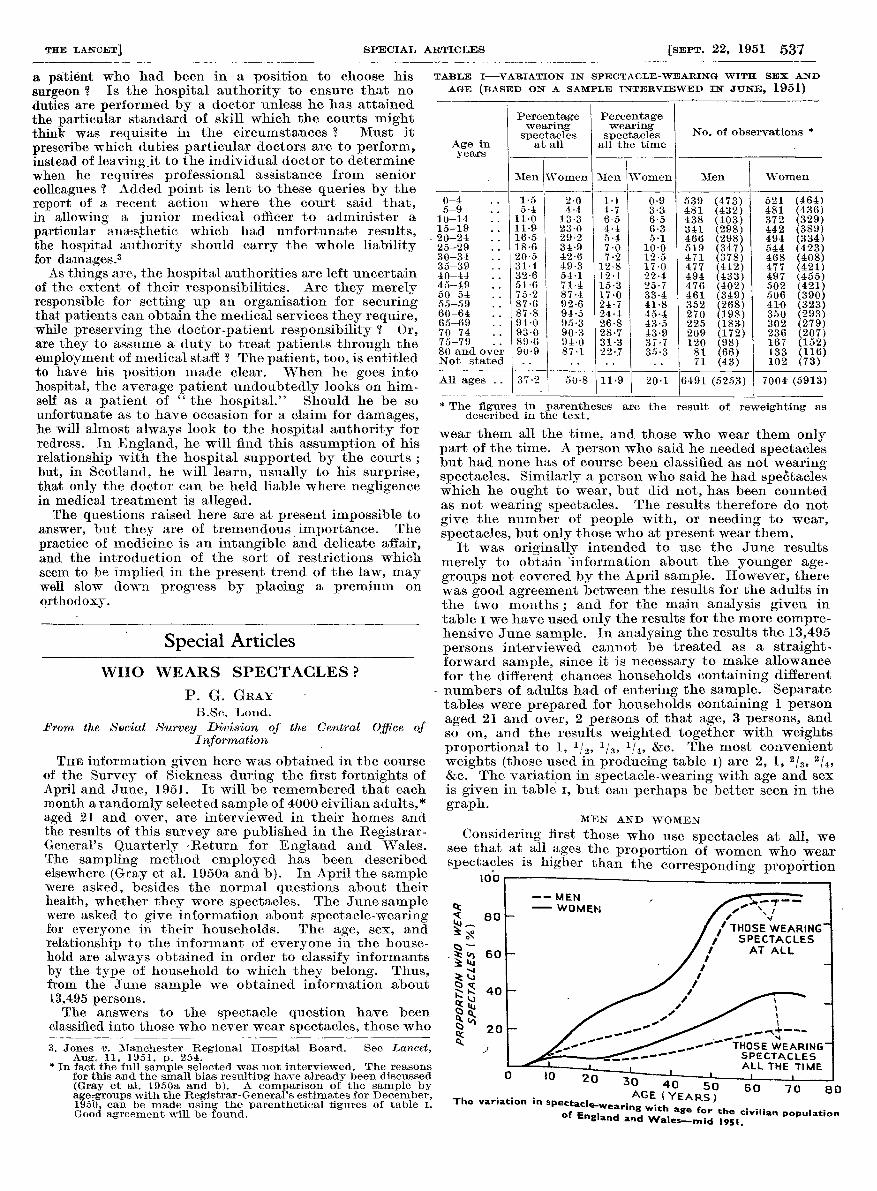
TABLE I-VARIATION IN SPECTACLE-WEARING WITH SEX AND
AGE (BASED ON A SAMPLE INTERVIEWED IN JUNE, 1951)
* The figures in parentheses are the result of reweighting asdescribed in the text.
wear them all the time, and those who wear them onlypart of the time. A person who said he needed spectaclesbut had none has of course been classified as not wearingspectacles. Similarly a person who said he had spectacleswhich he ought to wear, but did not, has been countedas not wearing spectacles. The results therefore do notgive the number of people with, or needing to wear,spectacles, but only those who at present wear them.
It was originally intended to use the June results
merely to obtain ’information about the younger age-groups not covered by the April sample. However, therewas good agreement between the results for the adults inthe two months ; and for the main analysis given intable i we have used only the results for the more compre-hensive June sample. In analysing the results the 13,495persons interviewed cannot be treated as a straight-forward sample, since it is necessary to make allowancefor the different chances households containing different
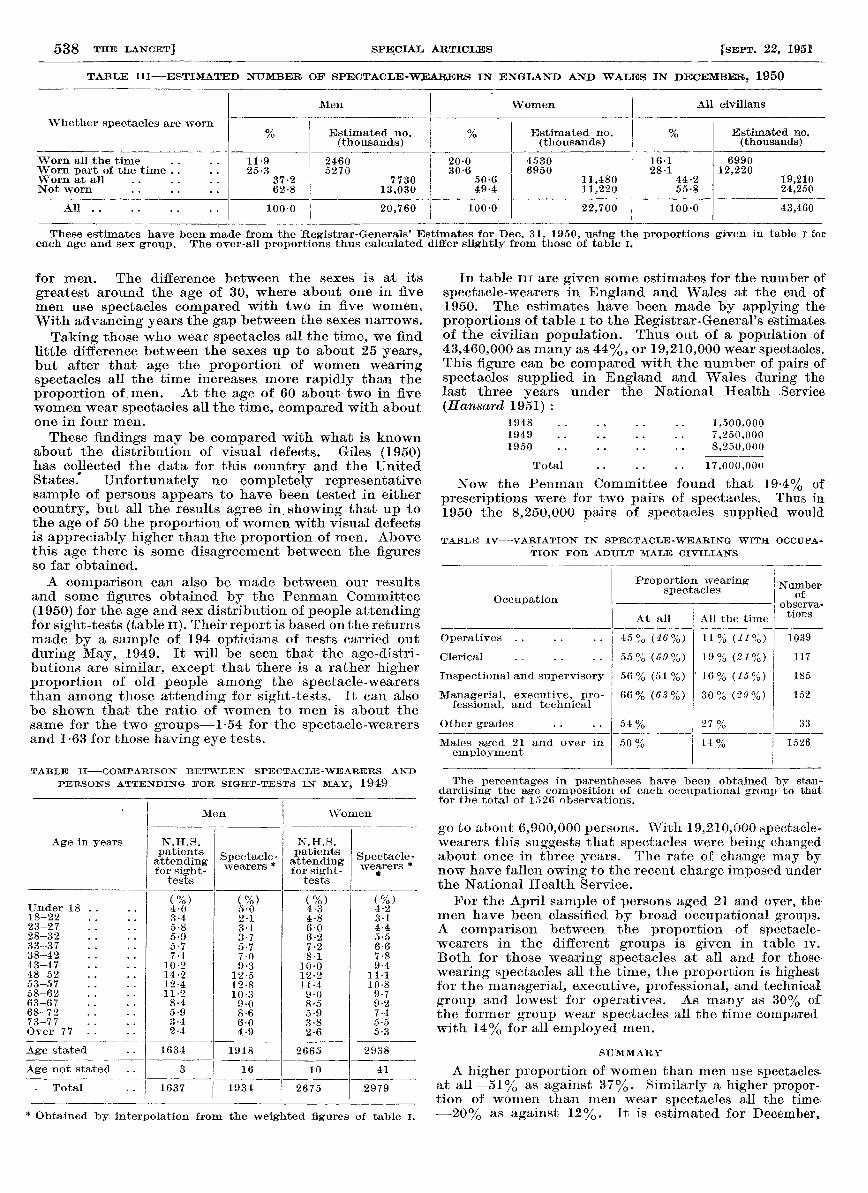
- numbers of adults had of entering the sample. Separatetables were prepared for households containing 1 personaged 21 and over, 2 persons of that age, 3 persons, andso on, and the results weighted together with weightsproportional to 1, 1/2’ 1/3’ 1/4’ &c. The most convenientweights (those used in producing table i) are 2, 1, Z/3, 4,&c. The variation in spectacle-wearing with age and sexis given in table i, but can perhaps be better seen in thegraph.
MEN AND WOMEN
Considering first those who use spectacles at all, wesee that at all ages the proportion of women who wearspectacles is higher than the corresponding proportion
- TV u 60 70 80
AGE (YEARS)The variation in spectacle-wearing with age for the civilian populationof England and Wales-mid 1951.
538
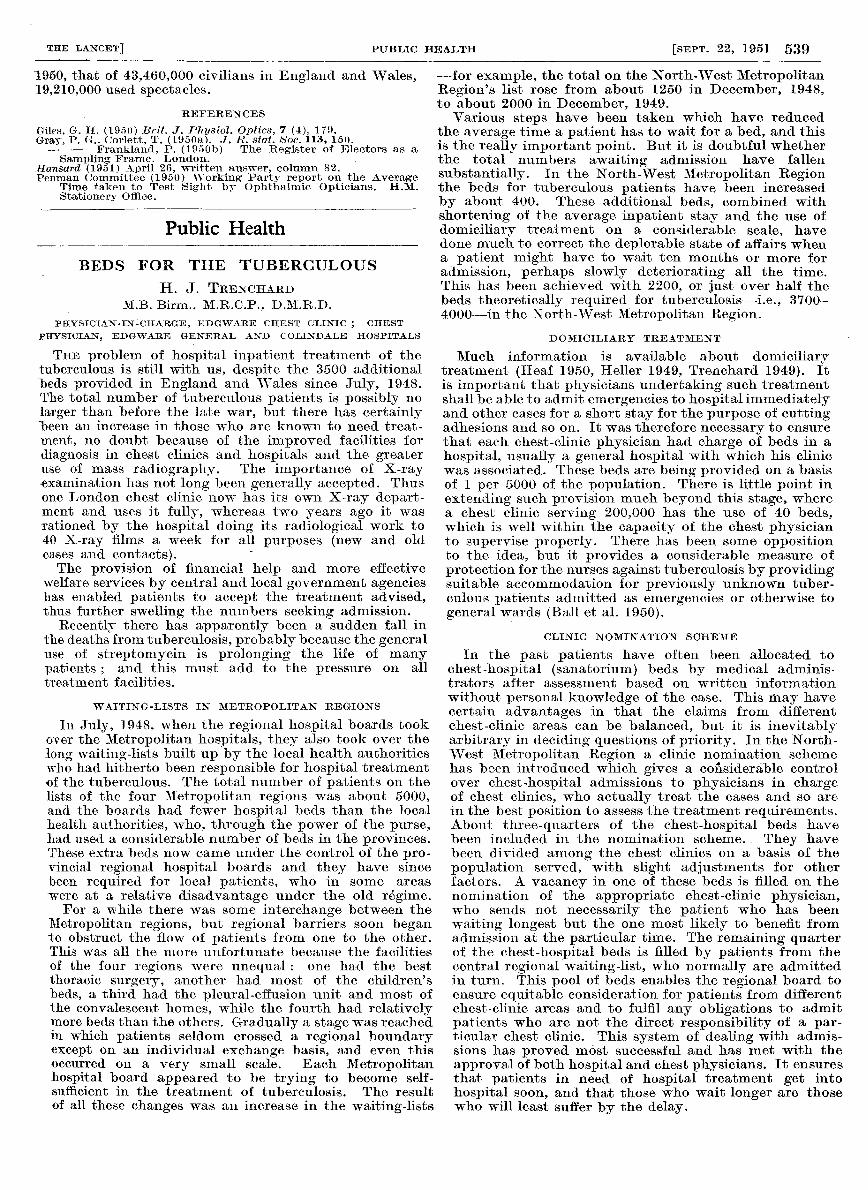
TABLE III—ESTIMATED NUMBER OF SPECTACLE-WEARERS IN ENGLAND AND WALES IN DECEMBER, 1950
These estimates have been made from the Registrar-Generals’ Estimates for Dec. 31, 1950, using the proportions given in table I foreach age and sex group. The over-all proportions thus calculated differ slightly from those of table i.
for men. The difference between the sexes is at its
greatest around the age of 30, where about one in fivemen use spectacles compared with two in five women.With advancing years the gap between the sexes narrows.
Taking those who wear spectacles all the time, we findlittle difference between the sexes up to about 25 years,but after that age the proportion of women wearingspectacles all the time increases more rapidly than theproportion of men. At the age of 60 about two in fivewomen wear spectacles all the time, compared with aboutone in four men.
These findings may be compared with what is knownabout the distribution of visual defects. Giles (1950)has collected the data for this country and the UnitedStates. Unfortunately no completely representativesample of persons appears to have been tested in eithercountry, but all the results agree in showing that up tothe age of 50 the proportion of women with visual defectsis appreciably higher than the proportion of men. Abovethis age there is some disagreement between the figuresso far obtained.A comparison can also be made between our results
and some figures obtained by the Penman Committee(1950) for the age and sex distribution of people attendingfor sight-tests (table 11). Their report is based on the returnsmade by a sample of 194 opticians of tests carried outduring May, 1949. It will be seen that the age-distri-butions are similar, except that there is a rather higherproportion of old people among the spectacle-wearersthan among those attending for sight-tests. It can alsobe shown that the ratio of women to men is about thesame for the two groups-1-54 for the spectacle-wearersand 1-63 for those having eye tests.
TABLE II-COMPARISON BETWEEN SPECTACLE-WEARERS AND
PERSONS ATTENDING FOR SIGHT-TESTS IN MAY, 1949
* Obtained by interpolation from the weighted figures of table i.
In table ill are given some estimates for the number ofspectacle-wearers in England and Wales at the end of1950. The estimates have been made by applying th&
proportions of table i to the Registrar-General’s estimatesof the civilian population. Thus out of a population of43,460,000 as many as 44%, or 19,210,000 wear spectacles.This figure can be compared with the number of pairs ofspectacles supplied in England and Wales during thelast three vears under the National Health .Service(Hansard 1951 ) :
Now the Penman Committee found that 19-4% of
prescriptions were for two pairs of spectacles. Thus in1950 the 8,250,000 pairs of spectacles supplied would
TABLE IV-VARIATION IN SPECTACLE-WEARING WITH OCCUPA-
TION FOR ADULT MALE CIVILIANS
The percentages in parentheses have been obtained by stan-dardising the age composition of each occupational group to that.for the total of 1526 observations.
go to about 6,900,000 persons. With 19,210,000 spectacle-wearers this suggests that spectacles were being changedabout once in three years. The rate of change may bynow have fallen owing to the recent charge imposed underthe National Health Service.For the April sample of persons aged 21 and over, the-
men have been classified by broad occupational groups.A comparison between the proportion of spectacle-wearers in the different groups is given in table iv.
Both for those wearing spectacles at all and for those,wearing spectacles all the time, the proportion is highestfor the managerial, executive, professional, and technicalgroup and lowest for operatives. As many as 30% ofthe former group wear spectacles all the time comparedwith 14% for all employed men.
SUMMARY
A higher proportion of women than men use spectaclesat all-51% as against 37%. Similarly a higher propor-tion of women than men wear spectacles all the time:- 20% as against 12%. It is estimated for Decemberm
539
1950, that of 43,460,000 civilians in England and Wales,19,210,000 used spectacles.
REFERENCES
Giles. G. H. (1950) Brit. J. Physiol. Optics, 7 (4), 179.Gray, P. G., Corlett, T. (1950a). J. R. stat. Soc. 113, 150.
— — Frankland, P. (1950b) The Register of Electors as aSampling Frame. London.
Hansard (1951) April 26, written answer, column 82.Penman Committee (1950) Working Party report on the Average
Time taken to Test Sight by Ophthalmic Opticians. H.M.Stationery Office.
Public Health
BEDS FOR THE TUBERCULOUS
H. J. TRENCHARDM.B. Birm., M.R.C.P., D.M.R.D.
PHYSICIAN-IN-CHARGE, EDGWARE CHEST CLINIC ; CHEST
PHYSICIAN, EDGWARE GENERAL AND COLINDALE HOSPITALS
THE problem of hospital inpatient treatment of thetuberculous is still with us, despite the 3500 additionalbeds provided in England and Wales since July, 1948.The total number of tuberculous patients is possibly nolarger than before the late war, but there has certainlybeen an increase in those who are known to need treat-ment, no doubt because of the improved facilities fordiagnosis in chest clinics and hospitals and the greateruse of mass radiography. The importance of X-rayexamination has not long been generally accepted. Thusone London chest clinic now has its own X-ray depart-ment and uses it fully, whereas two years ago it wasrationed by the hospital doing its radiological work to40 X-ray films a week for all purposes (new and oldcases and contacts).
-
The provision of financial help and more effectivewelfare services by central and local government agencieshas enabled patients to accept the treatment advised,thus further swelling the numbers seeking admission.
Recently there has apparently been a sudden fall inthe deaths from tuberculosis, probably because the generaluse of streptomycin is prolonging the life of manypatients ; and this must add to the pressure on alltreatment facilities.
WAITING-LISTS IX METROPOLITAN REGIONS
In July, 1948, when the regional hospital boards tookover the Metropolitan hospitals, they also took over thelong waiting-lists built up by the local health authoritieswho had hitherto been responsible for hospital treatmentof the tuberculous. The total number of patients on thelists of the four Metropolitan regions was about 5000,and the boards had fewer hospital beds than the localhealth authorities, who, through the power of the purse,had used a considerable number of beds in the provinces.These extra beds now came under the control of the pro-vincial regional hospital boards and they have sincebeen required for local patients, who in some areas
were at a relative disadvantage under the old regime.For a while there was some interchange between the
Metropolitan regions, but regional barriers soon beganto obstruct the flow of patients from one to the other.This was all the more unfortunate because the facilitiesof the four regions were unequal : one had the bestthoracic surgery, another had most of the children’sbeds, a third had the pleural-effusion unit and most ofthe convalescent homes, while the fourth had relativelymore beds than the others. Gradually a stage was reachedin which patients seldom crossed a regional boundaryexcept on an individual exchange basis, and even thisoccurred on a very small scale. Each Metropolitanhospital board appeared to be trying to become self-sufficient in the treatment of tuberculosis. The resultof all these changes was an increase in the waiting-lists
-for example, the total on the North-West MetropolitanRegion’s list rose from about 1250 in December, 1948,to about 2000 in December, 1949.
Various steps have been taken which have reducedthe average time a patient has to wait for a bed, and thisis the really important point. But it is doubtful whetherthe total numbers awaiting admission have fallensubstantially. In the North-West Metropolitan Regionthe beds for tuberculous patients have been increasedby about 400. These additional beds, combined withshortening of the average inpatient stay and the use ofdomiciliary treatment on a considerable scale, havedone much to correct the deplorable state of affairs whena patient might have to wait ten months or more foradmission, perhaps slowly deteriorating all the time.This has been achieved with 2200, or just over half thebeds theoretically required for tuberculosis-i.e., 3700-4000-in the North-West Metropolitan Region.
DOMICILIARY TREATMENT
Much information is available about domiciliarytreatment (Heaf 1950, Heller 1949, Trenchard 1949). Itis important that physicians undertaking such treatmentshall be able to admit emergencies to hospital immediatelyand other cases for a short stay for the purpose of cuttingadhesions and so on. It was therefore necessary to ensurethat each chest-clinic physician had charge of beds in ahospital, usually a general hospital with which his clinicwas associated. These beds are being provided on a basisof 1 per 5000 of the population. There is little point inextending such provision much beyond this stage, wherea chest clinic serving 200,000 has the use of 40 beds,which is well within the capacity of the chest, physicianto supervise properly. There has been some oppositionto the idea, but it provides a considerable measure ofprotection for the nurses against tuberculosis by providingsuitable accommodation for previously unknown tuber-culous patients admitted as emergencies or otherwise togeneral wards (Ball et al. 1950).
CLINIC NOMINATION SCHEME
In the past patients have often been allocated tochest-hospital (sanatorium) beds by medical adminis-trators after assessment based on written informationwithout personal knowledge of the case. This may havecertain advantages in that the claims from differentchest-clinic areas can be balanced, but it is inevitablyarbitrary in deciding questions of priority. In the North-West Metropolitan Region a clinic nomination schemehas been introduced which gives a considerable controlover chest-hospital admissions to physicians in chargeof chest clinics, who actually treat the cases and so arein the best position to assess the treatment requirements.About three-quarters of the chest-hospital beds havebeen included in the nomination scheme. They havebeen divided among the chest clinics on a basis of the
population served, with slight adjustments for otherfactors. A vacancy in one of these beds is filled on thenomination of the appropriate chest-clinic physician,who sends not necessarily the patient who has beenwaiting longest but the one most likely to benefit fromadmission at the particular time. The remaining quarterof the chest-hospital beds is filled by patients from thecentral regional waiting-list, who normally are admittedin turn. This pool of beds enables the regional board toensure equitable consideration for patients from differentchest-clinic areas and to fulfil any obligations to admitpatients who are not the direct responsibility of a par-ticular chest clinic. This system of dealing with admis-sions has proved most successful and has met with theapproval of both hospital and chest physicians. It ensuresthat patients in need of hospital treatment get into
hospital soon, and that those who wait longer are thosewho will least suffer by the delay.