white paper ap08324002e evaluating efficiency and …pub/@eaton/@corp/documents/...evaluating...
TRANSCRIPT
Effective July 2010White Paper AP08324002E
Evaluating Efficiency and Losses of Various Circuit Protective Devices
AbstractElectrical system protective devices dissipate heat during normal operation. Depending on the type, rating and size of the overcurrent protective device, the magnitude of losses varies. This paper discusses a test program that quantified those losses for several typical fuses and circuit breakers. The results of this effort show that protective systems using switch and fuse were found to be less energy-efficient compared with equivalently sized circuit breakers when carrying the same load.
IntroductionDiscussions of power losses within electrical power systems predominantly focus on the role of resistive (also known as “I2R”) losses as the major sources of losses. As its name suggests, resistive losses are defined as:
Equation 1: Wloss = I2R
Where:• Wloss = power loss in watts• I = current in conductor in amperes• R = resistance of conductor in ohms
From Equation 1 we see that resistive power losses in a device are proportional to the resistance of the conductors within a device. For the same current flowing in both, devices with lower internal resistance will have less power loss compared with devices having a higher internal resistance.
To ensure we understood the actual losses within circuit breakers compared with both fused and unfused switches, we developed a test program to measure the losses from each of several types, brands, sizes and ratings of circuit breakers, fuses and switches.
As a result of these tests, the differences in power losses between several types of circuit breakers and fuses were noted. These differences are noted in Table 1 in the next column:
Table 1. Percentage power loss differences between various types of circuit breakers and fuses
ComparisonAmpere Range
3-Phase Power Losses
Molded Case Breaker versus RK-5 fuses
20–600 A Fuse dissipated, on average, 121% higher losses than MCCB of same size and rating
Molded Case Breaker versus Class J fuses
20–600 A Fuse dissipated, on average, 91% higher losses than MCCB of same size and rating
Molded Case Breaker versus Class L fuses
800–2500 A Fuse dissipated, on average, 226% higher losses than MCCB of same size and rating
Fixed Mounted Air Circuit Breaker versus Class L fuses
800–5000 A Fuse dissipated, on average, 434% higher losses than Fixed Mounted Air Circuit Breaker of same size and rating
Draw-Out Air Circuit Breaker versus Class L fuses
800–5000 A Fuse dissipated, on average, 148% higher losses than Draw-Out Air Circuit Breaker of same size and rating
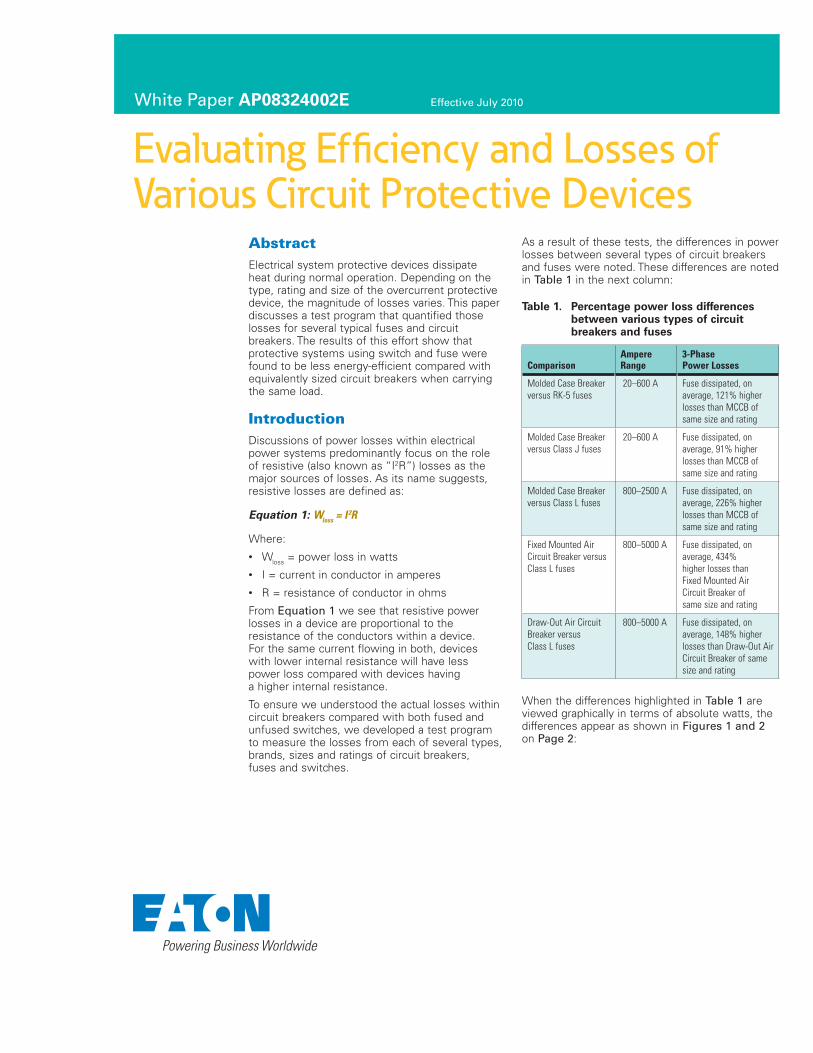
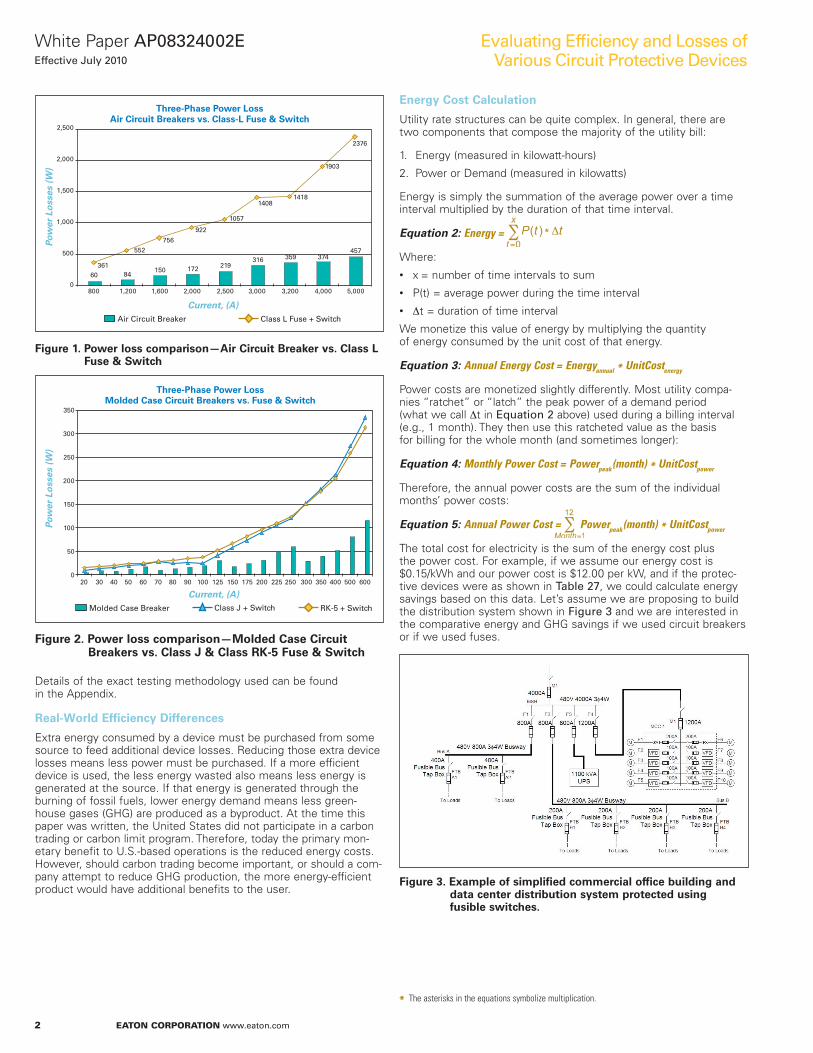
When the differences highlighted in Table 1 are viewed graphically in terms of absolute watts, the differences appear as shown in Figures 1 and 2 on Page 2:
2
White Paper AP08324002EEffective July 2010
EATON CORPORATION www.eaton.com
Evaluating Efficiency and Losses of Various Circuit Protective Devices
Figure 1. Power loss comparison—Air Circuit Breaker vs. Class L Fuse & Switch
Figure 2. Power loss comparison—Molded Case Circuit Breakers vs. Class J & Class RK-5 Fuse & Switch
Details of the exact testing methodology used can be found in the Appendix.
Real-World Efficiency Differences
Extra energy consumed by a device must be purchased from some source to feed additional device losses. Reducing those extra device losses means less power must be purchased. If a more efficient device is used, the less energy wasted also means less energy is generated at the source. If that energy is generated through the burning of fossil fuels, lower energy demand means less green-house gases (GHG) are produced as a byproduct. At the time this paper was written, the United States did not participate in a carbon trading or carbon limit program. Therefore, today the primary mon-etary benefit to U.S.-based operations is the reduced energy costs. However, should carbon trading become important, or should a com-pany attempt to reduce GHG production, the more energy-efficient product would have additional benefits to the user.
Energy Cost Calculation
Utility rate structures can be quite complex. In general, there are two components that compose the majority of the utility bill:
1. Energy (measured in kilowatt-hours)
2. Power or Demand (measured in kilowatts)
Energy is simply the summation of the average power over a time interval multiplied by the duration of that time interval.
Equation 2: Energy =
Where:• x = number of time intervals to sum• P(t) = average power during the time interval• ∆t = duration of time interval
We monetize this value of energy by multiplying the quantity of energy consumed by the unit cost of that energy.
Equation 3: Annual Energy Cost = Energyannual * UnitCostenergy
Power costs are monetized slightly differently. Most utility compa-nies “ratchet” or “latch” the peak power of a demand period (what we call ∆t in Equation 2 above) used during a billing interval (e.g., 1 month). They then use this ratcheted value as the basis for billing for the whole month (and sometimes longer):
Equation 4: Monthly Power Cost = Powerpeak(month) * UnitCostpower
Therefore, the annual power costs are the sum of the individual months’ power costs:
Equation 5: Annual Power Cost = Powerpeak(month) * UnitCostpower
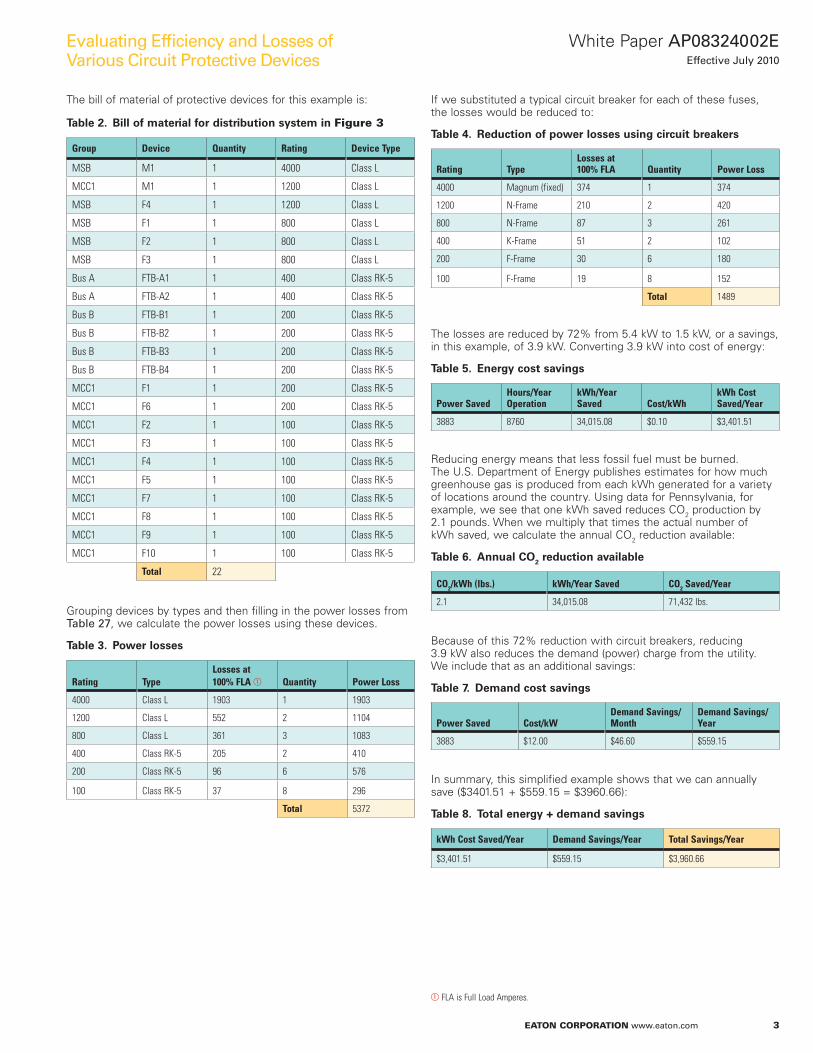
The total cost for electricity is the sum of the energy cost plus the power cost. For example, if we assume our energy cost is $0.15/kWh and our power cost is $12.00 per kW, and if the protec-tive devices were as shown in Table 27, we could calculate energy savings based on this data. Let’s assume we are proposing to build the distribution system shown in Figure 3 and we are interested in the comparative energy and GHG savings if we used circuit breakers or if we used fuses.
Figure 3. Example of simplified commercial office building and data center distribution system protected using fusible switches.
1903
1418
922
1057
361
552
756
359 374457
172 219316
15060 84
Three-Phase Power LossAir Circuit Breakers vs. Class-L Fuse & Switch
2,500
2,000
1,500
1,000
500
0 800 1,200 1,600 2,000 2,500 3,000 3,200 4,000 5,000
Current, (A)Air Circuit Breaker Class L Fuse + Switch
Pow
er L
oss
es (
W)
1408
2376
Three-Phase Power LossMolded Case Circuit Breakers vs. Fuse & Switch
Current, (A)Molded Case Breaker RK-5 + Switch
Pow
er L
oss
es (
W)
Class J + Switch
20 30 40 50 60 70 80 90 100 125 150 175 200 225 250 300 350 400 500 600
350
300
250
200
150
100
50
0
* The asterisks in the equations symbolize multiplication.
3
White Paper AP08324002EEffective July 2010
EATON CORPORATION www.eaton.com
Evaluating Efficiency and Losses of Various Circuit Protective Devices
The bill of material of protective devices for this example is:
Table 2. Bill of material for distribution system in Figure 3
Group Device Quantity Rating Device Type
MSB M1 1 4000 Class L
MCC1 M1 1 1200 Class L
MSB F4 1 1200 Class L
MSB F1 1 800 Class L
MSB F2 1 800 Class L
MSB F3 1 800 Class L
Bus A FTB-A1 1 400 Class RK-5
Bus A FTB-A2 1 400 Class RK-5
Bus B FTB-B1 1 200 Class RK-5
Bus B FTB-B2 1 200 Class RK-5
Bus B FTB-B3 1 200 Class RK-5
Bus B FTB-B4 1 200 Class RK-5
MCC1 F1 1 200 Class RK-5
MCC1 F6 1 200 Class RK-5
MCC1 F2 1 100 Class RK-5
MCC1 F3 1 100 Class RK-5
MCC1 F4 1 100 Class RK-5
MCC1 F5 1 100 Class RK-5
MCC1 F7 1 100 Class RK-5
MCC1 F8 1 100 Class RK-5
MCC1 F9 1 100 Class RK-5
MCC1 F10 1 100 Class RK-5
Total 22
Grouping devices by types and then filling in the power losses from Table 27, we calculate the power losses using these devices.
Table 3. Power losses
Rating TypeLosses at 100% FLA a Quantity Power Loss
4000 Class L 1903 1 1903
1200 Class L 552 2 1104
800 Class L 361 3 1083
400 Class RK-5 205 2 410
200 Class RK-5 96 6 576
100 Class RK-5 37 8 296
Total 5372
If we substituted a typical circuit breaker for each of these fuses, the losses would be reduced to:
Table 4. Reduction of power losses using circuit breakers
Rating TypeLosses at 100% FLA Quantity Power Loss
4000 Magnum (fixed) 374 1 374
1200 N-Frame 210 2 420
800 N-Frame 87 3 261
400 K-Frame 51 2 102
200 F-Frame 30 6 180
100 F-Frame 19 8 152
Total 1489
The losses are reduced by 72% from 5.4 kW to 1.5 kW, or a savings, in this example, of 3.9 kW. Converting 3.9 kW into cost of energy:
Table 5. Energy cost savings
Power SavedHours/Year Operation
kWh/Year Saved Cost/kWh
kWh Cost Saved/Year
3883 8760 34,015.08 $0.10 $3,401.51
Reducing energy means that less fossil fuel must be burned. The U.S. Department of Energy publishes estimates for how much greenhouse gas is produced from each kWh generated for a variety of locations around the country. Using data for Pennsylvania, for example, we see that one kWh saved reduces CO2 production by 2.1 pounds. When we multiply that times the actual number of kWh saved, we calculate the annual CO2 reduction available:
Table 6. Annual CO2 reduction available
CO2/kWh (lbs.) kWh/Year Saved CO2 Saved/Year
2.1 34,015.08 71,432 lbs.
Because of this 72% reduction with circuit breakers, reducing 3.9 kW also reduces the demand (power) charge from the utility. We include that as an additional savings:
Table 7. Demand cost savings
Power Saved Cost/kWDemand Savings/Month
Demand Savings/Year
3883 $12.00 $46.60 $559.15
In summary, this simplified example shows that we can annually save ($3401.51 + $559.15 = $3960.66):
Table 8. Total energy + demand savings
kWh Cost Saved/Year Demand Savings/Year Total Savings/Year
$3,401.51 $559.15 $3,960.66
aFLA is Full Load Amperes.
4
White Paper AP08324002EEffective July 2010
EATON CORPORATION www.eaton.com
Evaluating Efficiency and Losses of Various Circuit Protective Devices
Assuming the project life extended to 25 years at a conservative 8% cost of money and a 2% net annual escalation cost of energy (after inflation), the net present benefit of a design using circuit breakers instead of fused switches would be:
Table 9. Net present value—circuit breakers over fused switches
NPV (Net Present Value)
$68,060
When fusible switches are added to distribution switchboards and switchgear, that fusible equipment is larger than equivalently sized circuit breaker-protected equipment, nearly always resulting in fusible equipment costing more than circuit breaker-protected equipment. Therefore, the net present value will be even higher:
Table 10. Higher net present value with smaller circuit breaker- protected equipment
NPV
$68,060 + Cost savings of smaller sized circuit breaker equipment
To simplify these energy saving calculations, Eatont developed a Web-based calculator that evaluates the resistive power losses of selected protective devices and calculates the energy and greenhouse gas savings when using one type of protective device versus another. The greenhouse gas savings comes as a result of less energy needing to be generated when using the higher-efficiency product.
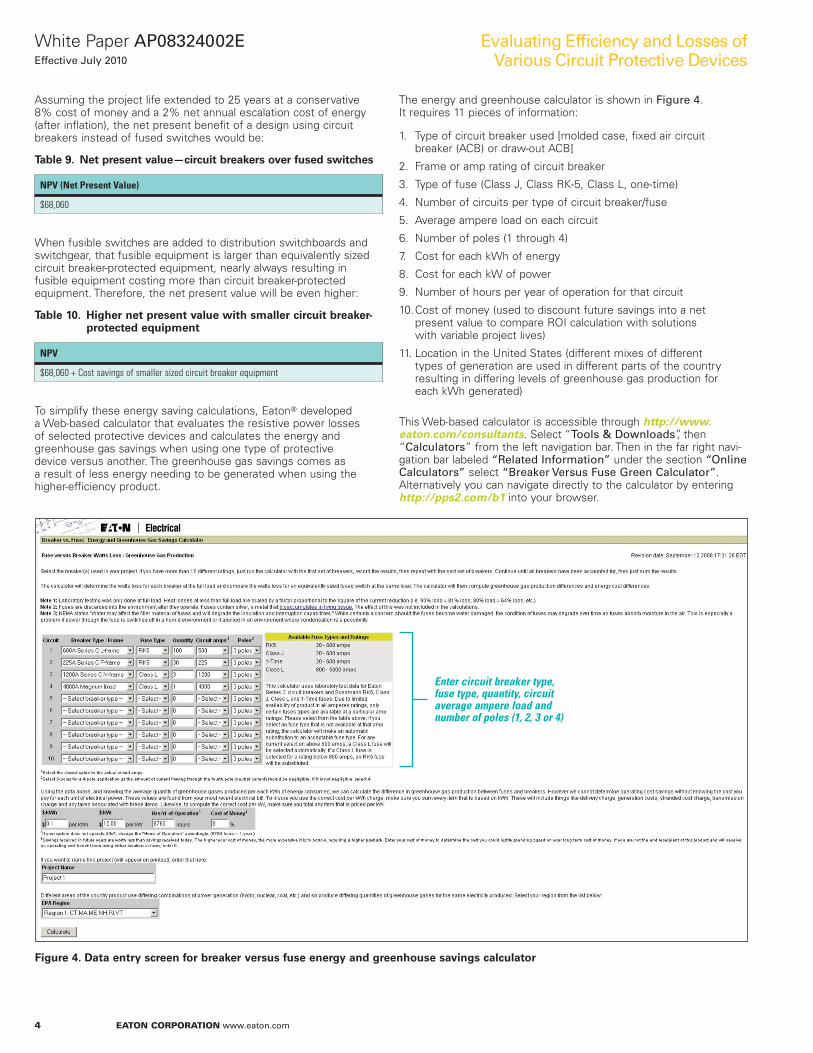
The energy and greenhouse calculator is shown in Figure 4. It requires 11 pieces of information:
1. Type of circuit breaker used [molded case, fixed air circuit breaker (ACB) or draw-out ACB]
2. Frame or amp rating of circuit breaker
3. Type of fuse (Class J, Class RK-5, Class L, one-time)
4. Number of circuits per type of circuit breaker/fuse
5. Average ampere load on each circuit
6. Number of poles (1 through 4)
7. Cost for each kWh of energy
8. Cost for each kW of power
9. Number of hours per year of operation for that circuit
10. Cost of money (used to discount future savings into a net present value to compare ROI calculation with solutions with variable project lives)
11. Location in the United States (different mixes of different types of generation are used in different parts of the country resulting in differing levels of greenhouse gas production for each kWh generated)
This Web-based calculator is accessible through http://www.eaton.com/consultants. Select “Tools & Downloads”, then “Calculators” from the left navigation bar. Then in the far right navi-gation bar labeled “Related Information” under the section “Online Calculators” select “Breaker Versus Fuse Green Calculator”. Alternatively you can navigate directly to the calculator by entering http://pps2.com/b1 into your browser.
Enter circuit breaker type, fuse type, quantity, circuit average ampere load and number of poles (1, 2, 3 or 4)
Figure 4. Data entry screen for breaker versus fuse energy and greenhouse savings calculator
5
White Paper AP08324002EEffective July 2010
EATON CORPORATION www.eaton.com
Evaluating Efficiency and Losses of Various Circuit Protective Devices
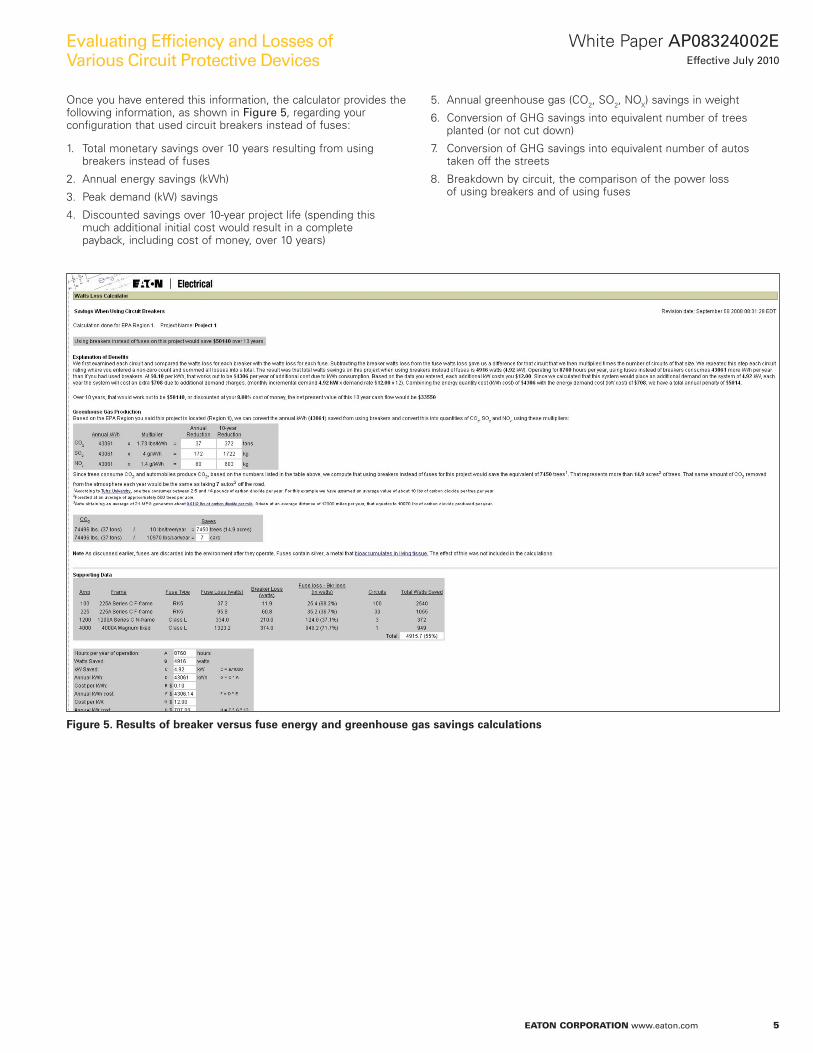
Once you have entered this information, the calculator provides the following information, as shown in Figure 5, regarding your configuration that used circuit breakers instead of fuses:
1. Total monetary savings over 10 years resulting from using breakers instead of fuses
2. Annual energy savings (kWh)
3. Peak demand (kW) savings
4. Discounted savings over 10-year project life (spending this much additional initial cost would result in a complete payback, including cost of money, over 10 years)
5. Annual greenhouse gas (CO2, SO2, NOX) savings in weight
6. Conversion of GHG savings into equivalent number of trees planted (or not cut down)
7. Conversion of GHG savings into equivalent number of autos taken off the streets
8. Breakdown by circuit, the comparison of the power loss of using breakers and of using fuses
Figure 5. Results of breaker versus fuse energy and greenhouse gas savings calculations
6
White Paper AP08324002EEffective July 2010
EATON CORPORATION www.eaton.com
Evaluating Efficiency and Losses of Various Circuit Protective Devices
AppendixTest Method and Program
This section of the report describes the test methodology used to calculate the energy and greenhouse gas savings for breakers and fuses. While small, portable micro-ohmmeters could be used to measure the resistance through the device, we had two concerns with that method.
1. Unless the voltage generated exceeded the breakdown voltage of the oxide layers formed between pressure connections, we might see an artificially high resistance. To minimize this problem, we chose a source power supply to provide 24 volts dc. 24 volts has been shownbto be sufficient to penetrate the oxide layer formed on the pressure junction surfaces (contacts, fuse clips, lugs, etc.). Direct current was chosen rather than alternating current due to the problems with inductive reactance masking changes in resistance.c
2. Resistance of metallic conductors used in protective devices increases as the temperature of those conductors increases. It was desirable to measure voltage drop at as close to normal operating temperature as possible. Therefore an attempt was made to measure the resistance at full rated current, rather than some lower level of test current.
+
-
Voltage ‘Vdrop2’
Device Under Test
RD Adjustable Load Bank
24 Vdc power supply
Calibrated Shunt
Voltage ‘Vdrop1’
Test Current ‘I’
RS
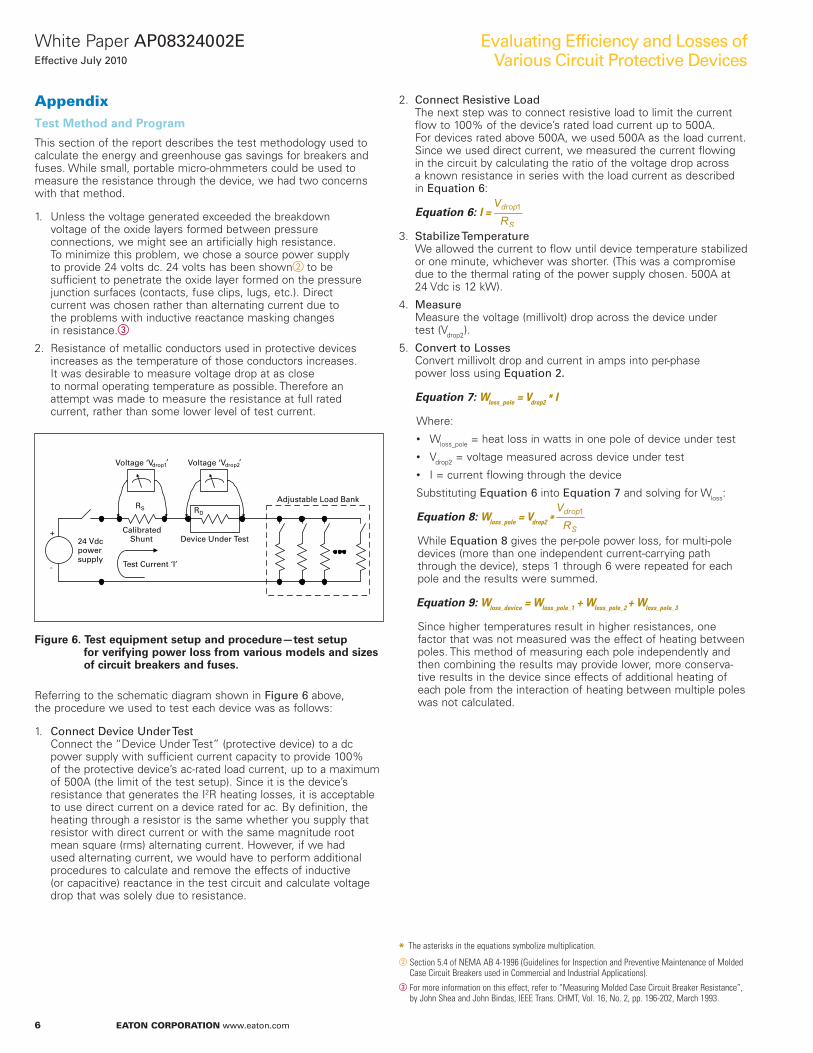
Figure 6. Test equipment setup and procedure—test setup for verifying power loss from various models and sizes of circuit breakers and fuses.
Referring to the schematic diagram shown in Figure 6 above, the procedure we used to test each device was as follows:
1. Connect Device Under TestConnect the “Device Under Test” (protective device) to a dc power supply with sufficient current capacity to provide 100% of the protective device’s ac-rated load current, up to a maximum of 500A (the limit of the test setup). Since it is the device’s resistance that generates the I2R heating losses, it is acceptable to use direct current on a device rated for ac. By definition, the heating through a resistor is the same whether you supply that resistor with direct current or with the same magnitude root mean square (rms) alternating current. However, if we had used alternating current, we would have to perform additional procedures to calculate and remove the effects of inductive (or capacitive) reactance in the test circuit and calculate voltage drop that was solely due to resistance.
2. Connect Resistive LoadThe next step was to connect resistive load to limit the current flow to 100% of the device’s rated load current up to 500A. For devices rated above 500A, we used 500A as the load current. Since we used direct current, we measured the current flowing in the circuit by calculating the ratio of the voltage drop across a known resistance in series with the load current as described in Equation 6:
Equation 6: I =
3. Stabilize TemperatureWe allowed the current to flow until device temperature stabilized or one minute, whichever was shorter. (This was a compromise due to the thermal rating of the power supply chosen. 500A at 24 Vdc is 12 kW).
4. MeasureMeasure the voltage (millivolt) drop across the device under test (Vdrop2).
5. Convert to Losses Convert millivolt drop and current in amps into per-phase power loss using Equation 2.
Equation 7: Wloss_pole = Vdrop2 * I
Where:• Wloss_pole = heat loss in watts in one pole of device under test• Vdrop2 = voltage measured across device under test• I = current flowing through the device
Substituting Equation 6 into Equation 7 and solving for Wloss:
Equation 8: Wloss_pole = Vdrop2 *
While Equation 8 gives the per-pole power loss, for multi-pole devices (more than one independent current-carrying path through the device), steps 1 through 6 were repeated for each pole and the results were summed.
Equation 9: Wloss_device = Wloss_pole_1 + Wloss_pole_2 + Wloss_pole_3
Since higher temperatures result in higher resistances, one factor that was not measured was the effect of heating between poles. This method of measuring each pole independently and then combining the results may provide lower, more conserva-tive results in the device since effects of additional heating of each pole from the interaction of heating between multiple poles was not calculated.
bSection 5.4 of NEMA AB 4-1996 (Guidelines for Inspection and Preventive Maintenance of Molded Case Circuit Breakers used in Commercial and Industrial Applications).
cFor more information on this effect, refer to “Measuring Molded Case Circuit Breaker Resistance”, by John Shea and John Bindas, IEEE Trans. CHMT, Vol. 16, No. 2, pp. 196-202, March 1993.
* The asterisks in the equations symbolize multiplication.
7
White Paper AP08324002EEffective July 2010
EATON CORPORATION www.eaton.com
Evaluating Efficiency and Losses of Various Circuit Protective Devices
Results of Testing Program
As it would be difficult to perform experiments comparing the losses of all possible fuse sizes, types and ratings, one goal of the testing program was to test representative samples from the universe of possible devices and see if inferences could be drawn that would allow us to estimate the losses from devices not tested.
We began our tests by connecting 30A and 60A, Class J and RK-5 fuses mounted in Eaton type FDP fusible switches. The test setup described in Figure 6 was used to measure the resistances and calculate the power losses using the methodology of Equation 8. Using that equation we constructed Table 11:
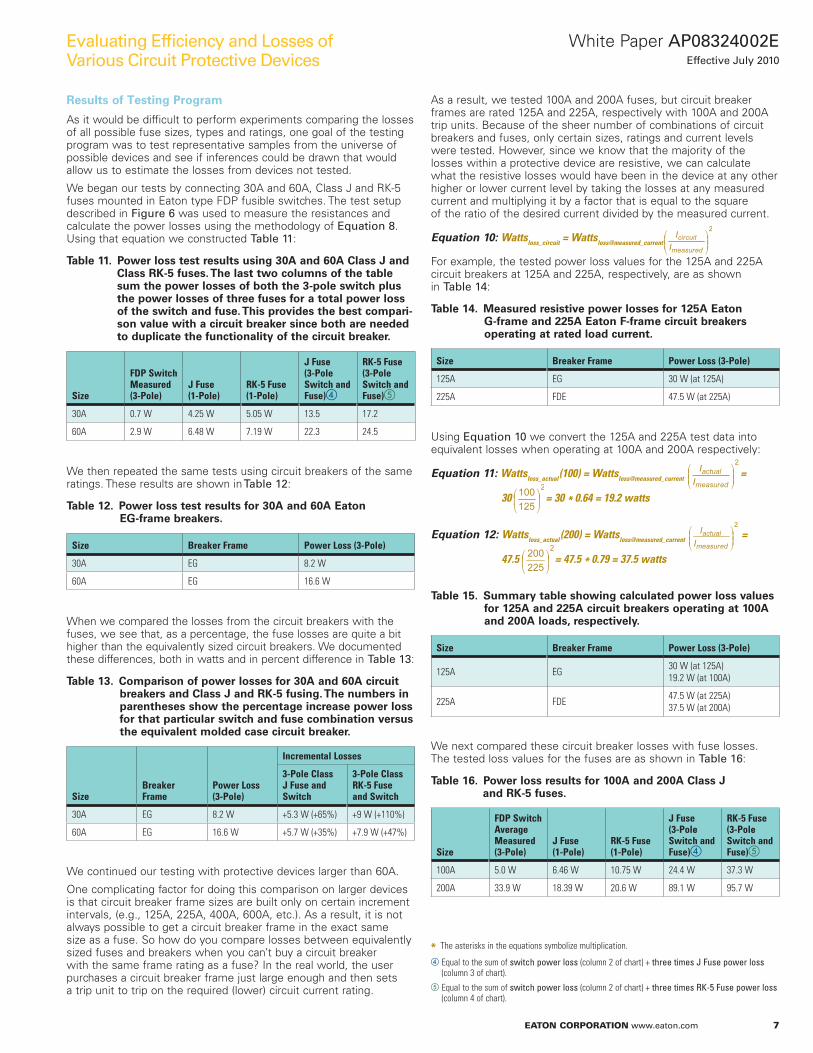
Table 11. Power loss test results using 30A and 60A Class J and Class RK-5 fuses. The last two columns of the table sum the power losses of both the 3-pole switch plus the power losses of three fuses for a total power loss of the switch and fuse. This provides the best compari-son value with a circuit breaker since both are needed to duplicate the functionality of the circuit breaker.
Size
FDP Switch Measured (3-Pole)
J Fuse (1-Pole)
RK-5 Fuse (1-Pole)
J Fuse (3-Pole Switch and Fuse)d
RK-5 Fuse (3-Pole Switch and Fuse)e
30A 0.7 W 4.25 W 5.05 W 13.5 17.2
60A 2.9 W 6.48 W 7.19 W 22.3 24.5
We then repeated the same tests using circuit breakers of the same ratings. These results are shown in Table 12:
Table 12. Power loss test results for 30A and 60A Eaton EG-frame breakers.
Size Breaker Frame Power Loss (3-Pole)
30A EG 8.2 W
60A EG 16.6 W
When we compared the losses from the circuit breakers with the fuses, we see that, as a percentage, the fuse losses are quite a bit higher than the equivalently sized circuit breakers. We documented these differences, both in watts and in percent difference in Table 13:
Table 13. Comparison of power losses for 30A and 60A circuit breakers and Class J and RK-5 fusing. The numbers in parentheses show the percentage increase power loss for that particular switch and fuse combination versus the equivalent molded case circuit breaker.
SizeBreaker Frame
Power Loss (3-Pole)
Incremental Losses
3-Pole Class J Fuse and Switch
3-Pole Class RK-5 Fuse and Switch
30A EG 8.2 W +5.3 W (+65%) +9 W (+110%)
60A EG 16.6 W +5.7 W (+35%) +7.9 W (+47%)
We continued our testing with protective devices larger than 60A.
One complicating factor for doing this comparison on larger devices is that circuit breaker frame sizes are built only on certain increment intervals, (e.g., 125A, 225A, 400A, 600A, etc.). As a result, it is not always possible to get a circuit breaker frame in the exact same size as a fuse. So how do you compare losses between equivalently sized fuses and breakers when you can’t buy a circuit breaker with the same frame rating as a fuse? In the real world, the user purchases a circuit breaker frame just large enough and then sets a trip unit to trip on the required (lower) circuit current rating.
As a result, we tested 100A and 200A fuses, but circuit breaker frames are rated 125A and 225A, respectively with 100A and 200A trip units. Because of the sheer number of combinations of circuit breakers and fuses, only certain sizes, ratings and current levels were tested. However, since we know that the majority of the losses within a protective device are resistive, we can calculate what the resistive losses would have been in the device at any other higher or lower current level by taking the losses at any measured current and multiplying it by a factor that is equal to the square of the ratio of the desired current divided by the measured current.
Equation 10: Wattsloss_circuit = Wattsloss@measured_current
For example, the tested power loss values for the 125A and 225A circuit breakers at 125A and 225A, respectively, are as shown in Table 14:
Table 14. Measured resistive power losses for 125A Eaton G-frame and 225A Eaton F-frame circuit breakers operating at rated load current.
Size Breaker Frame Power Loss (3-Pole)
125A EG 30 W (at 125A)
225A FDE 47.5 W (at 225A)
Using Equation 10 we convert the 125A and 225A test data into equivalent losses when operating at 100A and 200A respectively:
Equation 11: Wattsloss_actual(100) = Wattsloss@measured_current =
30 = 30 * 0.64 = 19.2 watts
Equation 12: Wattsloss_actual(200) = Wattsloss@measured_current =
47.5 = 47.5 * 0.79 = 37.5 watts
Table 15. Summary table showing calculated power loss values for 125A and 225A circuit breakers operating at 100A and 200A loads, respectively.
Size Breaker Frame Power Loss (3-Pole)
125A EG 30 W (at 125A) 19.2 W (at 100A)
225A FDE 47.5 W (at 225A) 37.5 W (at 200A)
We next compared these circuit breaker losses with fuse losses. The tested loss values for the fuses are as shown in Table 16:
Table 16. Power loss results for 100A and 200A Class J and RK-5 fuses.
Size
FDP Switch Average Measured (3-Pole)
J Fuse (1-Pole)
RK-5 Fuse (1-Pole)
J Fuse (3-Pole Switch and Fuse)d
RK-5 Fuse (3-Pole Switch and Fuse)e
100A 5.0 W 6.46 W 10.75 W 24.4 W 37.3 W
200A 33.9 W 18.39 W 20.6 W 89.1 W 95.7 W
dEqual to the sum of switch power loss (column 2 of chart) + three times J Fuse power loss (column 3 of chart).
eEqual to the sum of switch power loss (column 2 of chart) + three times RK-5 Fuse power loss (column 4 of chart).
* The asterisks in the equations symbolize multiplication.
8
White Paper AP08324002EEffective July 2010
EATON CORPORATION www.eaton.com
Evaluating Efficiency and Losses of Various Circuit Protective Devices
Comparing these losses with the calculated losses of the breakers operating at the same current level, we summarize the results in Table 17:
Table 17. Comparison between calculated power losses of EG and FDE frame breakers operating at 100A and 225A, respectively, with Class J and RK-5 fuses of the same rating. The values in parentheses are the increased watts and percentage increase watts of the switch and fuse combination versus the equivalent circuit breaker. Because of the somewhat arbitrary breakpoint between available fuse ratings and breaker frame sizes, these ratios will vary when looking at individual ratings. Refer instead to Table 1 and Table 28 for summary and detail tables, respectively, of the comparative power losses across the entire range of 30A–5000A.
SizeBreaker Frame
Power Loss (3-Pole)
3-Pole Class J Fuse and Switch Losses (v. Breaker)
3-Pole Class RK-5 Fuse and Switch Losses (v. Breaker)
100A EG 19.2 24.4 W (+5.2 W, +27%) 37.3 W (+18.1 W, +94%)
225A FDE 37.5 89.1 W (+51.6 W, +138%) 95.7 W (+58.2 W, +155%)
We consolidated the results from Table 14 (30A–60A tests) and Table 17 (100A–200A tests) into Table 18:
Table 18. Comparison of power losses of 30A–200A Eaton Series C (225A frame) and Series G (30A–125A frames) circuit breakers with Class J and RK-5 fuses.
SizeBreaker Frame
Power Loss (3-Pole)
3-Pole Class J Fuse and Switch Losses (v. Breaker)
3-Pole Class RK-5 Fuse and Switch Losses (v. Breaker)
30A EG 8.2 W 13.5 W (+5.3 W, +65%) 17.2 W (+9 W, +110%)
60A EG 16.6 W 22.3 W (+5.7 W, +34%) 24.5 W (+7.9 W, +48%)
100A EG 19.2 W 24.4 W (+5.2 W, +27%) 37.3 W (+18.1 W, +94%)
225A FDE 37.5 W 89.1 W (+51.6 W, +138%) 95.7 W (+58.2 W, +155%)
We then continued our testing above 200A.
Once we get above the 200A range, the comparison between devices becomes more complicated. There are two reasons for this:
1. While we tested circuit breakers and fuses alone up to 600A, we did not test a switch above 200A. The fuses were mounted in fuse clips, but the resistance of the switch and interconnecting conductors that are typical of a fused switch were not tested. This means our testing would indicate an artificially low value of power loss for fuses unless we found a way to compensate.
2. We did not test a fuse above 600A.
To fill in the losses from the missing sizes and ratings, we used a variety of techniques including:• Interpolation / Curve fitting• I2R Effect Estimates• Corroborating Data from Third Parties• Resistivity Temperature Coefficient Compensation
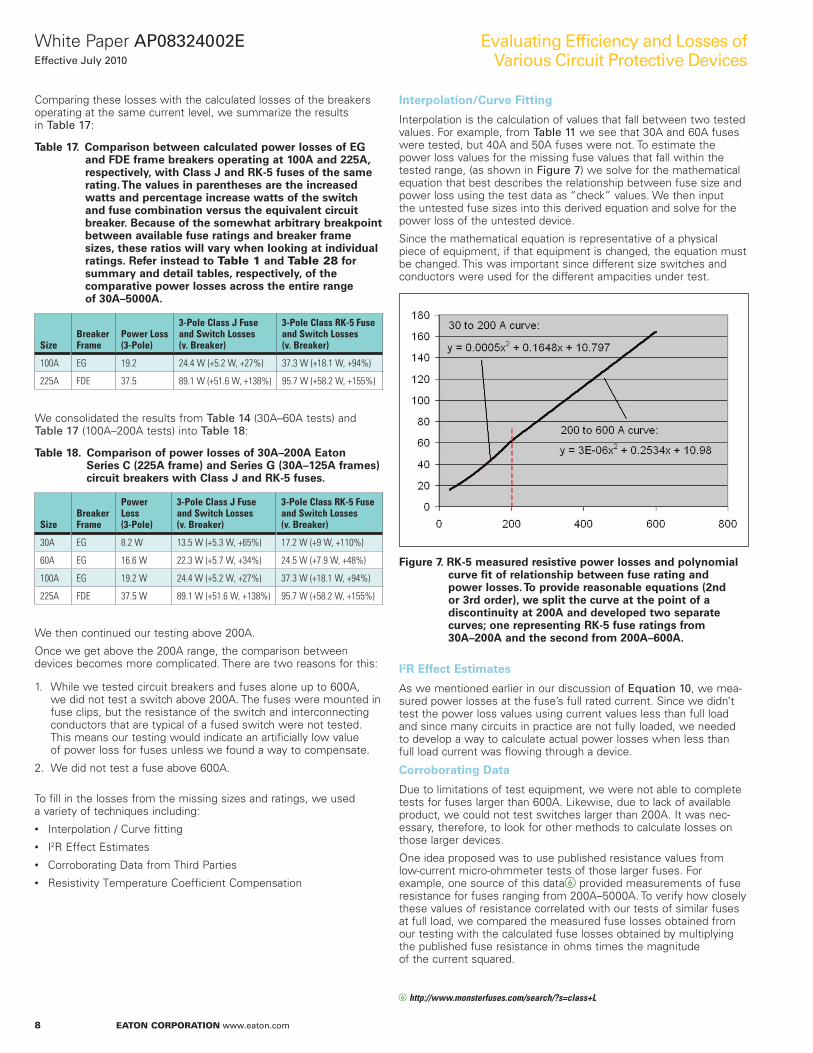
Interpolation/Curve Fitting
Interpolation is the calculation of values that fall between two tested values. For example, from Table 11 we see that 30A and 60A fuses were tested, but 40A and 50A fuses were not. To estimate the power loss values for the missing fuse values that fall within the tested range, (as shown in Figure 7) we solve for the mathematical equation that best describes the relationship between fuse size and power loss using the test data as “check” values. We then input the untested fuse sizes into this derived equation and solve for the power loss of the untested device.
Since the mathematical equation is representative of a physical piece of equipment, if that equipment is changed, the equation must be changed. This was important since different size switches and conductors were used for the different ampacities under test.
Figure 7. RK-5 measured resistive power losses and polynomial curve fit of relationship between fuse rating and power losses. To provide reasonable equations (2nd or 3rd order), we split the curve at the point of a discontinuity at 200A and developed two separate curves; one representing RK-5 fuse ratings from 30A–200A and the second from 200A–600A.
I2R Effect Estimates
As we mentioned earlier in our discussion of Equation 10, we mea-sured power losses at the fuse’s full rated current. Since we didn’t test the power loss values using current values less than full load and since many circuits in practice are not fully loaded, we needed to develop a way to calculate actual power losses when less than full load current was flowing through a device.
Corroborating Data
Due to limitations of test equipment, we were not able to complete tests for fuses larger than 600A. Likewise, due to lack of available product, we could not test switches larger than 200A. It was nec-essary, therefore, to look for other methods to calculate losses on those larger devices.
One idea proposed was to use published resistance values from low-current micro-ohmmeter tests of those larger fuses. For example, one source of this dataf provided measurements of fuse resistance for fuses ranging from 200A–5000A. To verify how closely these values of resistance correlated with our tests of similar fuses at full load, we compared the measured fuse losses obtained from our testing with the calculated fuse losses obtained by multiplying the published fuse resistance in ohms times the magnitude of the current squared.
fhttp://www.monsterfuses.com/search/?s=class+L
9
White Paper AP08324002EEffective July 2010
EATON CORPORATION www.eaton.com
Evaluating Efficiency and Losses of Various Circuit Protective Devices
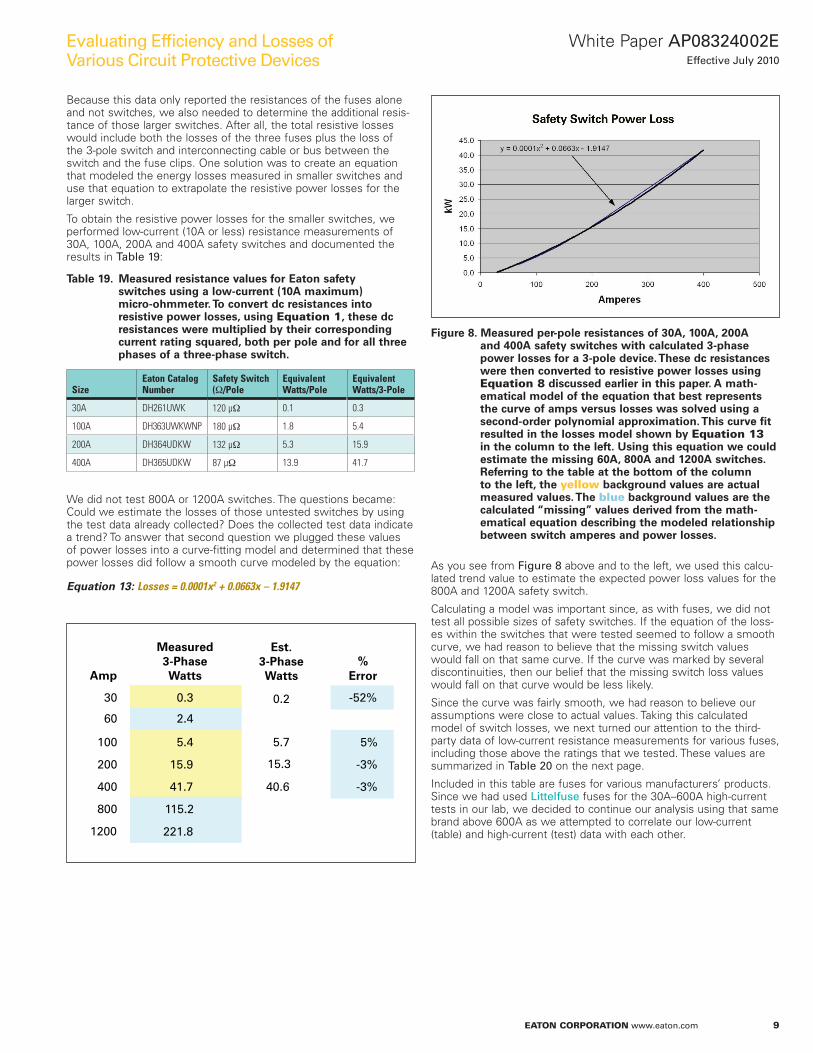
Because this data only reported the resistances of the fuses alone and not switches, we also needed to determine the additional resis-tance of those larger switches. After all, the total resistive losses would include both the losses of the three fuses plus the loss of the 3-pole switch and interconnecting cable or bus between the switch and the fuse clips. One solution was to create an equation that modeled the energy losses measured in smaller switches and use that equation to extrapolate the resistive power losses for the larger switch.
To obtain the resistive power losses for the smaller switches, we performed low-current (10A or less) resistance measurements of 30A, 100A, 200A and 400A safety switches and documented the results in Table 19:
Table 19. Measured resistance values for Eaton safety switches using a low-current (10A maximum) micro-ohmmeter. To convert dc resistances into resistive power losses, using Equation 1, these dc resistances were multiplied by their corresponding current rating squared, both per pole and for all three phases of a three-phase switch.
SizeEaton Catalog Number
Safety Switch (Ω/Pole
Equivalent Watts/Pole
Equivalent Watts/3-Pole
30A DH261UWK 120 μΩ 0.1 0.3
100A DH363UWKWNP 180 μΩ 1.8 5.4
200A DH364UDKW 132 μΩ 5.3 15.9
400A DH365UDKW 87 μΩ 13.9 41.7
We did not test 800A or 1200A switches. The questions became: Could we estimate the losses of those untested switches by using the test data already collected? Does the collected test data indicate a trend? To answer that second question we plugged these values of power losses into a curve-fitting model and determined that these power losses did follow a smooth curve modeled by the equation:
Equation 13: Losses = 0.0001x2 + 0.0663x – 1.9147
Amp
30
60
100
200
400
800
1200
Measured3-PhaseWatts
Est.3-PhaseWatts
%Error
0.3 0.2 -52%
2.4
5.4 5.7 5%
15.9 15.3 -3%
41.7 40.6 -3%
115.2
221.8
Figure 8. Measured per-pole resistances of 30A, 100A, 200A and 400A safety switches with calculated 3-phase power losses for a 3-pole device. These dc resistances were then converted to resistive power losses using Equation 8 discussed earlier in this paper. A math-ematical model of the equation that best represents the curve of amps versus losses was solved using a second-order polynomial approximation. This curve fit resulted in the losses model shown by Equation 13 in the column to the left. Using this equation we could estimate the missing 60A, 800A and 1200A switches. Referring to the table at the bottom of the column to the left, the yellow background values are actual measured values. The blue background values are the calculated “missing” values derived from the math-ematical equation describing the modeled relationship between switch amperes and power losses.
As you see from Figure 8 above and to the left, we used this calcu-lated trend value to estimate the expected power loss values for the 800A and 1200A safety switch.
Calculating a model was important since, as with fuses, we did not test all possible sizes of safety switches. If the equation of the loss-es within the switches that were tested seemed to follow a smooth curve, we had reason to believe that the missing switch values would fall on that same curve. If the curve was marked by several discontinuities, then our belief that the missing switch loss values would fall on that curve would be less likely.
Since the curve was fairly smooth, we had reason to believe our assumptions were close to actual values. Taking this calculated model of switch losses, we next turned our attention to the third- party data of low-current resistance measurements for various fuses, including those above the ratings that we tested. These values are summarized in Table 20 on the next page.
Included in this table are fuses for various manufacturers’ products. Since we had used Littelfuse fuses for the 30A–600A high-current tests in our lab, we decided to continue our analysis using that same brand above 600A as we attempted to correlate our low-current (table) and high-current (test) data with each other.
10
White Paper AP08324002EEffective July 2010
EATON CORPORATION www.eaton.com
Evaluating Efficiency and Losses of Various Circuit Protective Devices
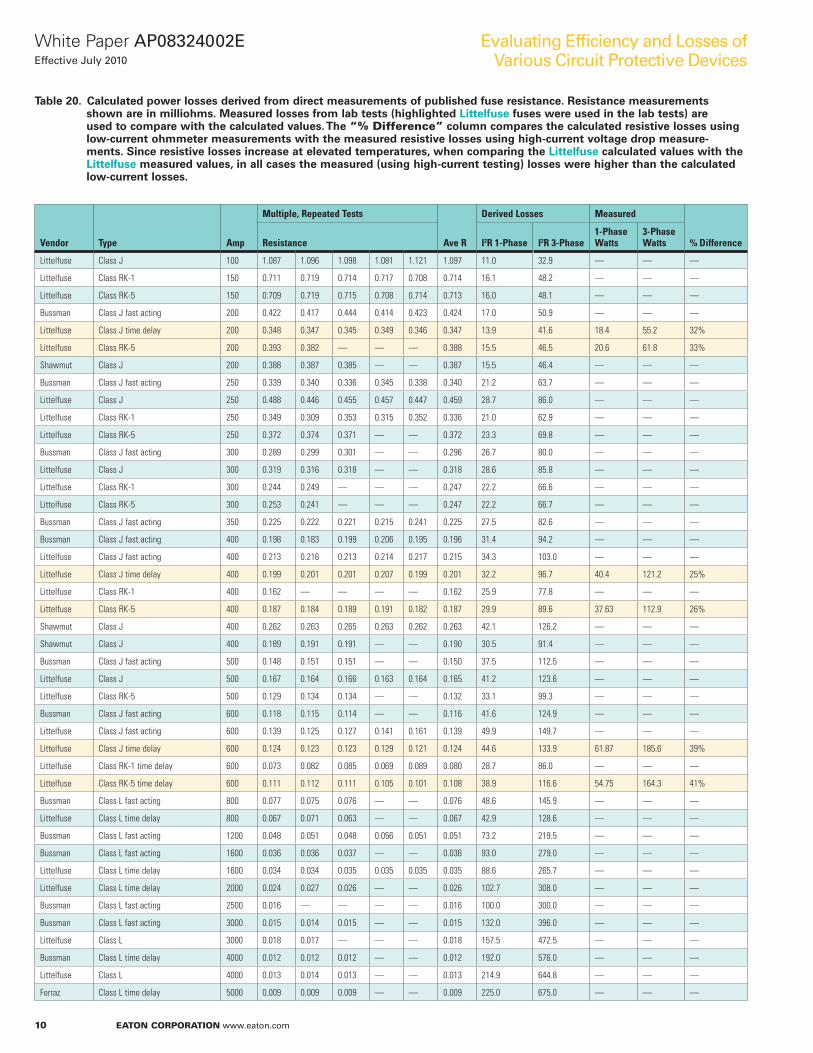
Table 20. Calculated power losses derived from direct measurements of published fuse resistance. Resistance measurements shown are in milliohms. Measured losses from lab tests (highlighted Littelfuse fuses were used in the lab tests) are used to compare with the calculated values. The “% Difference” column compares the calculated resistive losses using low-current ohmmeter measurements with the measured resistive losses using high-current voltage drop measure-ments. Since resistive losses increase at elevated temperatures, when comparing the Littelfuse calculated values with the Littelfuse measured values, in all cases the measured (using high-current testing) losses were higher than the calculated low-current losses.
Vendor Type Amp
Multiple, Repeated Tests
Ave R
Derived Losses Measured
% DifferenceResistance I2R 1-Phase I2R 3-Phase1-Phase Watts
3-Phase Watts
Littelfuse Class J 100 1.087 1.096 1.098 1.081 1.121 1.097 11.0 32.9 — — —
Littelfuse Class RK-1 150 0.711 0.719 0.714 0.717 0.708 0.714 16.1 48.2 — — —
Littelfuse Class RK-5 150 0.709 0.719 0.715 0.708 0.714 0.713 16.0 48.1 — — —
Bussman Class J fast acting 200 0.422 0.417 0.444 0.414 0.423 0.424 17.0 50.9 — — —
Littelfuse Class J time delay 200 0.348 0.347 0.345 0.349 0.346 0.347 13.9 41.6 18.4 55.2 32%
Littelfuse Class RK-5 200 0.393 0.382 — — — 0.388 15.5 46.5 20.6 61.8 33%
Shawmut Class J 200 0.388 0.387 0.385 — — 0.387 15.5 46.4 — — —
Bussman Class J fast acting 250 0.339 0.340 0.336 0.345 0.338 0.340 21.2 63.7 — — —
Littelfuse Class J 250 0.488 0.446 0.455 0.457 0.447 0.459 28.7 86.0 — — —
Littelfuse Class RK-1 250 0.349 0.309 0.353 0.315 0.352 0.336 21.0 62.9 — — —
Littelfuse Class RK-5 250 0.372 0.374 0.371 — — 0.372 23.3 69.8 — — —
Bussman Class J fast acting 300 0.289 0.299 0.301 — — 0.296 26.7 80.0 — — —
Littelfuse Class J 300 0.319 0.316 0.318 — — 0.318 28.6 85.8 — — —
Littelfuse Class RK-1 300 0.244 0.249 — — — 0.247 22.2 66.6 — — —
Littelfuse Class RK-5 300 0.253 0.241 — — — 0.247 22.2 66.7 — — —
Bussman Class J fast acting 350 0.225 0.222 0.221 0.215 0.241 0.225 27.5 82.6 — — —
Bussman Class J fast acting 400 0.198 0.183 0.199 0.206 0.195 0.196 31.4 94.2 — — —
Littelfuse Class J fast acting 400 0.213 0.216 0.213 0.214 0.217 0.215 34.3 103.0 — — —
Littelfuse Class J time delay 400 0.199 0.201 0.201 0.207 0.199 0.201 32.2 96.7 40.4 121.2 25%
Littelfuse Class RK-1 400 0.162 — — — — 0.162 25.9 77.8 — — —
Littelfuse Class RK-5 400 0.187 0.184 0.189 0.191 0.182 0.187 29.9 89.6 37.63 112.9 26%
Shawmut Class J 400 0.262 0.263 0.265 0.263 0.262 0.263 42.1 126.2 — — —
Shawmut Class J 400 0.189 0.191 0.191 — — 0.190 30.5 91.4 — — —
Bussman Class J fast acting 500 0.148 0.151 0.151 — — 0.150 37.5 112.5 — — —
Littelfuse Class J 500 0.167 0.164 0.166 0.163 0.164 0.165 41.2 123.6 — — —
Littelfuse Class RK-5 500 0.129 0.134 0.134 — — 0.132 33.1 99.3 — — —
Bussman Class J fast acting 600 0.118 0.115 0.114 — — 0.116 41.6 124.9 — — —
Littelfuse Class J fast acting 600 0.139 0.125 0.127 0.141 0.161 0.139 49.9 149.7 — — —
Littelfuse Class J time delay 600 0.124 0.123 0.123 0.129 0.121 0.124 44.6 133.9 61.87 185.6 39%
Littelfuse Class RK-1 time delay 600 0.073 0.082 0.085 0.069 0.089 0.080 28.7 86.0 — — —
Littelfuse Class RK-5 time delay 600 0.111 0.112 0.111 0.105 0.101 0.108 38.9 116.6 54.75 164.3 41%
Bussman Class L fast acting 800 0.077 0.075 0.076 — — 0.076 48.6 145.9 — — —
Littelfuse Class L time delay 800 0.067 0.071 0.063 — — 0.067 42.9 128.6 — — —
Bussman Class L fast acting 1200 0.048 0.051 0.048 0.056 0.051 0.051 73.2 219.5 — — —
Bussman Class L fast acting 1600 0.036 0.036 0.037 — — 0.036 93.0 279.0 — — —
Littelfuse Class L time delay 1600 0.034 0.034 0.035 0.035 0.035 0.035 88.6 265.7 — — —
Littelfuse Class L time delay 2000 0.024 0.027 0.026 — — 0.026 102.7 308.0 — — —
Bussman Class L fast acting 2500 0.016 — — — — 0.016 100.0 300.0 — — —
Bussman Class L fast acting 3000 0.015 0.014 0.015 — — 0.015 132.0 396.0 — — —
Littelfuse Class L 3000 0.018 0.017 — — — 0.018 157.5 472.5 — — —
Bussman Class L time delay 4000 0.012 0.012 0.012 — — 0.012 192.0 576.0 — — —
Littelfuse Class L 4000 0.013 0.014 0.013 — — 0.013 214.9 644.8 — — —
Ferraz Class L time delay 5000 0.009 0.009 0.009 — — 0.009 225.0 675.0 — — —
11
White Paper AP08324002EEffective July 2010
EATON CORPORATION www.eaton.com
Evaluating Efficiency and Losses of Various Circuit Protective Devices
Resistivity Temperature Coefficient Compensation
Why were the high-current tests of the fuses showing higher losses than the calculated losses based on the low-current resis-tance measurements? The electrical resistance of the metals used in fuses, switches and circuit breakers increases with higher tem-peraturesg. If we only measure the resistance at a lower “room” temperature, we fail to accurately model the actual losses at operational temperatures.
“Cold” means the amount of current flowing during the test was too low to raise the temperature of the fuse above ambient temperature. “Hot” means that the current flowing did raise the temperature of the fuse element above ambient. In the special case of fuses rated 500A or less (where we could supply full-rated cur-rent), the temperature rise would be equivalent to that observed in a working system.
The internal resistance to electrical current for metals such as silver, copper and aluminum increases as the temperature of that metal increases. The temperature coefficient varies by type of metal, but for the metals common to electrical circuits, the value is approxi-mately 0.4% increase for each degree Celsius.
Table 21. Temperature coefficients for common metals used to carry electrical current.
Metal %R increase/ºC
Silver 0.38%
Copper 0.39%
Aluminum 0.39%
Using an average of 0.39%, we can derive an equation that predicts the percent difference in losses between “cold” (low-current) measurements and “hot” (load-current) measurements.
Equation 14: D = Trise * 0.0039
Since fuses are regulated under UL 198 and since UL 198 allows fuses to operate at temperatures above ambient, could this explain the difference between the measured and derived values shown in Table 20?
Table 22. UL 198 maximum temperature limits for casing, ferrules and blades for Class R fuses when operating at 110% of rated current.
Maximum Acceptable Temperature Rises
Fuse Rating Amperes
Temperature Rise Above the Temperature of the Ambient Air
Casing Ferrules Blades
ºC ºF ºC ºF ºC ºF
0–30 50 90 50 90 — —
31–60 50 90 50 90 — —
61–100 50 90 — — 50 90
101–200 50 90 — — 60 108
201–400 50 90 — — 65 117
401–600 50 90 — — 75 135
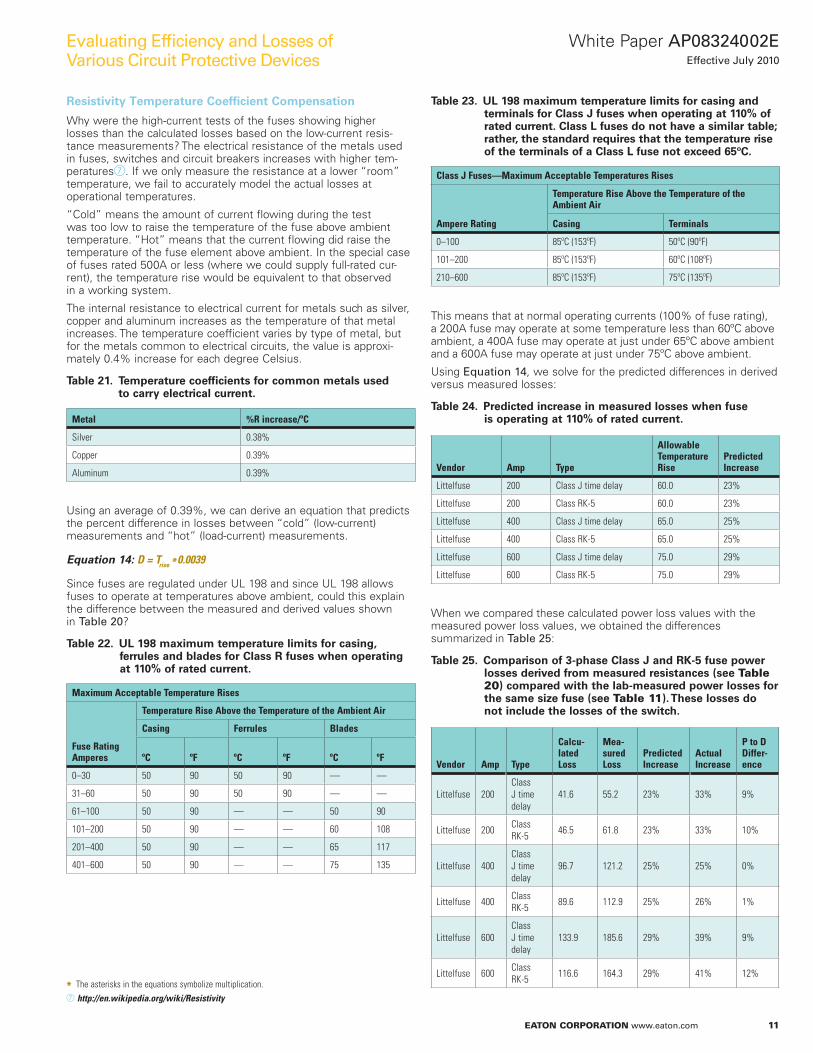
Table 23. UL 198 maximum temperature limits for casing and terminals for Class J fuses when operating at 110% of rated current. Class L fuses do not have a similar table; rather, the standard requires that the temperature rise of the terminals of a Class L fuse not exceed 65ºC.
Class J Fuses—Maximum Acceptable Temperatures Rises
Ampere Rating
Temperature Rise Above the Temperature of the Ambient Air
Casing Terminals
0–100 85ºC (153ºF) 50ºC (90ºF)
101–200 85ºC (153ºF) 60ºC (108ºF)
210–600 85ºC (153ºF) 75ºC (135ºF)
This means that at normal operating currents (100% of fuse rating), a 200A fuse may operate at some temperature less than 60ºC above ambient, a 400A fuse may operate at just under 65ºC above ambient and a 600A fuse may operate at just under 75ºC above ambient.
Using Equation 14, we solve for the predicted differences in derived versus measured losses:
Table 24. Predicted increase in measured losses when fuse is operating at 110% of rated current.
Vendor Amp Type
Allowable Temperature Rise
Predicted Increase
Littelfuse 200 Class J time delay 60.0 23%
Littelfuse 200 Class RK-5 60.0 23%
Littelfuse 400 Class J time delay 65.0 25%
Littelfuse 400 Class RK-5 65.0 25%
Littelfuse 600 Class J time delay 75.0 29%
Littelfuse 600 Class RK-5 75.0 29%
When we compared these calculated power loss values with the measured power loss values, we obtained the differences summarized in Table 25:
Table 25. Comparison of 3-phase Class J and RK-5 fuse power losses derived from measured resistances (see Table 20) compared with the lab-measured power losses for the same size fuse (see Table 11). These losses do not include the losses of the switch.
Vendor Amp Type
Calcu-lated Loss
Mea-sured Loss
Predicted Increase
Actual Increase
P to D Differ-ence
Littelfuse 200Class J time delay
41.6 55.2 23% 33% 9%
Littelfuse 200 Class RK-5 46.5 61.8 23% 33% 10%
Littelfuse 400Class J time delay
96.7 121.2 25% 25% 0%
Littelfuse 400 Class RK-5 89.6 112.9 25% 26% 1%
Littelfuse 600Class J time delay
133.9 185.6 29% 39% 9%
Littelfuse 600 Class RK-5 116.6 164.3 29% 41% 12%
ghttp://en.wikipedia.org/wiki/Resistivity * The asterisks in the equations symbolize multiplication.
12
White Paper AP08324002EEffective July 2010
EATON CORPORATION www.eaton.com
Evaluating Efficiency and Losses of Various Circuit Protective Devices
Several conclusions can be drawn from the results shown in Table 25:• Since the UL 198 standard publishes a maximum temperature
rise at 110% of rated current, and since our test current was always 100% or less, the predicted temperature rise will be less than shown in Table 25. Having said that:• 400A predicted and measured values agree very closely
when we assume the increase is solely due to resistivity increases because of thermal coefficient differences. This would imply that there are additional loss mechanisms other than temperature differences that account for the increase in actual measured resistance.
• 200A fuse resistances and power losses were measured to be higher than predicted by thermal coefficient differences alone. This implies that there are even more mechanisms at work that are raising the measured resistance above the predicted resistance.
• 600A fuse resistance and power losses were higher still than would be predicted by differences in thermal coefficient differ-ences alone. Recall that our test provided a maximum of 500A, meaning that the 600A fuse should not be operating anywhere near its allowable 75ºC rise. Therefore, the predicted increase should not be as high as shown in Table 24 and Table 25. There are substantial additional mechanisms at work increasing the 600A fuse above the predicted values.
As we conclude from this discussion, additional (unknown) mecha-nisms are causing the measured resistances to be higher than the values predicted from analyzing low-current resistance. The most likely explanation is that we have two different samples of fuses. On one sample we performed low-current testing, but not high-current testing. On the second sample we performed high-current testing but not low-current testing. It is possible that aging of fuse elements, manufacturing tolerance difference or simply unpublished differences in the same fuse brand, model and size, but purchased at different times could explain the difference.
Regardless of the differences, we have a dilemma as we look at the fuse ratings above 600A. We did not perform any high-current test-ing on those size fuses. If the 600A fuse losses were higher than the predicted values, how will we estimate the losses for the larger fuses? Also, since Class J and RK-5 fuses stop at 600A, we will be switching to a completely different type—the Class L. Whatever the effects that were causing the lower ampere fuse losses at operating temperatures to exceed the values predicted by changes in thermal coefficient, we won’t be able to estimate those increases for the Class L without stepping into the realm of speculation.
Therefore, without hard data, our decision was to remain as conservative as possible by using low-current resistances offset by an estimated 50ºC temperature rise based on a temperature below the maximum allowed by UL 198.
Since the low-current resistance measurements were taken at approximately 20ºC, at 50ºC, the resistivity losses would need to be calculated at 70ºC. Using Equation 14 we scaled the resistivity based on this higher temperature, then calculated the losses at this higher resistance using Equation 1. The results are shown in Table 26 below:
Table 26. Class L fuse resistive 3-phase power loss derived from 3rd-party measurement of resistance (see Table 20). Power loss values derived both at the temperature at which the fuse resistance was measured, plus a temperature 50ºC higher, as permitted by UL 198 standards. The higher temperature results in higher resistive losses, but as we saw with high-current test-ing of Class J and RK-5 fuses, there are additional losses that cannot be accounted for from thermal coefficient effects. However, as discussed in the report, since we did not perform high-current testing, we are not assuming those additional losses are seen on Class L. Instead we chose to only describe losses that can be derived from direct measurement of physical properties. 5000A data is extrapolated from 800A–4000A data. The linear equation describing that data is (y = 0.1598x – 0.372, where y = power loss and x = amp rating of fuse).
Amperes Power Loss at 20ºC Power Loss at 70ºC
800 129 154
1600 266 318
2000 308 368
3000 473 565
4000 645 771
5000 799 954
At this point we have measured, or derived from models, for the following protective devices:• Class J resistive power losses: 20A–600A• Class RK-5 resistive power losses: 20A–600A• Class L resistive power losses: 800A–5000A• Fusible switch (less fuses): 20A–5000A• Molded case circuit breakers, Eaton Series C: 20A–2500A• Molded case circuit breakers, Eaton Series G: 20A–2500Ah
• Air Circuit Breaker, Eaton Magnum DS, fixed mount: 800A–5000A• Air Circuit Breaker, Eaton Magnum DS, draw-out: 800A–5000A
Combining all resistive power loss values, we created a consolidated data table of J, RK-5, L and circuit breaker resistive power losses from 20A–5000A.
hAt the time of this report, Series G circuit breakers were available only up to 600A. Values shown above 600A are Series C breakers.
13
White Paper AP08324002EEffective July 2010
EATON CORPORATION www.eaton.com
Evaluating Efficiency and Losses of Various Circuit Protective Devices
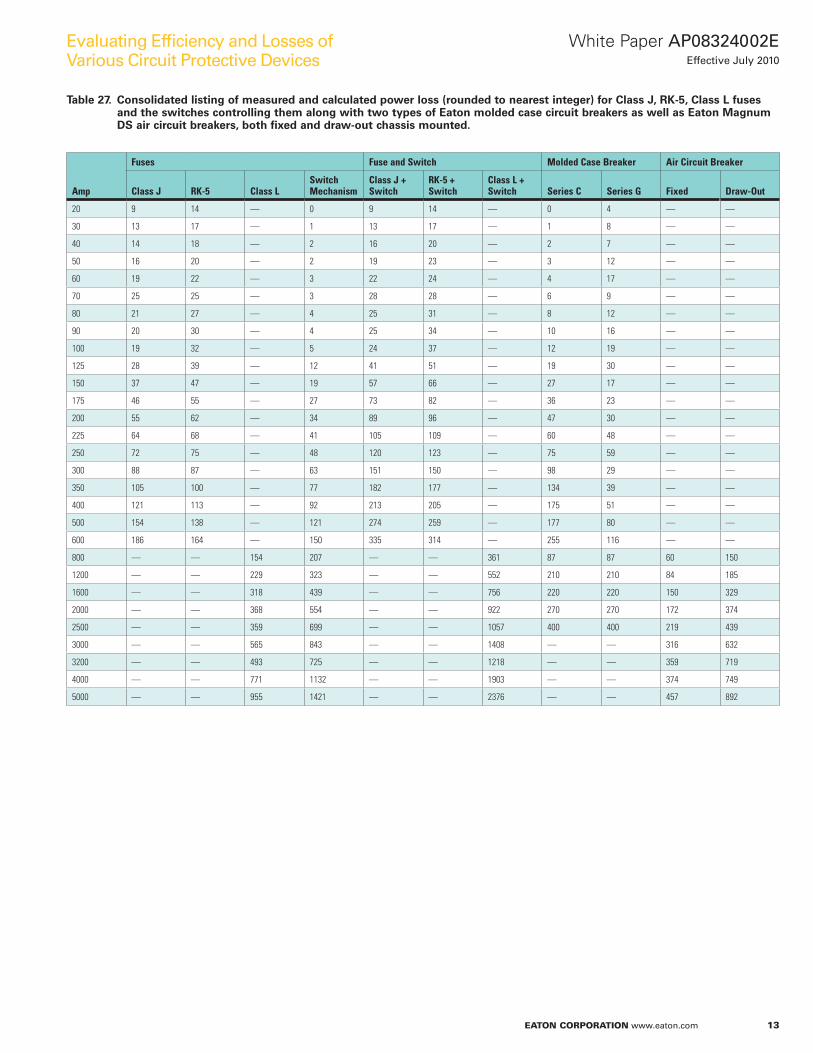
Table 27. Consolidated listing of measured and calculated power loss (rounded to nearest integer) for Class J, RK-5, Class L fuses and the switches controlling them along with two types of Eaton molded case circuit breakers as well as Eaton Magnum DS air circuit breakers, both fixed and draw-out chassis mounted.
Amp
Fuses Fuse and Switch Molded Case Breaker Air Circuit Breaker
Class J RK-5 Class LSwitch Mechanism
Class J + Switch
RK-5 + Switch
Class L + Switch Series C Series G Fixed Draw-Out
20 9 14 — 0 9 14 — 0 4 — —
30 13 17 — 1 13 17 — 1 8 — —
40 14 18 — 2 16 20 — 2 7 — —
50 16 20 — 2 19 23 — 3 12 — —
60 19 22 — 3 22 24 — 4 17 — —
70 25 25 — 3 28 28 — 6 9 — —
80 21 27 — 4 25 31 — 8 12 — —
90 20 30 — 4 25 34 — 10 16 — —
100 19 32 — 5 24 37 — 12 19 — —
125 28 39 — 12 41 51 — 19 30 — —
150 37 47 — 19 57 66 — 27 17 — —
175 46 55 — 27 73 82 — 36 23 — —
200 55 62 — 34 89 96 — 47 30 — —
225 64 68 — 41 105 109 — 60 48 — —
250 72 75 — 48 120 123 — 75 59 — —
300 88 87 — 63 151 150 — 98 29 — —
350 105 100 — 77 182 177 — 134 39 — —
400 121 113 — 92 213 205 — 175 51 — —
500 154 138 — 121 274 259 — 177 80 — —
600 186 164 — 150 335 314 — 255 116 — —
800 — — 154 207 — — 361 87 87 60 150
1200 — — 229 323 — — 552 210 210 84 185
1600 — — 318 439 — — 756 220 220 150 329
2000 — — 368 554 — — 922 270 270 172 374
2500 — — 359 699 — — 1057 400 400 219 439
3000 — — 565 843 — — 1408 — — 316 632
3200 — — 493 725 — — 1218 — — 359 719
4000 — — 771 1132 — — 1903 — — 374 749
5000 — — 955 1421 — — 2376 — — 457 892
14
White Paper AP08324002EEffective July 2010
EATON CORPORATION www.eaton.com
Evaluating Efficiency and Losses of Various Circuit Protective Devices
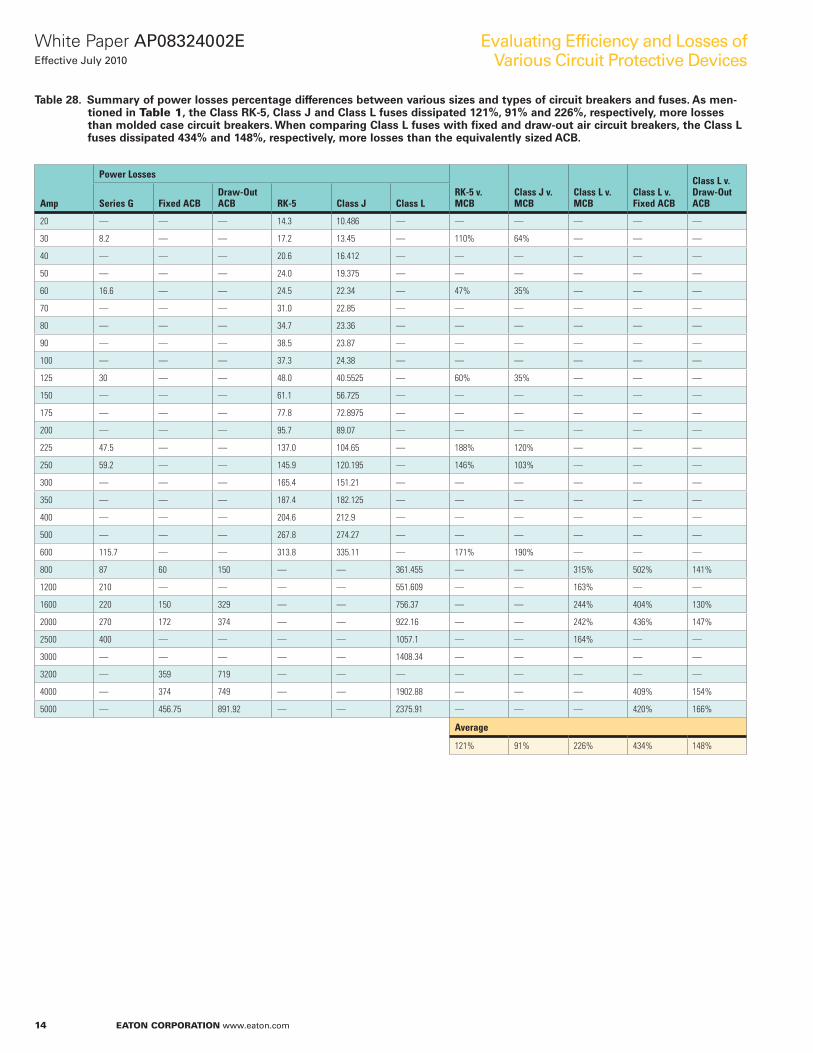
Table 28. Summary of power losses percentage differences between various sizes and types of circuit breakers and fuses. As men-tioned in Table 1, the Class RK-5, Class J and Class L fuses dissipated 121%, 91% and 226%, respectively, more losses than molded case circuit breakers. When comparing Class L fuses with fixed and draw-out air circuit breakers, the Class L fuses dissipated 434% and 148%, respectively, more losses than the equivalently sized ACB.
Amp
Power Losses
RK-5 v. MCB
Class J v. MCB
Class L v. MCB
Class L v. Fixed ACB
Class L v. Draw-Out ACBSeries G Fixed ACB
Draw-Out ACB RK-5 Class J Class L
20 — — — 14.3 10.486 — — — — — —
30 8.2 — — 17.2 13.45 — 110% 64% — — —
40 — — — 20.6 16.412 — — — — — —
50 — — — 24.0 19.375 — — — — — —
60 16.6 — — 24.5 22.34 — 47% 35% — — —
70 — — — 31.0 22.85 — — — — — —
80 — — — 34.7 23.36 — — — — — —
90 — — — 38.5 23.87 — — — — — —
100 — — — 37.3 24.38 — — — — — —
125 30 — — 48.0 40.5525 — 60% 35% — — —
150 — — — 61.1 56.725 — — — — — —
175 — — — 77.8 72.8975 — — — — — —
200 — — — 95.7 89.07 — — — — — —
225 47.5 — — 137.0 104.65 — 188% 120% — — —
250 59.2 — — 145.9 120.195 — 146% 103% — — —
300 — — — 165.4 151.21 — — — — — —
350 — — — 187.4 182.125 — — — — — —
400 — — — 204.6 212.9 — — — — — —
500 — — — 267.8 274.27 — — — — — —
600 115.7 — — 313.8 335.11 — 171% 190% — — —
800 87 60 150 — — 361.455 — — 315% 502% 141%
1200 210 — — — — 551.609 — — 163% — —
1600 220 150 329 — — 756.37 — — 244% 404% 130%
2000 270 172 374 — — 922.16 — — 242% 436% 147%
2500 400 — — — — 1057.1 — — 164% — —
3000 — — — — — 1408.34 — — — — —
3200 — 359 719 — — — — — — — —
4000 — 374 749 — — 1902.88 — — — 409% 154%
5000 — 456.75 891.92 — — 2375.91 — — — 420% 166%
Average
121% 91% 226% 434% 148%
15
White Paper AP08324002EEffective July 2010
EATON CORPORATION www.eaton.com
Evaluating Efficiency and Losses of Various Circuit Protective Devices
Notes: ___________________________________________________
________________________________________________________
________________________________________________________
________________________________________________________
________________________________________________________
________________________________________________________
________________________________________________________
________________________________________________________
________________________________________________________
________________________________________________________
________________________________________________________
________________________________________________________
________________________________________________________
________________________________________________________
________________________________________________________
________________________________________________________
________________________________________________________
________________________________________________________
________________________________________________________
________________________________________________________
________________________________________________________
________________________________________________________
________________________________________________________
________________________________________________________
________________________________________________________
________________________________________________________
________________________________________________________
________________________________________________________
________________________________________________________
________________________________________________________
________________________________________________________
________________________________________________________
________________________________________________________
________________________________________________________
________________________________________________________
________________________________________________________
________________________________________________________
________________________________________________________
________________________________________________________
________________________________________________________
________________________________________________________
________________________________________________________
________________________________________________________
________________________________________________________
________________________________________________________
________________________________________________________
________________________________________________________
________________________________________________________
________________________________________________________
________________________________________________________
________________________________________________________
________________________________________________________
________________________________________________________
________________________________________________________
________________________________________________________
________________________________________________________
________________________________________________________
________________________________________________________
________________________________________________________
________________________________________________________
________________________________________________________
________________________________________________________
________________________________________________________
________________________________________________________
________________________________________________________
________________________________________________________
________________________________________________________
________________________________________________________
________________________________________________________
________________________________________________________
________________________________________________________
________________________________________________________
________________________________________________________
________________________________________________________
________________________________________________________
________________________________________________________
________________________________________________________
________________________________________________________
________________________________________________________
________________________________________________________
________________________________________________________
________________________________________________________
________________________________________________________
________________________________________________________
________________________________________________________
________________________________________________________
________________________________________________________
________________________________________________________
________________________________________________________
________________________________________________________

Eaton CorporationElectrical Sector1111 Superior Ave.Cleveland, OH 44114United States877-ETN-CARE (877-386-2273)Eaton.com
© 2010 Eaton CorporationAll Rights ReservedPrinted in USAPublication No. AP08324002E / BC-20July 2010
PowerChain Management is a registered trademark of Eaton Corporation.
All other trademarks are property of their respective owners.