white paper: analysis of truck driver age … of truck driver age... · white paper: analysis of...
TRANSCRIPT
December 2014
Jeffrey Short Senior Research Associate
American Transportation Research Institute Atlanta, GA
WHITE PAPER: Analysis of Truck Driver Age Demographics Across Two Decades

ATRI BOARD OF DIRECTORS
Ms. Judy McReynolds Chairman of the ATRI Board President & CEO Arkansas Best Corporation Fort Smith, AR Mr. Michael S. Card President Combined Transport, Inc. Central Point, OR Mr. Rich Freeland President & COO Cummins Inc. Columbus, IN Mr. Hugh H. Fugleberg President & COO Great West Casualty Company South Sioux City, NE Mr. Jack Holmes President UPS Freight Richmond, VA Mr. Dave Huneryager President & CEO Tennessee Trucking Association Nashville, TN Mr. Chris Lofgren President & CEO Schneider National, Inc. Green Bay, WI Mr. William J. Logue President & CEO FedEx Freight Memphis, TN
Mr. Jeffrey J. McCaig President & CEO Trimac Transportation, Inc. Houston, TX Mr. Gregory L. Owen Head Coach & CEO Ability/ Tri-Modal Transportation Services Carson, CA Ms. Annette Sandberg President & CEO Transsafe Consulting, LLC Davenport, WA Mr. Douglas W. Stotlar President & CEO Con-way Inc. Ann Arbor, MI Mr. Steve Williams Chairman & CEO Maverick USA, Inc. Little Rock, AR Ms. Rebecca M. Brewster President & COO American Transportation Research Institute Atlanta, GA Honorable Bill Graves President & CEO American Trucking Associations Arlington, VA

ATRI RESEARCH ADVISORY COMMITTEE
Mr. Steve L. Niswander RAC Chairman VP, Safety Policy & Regulatory Relations Groendyke Transport, Inc.
Mr. Duane Acklie Chairman Crete Carrier Corporation
Mr. Kirk Altrichter VP – Maintenance Crete Carrier Corporation
Ms. Susan Alt Senior VP, Public Affairs Volvo Trucks North America
Mr. Andrew Boyle Executive Vice President Boyle Transportation
Mr. Randy Boyles Senior Vice President, Tailored Solutions PeopleNet
Mr. Steve Bryan Chief Executive Officer Vigillo, LLC
Ms. Cheryl Bynum Manager, SmartWay Transport Partnership U.S. Environmental Protection Agency
Mr. Michael Conyngham Director of Research International Brotherhood of Teamsters
Mr. Tom DiSalvi Director of Loss Prevention Schneider National, Inc.
Mr. Chad England Chief Executive Officer C.R. England
Dr. Patti Gillette Vice President Colorado Motor Carriers Association Mr. Matt Hart Executive Director Illinois Trucking Association
Ms. Kendra Hems President New York State Motor Truck Association
Mr. Sanford Hodes Senior Vice President and Deputy General Counsel Ryder System, Inc.
Ms. Barbara Ivanov Director, Freight Systems Washington State Department of Transportation
Mr. Steve A. Keppler Executive Director Commercial Vehicle Safety Alliance
Mr. Keith A. Klingenberg, CIC Principal and Managing Director TrueNorth Companies Mr. Alan Korn Director – Vehicle Control Systems Meritor WABCO
Mr. Michael Kray Principal Planner Atlanta Regional Commission
Mr. Chris McLoughlin Cargo Risk Manager C.H. Robinson Ms. Jennifer Morrison Vehicle Factors Engineer National Transportation Safety Board
Mr. Robert D. Moseley, Jr. Transportation Attorney Smith Moore Leatherwood Mr. Scott Mugno Vice President of Safety FedEx Ground
Mr. Dean Newell Vice President, Safety Maverick USA, Inc.
Mr. Richard Plewacki Partner Benesch Friedlander Coplan & Arnoff
Mr. Brett A. Sant VP, Safety and Risk Management Knight Transportation, Inc.
Mr. Webb A. Shaw Vice President – Editorial Resources J.J. Keller & Associates
Dr. Frank Southworth Principal Research Scientist Georgia Tech School of Civil and Environmental Engineering Mr. Keith Tuttle Founder Motor Carrier Service Inc.
Mr. Tom Weakley Director of Operations Owner-Operator Independent Drivers Association Foundation
Mr. Greer Woodruff Senior Vice President of Corporate Safety and Security J.B. Hunt Transport Services, Inc
Analysis of Truck Driver Age Demographics Across Two Decades – 2014 1
ACRONYMS
ATRI American Transportation Research Institute
ATA American Trucking Associations
BLS Bureau of Labor Statistics
CES Current Employment Statistics
CPS Current Population Survey
CDL Commercial Driver’s License
DOE Department of Education
FMCSA Federal Motor Carrier Safety Administration
NAICS North American Industry Classification System
OES Occupational Employment Statistics
PSP Pre-employment Screening Program
RAC Research Advisory Committee
Analysis of Truck Driver Age Demographics Across Two Decades – 2014 2
INTRODUCTION U.S. Labor Force and the Trucking Industry Driver Shortage While the U.S. labor market has nearly recovered from the Great Recession, employment gaps still remain. Of the 155.9 million people in the U.S. civilian labor force, 146.9 million are employed and 8.9 million are unemployed.1 In addition to labor force participants, there are 92.5 million additional persons not in the labor force, a figure that has grown by nearly 2 million people over the past year.2 The trucking industry is a large and important component of the U.S. labor force; there are approximately 7 million persons holding trucking-related jobs. Of those, 3.2 million are employed as truck drivers.3 Since 2010, a benchmark year for the end of the Great Recession, there has been steadily increasing demand for both freight services and the requisite truck drivers needed to move goods throughout the country. While labor statistics indicate that unemployed persons still number in the millions, the American Trucking Associations currently estimates the truck driver shortage to be 30,000 to 35,000 — with a potential shortage of 240,000 drivers by 2022.4 Furthermore, ATRI’s annual “Top Industry Issues” research has been monitoring the rise of the “Driver Shortage” issue for almost 10 years, and in 2014 the issue rose to a 2nd place ranking. Underlying Factors in the Truck Driver Shortage Several factors have helped create a significant driver shortage. Among them are:
competition within the industry;
driver qualifications/requirements; and
workforce demographics. Competition within the Industry Nearly four decades ago the trucking industry was composed of approximately 20,000 companies. Since that time a dramatic increase in the ranks of for-hire motor carriers can be traced to the industry deregulation of the 1980s, when barriers to entry decreased considerably. Today, with more than 500,000 individual companies, the trucking industry is extremely competitive.
1 September 2014 noninstitutional labor force data. U.S. Department of Labor. Bureau of Labor Statistics.
Economic News Release, Table A-1. Employment status of the civilian population by sex and age. Available online at: http://www.bls.gov/news.release/empsit.t01.htm accessed 10/20/2014. 2 Ibid. This is the civilian non-institutional population (persons 16 years of age or older residing in the
U.S. and not active military or an inmate of a mental/penal institution) that is not participating in the labor force. 3 American Trucking Associations. American Trucking Trends 2014. Statistics are based on 2012 data.
4Sources: American Trucking Associations (ATA) October 22, 2013 press release available online:
http://www.truckline.com/article.aspx?uid=0c98b069-cb00-457d-84b4-75a3c0ebaf3b and July 9, 2014 press release available online at: http://www.truckline.com/article.aspx?uid=0c98b069-cb00-457d-84b4-75a3c0ebaf3b
Analysis of Truck Driver Age Demographics Across Two Decades – 2014 3
The heightened competition resulting from a large pool of market participants has driven the price of freight services downward, along with profit margins. Even in a strong economy, average operating margins fell from 3.8 percent to 3.4 percent over four years (2010 – 2013) according to recent data from the American Trucking Associations.5 With downward pressure on prices often there is not adequate capital or liquidity for individual companies to substantially increase wages and still remain profitable. As a result, while driver wages have increased nominally since the Great Recession, significantly reducing the driver supply/demand gap with increased pay alone may not be realistic. Motor carriers also have difficulty retaining drivers – and often lose drivers to other trucking companies. To attract employees from one company to another, a carrier may offer better benefits, pay increases or signing bonuses. This competition for drivers adds to “churn” within the industry. While many carriers maintain a stable number of long-term veteran drivers, the annual driver turnover percentage for almost all motor carriers is in the high double-digits. In a strong economy, it is commonplace for annual driver turnover to exceed 100 percent for large truckload fleets – recent rates across sectors are displayed in Table 1.
Table 1. Quarterly Annualized Turnover Rates by Sector6
Sector Turnover Rate Q2 2014
Truckload – Large 96%
Truckload – Small 94%
Less-than-truckload 11%
Qualifications State and federal laws dictate the qualifications needed to become a commercial truck driver. Common qualifications include a commercial driver’s license (CDL), a medical card, multiple lines of insurance, port access cards, transportation security credentials and a variety of “endorsements” such as the hazmat endorsement. The training, costs and standards required to obtain these and additional certifications are not inconsequential to an individual that is considering a career as a truck driver. The CDL itself requires multiple weeks of training and testing, and the tuition can run as high as $6,500.7 A person may be disqualified from holding a CDL or a CDL holder may lose his or her driving privileges as a result of certain convictions, traffic citations or medical conditions. In terms of new driver scrutiny, motor carriers face many internal and external pressures. Driving history, drug tests, insurance costs and government monitoring all come into play when a carrier considers hiring an individual driver. Safety scoring programs such as the Federal Motor Carrier Safety Administration’s (FMCSA) Compliance, Safety, Accountability (CSA) and the Pre-employment Screening Program (PSP) likely discourage the hiring or retaining of drivers with poor records, particularly since doing so creates considerable liability exposure to the motor carrier. These factors, individually and collectively, act as barriers to entry for potential truck drivers.
5 American Trucking Associations Statistics & Economics Group, 2014.
6 American Trucking Associations Statistics & Economics Group, Quarterly Employment Report, 2014.
7 Transport Topics. Congress’ Drive to Slash Federal Spending Could Eliminate Grants for Driver
Training. March 07, 2011.
Analysis of Truck Driver Age Demographics Across Two Decades – 2014 4
Demographics A variety of reports and anecdotal information confirm that the average age of truck drivers is older than the average age in many other sectors of the U.S. workforce. There is also evidence that post-Baby Boomer generations, particularly those now in their twenties and early thirties (i.e. “Millennials”), are not entering the industry in sufficient numbers. Thus, as older generations (e.g. the Baby Boomers) enter retirement, an even larger driver shortage may begin to emerge. Perhaps the single biggest obstacle to attracting younger drivers to the industry is the federal requirement that interstate CDL holders be 21 or older. The resulting three-year post-high school gap precludes many from considering a career in truck driving. There are additional institutional limitations on how old you must be to participate in certain sectors of the industry as well. Examples include hazmat or long-haul trucking – where 25 years of age is a common insurance-based expectation. The Connection between Demographics and the Truck Driver Shortage The focus of this report is the impact of the latter issue – demographics – on the truck driver shortage. The American Transportation Research Institute’s (ATRI) Research Advisory Committee (RAC) identified an analysis of driver age demographics as a leading research priority in 2013.8 Specifically, the research proposal recommended by the RAC would analyze driver age demographics across a 20-year timeframe in an effort to draw connections between the driver shortage and an aging driver population. Ultimately, the findings of this research illustrate the industry’s dependence on a single employee cohort that will enter retirement age in less than a decade. Intensifying this problem is a dearth of replacement drivers. As the data will show, the younger industry cohorts (i.e. age groups) have been steadily decreasing in size. Ultimately, by highlighting this issue it is hoped that trucking companies and other industry stakeholders will gain a better understanding of how critical the shortage may become as a result of demographics.
8 ATRI’s RAC is comprised of industry stakeholders representing motor carriers, trucking industry
suppliers, labor and driver groups, law enforcement, federal government and academia. The RAC is charged with annually recommending a research agenda for the Institute.
Analysis of Truck Driver Age Demographics Across Two Decades – 2014 5
LITERATURE REVIEW
There is a limited body of research focused on the role of demographics in truck driver shortages. Work published in 1997 by the ATA Foundation suggests that a driver shortage had been persistent since 1980, concurrent with trucking industry deregulation and its associated impacts on the industry.9 The study lists workforce demographics as one of four key factors influencing the shortage; however, it identified driver churn and problems with driver retention as the most pressing issues rather than demographic issues.10 A 1998 report published in the Monthly Labor Review journal documented significant growth – 586,000 new trucking employees – between 1980 and 1994.11 The author cites increased demand for drivers, along with lower wages, as the cause of the driver shortage since deregulation. Focusing on changes that occurred as a result of deregulation, the author concludes that:
“Competition has resulted in increasing capital intensity in the industry, as firms strive to reduce average variable costs per load. … Increased competition also has led companies to change the character of compensation plans for their workers, replacing those based on time with plans based on output. … Increasing workloads and less attractive pay have led to high labor turnover and persistent driver shortages.”
Increased carrier competition and demand for truck drivers are both cited as issues related to the driver shortage in the late 1990s. Both of these issues stem from deregulation (in the 1980s) and do not appear to be related to demographics. Research published in 2003 found that growth in the industry added to the driver shortage, which in turn was exacerbated by high turnover rates.12 The authors state:
“… between 1992 and 1999, employment within the trucking industry grew much faster (31.10 percent) than the US total employment growth of 18.75 percent. Despite faster job growth, the trucking industry has experienced unusually high turnover rates. In 1992, for-hire truckload carriers often had 100 to 200 percent annual driver turnover rates, whereas the median employee turnover in the USA was 8.4 percent.”
A more recent 2005 report from the American Trucking Associations (ATA) analyzed the future long-haul heavy-duty driver needs of the trucking industry, comparing those figures with slowing growth in the U.S. workforce.13 This pre-recession report found that “a major problem for the trucking industry and the U.S. economy as a whole is that the annual rate of growth of the
9 ATA Foundation. Empty Seats and Musical Chairs: Critical Success Factors in Truck Driver Retention.
Prepared by The Gallup Organization, October 1997. 10
“Driver Churn” occurs when drivers leave their current carrier for another carrier that they may perceive as having a better working environment, such as an improved work-life balance or an increase in compensation. In instances where churn is present, carriers may have very high turnover rates and must put significant effort into finding and hiring new drivers. 11
Engel, Cynthia. Competition Drives the Trucking Industry. Monthly Labor Review, April 1998. 12
Min, Hokey; A. Emam. Developing the Profiles of Truck Drivers for their Successful Recruitment and Retention. International Journal of Physical Distribution and Logistics Management, 2003. 13
American Trucking Associations (ATA). The U.S. Truck Driver Shortage: Analysis and Forecasts. Prepared by Global Insight, Inc. May 2005.

Analysis of Truck Driver Age Demographics Across Two Decades – 2014 6
overall labor force will slow sharply, from 1.4% currently to only 0.5% by 2012.” The issue of decreased growth in the national workforce therefore would create issues for the trucking industry, which had a dramatically increasing demand for employees. The ATA report also found that new industry employees were typically in their late 20s to their early 30s:
“The labor market analysis presented in this report shows graphically how the share of truck drivers in the labor force increases sharply with age from the early 20s through the early 30s. The trucking industry gets the long-haul drivers it needs by attracting workers in their late 20s and early 30s from other occupations where they have already reached their earnings potential.”
As will be documented in subsequent chapters, nearly 10 years later the trucking industry still has not been attracting or hiring sufficient numbers of employees from this important age cohort. In summary, the literature suggests that the 1980s deregulation was a critical factor in the development of a truck driver shortage. In the years following, a dramatic increase in the number of new trucking companies generated huge new demand for truck drivers in a relatively short time period. This competition for both shipper customers and truck drivers further depressed carrier operating margins – resulting in unattractive compensation models that discouraged new employees from filling that gap. Today it could be further argued that the barriers to entry for drivers, which are embodied in a litany of applicable rules and regulations, are actually more substantial than those faced by motor carriers. As a result, carriers are prevalent, veteran drivers are scarce and highly sought, and new entrant drivers are reluctant to join the industry.
Analysis of Truck Driver Age Demographics Across Two Decades – 2014 7
DATASET IDENTIFICATION To document changes in trucking industry demographics, the research team identified U.S. Census data as the most appropriate data source for this research. In particular Bureau of Labor Statistics (BLS) findings derived from U.S. Census’ Current Population Survey (CPS) provided the primary source of data. While datasets such as the CPS and its derivatives do not report on very specific groups (e.g. the number of long-haul truck drivers by age), these datasets and statistics were found to be relevant, readily available and widely utilized by researchers. The ATRI research team was specifically interested in labor force characteristic datasets that contain employee age groupings. An initial review determined that two datasets produced by BLS using the CPS contained age data. The first contained an annual number for employed persons by age and by occupation, and the second contained an annual number for employed persons by age and by industry. The research team determined that the first dataset did not include the appropriate data in the occupation definitions, and was discarded. For example, the occupations that encompass truck drivers had numerous non-trucking categories.14 The review of the second dataset found more promising information on employed persons by age and industry. Within this dataset, the group of employed persons within the “Truck Transportation” NAICS15 industry category was found to be the most relevant:
Truck Transportation: NAICS 484: Industries in the Truck Transportation subsector provide over-the-road transportation of cargo using motor vehicles, such as trucks and tractor trailers. The subsector is subdivided into general freight trucking and specialized freight trucking. This distinction reflects differences in equipment used, type of load carried, scheduling, terminal, and other networking services. General freight transportation establishments handle a wide variety of general commodities, generally palletized, and transported in a container or van trailer. Specialized freight transportation is the transportation of cargo that, because of size, weight, shape, or other inherent characteristics require specialized equipment for transportation.16
Within this NAICS code are the following additional subcategories:
General freight trucking o Local o Long Distance – Truckload o Long Distance – Less-than-truckload
Specialized Freight Trucking o Used household and office goods moving o Local o Long distance
14
As an example, the key truck driver occupation code, 53-3030 Driver/Sales Workers and Truck Drivers, included occupations far outside of trucking, such as pizza delivery. 15
North American Industry Classification System (NAICS) 16
Source: Bureau of Labor Statistics - http://www.bls.gov/iag/tgs/iag484.htm
Analysis of Truck Driver Age Demographics Across Two Decades – 2014 8
Census data that use the NAICS 484 code, however, are not an exact match for an analysis of drivers because non-driver occupations are present. To better understand the influence of non-driver occupations on the dataset, the research team took additional steps to estimate the percentage of heavy duty truck drivers within the Truck Transportation category. To do this, the research team accessed a dataset separate from the CPS called the Current Employment Statistics (CES), which classifies persons by occupation into the Truck Transportation industry classification code. Based on 2013 CES data, of the 1.379 million employees categorized in the Truck Transportation category, 804,680 (58.3%) were assigned to the “truck drivers, heavy and tractor-trailer” occupation category.17 This figure may be higher in reality as it was found that approximately 15 percent of the individuals in the industry category did not have an occupation assignment that was reported under the Occupational Employment Statistics (OES) largest occupations report.18 Other occupations in the Truck Transportation category include light truck or delivery services drivers, mechanics, laborers and office employees. Another issue identified during research development was a change in Census industry classifications from the 1990 classification to the 2002 classification. Prior to this change (which only impacted data from 1999 and earlier) much of the Truck Transportation category was within a category named “Trucking Service.” To address this, conversion factors provided by the Census Bureau were employed by the research team to convert the Trucking Service category from earlier years, thus adjusting the number to match the Truck Transportation classification. As discussed above, the Census data and BLS statistics do have limitations due to their broad scope. As a result, the categorization of workers is not always a perfect fit for trucking industry research. A data collection effort that directly accesses trucking industry records may be more effective in a future effort. This concept is further articulated in the conclusions section of this report.
17
As seen on 11/5/14 at http://www.bls.gov/iag/tgs/iag484.htm 18
As seen on 11/5/14 at http://www.bls.gov/oes/2013/may/ind_emp_chart/ind_emp_chart.htm#
Analysis of Truck Driver Age Demographics Across Two Decades – 2014 9
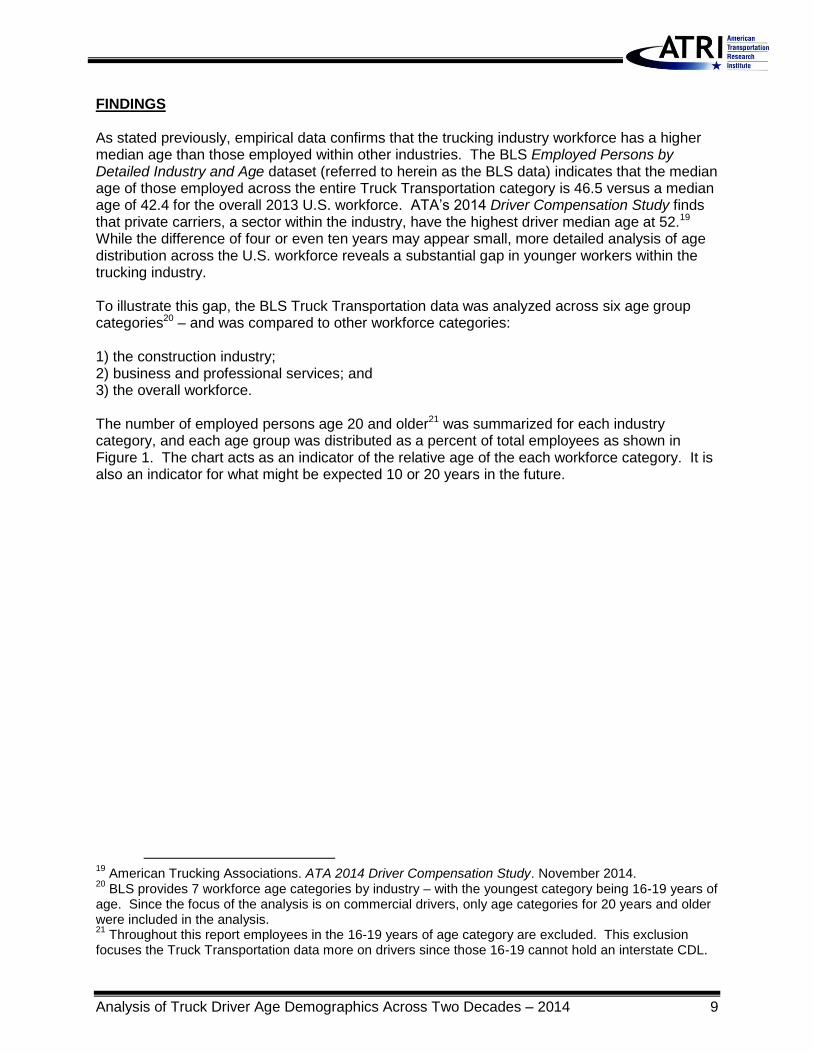
FINDINGS As stated previously, empirical data confirms that the trucking industry workforce has a higher median age than those employed within other industries. The BLS Employed Persons by Detailed Industry and Age dataset (referred to herein as the BLS data) indicates that the median age of those employed across the entire Truck Transportation category is 46.5 versus a median age of 42.4 for the overall 2013 U.S. workforce. ATA’s 2014 Driver Compensation Study finds that private carriers, a sector within the industry, have the highest driver median age at 52.19 While the difference of four or even ten years may appear small, more detailed analysis of age distribution across the U.S. workforce reveals a substantial gap in younger workers within the trucking industry. To illustrate this gap, the BLS Truck Transportation data was analyzed across six age group categories20 – and was compared to other workforce categories: 1) the construction industry; 2) business and professional services; and 3) the overall workforce. The number of employed persons age 20 and older21 was summarized for each industry category, and each age group was distributed as a percent of total employees as shown in Figure 1. The chart acts as an indicator of the relative age of the each workforce category. It is also an indicator for what might be expected 10 or 20 years in the future.
19
American Trucking Associations. ATA 2014 Driver Compensation Study. November 2014. 20
BLS provides 7 workforce age categories by industry – with the youngest category being 16-19 years of age. Since the focus of the analysis is on commercial drivers, only age categories for 20 years and older were included in the analysis. 21
Throughout this report employees in the 16-19 years of age category are excluded. This exclusion focuses the Truck Transportation data more on drivers since those 16-19 cannot hold an interstate CDL.
Analysis of Truck Driver Age Demographics Across Two Decades – 2014 10
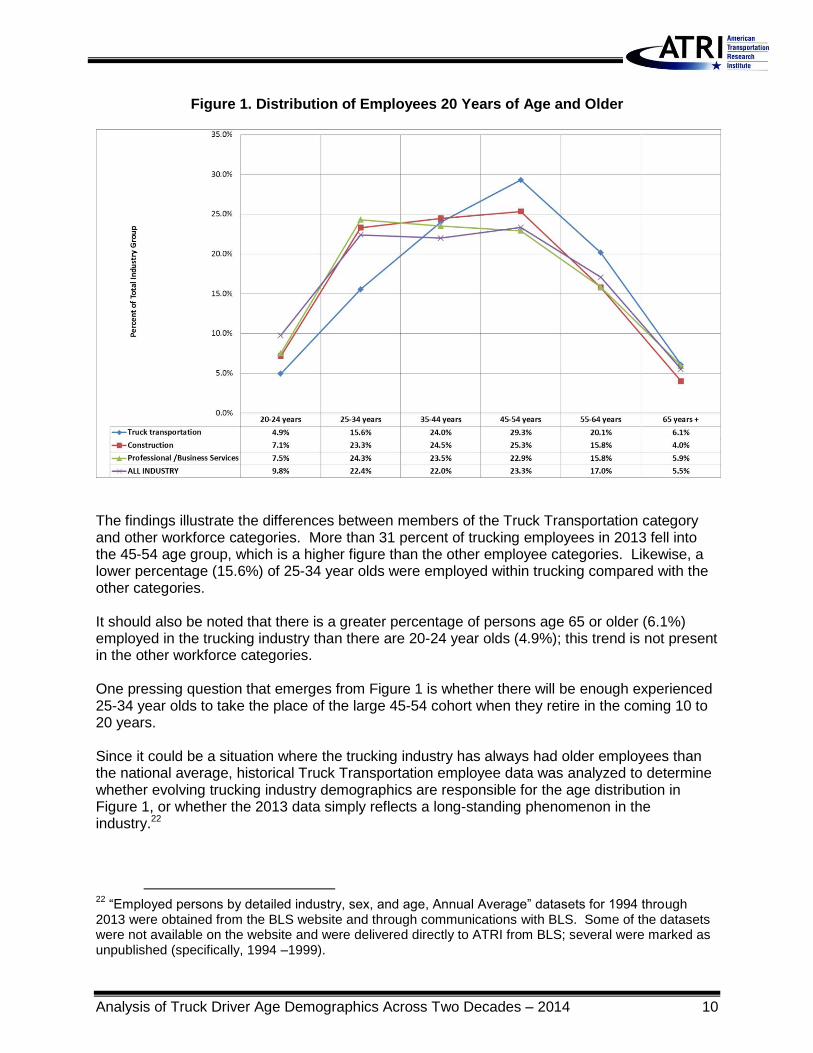
Figure 1. Distribution of Employees 20 Years of Age and Older
The findings illustrate the differences between members of the Truck Transportation category and other workforce categories. More than 31 percent of trucking employees in 2013 fell into the 45-54 age group, which is a higher figure than the other employee categories. Likewise, a lower percentage (15.6%) of 25-34 year olds were employed within trucking compared with the other categories. It should also be noted that there is a greater percentage of persons age 65 or older (6.1%) employed in the trucking industry than there are 20-24 year olds (4.9%); this trend is not present in the other workforce categories. One pressing question that emerges from Figure 1 is whether there will be enough experienced 25-34 year olds to take the place of the large 45-54 cohort when they retire in the coming 10 to 20 years. Since it could be a situation where the trucking industry has always had older employees than the national average, historical Truck Transportation employee data was analyzed to determine whether evolving trucking industry demographics are responsible for the age distribution in Figure 1, or whether the 2013 data simply reflects a long-standing phenomenon in the industry.22
22
“Employed persons by detailed industry, sex, and age, Annual Average” datasets for 1994 through 2013 were obtained from the BLS website and through communications with BLS. Some of the datasets were not available on the website and were delivered directly to ATRI from BLS; several were marked as unpublished (specifically, 1994 –1999).
Analysis of Truck Driver Age Demographics Across Two Decades – 2014 11
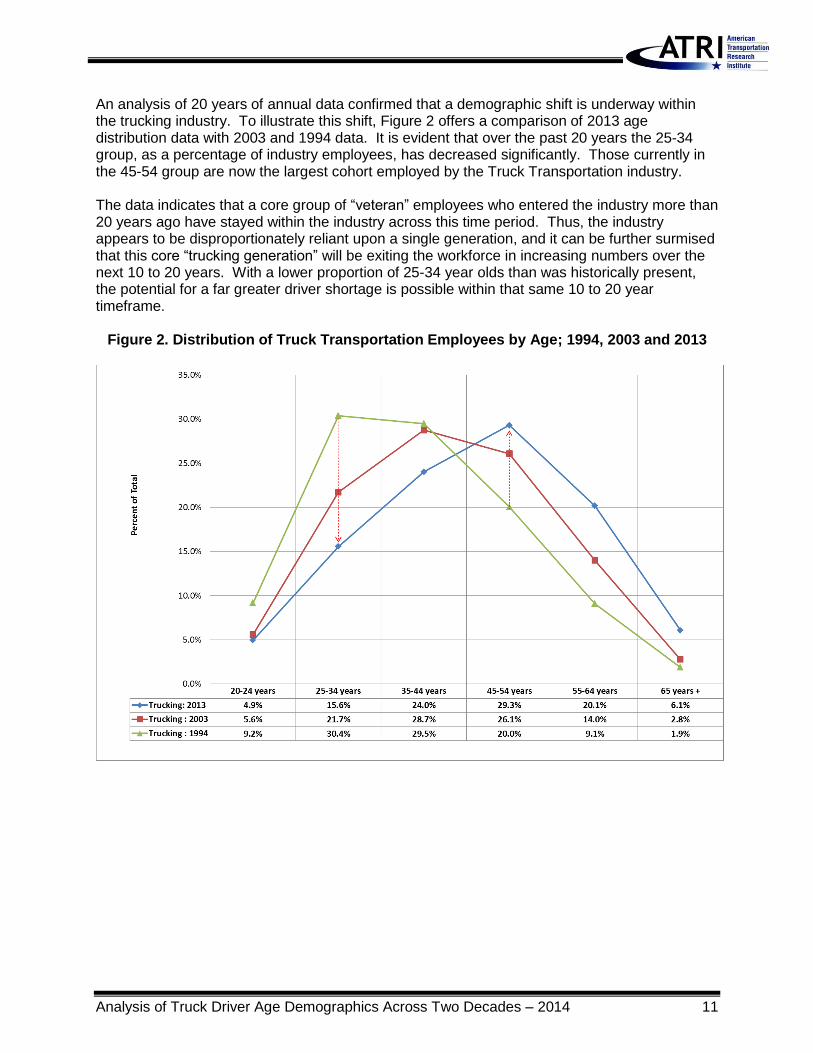
An analysis of 20 years of annual data confirmed that a demographic shift is underway within the trucking industry. To illustrate this shift, Figure 2 offers a comparison of 2013 age distribution data with 2003 and 1994 data. It is evident that over the past 20 years the 25-34 group, as a percentage of industry employees, has decreased significantly. Those currently in the 45-54 group are now the largest cohort employed by the Truck Transportation industry. The data indicates that a core group of “veteran” employees who entered the industry more than 20 years ago have stayed within the industry across this time period. Thus, the industry appears to be disproportionately reliant upon a single generation, and it can be further surmised that this core “trucking generation” will be exiting the workforce in increasing numbers over the next 10 to 20 years. With a lower proportion of 25-34 year olds than was historically present, the potential for a far greater driver shortage is possible within that same 10 to 20 year timeframe.
Figure 2. Distribution of Truck Transportation Employees by Age; 1994, 2003 and 2013
Analysis of Truck Driver Age Demographics Across Two Decades – 2014 12
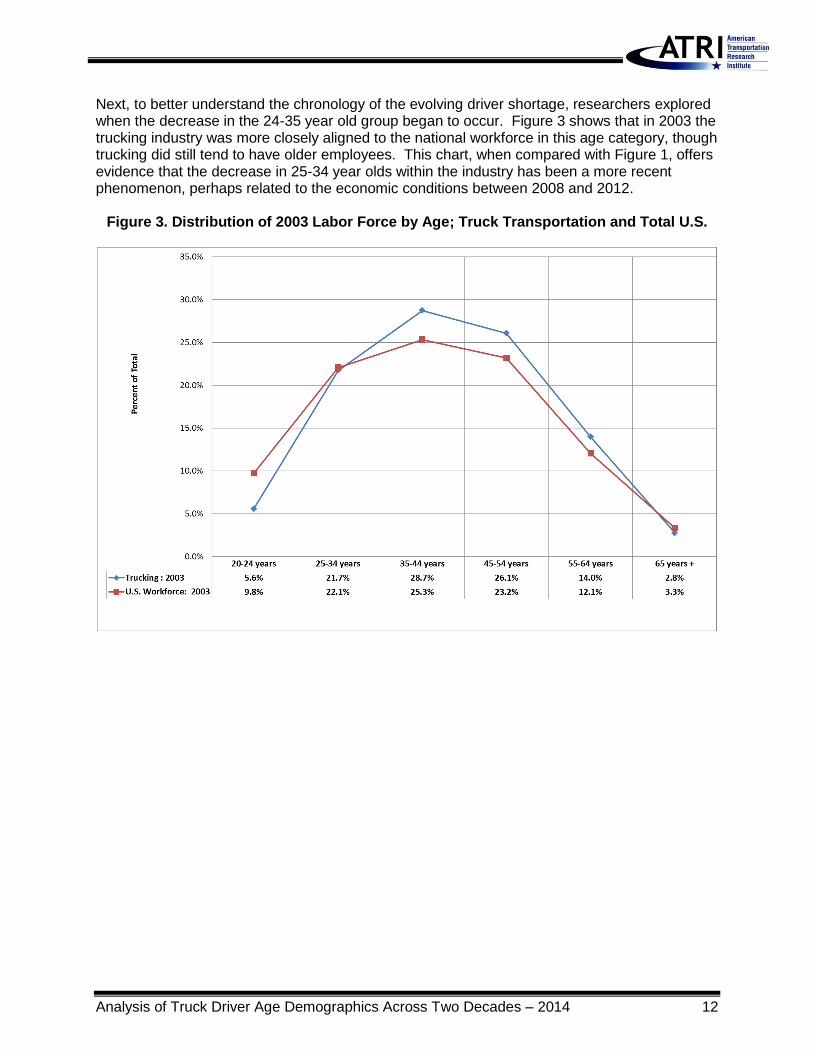
Next, to better understand the chronology of the evolving driver shortage, researchers explored when the decrease in the 24-35 year old group began to occur. Figure 3 shows that in 2003 the trucking industry was more closely aligned to the national workforce in this age category, though trucking did still tend to have older employees. This chart, when compared with Figure 1, offers evidence that the decrease in 25-34 year olds within the industry has been a more recent phenomenon, perhaps related to the economic conditions between 2008 and 2012.
Figure 3. Distribution of 2003 Labor Force by Age; Truck Transportation and Total U.S.
Analysis of Truck Driver Age Demographics Across Two Decades – 2014 13
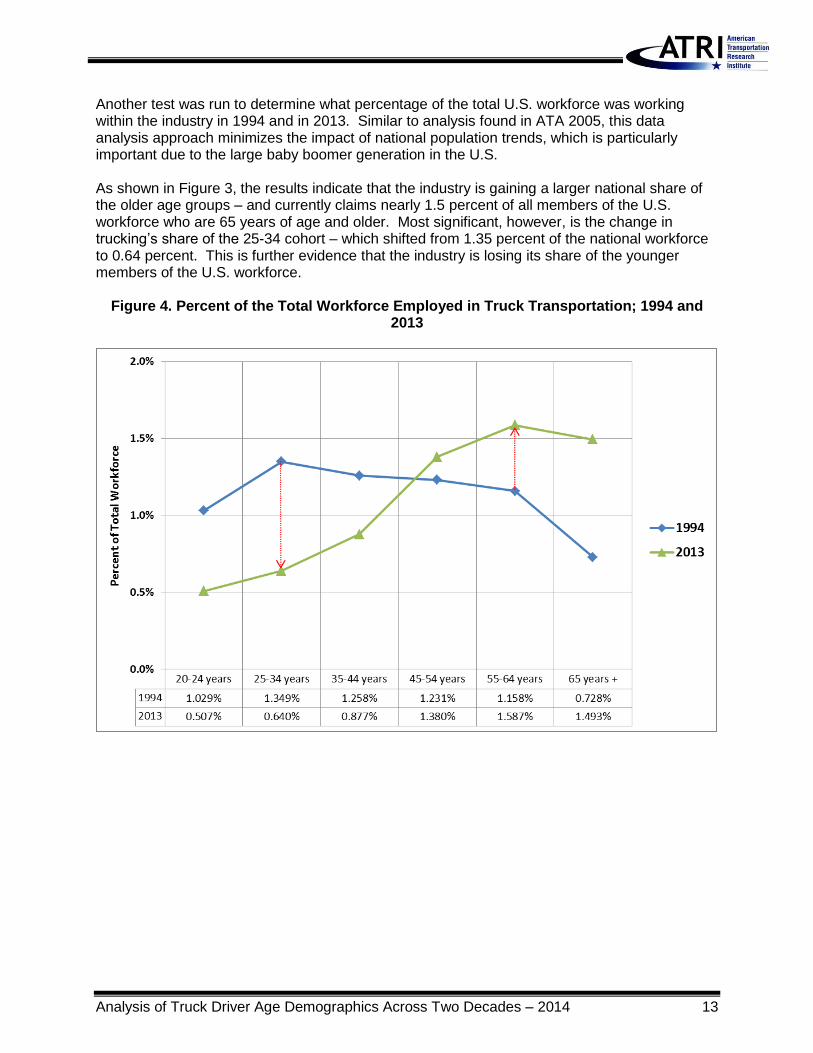
Another test was run to determine what percentage of the total U.S. workforce was working within the industry in 1994 and in 2013. Similar to analysis found in ATA 2005, this data analysis approach minimizes the impact of national population trends, which is particularly important due to the large baby boomer generation in the U.S. As shown in Figure 3, the results indicate that the industry is gaining a larger national share of the older age groups – and currently claims nearly 1.5 percent of all members of the U.S. workforce who are 65 years of age and older. Most significant, however, is the change in trucking’s share of the 25-34 cohort – which shifted from 1.35 percent of the national workforce to 0.64 percent. This is further evidence that the industry is losing its share of the younger members of the U.S. workforce.
Figure 4. Percent of the Total Workforce Employed in Truck Transportation; 1994 and 2013
Analysis of Truck Driver Age Demographics Across Two Decades – 2014 14
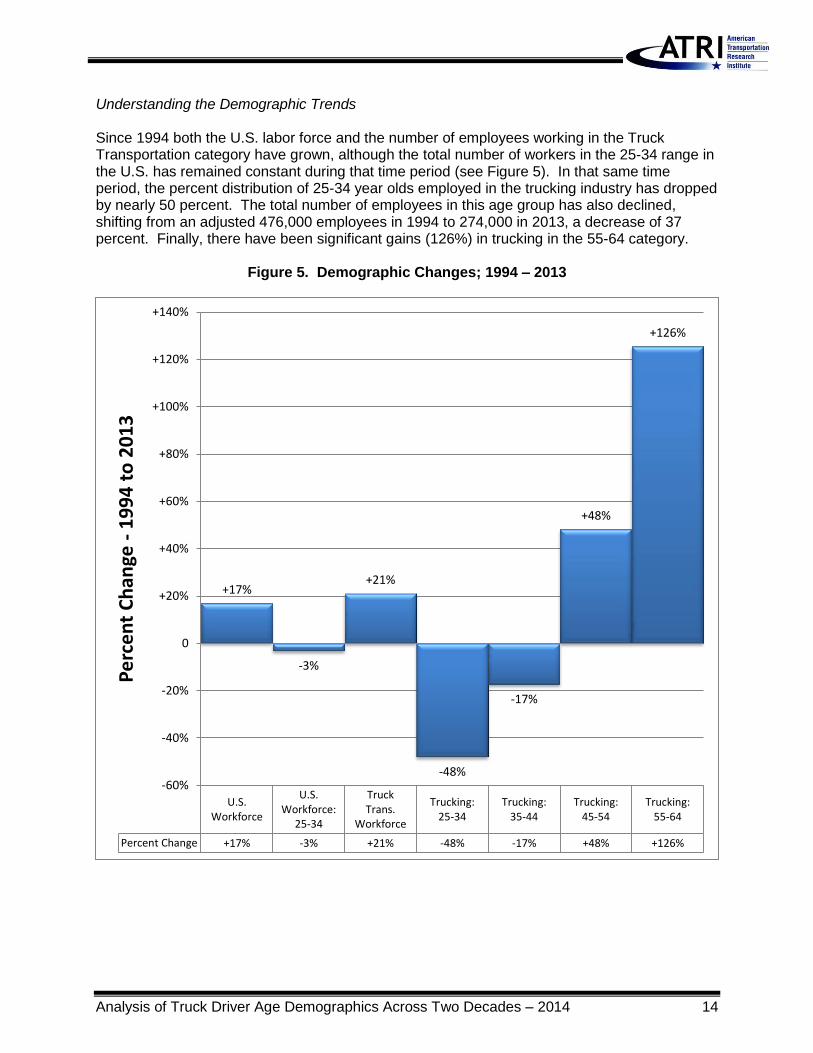
Understanding the Demographic Trends Since 1994 both the U.S. labor force and the number of employees working in the Truck Transportation category have grown, although the total number of workers in the 25-34 range in the U.S. has remained constant during that time period (see Figure 5). In that same time period, the percent distribution of 25-34 year olds employed in the trucking industry has dropped by nearly 50 percent. The total number of employees in this age group has also declined, shifting from an adjusted 476,000 employees in 1994 to 274,000 in 2013, a decrease of 37 percent. Finally, there have been significant gains (126%) in trucking in the 55-64 category.
Figure 5. Demographic Changes; 1994 – 2013
U.S.Workforce
U.S.Workforce:
25-34
TruckTrans.
Workforce
Trucking:25-34
Trucking:35-44
Trucking:45-54
Trucking:55-64
Percent Change +17% -3% +21% -48% -17% +48% +126%
+17%
-3%
+21%
-48%
-17%
+48%
+126%
-60%
-40%
-20%
0
+20%
+40%
+60%
+80%
+100%
+120%
+140%
Pe
rce
nt
Ch
ange
- 1
99
4 t
o 2
01
3
Analysis of Truck Driver Age Demographics Across Two Decades – 2014 15
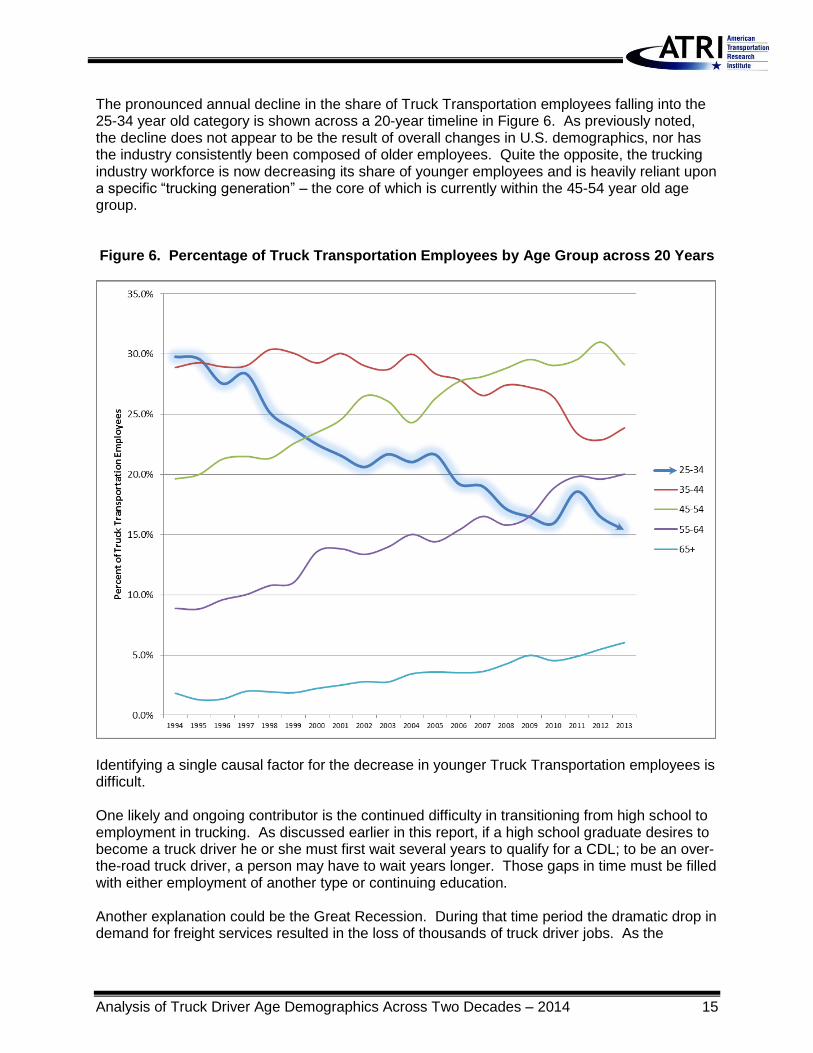
The pronounced annual decline in the share of Truck Transportation employees falling into the 25-34 year old category is shown across a 20-year timeline in Figure 6. As previously noted, the decline does not appear to be the result of overall changes in U.S. demographics, nor has the industry consistently been composed of older employees. Quite the opposite, the trucking industry workforce is now decreasing its share of younger employees and is heavily reliant upon a specific “trucking generation” – the core of which is currently within the 45-54 year old age group. Figure 6. Percentage of Truck Transportation Employees by Age Group across 20 Years
Identifying a single causal factor for the decrease in younger Truck Transportation employees is difficult. One likely and ongoing contributor is the continued difficulty in transitioning from high school to employment in trucking. As discussed earlier in this report, if a high school graduate desires to become a truck driver he or she must first wait several years to qualify for a CDL; to be an over-the-road truck driver, a person may have to wait years longer. Those gaps in time must be filled with either employment of another type or continuing education. Another explanation could be the Great Recession. During that time period the dramatic drop in demand for freight services resulted in the loss of thousands of truck driver jobs. As the
Analysis of Truck Driver Age Demographics Across Two Decades – 2014 16
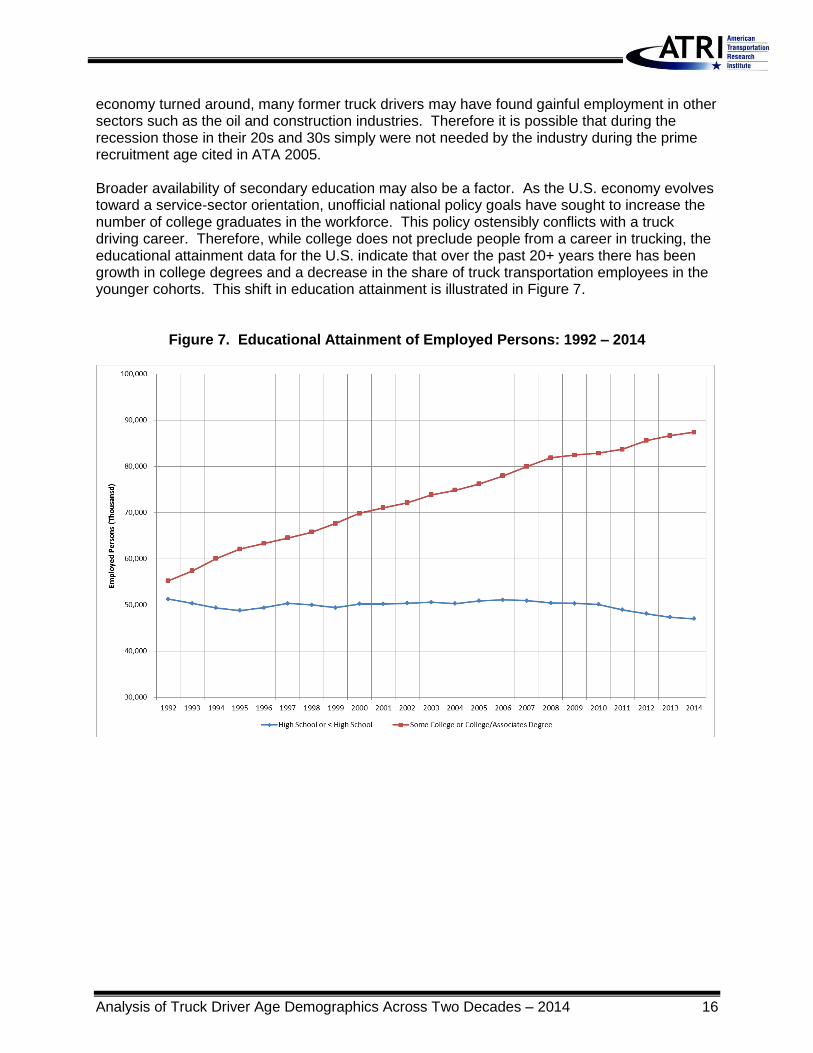
economy turned around, many former truck drivers may have found gainful employment in other sectors such as the oil and construction industries. Therefore it is possible that during the recession those in their 20s and 30s simply were not needed by the industry during the prime recruitment age cited in ATA 2005. Broader availability of secondary education may also be a factor. As the U.S. economy evolves toward a service-sector orientation, unofficial national policy goals have sought to increase the number of college graduates in the workforce. This policy ostensibly conflicts with a truck driving career. Therefore, while college does not preclude people from a career in trucking, the educational attainment data for the U.S. indicate that over the past 20+ years there has been growth in college degrees and a decrease in the share of truck transportation employees in the younger cohorts. This shift in education attainment is illustrated in Figure 7.
Figure 7. Educational Attainment of Employed Persons: 1992 – 2014
Analysis of Truck Driver Age Demographics Across Two Decades – 2014 17
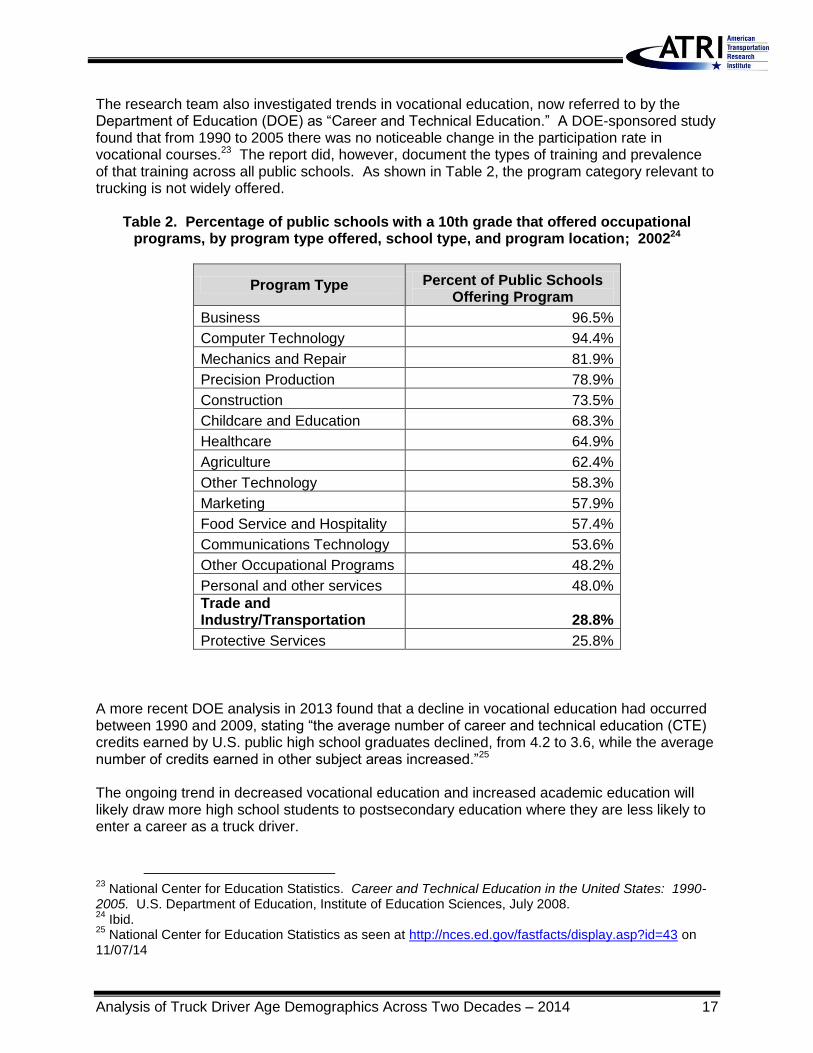
The research team also investigated trends in vocational education, now referred to by the Department of Education (DOE) as “Career and Technical Education.” A DOE-sponsored study found that from 1990 to 2005 there was no noticeable change in the participation rate in vocational courses.23 The report did, however, document the types of training and prevalence of that training across all public schools. As shown in Table 2, the program category relevant to trucking is not widely offered.
Table 2. Percentage of public schools with a 10th grade that offered occupational programs, by program type offered, school type, and program location; 200224
Program Type Percent of Public Schools Offering Program
Business 96.5%
Computer Technology 94.4%
Mechanics and Repair 81.9%
Precision Production 78.9%
Construction 73.5%
Childcare and Education 68.3%
Healthcare 64.9%
Agriculture 62.4%
Other Technology 58.3%
Marketing 57.9%
Food Service and Hospitality 57.4%
Communications Technology 53.6%
Other Occupational Programs 48.2%
Personal and other services 48.0%
Trade and Industry/Transportation 28.8%
Protective Services 25.8%
A more recent DOE analysis in 2013 found that a decline in vocational education had occurred between 1990 and 2009, stating “the average number of career and technical education (CTE) credits earned by U.S. public high school graduates declined, from 4.2 to 3.6, while the average number of credits earned in other subject areas increased.”25 The ongoing trend in decreased vocational education and increased academic education will likely draw more high school students to postsecondary education where they are less likely to enter a career as a truck driver.
23
National Center for Education Statistics. Career and Technical Education in the United States: 1990-2005. U.S. Department of Education, Institute of Education Sciences, July 2008. 24
Ibid. 25
National Center for Education Statistics as seen at http://nces.ed.gov/fastfacts/display.asp?id=43 on 11/07/14
Analysis of Truck Driver Age Demographics Across Two Decades – 2014 18
CONCLUSIONS AND NEXT STEPS This report confirms through an analysis of available Census data that the trucking industry has an aging employee base with a shrinking replacement population of younger trucking industry workers. The data show that the aging of the industry does not match changes in the overall U.S. workforce. Instead, there has been a decline in the percent of the U.S. labor force under the age of 35 that works within the Truck Transportation industry. If current trends continue the core “trucking generation” – persons 45-54, will retire with a significant deficit of younger employees behind them to take their place. Potentially exacerbating this issue, there has been growth in the percentage of trucking employees that are in the age range of 55-64 and 65+. While employees in these groups are anecdotally said to be the most skilled and reliable, they are much closer to the current average U.S. retirement age of 62.26 A significant number of these employees may currently be at a point in their career where retirement is an option, and many are eligible at the age of 62 to begin collecting Social Security retirement benefits. In a worst-case scenario, a sudden uptick in the retirement of drivers age 62 or older could have a significant negative impact on the current shortage. Next Steps To address these findings, the industry will need to develop a program that specifically targets younger generations of workers with appropriate messaging, including the benefits of a career in trucking. It is particularly important that the industry engage those in the 25-34 age range and younger. Related research should investigate the expectations and perspectives of Millennials as to their work habits, compensation expectations and lifestyle needs. From a research needs perspective, the Census data offers the best-available view of trucking industry age demographics across a multi-year time period. A data collection effort focused on truck driver age, however, would benefit the research literature and the industry. Such data, if collected annually, could be used to regularly assess the state of the driver shortage as it relates to demographics. It could also act to further validate the Census data. Data collection may require that researchers work directly with CDL issuing agencies to compile a database of the birth year of CDL holders. In summary, this analysis offers evidence that the driver shortage is likely to become considerably worse in the coming years. To counter this trend, long- and short-term initiatives should be developed to attract those under the age of 35 to the industry. In the short-term, this means identifying methods for attracting the “millennial” generation to the industry and maintaining the current employee base. The industry may already be doing this to some degree, with numerous carriers increasing pay in 2014, covering the cost of driver training, and purchasing new equipment
26
Gallup reports the average retirement age is 62, as seen at: http://www.gallup.com/poll/168707/average-retirement-age-rises.aspx on 10/27/14.
Analysis of Truck Driver Age Demographics Across Two Decades – 2014 19
In the longer-term, however, there are greater challenges and opportunities. High school vocation classwork could be an excellent tool for introducing students to a career in trucking. The statistics show, however, that vocational learning typically focuses on non-transportation topics. Further development of trucking-specific vocational coursework could be a good entry point to the industry, and future research could identify ideal vocational course offerings. But the industry will still have to address the time gap between high school and a trucking career that is not able to commence until the age of 21. Several fleets are using apprentice jobs (dock workers, forklift drivers) to grow younger people into a truck driving career. Finally, the 2005 ATA study found that trucking sources new drivers among those in their late 20s or early 30s who have reached their earning potential in other fields. This delay in entering the industry is in part due to the minimum CDL age issue as well as the insurance barriers that emphasize a minimum age of 25 for long-haul drivers. To address this, an industry initiative could re-explore graduated CDL options.
Analysis of Truck Driver Age Demographics Across Two Decades – 2014 20
REFERENCES American Trucking Associations (ATA). The U.S. Truck Driver Shortage: Analysis and Forecasts. Prepared by Global Insight, Inc. May 2005. American Trucking Associations (ATA). American Trucking Trends 2014. 2014. American Trucking Associations (ATA), ATA 2014 Driver Compensation Study. November 2014. American Trucking Associations Statistics & Economics Group, Quarterly Employment Report, 2014. ATA Foundation. Empty Seats and Musical Chairs: Critical Success Factors in Truck Driver Retention. Prepared by The Gallup Organization, October 1997. Engel, Cynthia. Competition Drives the Trucking Industry. Monthly Labor Review, April 1998. Min, Hokey; A. Emam. Developing the Profiles of Truck Drivers for their Successful Recruitment and Retention. International Journal of Physical Distribution and Logistics Management, 2003. National Center for Education Statistics. Career and Technical Education in the United States: 1990-2005. U.S. Department of Education, Institute of Education Sciences, July 2008. Transport Topics. Congress’ Drive to Slash Federal Spending Could Eliminate Grants for Driver Training. March 07, 2011.