white county board of commissioners third public presentation millage rate for tax year 2008 july...
TRANSCRIPT
White County Board of Commissioners
Third Public Presentation Millage Rate for Tax Year 2008
July 31, 2008 10:00 a.m.
Setting the millage rate is the last step in the “Budget
Process”
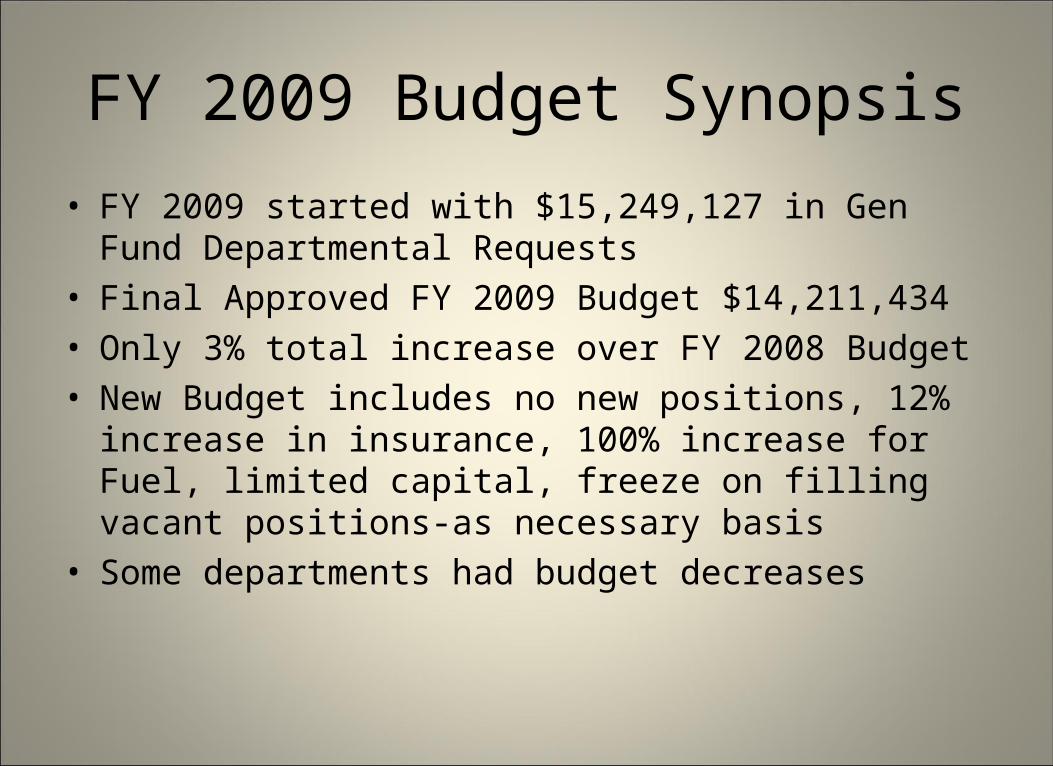
FY 2009 Budget Synopsis
• FY 2009 started with $15,249,127 in Gen Fund Departmental Requests
• Final Approved FY 2009 Budget $14,211,434• Only 3% total increase over FY 2008 Budget• New Budget includes no new positions, 12% increase in
insurance, 100% increase for Fuel, limited capital, freeze on filling vacant positions-as necessary basis
• Some departments had budget decreases
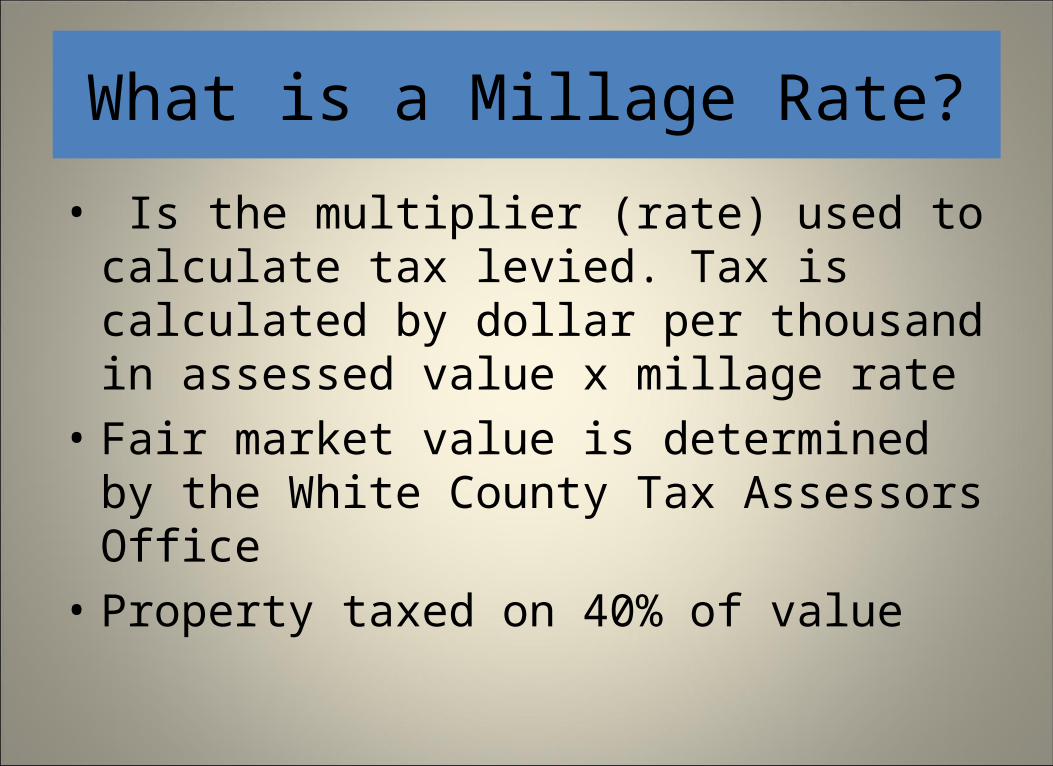
What is a Millage Rate?
• Is the multiplier (rate) used to calculate tax levied. Tax is calculated by dollar per thousand in assessed value x millage rate
• Fair market value is determined by the White County Tax Assessors Office
• Property taxed on 40% of value
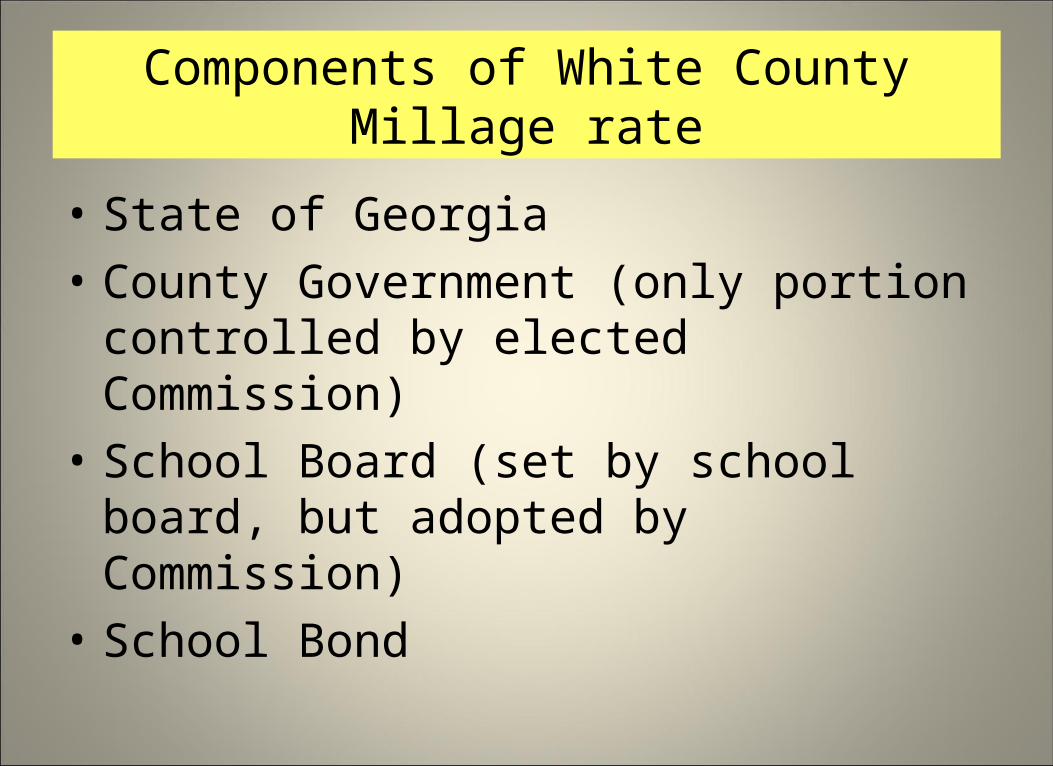
Components of White County Millage rate
• State of Georgia• County Government (only portion controlled
by elected Commission)• School Board (set by school board, but
adopted by Commission)• School Bond
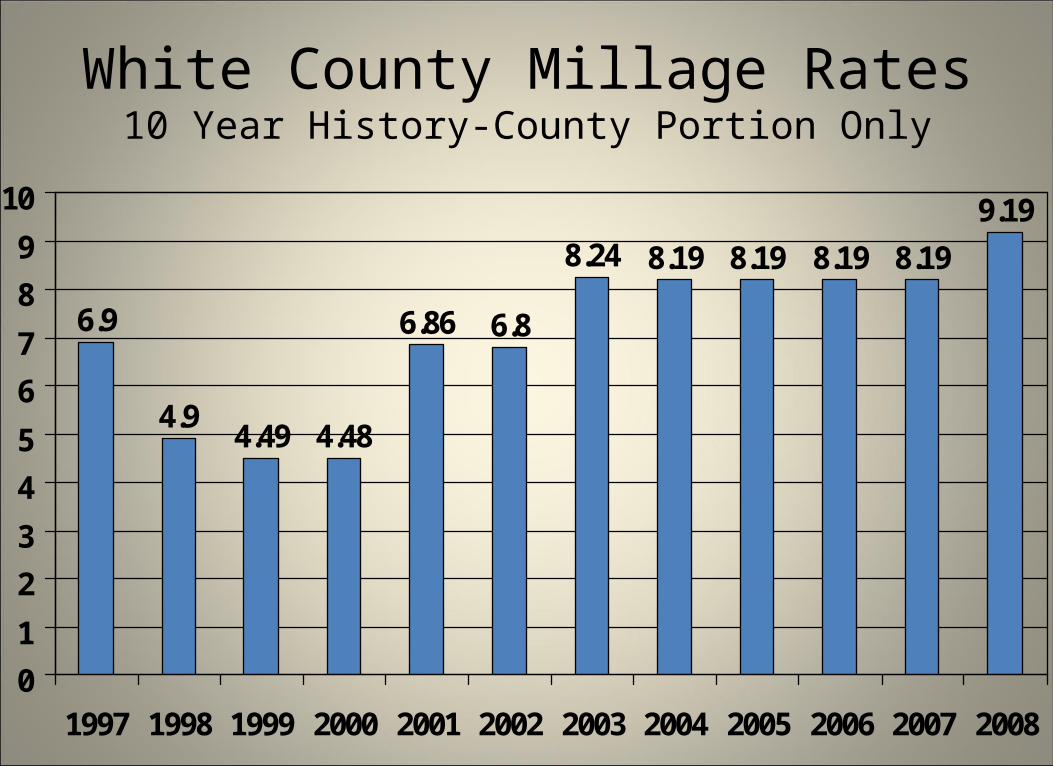
White County Millage Rates10 Year History-County Portion Only
6.9
4.94.49 4.48
6.86 6.8
8.24 8.19 8.19 8.19 8.19
9.19
0
1
2
3
4
5
6
7
8
9
10
1997 1998 1999 2000 2001 2002 2003 2004 2005 2006 2007 2008
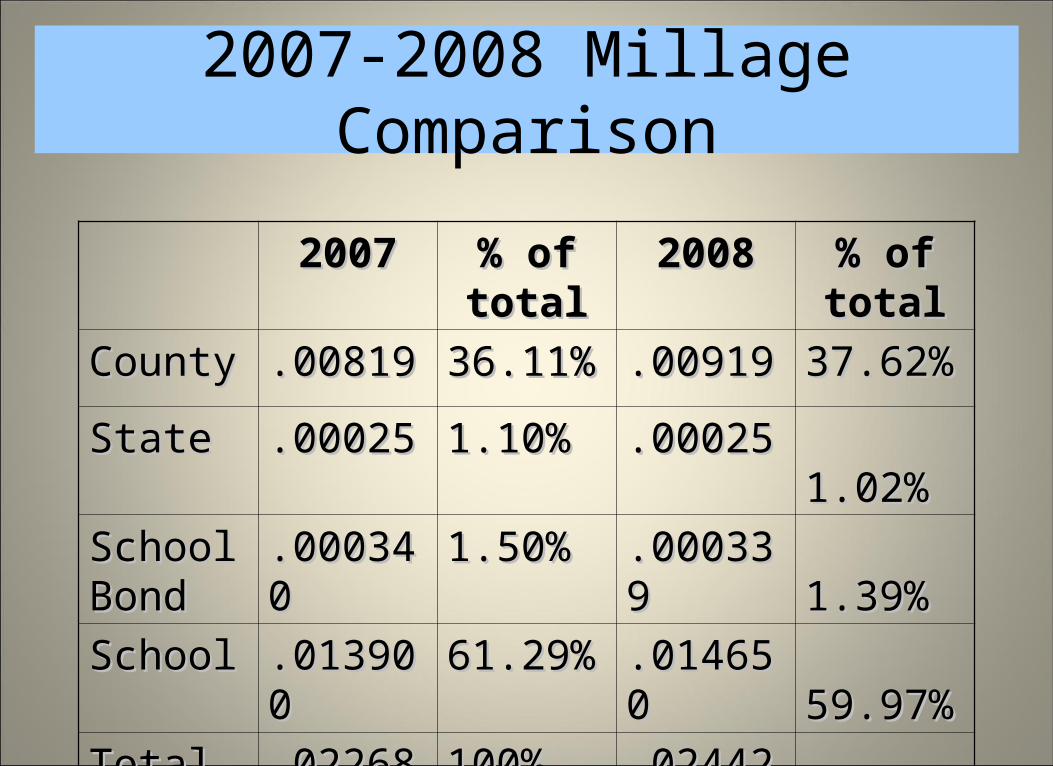
2007-2008 Millage Comparison
20072007 % of % of totaltotal
20082008 % of % of totaltotal
CountyCounty .00819.00819 36.11%36.11% .00919.00919 37.62%37.62%
StateState .00025.00025 1.10%1.10% .00025.00025 1.02%1.02%
School School BondBond
.00034.0003400
1.50%1.50% .00033.0003399
1.39%1.39%
SchoolSchool .01390.0139000
61.29%61.29% .01465.0146500
59.97%59.97%
TotalTotal .02268.02268 100%100% .02442.0244299
100%100%
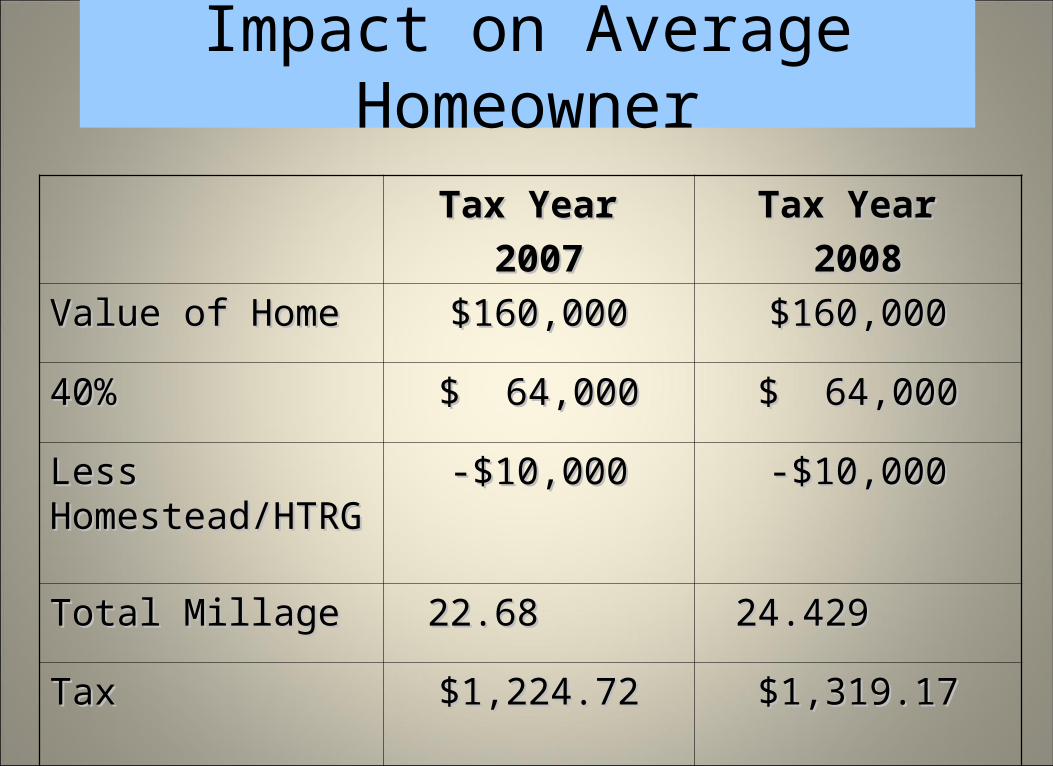
Impact on Average Homeowner
Tax Year Tax Year
20072007Tax Year Tax Year
20082008
Value of HomeValue of Home $160,000$160,000 $160,000$160,000
40% 40% $ 64,000$ 64,000 $ 64,000$ 64,000
Less Less Homestead/HTRHomestead/HTRGG
-$10,000-$10,000 -$10,000-$10,000
Total MillageTotal Millage 22.68 22.68 24.429 24.429
TaxTax $1,224.72$1,224.72 $1,319.17$1,319.17
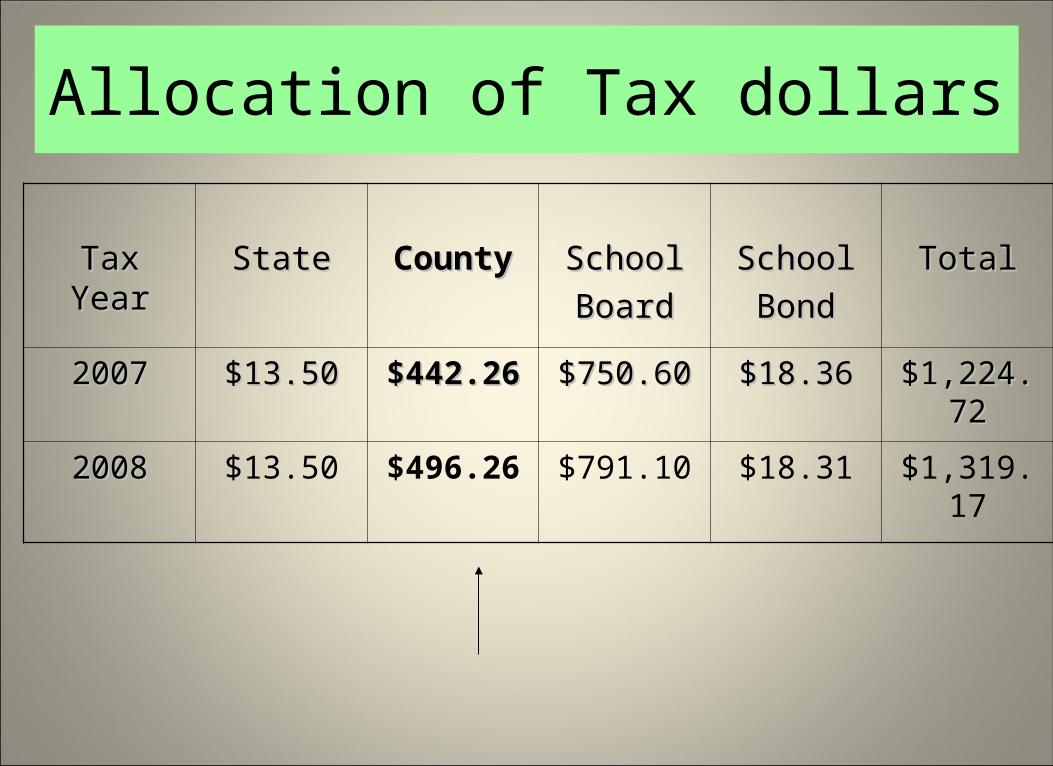
Allocation of Tax dollars
Tax YearTax Year StateState CountyCounty SchoolSchool
BoardBoardSchoolSchool
BondBondTotalTotal
20072007 $13.50$13.50 $442.26$442.26 $750.60$750.60 $18.36$18.36 $1,224.7$1,224.722
20082008 $13.50 $496.26 $791.10 $18.31 $1,319.17
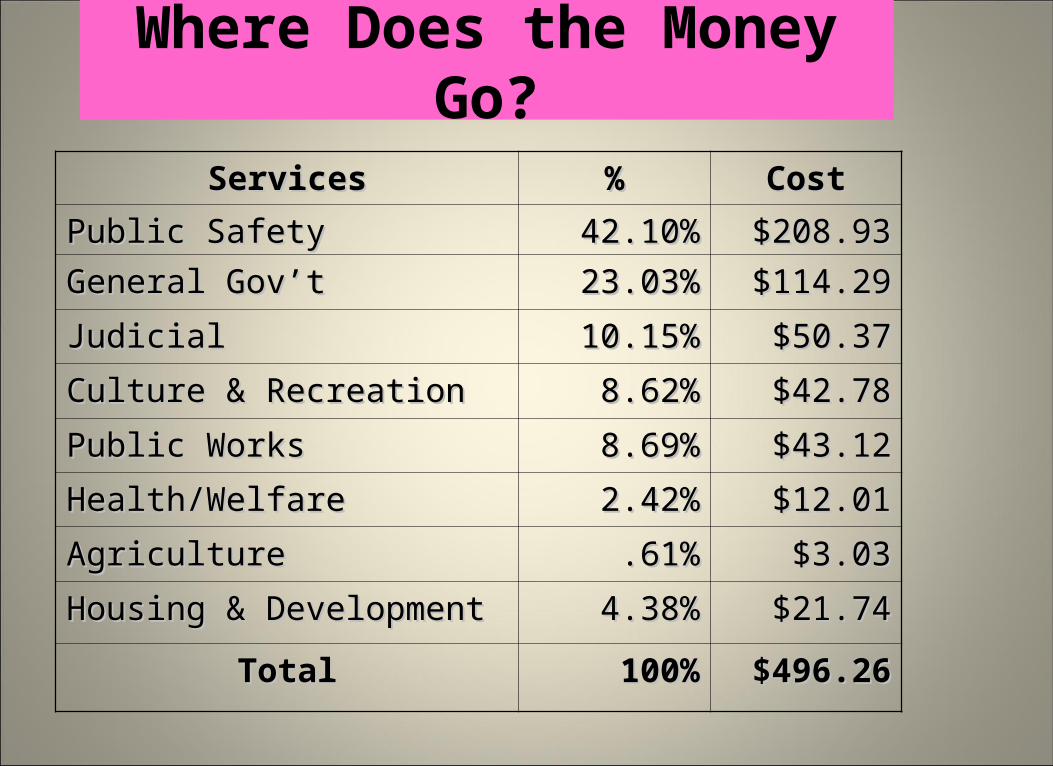
Where Does the Money Go?
ServicesServices %% CostCost
Public SafetyPublic Safety 42.10%42.10% $208.93$208.93
General Gov’tGeneral Gov’t 23.03%23.03% $114.29$114.29
JudicialJudicial 10.15%10.15% $50.37$50.37
Culture & RecreationCulture & Recreation 8.62%8.62% $42.78$42.78
Public WorksPublic Works 8.69%8.69% $43.12$43.12
Health/WelfareHealth/Welfare 2.42%2.42% $12.01$12.01
AgricultureAgriculture .61%.61% $3.03$3.03
HousingHousing & Development& Development 4.38%4.38% $21.74$21.74
TotalTotal 100%100% $496.26$496.26
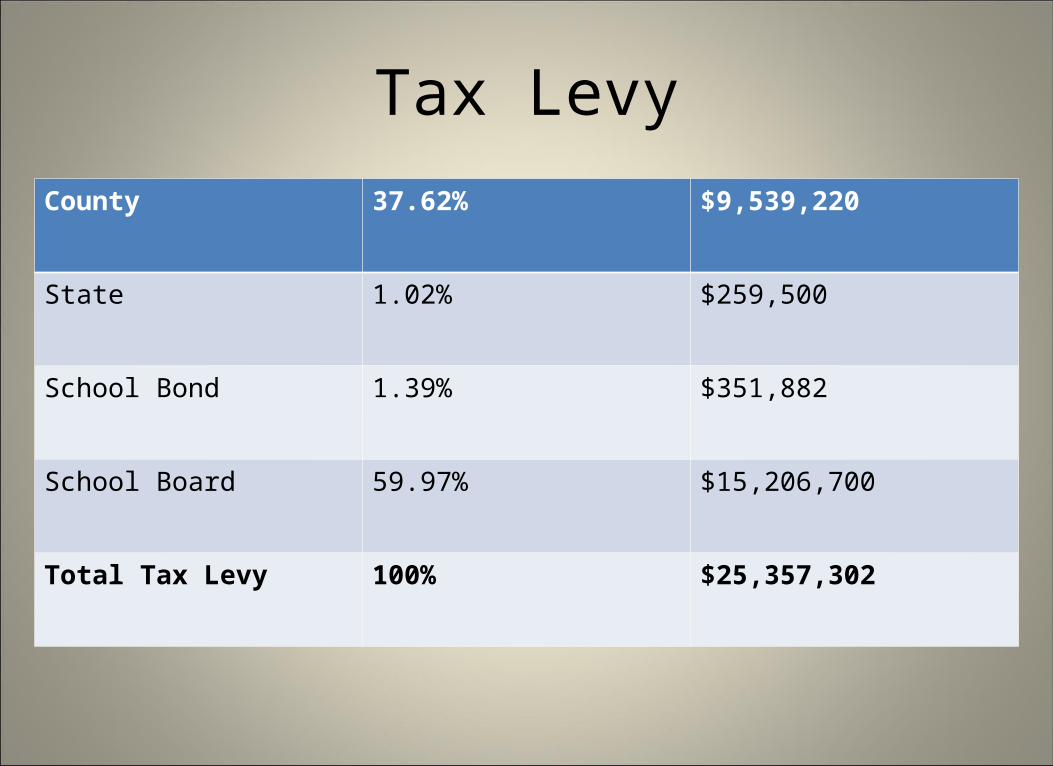
Tax LevyCounty 37.62% $9,539,220
State 1.02% $259,500
School Bond 1.39% $351,882
School Board 59.97% $15,206,700
Total Tax Levy 100% $25,357,302
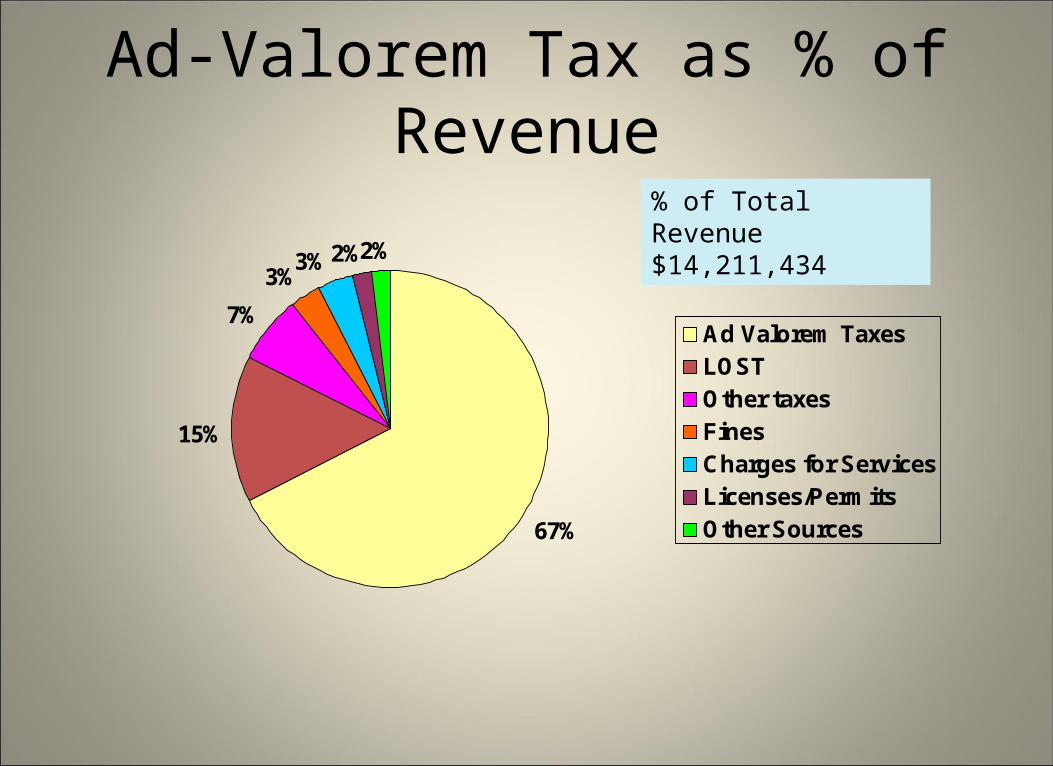
Ad-Valorem Tax as % of Revenue
67%
15%
7%
3%3%2%2%
Ad Valorem TaxesLOSTOther taxesFinesCharges for ServicesLicenses/PermitsOther Sources
% of Total Revenue $14,211,434
Conclusion
$9,539,220 in Property Tax will provide 67.12% of General Fund revenue for
FY 2009.

Questions/Comments