where are ethnicities distributed? · cultural elements, regions of distinct ethnic identity will...
TRANSCRIPT
Ethnicity is especially important to geographers because in theface of globalization trends in culture and economy, ethnicitystands as the strongest bulwark for the preservation of local diver-sity. Even if globalization engulfs language, religion, and othercultural elements, regions of distinct ethnic identity will remain.
KEY ISSUE 1
Where Are EthnicitiesDistributed?
■ Distribution of Ethnicities in the United States
■ Differentiating Ethnicity and Race
An ethnicity may be clustered in specific areas within acountry, or the area it inhabits may match closely theboundaries of a country. This section of the chapter exam-ines the clustering of ethnicities within countries, and thenext key issue looks at ethnicities on the national scale. ■
Distribution of Ethnicities in the United StatesThe two most numerous ethnicities in the United States areHispanics (or Latinos), at 15 percent of the total population,and African Americans, at 13 percent. In addition, about 4 per-cent are Asian American and 1 percent American Indian.
Ethnicity is identity with a group of people who share the cul-tural traditions of a particular homeland or hearth. Ethnicitycomes from the Greek word ethnikos, which means “national.”Ethnicity is distinct from race, which is identity with a group of people who share a biological ancestor. Race comes from amiddle-French word for generation.
Geographers are interested in where ethnicities are distributedacross space, like other elements of culture. An ethnic group istied to a particular place, because members of the group—ortheir ancestors—were born and raised there. The cultural traitsdisplayed by an ethnicity derive from particular conditions andpractices in the group’s homeland.
The reason why ethnicities have distinctive traits should bynow be familiar. Like other cultural elements, ethnic identityderives from the interplay of connections with other groups andisolation from them.
Ethnicity is an especially important cultural element oflocal diversity because our ethnic identity is immutable. Wecan deny or suppress our ethnicity, but we cannot choose tochange it in the same way we can choose to speak a differentlanguage or practice a different religion. If our parents comefrom two ethnic groups or our grandparents from four, our eth-nic identity may be extremely diluted, but it never completelydisappears.
The study of ethnicity lacks the tension in scale betweenpreservation of local diversity and globalization observed inother cultural elements. Despite efforts to preserve local lan-guages, it is not far-fetched to envision a world in which virtu-ally all educated people speak English. And universalizingreligions continue to gain adherents around the world. But noethnicity is attempting or even aspiring to achieve global dom-inance, although ethnic groups are fighting with each other tocontrol specific areas of the world.
CASE STUDY / Ethnic Diversity in Americageographers because its characteristics derive from the distinc-tive features of particular places on Earth, such as rural easternKenya.
Features of race, such as skin color, hair type and color,blood traits, and shape of body, head, and facial features, wereonce thought to be scientifically classifiable. Contemporarygeographers reject the entire biological basis of classifyinghumans into a handful of races because these features are notrooted in specific places.
However, one feature of race does matter to geographers—the color of skin. President Obama’s race is black because ofthe color of his skin. The distribution of persons of color mat-ters to geographers because it is the fundamental basis bywhich people in many societies sort out where they reside,attend school, recreate, and perform many other activities ofdaily life. ■
The United States is a country of ethnic diversity. The complex-ity of ethnic identity in the United States is clearly illustratedby Barack Obama: the country’s first black president, son of awhite mother and black father.
• President Obama’s father, Barack Obama, Senior, was bornin the village of Kanyadhiang, Kenya. He was a member ofKenya’s third-largest ethnic group, known as the Luo.
• President Obama’s mother, Ann Dunham, was born inKansas. Most of her ancestors migrated to the United Statesfrom England in the nineteenth century.
• President Obama’s step-father—his mother’s second hus-band, Lolo Soetoro—was born in the village of Yogyakarta,Indonesia. He was a member of Indonesia’s largest ethnicgroup, known as the Javanese.
Race and ethnicity are often confused. Ethnicity, such as thepresident’s Luo ancestry through his father, is important to
208
Clustering of EthnicitiesWithin a country, clustering of ethnicities can occur on twoscales. Ethnic groups may live in particular regions of thecountry, and they may live in particular neighborhoods withincities. Within the United States, ethnicities are clustered atboth scales.
REGIONAL CONCENTRATIONS OF ETHNICITIES.On a regional scale, ethnicities have distinctive distributionswithin the United States:
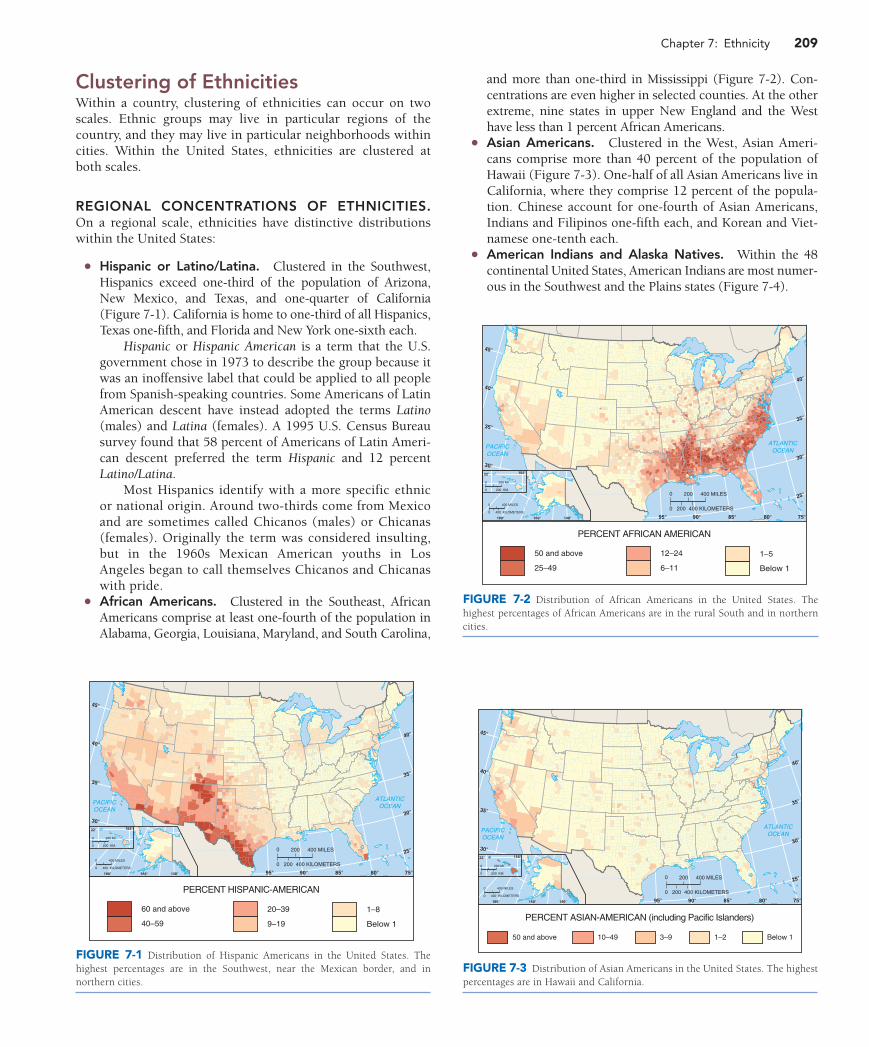
• Hispanic or Latino/Latina. Clustered in the Southwest,Hispanics exceed one-third of the population of Arizona,New Mexico, and Texas, and one-quarter of California(Figure 7-1). California is home to one-third of all Hispanics,Texas one-fifth, and Florida and New York one-sixth each.
Hispanic or Hispanic American is a term that the U.S.government chose in 1973 to describe the group because itwas an inoffensive label that could be applied to all peoplefrom Spanish-speaking countries. Some Americans of LatinAmerican descent have instead adopted the terms Latino(males) and Latina (females). A 1995 U.S. Census Bureausurvey found that 58 percent of Americans of Latin Ameri-can descent preferred the term Hispanic and 12 percentLatino/Latina.
Most Hispanics identify with a more specific ethnicor national origin. Around two-thirds come from Mexicoand are sometimes called Chicanos (males) or Chicanas(females). Originally the term was considered insulting,but in the 1960s Mexican American youths in LosAngeles began to call themselves Chicanos and Chicanaswith pride.
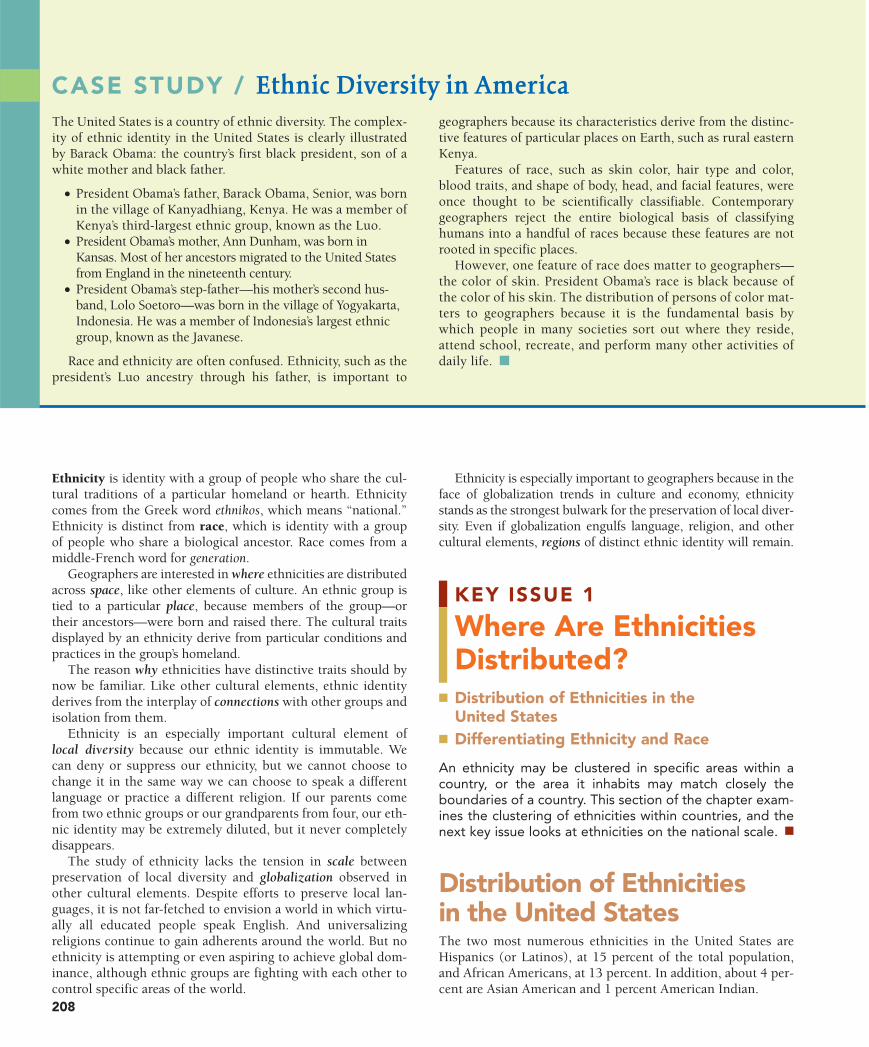
• African Americans. Clustered in the Southeast, AfricanAmericans comprise at least one-fourth of the population inAlabama, Georgia, Louisiana, Maryland, and South Carolina,
and more than one-third in Mississippi (Figure 7-2). Con-centrations are even higher in selected counties. At the otherextreme, nine states in upper New England and the Westhave less than 1 percent African Americans.
• Asian Americans. Clustered in the West, Asian Ameri-cans comprise more than 40 percent of the population ofHawaii (Figure 7-3). One-half of all Asian Americans live inCalifornia, where they comprise 12 percent of the popula-tion. Chinese account for one-fourth of Asian Americans,Indians and Filipinos one-fifth each, and Korean and Viet-namese one-tenth each.
• American Indians and Alaska Natives. Within the 48continental United States, American Indians are most numer-ous in the Southwest and the Plains states (Figure 7-4).
40°
35°
40°
45°
35°
30°30°
25°
75°80°85°90°95°
ATLANTICOCEAN
PACIFICOCEAN
0
200 400 KILOMETERS0
200 400 MILES
180° 160° 140°
0 400 MILES
0 400 KILOMETERS
155°22°
0 200 MI.
0 200 KM.
PERCENT HISPANIC-AMERICAN
60 and above
40–59
20–39
9–19
1–8
Below 1
FIGURE 7-1 Distribution of Hispanic Americans in the United States. Thehighest percentages are in the Southwest, near the Mexican border, and innorthern cities.
40°
35°
40°
45°
35°
30°30°
25°
75°80°85°90°95°
ATLANTICOCEAN
PACIFICOCEAN
0
200 400 KILOMETERS0
200 400 MILES
180° 160° 140°
0 400 MILES
0 400 KILOMETERS
155°22°
0 200 MI.
0 200 KM.
PERCENT AFRICAN AMERICAN
50 and above
25–49
12–24
6–11
1–5
Below 1
FIGURE 7-2 Distribution of African Americans in the United States. Thehighest percentages of African Americans are in the rural South and in northerncities.
40°
35°
40°
45°
35°
30°30°
25°
75°80°85°90°95°
ATLANTICOCEAN
PACIFICOCEAN
0
200 400 KILOMETERS0
200 400 MILES
180° 160° 140°
0 400 MILES
0 400 KILOMETERS
155°22°
0 200 MI.
0 200 KM.
50 and above 10–49 3–9 1–2 Below 1
PERCENT ASIAN-AMERICAN (including Pacific Islanders)
FIGURE 7-3 Distribution of Asian Americans in the United States. The highestpercentages are in Hawaii and California.
Chapter 7: Ethnicity 209

210 The Cultural Landscape
40°
35°
40°
45°
35°
30°30°
25°
75°80°85°90°95°
ATLANTICOCEAN
PACIFICOCEAN
0
200 400 KILOMETERS0
200 400 MILES
180° 160° 140°
0 400 MILES
0 400 KILOMETERS
155°22°
0 200 MI.
0 200 KM.
PERCENT AMERICAN INDIAN, ESKIMO AND ALEUT
60 and above
30–59
15–29
5–14
1–4
Below 1
FIGURE 7-4 Distribution of American Indians in the United States. Thehighest percentages are in Alaska and the Plains states.
CONCENTRATION OF ETHNICITIES IN CITIES.African Americans and Hispanics are highly clustered inurban areas. Around 90 percent of these ethnicities live inmetropolitan areas, compared to around 75 percent for allAmericans.
The distinctive distribution of African Americans and His-panics is especially noticeable at the levels of states and neigh-borhoods. At the state level, African Americans comprise 85percent of the population in the city of Detroit and only 7 per-cent in the rest of Michigan. Otherwise stated, Detroit containsless than one-tenth of Michigan’s total population, but morethan one-half of the state’s African American population. Simi-larly, Chicago is more than one-third African American, com-pared to one-twelfth in the rest of Illinois. Chicago has lessthan one-fourth of Illinois’ total population and more than one-half of the state’s African Americans.
The distribution of Hispanics is similar to that of AfricanAmericans in large northern cities. For example, New York City ismore than one-fourth Hispanic, compared to one-sixteenth in therest of New York State, and New York City contains two-fifths ofthe state’s total population and three-fourths of its Hispanics.
In the states with the largest Hispanic populations—California and Texas—the distribution is mixed. In California,Hispanics comprise nearly half of Los Angeles’s population,but the percentage of Hispanics in California’s other largecities is less than or about equal to the overall state average.In Texas, El Paso and San Antonio—the two large cities clos-est to the Mexican border—are more than one-half Hispanic,but the state’s other large cities have percentages below orabout equal to the state’s average of around one-third.
The clustering of ethnicities is especially pronounced on thescale of neighborhoods within cities. In the early twentiethcentury, Chicago, Cleveland, Detroit, and other Midwest citiesattracted ethnic groups primarily from Southern and EasternEurope to work in the rapidly growing steel, automotive, andrelated industries. For example, in 1910, when Detroit’s autoproduction was expanding, three-fourths of the city’s residents
were immigrants and children of immigrants. Southern andEastern European ethnic groups clustered in newly constructedneighborhoods that were often named for their predominantethnicities, such as Detroit’s Greektown and Poletown.
The children and grandchildren of European immigrantsmoved out of most of the original inner-city neighborhoodsduring the twentieth century. For descendants of Europeanimmigrants, ethnic identity is more likely to be retainedthrough religion, food, and other cultural traditions ratherthan through location of residence. A visible remnant of earlytwentieth-century European ethnic neighborhoods is the clus-tering of restaurants in such areas as Little Italy and Greektown.
Ethnic concentrations in U.S. cities increasingly consist ofAfrican Americans who migrate from the South or immigrantsfrom Latin America and Asia. In cities such as Detroit, AfricanAmericans now comprise the majority and live in neighbor-hoods originally inhabited by European ethnic groups. Chicagohas extensive African American neighborhoods on the southand west sides of the city, but the city also contains a mix ofneighborhoods inhabited by European, Latin American, andAsian ethnicities (Figure 7-5).
In Los Angeles, which contains large percentages of AfricanAmericans, Hispanics, and Asian Americans, the major ethnic
55
294
294 94
90
290
57
94
90
La
ke
Mi c
hi g
an
IL IN
0
2 4 KILOMETERS0
2 4 MILES
MidwayAirport
VietnameseHungarian
SwedishSerbian
Polish
Polish
PuertoRican
Cuban GermanItalian
German
Cambodian
Indian
Chinese
Irish
Irish
Irish
Czech &Slovak
Polish
Mexican
Mexican
African American
Hispanic
Asian
White
CHICAGO ETHNICITIES
FIGURE 7-5 Distribution of ethnicities in Chicago. African Americans occupyextensive areas on the south and west sides. Hispanic Americans are clustered inseveral neighborhoods on the west side. European ethnic groups are located tothe northwest, southwest, and far south side. Asian ethnic groups are clustered inthe far north side.
Chapter 7: Ethnicity 211
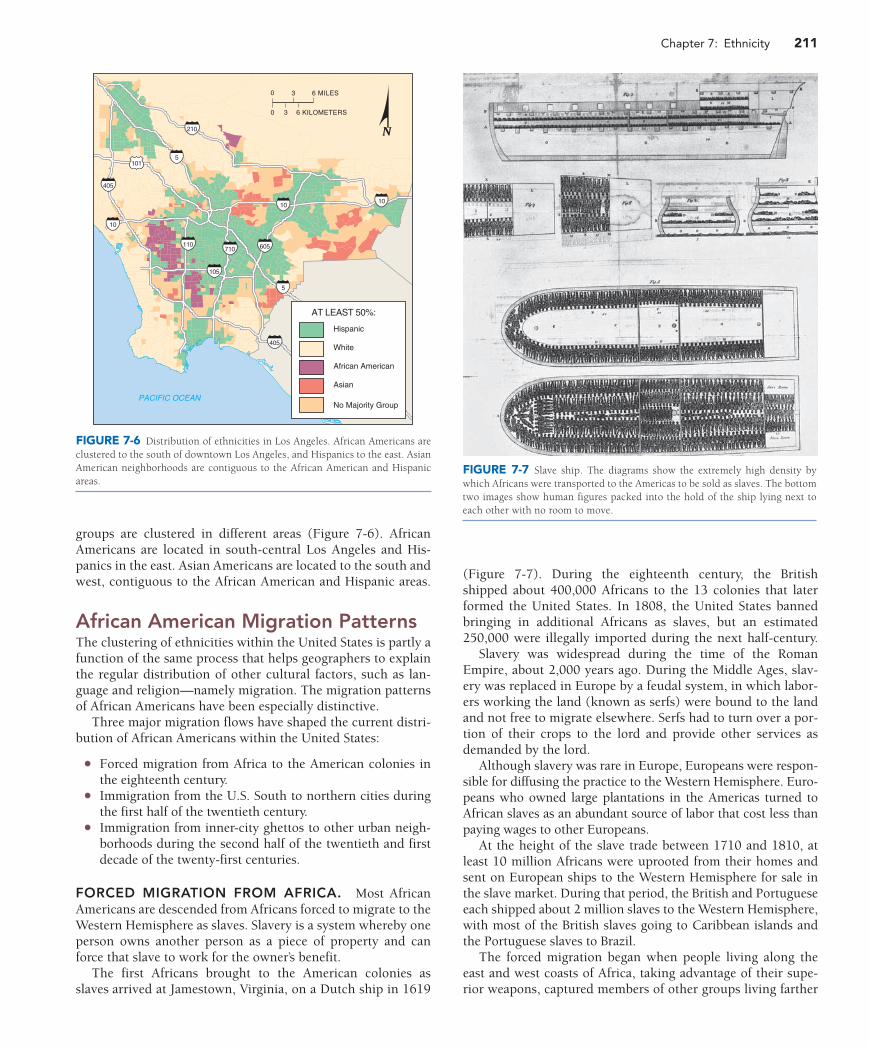
(Figure 7-7). During the eighteenth century, the Britishshipped about 400,000 Africans to the 13 colonies that laterformed the United States. In 1808, the United States bannedbringing in additional Africans as slaves, but an estimated250,000 were illegally imported during the next half-century.
Slavery was widespread during the time of the RomanEmpire, about 2,000 years ago. During the Middle Ages, slav-ery was replaced in Europe by a feudal system, in which labor-ers working the land (known as serfs) were bound to the landand not free to migrate elsewhere. Serfs had to turn over a por-tion of their crops to the lord and provide other services asdemanded by the lord.
Although slavery was rare in Europe, Europeans were respon-sible for diffusing the practice to the Western Hemisphere. Euro-peans who owned large plantations in the Americas turned toAfrican slaves as an abundant source of labor that cost less thanpaying wages to other Europeans.
At the height of the slave trade between 1710 and 1810, atleast 10 million Africans were uprooted from their homes andsent on European ships to the Western Hemisphere for sale inthe slave market. During that period, the British and Portugueseeach shipped about 2 million slaves to the Western Hemisphere,with most of the British slaves going to Caribbean islands andthe Portuguese slaves to Brazil.
The forced migration began when people living along theeast and west coasts of Africa, taking advantage of their supe-rior weapons, captured members of other groups living farther
groups are clustered in different areas (Figure 7-6). AfricanAmericans are located in south-central Los Angeles and His-panics in the east. Asian Americans are located to the south andwest, contiguous to the African American and Hispanic areas.
African American Migration PatternsThe clustering of ethnicities within the United States is partly afunction of the same process that helps geographers to explainthe regular distribution of other cultural factors, such as lan-guage and religion—namely migration. The migration patternsof African Americans have been especially distinctive.
Three major migration flows have shaped the current distri-bution of African Americans within the United States:
• Forced migration from Africa to the American colonies inthe eighteenth century.
• Immigration from the U.S. South to northern cities duringthe first half of the twentieth century.
• Immigration from inner-city ghettos to other urban neigh-borhoods during the second half of the twentieth and firstdecade of the twenty-first centuries.
FORCED MIGRATION FROM AFRICA. Most AfricanAmericans are descended from Africans forced to migrate to theWestern Hemisphere as slaves. Slavery is a system whereby oneperson owns another person as a piece of property and canforce that slave to work for the owner’s benefit.
The first Africans brought to the American colonies asslaves arrived at Jamestown, Virginia, on a Dutch ship in 1619
10
10
55
5
10
405
405
105
710110
210
605
101
PACIFIC OCEAN
0
3 6 KILOMETERS0
3 6 MILES
Hispanic
White
African American
Asian
No Majority Group
AT LEAST 50%:
FIGURE 7-6 Distribution of ethnicities in Los Angeles. African Americans areclustered to the south of downtown Los Angeles, and Hispanics to the east. AsianAmerican neighborhoods are contiguous to the African American and Hispanicareas.
FIGURE 7-7 Slave ship. The diagrams show the extremely high density bywhich Africans were transported to the Americas to be sold as slaves. The bottomtwo images show human figures packed into the hold of the ship lying next toeach other with no room to move.
212 The Cultural Landscape
inland and sold the captives to Europeans. Europeans in turnshipped the captured Africans to the Americas, selling them asslaves either on consignment or through auctions. The Spanishand Portuguese first participated in the slave trade in the earlysixteenth century, and the British, Dutch, and French joined induring the next century.
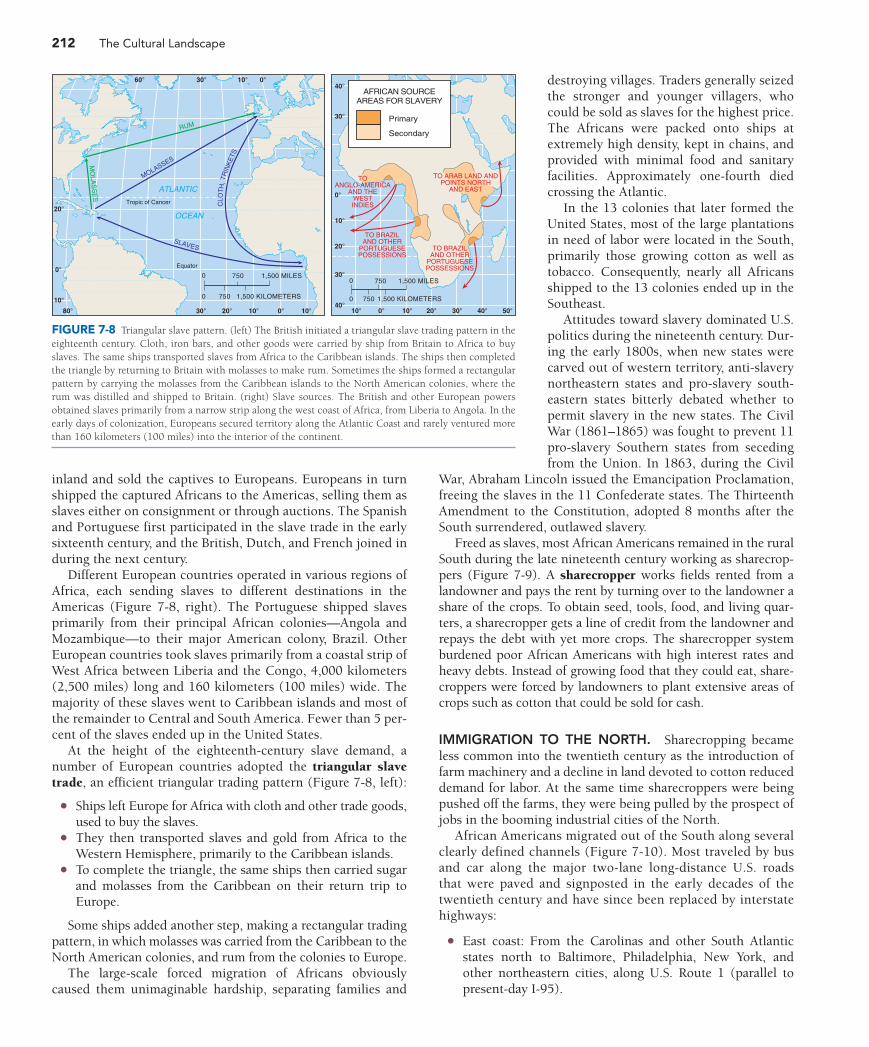
Different European countries operated in various regions ofAfrica, each sending slaves to different destinations in theAmericas (Figure 7-8, right). The Portuguese shipped slavesprimarily from their principal African colonies—Angola andMozambique—to their major American colony, Brazil. OtherEuropean countries took slaves primarily from a coastal strip ofWest Africa between Liberia and the Congo, 4,000 kilometers(2,500 miles) long and 160 kilometers (100 miles) wide. Themajority of these slaves went to Caribbean islands and most ofthe remainder to Central and South America. Fewer than 5 per-cent of the slaves ended up in the United States.
At the height of the eighteenth-century slave demand, anumber of European countries adopted the triangular slavetrade, an efficient triangular trading pattern (Figure 7-8, left):
• Ships left Europe for Africa with cloth and other trade goods,used to buy the slaves.
• They then transported slaves and gold from Africa to theWestern Hemisphere, primarily to the Caribbean islands.
• To complete the triangle, the same ships then carried sugarand molasses from the Caribbean on their return trip toEurope.
Some ships added another step, making a rectangular tradingpattern, in which molasses was carried from the Caribbean to theNorth American colonies, and rum from the colonies to Europe.
The large-scale forced migration of Africans obviouslycaused them unimaginable hardship, separating families and
destroying villages. Traders generally seizedthe stronger and younger villagers, whocould be sold as slaves for the highest price.The Africans were packed onto ships atextremely high density, kept in chains, andprovided with minimal food and sanitaryfacilities. Approximately one-fourth diedcrossing the Atlantic.
In the 13 colonies that later formed theUnited States, most of the large plantationsin need of labor were located in the South,primarily those growing cotton as well astobacco. Consequently, nearly all Africansshipped to the 13 colonies ended up in theSoutheast.
Attitudes toward slavery dominated U.S.politics during the nineteenth century. Dur-ing the early 1800s, when new states werecarved out of western territory, anti-slaverynortheastern states and pro-slavery south-eastern states bitterly debated whether topermit slavery in the new states. The CivilWar (1861–1865) was fought to prevent 11pro-slavery Southern states from secedingfrom the Union. In 1863, during the Civil
War, Abraham Lincoln issued the Emancipation Proclamation,freeing the slaves in the 11 Confederate states. The ThirteenthAmendment to the Constitution, adopted 8 months after theSouth surrendered, outlawed slavery.
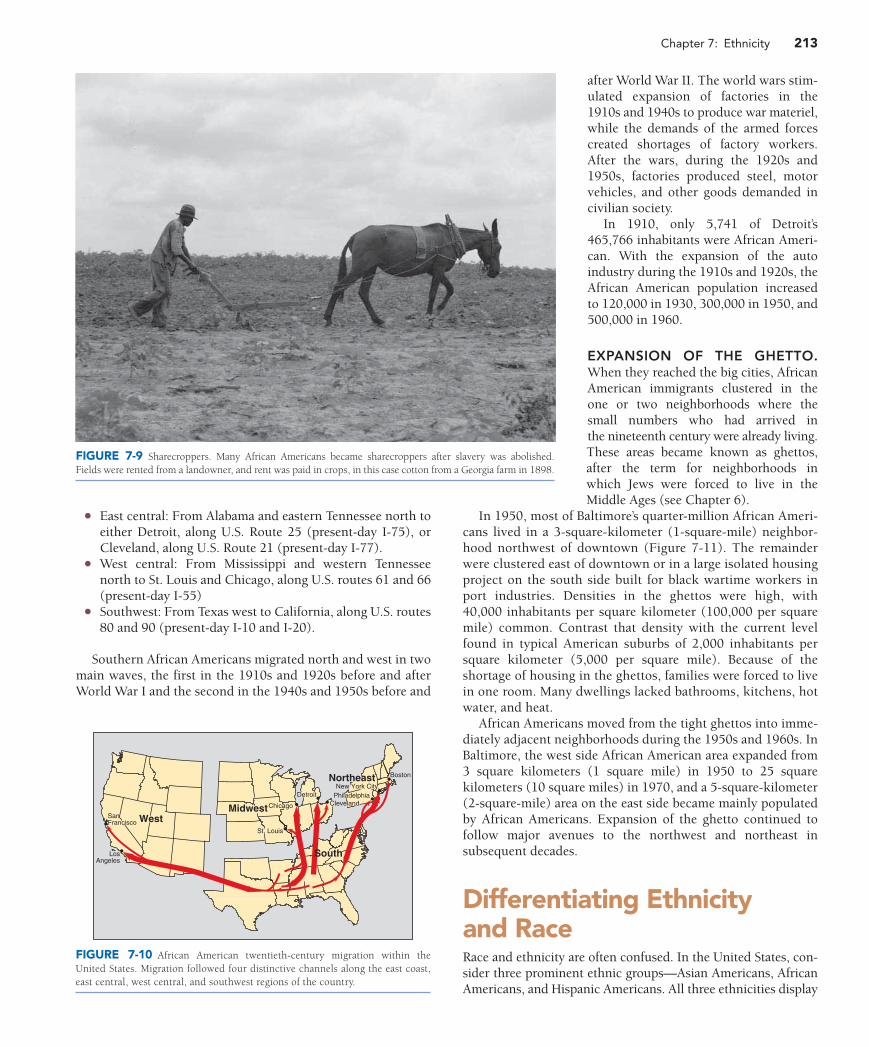
Freed as slaves, most African Americans remained in the ruralSouth during the late nineteenth century working as sharecrop-pers (Figure 7-9). A sharecropper works fields rented from alandowner and pays the rent by turning over to the landowner ashare of the crops. To obtain seed, tools, food, and living quar-ters, a sharecropper gets a line of credit from the landowner andrepays the debt with yet more crops. The sharecropper systemburdened poor African Americans with high interest rates andheavy debts. Instead of growing food that they could eat, share-croppers were forced by landowners to plant extensive areas ofcrops such as cotton that could be sold for cash.
IMMIGRATION TO THE NORTH. Sharecropping becameless common into the twentieth century as the introduction offarm machinery and a decline in land devoted to cotton reduceddemand for labor. At the same time sharecroppers were beingpushed off the farms, they were being pulled by the prospect ofjobs in the booming industrial cities of the North.
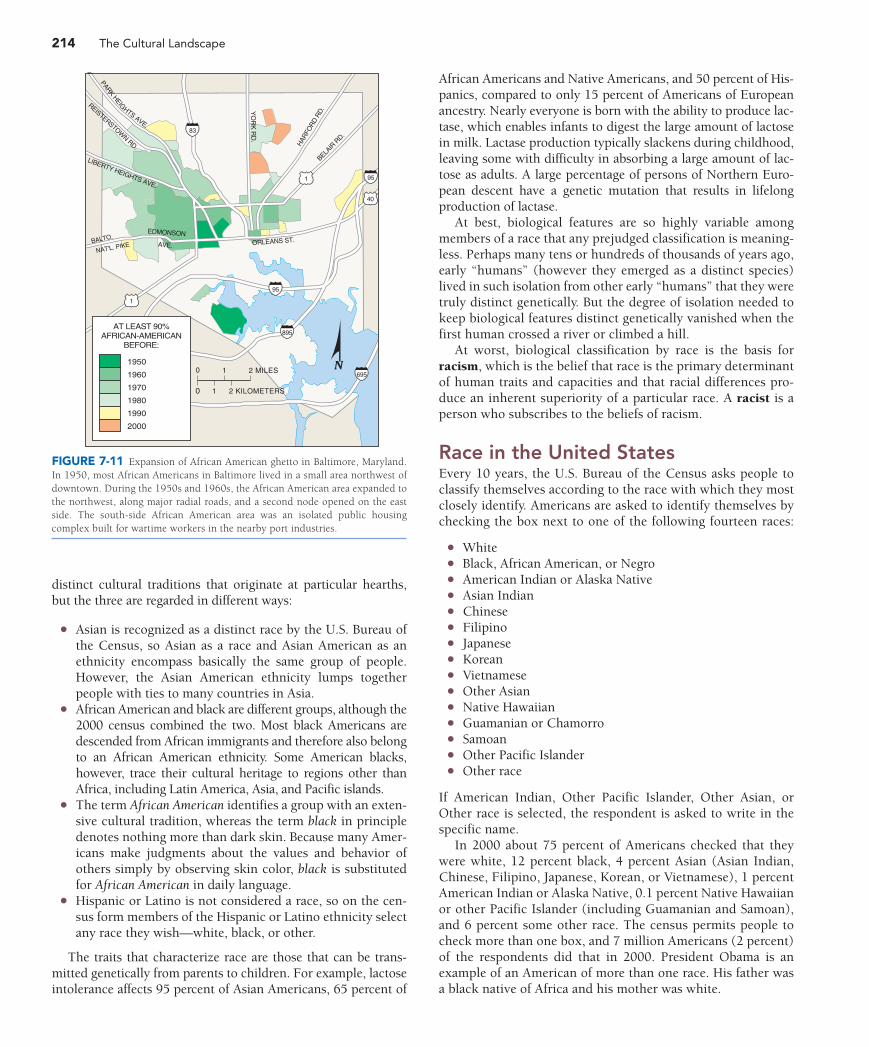
African Americans migrated out of the South along severalclearly defined channels (Figure 7-10). Most traveled by busand car along the major two-lane long-distance U.S. roadsthat were paved and signposted in the early decades of thetwentieth century and have since been replaced by interstatehighways:
• East coast: From the Carolinas and other South Atlanticstates north to Baltimore, Philadelphia, New York, andother northeastern cities, along U.S. Route 1 (parallel topresent-day I-95).
RUM
MO
LAS
SE
S
MOLASSES
SLAVES
CLO
TH
, TR
INK
ETS
TOANGLO-AMERICA
AND THEWESTINDIES
TO ARAB LAND ANDPOINTS NORTH
AND EAST
TO BRAZILAND OTHER
PORTUGUESEPOSSESSIONS
TO BRAZILAND OTHER
PORTUGUESEPOSSESSIONS
ATLANTIC
OCEAN
Tropic of Cancer
Equator
30°80°
10°
0°
20°
60° 30° 10° 0°
20° 10° 0° 10° 0° 40° 50°30°
30°
40°
0°
10°
20°
30°
40°20°10°10°
0
750 1,500 KILOMETERS0
750 1,500 MILES0
750 1,500 KILOMETERS0
750 1,500 MILES
Primary
Secondary
AFRICAN SOURCEAREAS FOR SLAVERY
FIGURE 7-8 Triangular slave pattern. (left) The British initiated a triangular slave trading pattern in theeighteenth century. Cloth, iron bars, and other goods were carried by ship from Britain to Africa to buyslaves. The same ships transported slaves from Africa to the Caribbean islands. The ships then completedthe triangle by returning to Britain with molasses to make rum. Sometimes the ships formed a rectangularpattern by carrying the molasses from the Caribbean islands to the North American colonies, where therum was distilled and shipped to Britain. (right) Slave sources. The British and other European powersobtained slaves primarily from a narrow strip along the west coast of Africa, from Liberia to Angola. In theearly days of colonization, Europeans secured territory along the Atlantic Coast and rarely ventured morethan 160 kilometers (100 miles) into the interior of the continent.
Chapter 7: Ethnicity 213
• East central: From Alabama and eastern Tennessee north toeither Detroit, along U.S. Route 25 (present-day I-75), orCleveland, along U.S. Route 21 (present-day I-77).
• West central: From Mississippi and western Tennesseenorth to St. Louis and Chicago, along U.S. routes 61 and 66(present-day I-55)
• Southwest: From Texas west to California, along U.S. routes80 and 90 (present-day I-10 and I-20).
Southern African Americans migrated north and west in twomain waves, the first in the 1910s and 1920s before and afterWorld War I and the second in the 1940s and 1950s before and
after World War II. The world wars stim-ulated expansion of factories in the1910s and 1940s to produce war materiel,while the demands of the armed forcescreated shortages of factory workers.After the wars, during the 1920s and1950s, factories produced steel, motorvehicles, and other goods demanded incivilian society.
In 1910, only 5,741 of Detroit’s465,766 inhabitants were African Ameri-can. With the expansion of the autoindustry during the 1910s and 1920s, theAfrican American population increasedto 120,000 in 1930, 300,000 in 1950, and500,000 in 1960.
EXPANSION OF THE GHETTO.When they reached the big cities, AfricanAmerican immigrants clustered in theone or two neighborhoods where thesmall numbers who had arrived inthe nineteenth century were already living.These areas became known as ghettos,after the term for neighborhoods inwhich Jews were forced to live in theMiddle Ages (see Chapter 6).
In 1950, most of Baltimore’s quarter-million African Ameri-cans lived in a 3-square-kilometer (1-square-mile) neighbor-hood northwest of downtown (Figure 7-11). The remainderwere clustered east of downtown or in a large isolated housingproject on the south side built for black wartime workers inport industries. Densities in the ghettos were high, with40,000 inhabitants per square kilometer (100,000 per squaremile) common. Contrast that density with the current levelfound in typical American suburbs of 2,000 inhabitants persquare kilometer (5,000 per square mile). Because of theshortage of housing in the ghettos, families were forced to livein one room. Many dwellings lacked bathrooms, kitchens, hotwater, and heat.
African Americans moved from the tight ghettos into imme-diately adjacent neighborhoods during the 1950s and 1960s. InBaltimore, the west side African American area expanded from3 square kilometers (1 square mile) in 1950 to 25 squarekilometers (10 square miles) in 1970, and a 5-square-kilometer(2-square-mile) area on the east side became mainly populatedby African Americans. Expansion of the ghetto continued tofollow major avenues to the northwest and northeast insubsequent decades.
Differentiating Ethnicity and RaceRace and ethnicity are often confused. In the United States, con-sider three prominent ethnic groups—Asian Americans, AfricanAmericans, and Hispanic Americans. All three ethnicities display
Northeast
South
WestMidwest
SanFrancisco
LosAngeles
Cleveland
Boston
PhiladelphiaNew York City
Detroit
Chicago
St. Louis
FIGURE 7-10 African American twentieth-century migration within theUnited States. Migration followed four distinctive channels along the east coast,east central, west central, and southwest regions of the country.
FIGURE 7-9 Sharecroppers. Many African Americans became sharecroppers after slavery was abolished.Fields were rented from a landowner, and rent was paid in crops, in this case cotton from a Georgia farm in 1898.
214 The Cultural Landscape
distinct cultural traditions that originate at particular hearths,but the three are regarded in different ways:
• Asian is recognized as a distinct race by the U.S. Bureau ofthe Census, so Asian as a race and Asian American as anethnicity encompass basically the same group of people.However, the Asian American ethnicity lumps togetherpeople with ties to many countries in Asia.
• African American and black are different groups, although the2000 census combined the two. Most black Americans aredescended from African immigrants and therefore also belongto an African American ethnicity. Some American blacks,however, trace their cultural heritage to regions other thanAfrica, including Latin America, Asia, and Pacific islands.
• The term African American identifies a group with an exten-sive cultural tradition, whereas the term black in principledenotes nothing more than dark skin. Because many Amer-icans make judgments about the values and behavior ofothers simply by observing skin color, black is substitutedfor African American in daily language.
• Hispanic or Latino is not considered a race, so on the cen-sus form members of the Hispanic or Latino ethnicity selectany race they wish—white, black, or other.
The traits that characterize race are those that can be trans-mitted genetically from parents to children. For example, lactoseintolerance affects 95 percent of Asian Americans, 65 percent of
African Americans and Native Americans, and 50 percent of His-panics, compared to only 15 percent of Americans of Europeanancestry. Nearly everyone is born with the ability to produce lac-tase, which enables infants to digest the large amount of lactosein milk. Lactase production typically slackens during childhood,leaving some with difficulty in absorbing a large amount of lac-tose as adults. A large percentage of persons of Northern Euro-pean descent have a genetic mutation that results in lifelongproduction of lactase.
At best, biological features are so highly variable amongmembers of a race that any prejudged classification is meaning-less. Perhaps many tens or hundreds of thousands of years ago,early “humans” (however they emerged as a distinct species)lived in such isolation from other early “humans” that they weretruly distinct genetically. But the degree of isolation needed tokeep biological features distinct genetically vanished when thefirst human crossed a river or climbed a hill.
At worst, biological classification by race is the basis forracism, which is the belief that race is the primary determinantof human traits and capacities and that racial differences pro-duce an inherent superiority of a particular race. A racist is aperson who subscribes to the beliefs of racism.
Race in the United StatesEvery 10 years, the U.S. Bureau of the Census asks people toclassify themselves according to the race with which they mostclosely identify. Americans are asked to identify themselves bychecking the box next to one of the following fourteen races:
• White• Black, African American, or Negro• American Indian or Alaska Native• Asian Indian• Chinese• Filipino• Japanese• Korean• Vietnamese• Other Asian• Native Hawaiian• Guamanian or Chamorro• Samoan• Other Pacific Islander• Other race
If American Indian, Other Pacific Islander, Other Asian, orOther race is selected, the respondent is asked to write in thespecific name.
In 2000 about 75 percent of Americans checked that theywere white, 12 percent black, 4 percent Asian (Asian Indian,Chinese, Filipino, Japanese, Korean, or Vietnamese), 1 percentAmerican Indian or Alaska Native, 0.1 percent Native Hawaiianor other Pacific Islander (including Guamanian and Samoan),and 6 percent some other race. The census permits people tocheck more than one box, and 7 million Americans (2 percent)of the respondents did that in 2000. President Obama is anexample of an American of more than one race. His father wasa black native of Africa and his mother was white.
HAR
FOR
D R
D.
BELAIR
RD.
YO
RK
RD
.
PARK HEIG
HTS AVE.
REISTERSTOWN RD.
LIBERTY HEIGHTS AVE.
EDMONSONORLEANS ST.
AVE.BALTO.
NAT'L. PIKE
895
695
95
95
83
1
1
40
1950
1960
1970
1980
1990
2000
AT LEAST 90%AFRICAN-AMERICAN
BEFORE:
0
1 2 KILOMETERS0
1 2 MILES
FIGURE 7-11 Expansion of African American ghetto in Baltimore, Maryland.In 1950, most African Americans in Baltimore lived in a small area northwest ofdowntown. During the 1950s and 1960s, the African American area expanded tothe northwest, along major radial roads, and a second node opened on the eastside. The south-side African American area was an isolated public housingcomplex built for wartime workers in the nearby port industries.

Chapter 7: Ethnicity 215
“SEPARATE BUT EQUAL” DOCTRINE. In explainingspatial regularities, geographers look for patterns of spatialinteraction. A distinctive feature of race relations in the UnitedStates has been the strong discouragement of spatialinteraction—in the past through legal means, today throughcultural preferences or discrimination.
The U.S. Supreme Court in 1896 upheld a Louisiana lawthat required black and white passengers to ride in separaterailway cars. In Plessy v. Ferguson, the Supreme Court statedthat Louisiana’s law was constitutional because it providedseparate, but equal, treatment of blacks and whites, and equalitydid not mean that whites had to mix socially with blacks.
Once the Supreme Court permitted “separate but equal”treatment of the races, southern states enacted a comprehen-sive set of laws to segregate blacks from whites as much as pos-sible (Figure 7-12). These were called “Jim Crow” laws, namedfor a nineteenth-century song-and-dance act that depictedblacks offensively. Blacks had to sit in the back of buses, andshops, restaurants, and hotels could choose to serve onlywhites. Separate schools were established for blacks andwhites. After all, white southerners argued, the bus got blackssitting in the rear to the destination at the same time as thewhites in the front, some commercial establishments servedonly blacks, and all of the schools had teachers and classrooms.
Throughout the country, not just in the South, house deedscontained restrictive covenants that prevented the owners fromselling to blacks, as well as to Roman Catholics or Jews in someplaces. Restrictive covenants kept blacks from moving into anall-white neighborhood. And because schools, especially at theelementary level, were located to serve individual neighbor-hoods, most were segregated in practice, even if not legallymandated.
“WHITE FLIGHT.” Segregation laws were eliminatedduring the 1950s and 1960s. The landmark Supreme Courtdecision Brown v. Board of Education of Topeka, Kansas, in 1954,found that having separate schools for blacks and whites wasunconstitutional, because no matter how equivalent thefacilities, racial separation branded minority children asinferior and therefore was inherently unequal. A year later, theSupreme Court further ruled that schools had to bedesegregated “with all deliberate speed.”
Rather than integrate, whites fled. The expansion of the blackghettos in American cities was made possible by “white flight,”the emigration of whites from an area in anticipation of blacksimmigrating into the area. Detroit provides a clear example. Blackimmigration into Detroit from the South subsided during the1950s, but as legal barriers to integration crumbled, whites beganto emigrate out of Detroit. Detroit’s white population dropped byabout 1 million between 1950 and 1975 and by another half mil-lion between 1975 and 2000. While whites fled, Detroit’s blackpopulation continued to grow, but at a more modest rate, as aresult of natural increase. In sum, Detroit in 1950 contained about1.7 million whites and 300,000 blacks. The black populationincreased to 500,000 in 1960, 700,000 in 1970, and 800,000 inboth 1990 and 2000, while the white population declined from1.7 million in 1950 to 1.3 million in 1960, 900,000 in 1970,500,000 in 1980, 300,000 in 1990, and 200,000 in 2000.
White flight was encouraged by unscrupulous real estate prac-tices, especially blockbusting. Under blockbusting, real estateagents convinced white homeowners living near a black area tosell their houses at low prices, preying on their fears that blackfamilies would soon move into the neighborhood and cause prop-erty values to decline. The agents then sold the houses at muchhigher prices to black families desperate to escape the over-
crowded ghettos. Through blockbusting, aneighborhood could change from all-whiteto all-black in a matter of months, and realestate agents could start the process allover again in the next white area.
The National Advisory Commissionon Civil Disorders, known as the KernerCommission, wrote in 1968 that U.S.cities were divided into two separate andunequal societies, one black and onewhite. Four decades later, despite seriousefforts to integrate and equalize the two,segregation and inequality persist.
Division by Race in South AfricaDiscrimination by race reached its peak inthe late twentieth century in South Africa.While the United States was repealinglaws that segregated people by race, SouthAfrica was enacting them. The corner-stone of the South African policy was thecreation of a legal system called apartheid(Figure 7-13). Apartheid was the physicalseparation of different races into different
FIGURE 7-12 Segregation in the United States. Until the 1960s in the U.S. South, whites and blacks hadto use separate drinking fountains, as well as separate restrooms, bus seats, hotel rooms, and other publicfacilities.
216 The Cultural Landscape
geographic areas. Although South Africa’s apartheid laws wererepealed during the 1990s, it will take many years to erase theimpact of past policies.
In South Africa, under apartheid, a newborn baby was classifiedas being one of four races—black, white, colored (mixed whiteand black), or Asian. Under apartheid, each of the four races had a
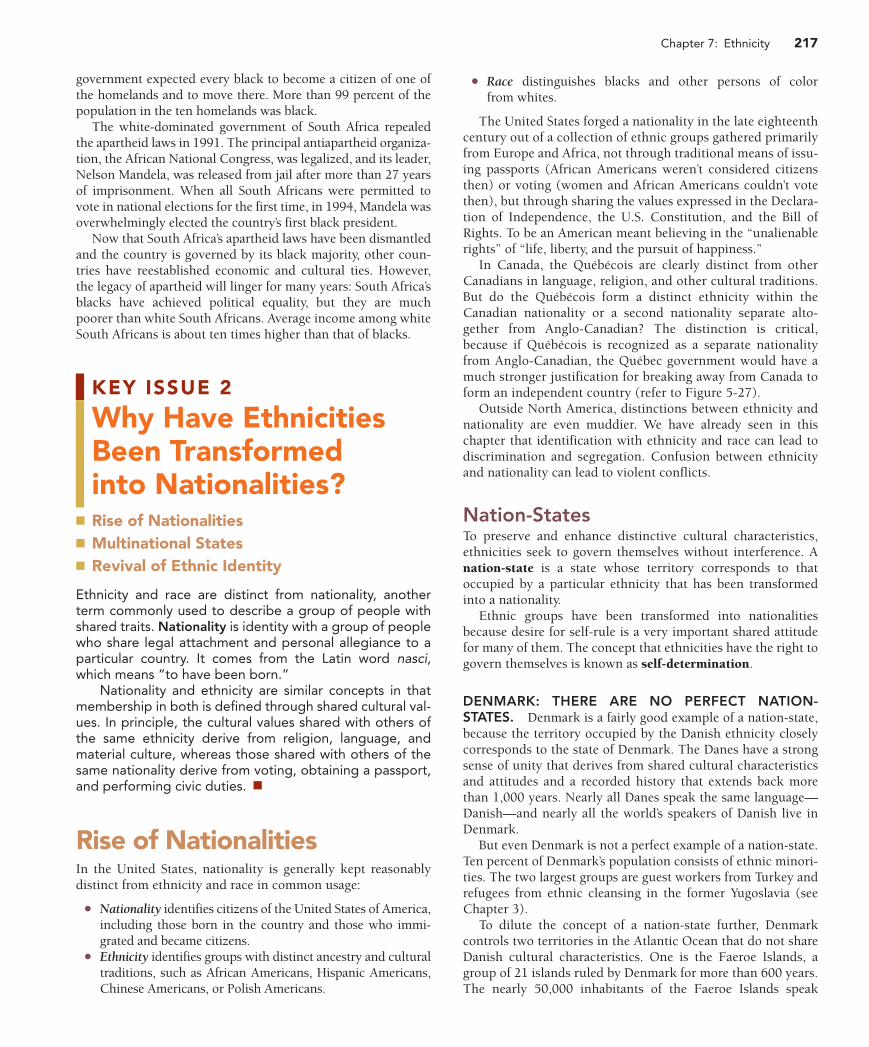
different legal status in South Africa. Theapartheid laws determined where differentraces could live, attend school, work,shop, and own land. Blacks were restrictedto certain occupations and were paid farlower wages than were whites for similarwork. Blacks could not vote or run forpolitical office in national elections. Theapartheid system was created by descen-dants of whites who arrived in SouthAfrica from Holland in 1652 and settled inCape Town, at the southern tip of the terri-tory. They were known either as Boers,from the Dutch word for “farmer,” orAfrikaners, from the word “Afrikaans,” thename of their language, which is a dialectof Dutch.
The British seized the Dutch colonyin 1795, and controlled South Africa’sgovernment until 1948, when theAfrikaner-dominated Nationalist Partywon elections. The Afrikaners gainedpower at a time when colonial rule wasbeing replaced in the rest of Africa by a
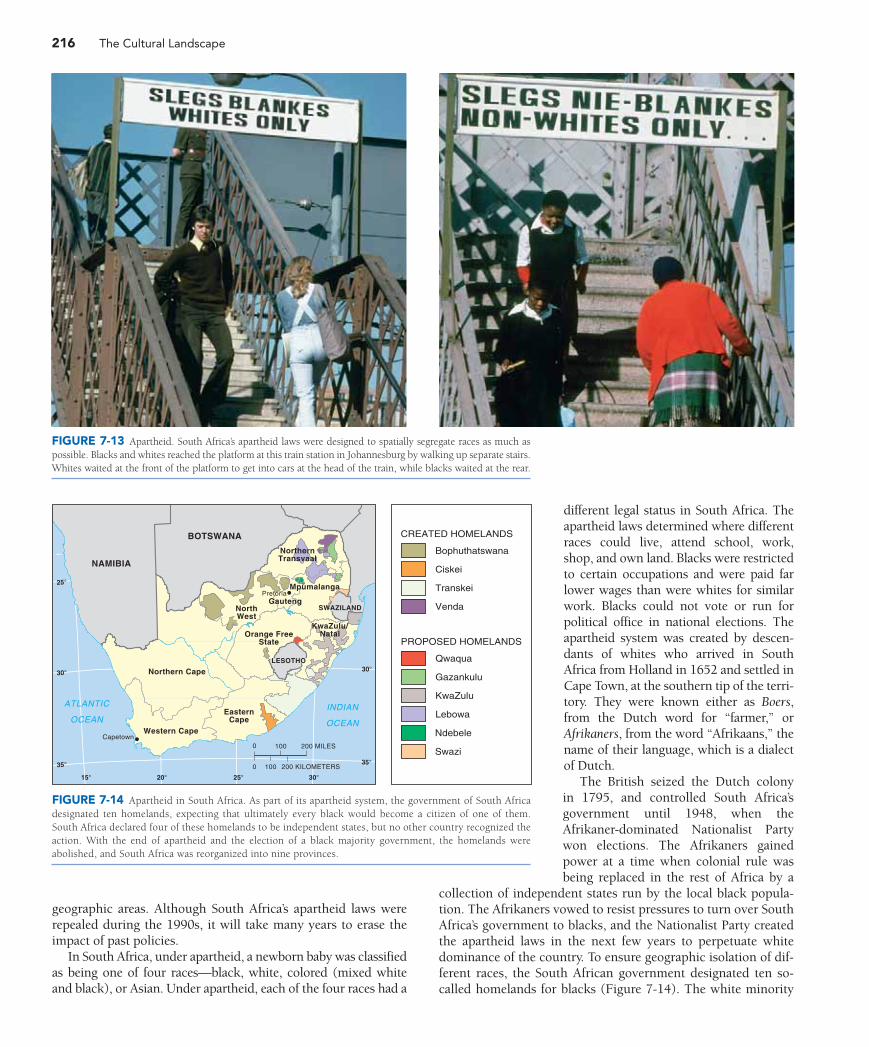
collection of independent states run by the local black popula-tion. The Afrikaners vowed to resist pressures to turn over SouthAfrica’s government to blacks, and the Nationalist Party createdthe apartheid laws in the next few years to perpetuate whitedominance of the country. To ensure geographic isolation of dif-ferent races, the South African government designated ten so-called homelands for blacks (Figure 7-14). The white minority
FIGURE 7-13 Apartheid. South Africa’s apartheid laws were designed to spatially segregate races as much aspossible. Blacks and whites reached the platform at this train station in Johannesburg by walking up separate stairs.Whites waited at the front of the platform to get into cars at the head of the train, while blacks waited at the rear.
Northern Cape
Western Cape
EasternCape
Orange FreeState
GautengNorthWest
NorthernTransvaal
Mpumalanga
KwaZulu/Natal
Capetown
Pretoria
NAMIBIA
BOTSWANA
SWAZILAND
LESOTHO
ATLANTIC
OCEANINDIAN
OCEAN
35°
30°
25°
15° 20° 25° 30°
35°
30°
0
100 200 KILOMETERS0
100 200 MILES
Bophuthatswana
Ciskei
Transkei
Venda
CREATED HOMELANDS
Qwaqua
Gazankulu
KwaZulu
Lebowa
PROPOSED HOMELANDS
Ndebele
Swazi
FIGURE 7-14 Apartheid in South Africa. As part of its apartheid system, the government of South Africadesignated ten homelands, expecting that ultimately every black would become a citizen of one of them.South Africa declared four of these homelands to be independent states, but no other country recognized theaction. With the end of apartheid and the election of a black majority government, the homelands wereabolished, and South Africa was reorganized into nine provinces.
Chapter 7: Ethnicity 217
government expected every black to become a citizen of one ofthe homelands and to move there. More than 99 percent of thepopulation in the ten homelands was black.
The white-dominated government of South Africa repealedthe apartheid laws in 1991. The principal antiapartheid organiza-tion, the African National Congress, was legalized, and its leader,Nelson Mandela, was released from jail after more than 27 yearsof imprisonment. When all South Africans were permitted tovote in national elections for the first time, in 1994, Mandela wasoverwhelmingly elected the country’s first black president.
Now that South Africa’s apartheid laws have been dismantledand the country is governed by its black majority, other coun-tries have reestablished economic and cultural ties. However,the legacy of apartheid will linger for many years: South Africa’sblacks have achieved political equality, but they are muchpoorer than white South Africans. Average income among whiteSouth Africans is about ten times higher than that of blacks.
KEY ISSUE 2
Why Have EthnicitiesBeen Transformed into Nationalities?
■ Rise of Nationalities■ Multinational States■ Revival of Ethnic Identity
Ethnicity and race are distinct from nationality, anotherterm commonly used to describe a group of people withshared traits. Nationality is identity with a group of peoplewho share legal attachment and personal allegiance to aparticular country. It comes from the Latin word nasci,which means “to have been born.”
Nationality and ethnicity are similar concepts in thatmembership in both is defined through shared cultural val-ues. In principle, the cultural values shared with others ofthe same ethnicity derive from religion, language, andmaterial culture, whereas those shared with others of thesame nationality derive from voting, obtaining a passport,and performing civic duties. ■
Rise of NationalitiesIn the United States, nationality is generally kept reasonablydistinct from ethnicity and race in common usage:
• Nationality identifies citizens of the United States of America,including those born in the country and those who immi-grated and became citizens.
• Ethnicity identifies groups with distinct ancestry and culturaltraditions, such as African Americans, Hispanic Americans,Chinese Americans, or Polish Americans.
• Race distinguishes blacks and other persons of colorfrom whites.
The United States forged a nationality in the late eighteenthcentury out of a collection of ethnic groups gathered primarilyfrom Europe and Africa, not through traditional means of issu-ing passports (African Americans weren’t considered citizensthen) or voting (women and African Americans couldn’t votethen), but through sharing the values expressed in the Declara-tion of Independence, the U.S. Constitution, and the Bill ofRights. To be an American meant believing in the “unalienablerights” of “life, liberty, and the pursuit of happiness.”
In Canada, the Québécois are clearly distinct from otherCanadians in language, religion, and other cultural traditions.But do the Québécois form a distinct ethnicity within theCanadian nationality or a second nationality separate alto-gether from Anglo-Canadian? The distinction is critical,because if Québécois is recognized as a separate nationalityfrom Anglo-Canadian, the Québec government would have amuch stronger justification for breaking away from Canada toform an independent country (refer to Figure 5-27).
Outside North America, distinctions between ethnicity andnationality are even muddier. We have already seen in thischapter that identification with ethnicity and race can lead todiscrimination and segregation. Confusion between ethnicityand nationality can lead to violent conflicts.
Nation-StatesTo preserve and enhance distinctive cultural characteristics,ethnicities seek to govern themselves without interference. Anation-state is a state whose territory corresponds to thatoccupied by a particular ethnicity that has been transformedinto a nationality.
Ethnic groups have been transformed into nationalitiesbecause desire for self-rule is a very important shared attitudefor many of them. The concept that ethnicities have the right togovern themselves is known as self-determination.
DENMARK: THERE ARE NO PERFECT NATION-STATES. Denmark is a fairly good example of a nation-state,because the territory occupied by the Danish ethnicity closelycorresponds to the state of Denmark. The Danes have a strongsense of unity that derives from shared cultural characteristicsand attitudes and a recorded history that extends back morethan 1,000 years. Nearly all Danes speak the same language—Danish—and nearly all the world’s speakers of Danish live inDenmark.
But even Denmark is not a perfect example of a nation-state.Ten percent of Denmark’s population consists of ethnic minori-ties. The two largest groups are guest workers from Turkey andrefugees from ethnic cleansing in the former Yugoslavia (seeChapter 3).
To dilute the concept of a nation-state further, Denmarkcontrols two territories in the Atlantic Ocean that do not shareDanish cultural characteristics. One is the Faeroe Islands, agroup of 21 islands ruled by Denmark for more than 600 years.The nearly 50,000 inhabitants of the Faeroe Islands speak