when retailing and las vegas meet: probabilistic free ... · when retailing and las vegas meet:...
TRANSCRIPT
1
When Retailing and Las Vegas Meet:
Probabilistic Free Price Promotions
Nina Mazar*
(University of Toronto)
Kristina Shampanier
(Analysis Group)
Dan Ariely
(Duke University)
*Corresponding author: Nina Mazar, Associate Professor of Marketing, Rotman School of Management,
University of Toronto, 105 St. George Street, Toronto, Ontario M5S 3E6, Canada.
Phone: +1-416-946-5650, Email: [email protected]
Citation: Mazar, Nina, Kristina Shampanier, and Dan Ariely (2015), When Retailing and Las Vegas
Meet: Probabilistic Free Price Promotions, Management Science, forthcoming.
2
When Retailing and Las Vegas Meet:
Probabilistic Free Price Promotions
ABSTRACT
A number of retailers offer gambling or lottery type of price promotions with a chance to receive
one’s entire purchase for free. While these retailers seem to share the intuition that probabilistic free price
promotions are attractive to consumers, it is unclear how they compare to traditional sure price
promotions of equal expected monetary value. We compared these two risky and sure price promotions
for planned purchases across six experiments in the field and in the lab. Together, we found that
consumers are not only more likely to purchase a product promoted with a probabilistic free discount over
the same product promoted with a sure discount but that they are also likely to purchase more of it. This
preference seems to be primarily due to a diminishing sensitivity to the prices. In addition, we find that
the zero price effect, transaction cost, and novelty considerations are likely not implicated.
Keywords: perception, gamble, uncertainty, prospect theory, probability weighting, value, Weber-Fechner
July 19, 2015
Management Science – Judgment and Decision Making Stream
3
Over the years, a number of retailers have offered gambling or lottery type of price
discounts to promote their sales. For example, a few years ago several retailers in New England
promised full refunds to customers who bought their items in the few weeks leading to the
Super Bowl and World Series in the event that the Patriots or the Red Sox, respectively, won. In
the case of Jordan’s furniture, the retailer took in 30,000 orders during the almost 6 weeks long
promotion period in 2007, and one customer, who took advantage of the promotion to buy
furniture for his entire house, ended up getting back $40,000 because the Red Sox won the
World Series (Reed 2007). Similarly, a family-run appliance store retailer in Worcester that
linked its promotion to the win of the Patriots in the Super Bowl 2008 expected that the
gambling-type discount would account for 20% to 30% of its business in that year (Sanders
2008). These conditional price promotions were by design ambiguous in terms of their
probability of occurring.
Most recently three separate retail chains in Germany (Real – a “hyper-store” chain
similar to Walmart in the U.S, Mann Mobilia XXXL – one of the biggest furniture store chains,
and Media Markt – the leading consumer electronics retailer similar to Best Buy in the U.S.) ran
one-week long promotions announcing that every 100th and 10th purchase, respectively, would
be free. In case of the Media Markt campaign in 2010, the probabilistic free price promotion
with its unambiguously defined probabilities was determined end of day of the purchase and
needed to be cashed-in in stores within 14 days after the purchase date (see Figure 1).
------------------------------
Insert figure 1 about here
-------------------------------
The retailers mentioned above seem to share the intuition that a gambling or lottery
type of price promotion is attractive to consumers, which might be based on the observation that
consumer spending on gambling including lotteries is a multibillion-dollar industry (e.g., $98
billion in the US; IBISWorld 2013) and continues to show solid growth. This attraction to risk
can in part be attributed to wishful thinking and wishful betting – the tendency to be
overoptimistic that a desirable future outcome (the big prize) will occur and bet more
aggressively on it (Bar-Hillel and Budescu 1995; Seybert and Bloomfield 2009; Trope, Gervey,
and Liberman 1997)1.
1 For a recent paper that formulates, estimates, and analyzes a model of consumer response to conditional non-free discounts (i.e. there is no chance to get something for free) with ambiguous probabilities linked
4
Despite such intuitions, the vast majority of promotions are not probabilistic;
suggesting that the belief in such pricing mechanisms is far from universal. In addition, it is also
unclear how such probabilistic price promotions that offer something for free (probabilistic free
price promotion) compare with the ubiquitous traditional price promotions (Han, Gupta, and
Lehmann 2001) if the latter offered a sure or fixed discount of equal expected monetary value.
That is, it is unclear whether and why customers would be more, less, or equally attracted to
shopping at a store that offered, for example, a 10% chance to get their purchases for free (with
a 90% chance to pay the regular price) when there are other stores that carry the same items but
offer them at a guaranteed, fixed percentage off. Similarly, there may be situations where a
retailer (e.g., Kayak.com) sells products (e.g., hotel rooms) by some suppliers with a price
promotion and other suppliers without a price promotion, and it is unclear if and why a
probabilistic free price promotion may be more successful in shifting the market share of the
corresponding product than would a sure price promotion. These questions are highly relevant
to marketers (retailers and suppliers alike), who may want to promote some products or stores
over others.
In this paper we investigate under controlled conditions whether, to what extent, and
why for planned purchases a probabilistic free price promotion is preferred to a sure price
promotion of equal expected monetary value (i.e. discount) when the probabilities are
unambiguously defined (similar to the Media Markt example from Germany mentioned above)
and the discount immediately determined and paid out at checkout. Across six experiments we
find that such a probabilistic free price promotion is indeed more attractive. Furthermore, the
preference for the probabilistic free price promotion is fairly robust across various probabilities
of wining and across various product price levels. Finally, we show that this preference is not
driven by an attraction to a zero price, an aversion to transaction cost, or novelty, but rather
primarily due to a diminishing sensitivity to the prices.
STANDARD RATIONAL FUNDAMENTALS: EXPECTED UTILITY THEORY
to a popular sports event occurring (versus sure discounts), see Ailawadi et al. (2014). Ailawadi et al. find that the response to such conditional promotions is highly segmented and related among others to perceived thinking costs, saving benefits, and entertainment benefits, as well as to event involvement and gambling proneness, the latter two of which in particular affect the estimate of the likelihood of the event occurring.
5
Standard expected utility theory predicts that consumers are risk averse2 and will thus
prefer the sure price promotion over a probabilistic free price promotion of equal expected
value. For very small stakes consumers have been shown to be risk neutral (Rabin 2000), which
would imply indifference between the two promotions. Thus, depending on the magnitude of
the stakes, we expect either indifference or a preference for sure discounts.
BEHAVIORAL FUNDAMENTALS
From a behavioral decision theory perspective the differences between the two types of
price promotions can give rise to several types of psychological processes. Moreover, because
of the multitude of these potential psychological processes, it is not clear how the two types of
price promotions will translate into a preference of one type of promotion over the other.
Accounts Favoring the Sure Price Promotion
Uncertainty effect. The “uncertainty effect” (Gneezy, List, and Wu 2006) posits that
because we dislike uncertainty individuals value a risky gain prospect less than its worst
possible outcome (i.e. direct risk aversion; see Newman and Mochon 2012; Simonsohn 2009).
That is, according to the uncertainty effect, people value the probabilistic free price promotion
with its two possible outcomes (best possible outcome: free; worst possible outcome: paying the
regular price) less than paying the regular price. As a result, individuals are expected to value
the probabilistic price promotion less than the sure non-free price promotion of equal expected
discount and act accordingly.
Certainty effect. Similar to the uncertainty effect, the certainty effect as coined by
Kahneman and Tversky (1979, p. 265) posits that “people overweight outcomes that are
considered certain, relative to outcomes, which are merely probable” (for all 0 < p < 1,
π(p)+π(1-p) < 1). Thus, both the uncertainty effect and the certainty effect predict that
consumers would prefer a sure price promotion over a probabilistic price promotion.
2 Although traditionally the terms risk aversion and risk seeking are used to describe concavity and convexity, respectively, of the utility function, we also use these terms to refer to their resulting choice properties. For example, risk seeking refers to an observed preference for a risky option over a sure option of equal expected monetary value.
6
Accounts Favoring the Probabilistic Free Price Promotion
Zero price effect. One factor that could favor the probabilistic price promotion is the
attraction to zero prices. Previous research has shown that promotions that offer something for
free are likely to be evaluated differently (Chandran and Morwitz 2006; Nunes and Park 2003;
Palmeira 2011) than non-free promotions. Building on this work, Shampanier and colleagues
(Shampanier, Mazar, and Ariely 2007) found that people experienced significantly more
positive affect when facing a free offer (the price = $0) compared with other price offers (e.g.,
the price = $0.01 or $0.02), and this disproportionately positive affect led to a larger demand for
zero-priced products than what standard cost-benefit analysis would have predicted. In line with
this account, individuals may find the probabilistic free price promotion more attractive than a
sure price promotion because the former includes an additional positive element, which is the
possibility of getting something for nothing. It is important to note that one other prediction of
this account is that the attraction to the probabilistic free price promotion should be independent
of the price level or the probability p of winning the product for free (which we test directly).
Transaction cost. Similarly to the zero price effect, hassle or transaction cost
considerations would favor the probabilistic free price promotion. This is because winning the
probabilistic free price promotion avoids these costs – there is no need to take out one’s wallet
and pay.
Novelty. Another factor that could favor the probabilistic price promotion is novelty.
Customers may find probabilistic price promotions particularly appealing simply because they
have had no previous encounter with such promotions (for novelty as an arousal inducing
stimulus that increases individuals’ probability of self-exposure to it, see e.g., Berlyne 1970).
As with the zero price effect and an aversion to transaction cost, this factor should lead to an
attraction to the probabilistic price promotion that is independent of the price level or the
probability p of winning the product for free.
Diminishing sensitivity. Another set of predictions can be made based on diminishing
sensitivity. As demonstrated by Tversky and Kahneman’s (1981) seminal experiment, when
participants were asked whether they would travel 20 minutes to purchase a calculator [jacket]
typically priced at $15 [$125] on sale for $10 [$120] they were more willing to travel the 20
minutes for the same $5 discount for the cheaper calculator than for the more expensive jacket.
This finding shows that when evaluating a sure discount, people compare the discounted price
to the regular, full price and behave in a Weber-Fechnerian way (Stigler 1965): displaying
diminishing sensitivity as prices increase – a basic psychophysical principle that is reflected, for
7
example, in the concavity of prospect theory’s gain value function (v(x) = xα, for x >= 0, with α
< 1; see also Thaler, 1980).
Therefore, if individuals display diminishing sensitivity to prices, the perceived value
of the sure discount is the difference in perceived magnitude of the regular, full price versus the
discounted sure price:
(1) V(Sure discount) = (Regular price)α – (Discounted sure price)α.
In a situation in which a customer is choosing between a sure price promotion and a
probabilistic price promotion of equal expected value, and where the probabilistic price
promotion offers a chance p to not pay anything (i.e. “winning”), from (4) it follows
(2) V(Sure discount) = (Regular price)α – ((1-p)*(Regular price))α
= (1 - (1-p)α) * (Regular price)α.
While the evidence on how individuals perceive sure price promotions is rather
convincing (Tversky and Kahneman, 1981), it is an open question how individuals may
perceive the value of probabilistic price promotions (i.e. what happens under uncertainty). If
individuals perceive them in a similar way they perceive sure price promotions (i.e. they focus
on the magnitude of the prices) we would expect the value of the probabilistic discount to be
(3) V(Probabilistic discount) = (Regular price)α
– p*(Discounted probabilistic price)α
– (1-p)*(Regular price)α.
For probabilistic free price promotions (i.e. the discounted probabilistic price = $0) it follows
V(Probabilistic free discount) = (Regular price)α
– (1-p)*(Regular price)α
= p*(Regular price)α
From this it follows, that
8
(4) V(Sure discount) < V(Probabilistic free discount), for all 0 < p <1 and α < 1.3
With these assumptions, individuals should always prefer a probabilistic free price
promotion to a sure price promotion of equal expected value. In other words, if we assume that
individuals display diminishing sensitivity and we are dealing with probabilistic promotions
that include the chance p of getting the purchase for free (otherwise (1-p) chance of paying the
regular price), then we would expect individuals to attach a greater value to the probabilistic
free price promotion than to the sure price promotion of equal expected value. This would hold
true independent of the price level (i.e. for all α < 1: V(Probabilistic free discount)/V(Sure
discount) > 1). Further, the preference for the probabilistic free price promotion, measured as
the ratio V(Probabilistic free discount)/V(Sure discount), is decreasing as the probability of
getting the product for free increases (i.e. p è 1). The solid line in figure 2A depicts the
preference ratio for diminishing sensitivity α = .88 (see parameter estimation in Tversky and
Kahneman 1992; figure 2B depicts the difference between the two price promotions’ values).
------------------------------
Insert figure 2 about here
-------------------------------
Diminishing sensitivity and probability weighting. A modification to diminishing
sensitivity could come from adding a component based on the probability value function of
Kahneman and Tversky’s (1979) prospect theory. Specifically, Kahneman and Tversky (1979)
describe decision weights of probabilities π(p) such that small probabilities are generally
overweighted (π(p) > p; the probability weighting function is concave) and large probabilities
are underweighted (π(p) < p; the probability weighting function is convex). The dashed line in
figure 2A displays the predicted preference ratio of the probabilistic free price promotion to the
sure price promotion based on Prelec’s (1998, p. 505) probability weighting function π(p) =
exp[-β*(-ln p)γ], with β = 1 and γ = .65, and with diminishing sensitivity α = .88 (see parameter
estimation in Tversky and Kahneman, 1992; figure 2B depicts the difference of the two price
promotion’s values). As can be seen, with these parameter assumptions, individuals should
attach a greater value to the probabilistic price promotion over the sure price promotion of equal
3 Equation (4) is true if and only if 1-(1-p)α < p, which is equivalent to 1-p < (1-p)α, which is true for all 0 < p <1 and α < 1.
9
expected value for most probabilities. Another prediction of this perspective is that the
preference for the probabilistic price promotion, measured as the ratio V(Probabilistic free
discount)/V(Sure discount) is decreasing as the probability of getting the product for free
increases (i.e. p è 1). Unlike the case with dimishing sensitivity only (i.e. no decision weights),
the decrease, however, is much sharper. Yet another prediction of this perspective is that the
preference will reverse (i.e. V(Probabilistic free discount)/V(Sure discount) < 1) to a preference
for the sure price promotion for p > .76.
PREVIOUS CONSUMER BEHAVIOR RESEARCH ON PROBABILISTIC PROMOTIONS
The literature most relevant to the work presented here is on ambiguity. Specifically,
most recently, Goldsmith and Amir (2010) focused on sales promotions that promised
consumers to either receive a less valued (bag of un-popped popcorn) or a more valued product
gift (a can of soda) with the purchase of a candy bar – without disclosing the probabilities of
receiving either gift. In their incentive compatible experiment in an on-campus snack shop, the
authors observed a higher purchase rate for the promoted candy bar when the gift was more
valued than when it was less valued. More importantly, the purchase rate of the candy bar,
when coupled with a promotion that was ambiguously defined as either of the two (less or more
valued) gifts, did not differ from when coupled with a more valued gift promotion (the three
types of promotions were run separately; one condition at a time). The authors suggested that
their findings were due to wishful thinking, which made customers focus on the best option of
the ambiguously defined promotion. Extrapolating Goldsmith and Amir’s (2010) findings from
the product promotions domain to our price promotions domain and from unknown to known
probabilities, a probabilistic price promotion that offered, for example, a 10% chance to get a
purchase for free and a 90% chance to pay the regular price would cause consumers to focus on
the best possible outcome (“free”). As a consequence, such a probabilistic price promotion
would be as effective, and, thus, cheaper for a retailer, than simply offering a product for free
with certainty. That is, individuals would value the risky prospect same as its best possible
realization – a conclusion that may not be intuitive and is in opposition to the prediction of the
uncertainty effect. However, if true, then a probabilistic discount would also be superior to a
certain discount of equal expected monetary value (e.g., 10% off the regular price for sure).
In other related work Dhar, Gonzalez-Vallejo, and Soman (1995; see also 1999) tested
in an incentive compatible experiment in an on-campus store whether an imprecisely stated
price promotion (e.g., “around X% off”) was more or less successful in increasing the market
10
share of a candy bar than a precisely stated price promotion (“X% off”), (the authors ran only
one type of promotion at a time). While not the main focus of their work, their three precise
discount-conditions (“20% off” vs. “25% chance of saving 80%” vs. “80% chance of saving
25%”) allow for the equal expected monetary value-type of comparison that we are focusing on.
Interestingly, and unlike to the extrapolation from Goldsmith and Amir’s (2010) findings, Dhar
and colleagues (1995, 1999) found a null-effect. That is, they found no significant difference in
the market shares of a candy bar when offered with either of these three price promotions,
implying that probabilistic price promotions do not differ in their attraction from sure price
promotions of equal expected monetary value or discount.
OVERVIEW OF EXPERIMENTS
Given the mixed predictions based on existing theories as well as findings from
previous research in marketing, it is unclear if, how, and why a probabilistic price promotion
with a chance to get one’s purchase for free differs from a sure price promotion of equal
expected monetary value – questions that should be of importance for marketers that are trying
to improve on their price promotion strategies. The current paper addresses this question for
planned purchases through a series of five incentive-compatible experiments in the field
(Experiments 1, 2, and 3) and in the laboratory (Experiment 4), and two hypothetical online
experiments (Experiments 5a and 5b) across products of varying regular, full price levels ($0.75
to $200). The paper concludes with a discussion of the theoretical and practical implications, its
limitations, as well as several potential directions for future research.
The general set-up in Experiments 1 to 4 was such that we offered consumers a choice
between a probabilistic price promotion and a sure price promotion of equal expected monetary
value (joint valuation setting) at the point of purchase and we measured the percent of
purchases made with a probabilistic price promotion choice. In Experiments 5a and 5b
promotions were offered separately (separate valuation setting), one at a time, and we measured
the percent of purchases made (traffic) as well as the average consumer demand (basket size).
Except for Experiment 1, we presented participants with the following information:4
- for the probabilistic price promotion: p% chance of paying the discounted
probabilistic price (e.g., $0) and (1-p)% chance of paying the regular price;
4 In all experiments, except for Experiment 1, probabilities were presented as percentages. The discounted probabilistic free price was typically presented as both $0 as well as “free.”
11
- for the sure price promotion: 100% chance of paying the discounted sure price, that is,
p% off the regular price.
In addition, we randomized the order in which we presented offers. Unless reported otherwise,
no conditions, measures, or subjects were dropped from the experiments reported in this paper.
EXPERIMENT 1: VENDING MACHINE
For our first experiment we purchased a vending machine (see Figure S1 in the
Supplementary Materials & Methods) that we placed next to two existing vending machines
centrally located in a student lounge where they were frequented by students, faculty, and staff
members on a regular basis. Our vending machine had 10 buttons for candies. We stacked the
vending machine with five types of candy – two buttons each: Snickers, M&M’s, Twix, 3
Musketeers, and Starburst. The vending machine was opaque (individuals could not see the
inside) and the candies were represented with a picture and their price placed right next to each
of the ten buttons. All candies retailed at a regular, full price of $0.75 (same as the candies of
the other two vending machines in the lounge). A candy’s price also appeared on the display
when people pressed a button. The vending machine could sell only one candy at a time.
Procedure
We manipulated the prices for the candy over time and recorded the sales volume. Our
experiment consisted of three two-week-periods. For the first two weeks (“before period”) and
the last two weeks (“after period”) we offered the candy at the regular price of $0.75 each.
Between these two periods we ran a two-week-long sales promotion in which we offered two
different types of price promotions: A sure price promotion offering 33% off the regular price
(consumers had to pay a discounted sure price of $0.50 for a candy) and a probabilistic price
promotion that required consumers to first pay the regular price $0.75 for a candy but offered a
33% chance to get their money back when the candy was released (the money was wrapped
around the candy)5. Both types of promotions offered an expected discount or “gain” of $0.25.
The two promotions were offered simultaneously with a sign prominently displayed on eye
level on the front of the vending machine announcing and color-coding both types of
promotions (see Figure 3). Since each type of candy occupied two buttons of the vending
5 The vending machine was stocked to produce a random sequence for the probabilistic discount as opposed to, for example, a free candy every third purchase.
12
machine, one button (with a green sticker) represented the sure price promotion and the other
button (red sticker) represented the probabilistic free price promotion. Thus, consumers could
decide which promotion they wanted by pressing the corresponding button (for more details see
Supplementary Materials & Methods).
------------------------------
Insert figure 3 about here
-------------------------------
Results and Discussion
First, the promotion proved very successful: sales increased from 83 candies in the
“before period” to 204 candies during the promotion period. After our promotion ended, sales in
the “after period” went back to 81 candies. Second and more importantly, during the promotion
period we sold almost 50% more candy with the probabilistic price promotion (120 candies)
compared to sales with the sure price promotion (84 candies). In other words, of the 204 candies
sold during the promotion period 59% were purchased with the probabilistic free promotion and
41% were purchased with the sure promotion, and this ratio was significantly different from an
equal split (χ2(1, N = 204) = 6.353, p = .012)6.
EXPERIMENT 2: DIFFERING PROBABILITIES AT A LOCAL VIDEO STORE
Our first experiment with the vending machine shows that when offered a choice
between the two types of promotions, consumers are more likely to choose the probabilistic
(risky) free price promotion than the traditional, sure price promotion. Next, we examined the
robustness of the attraction to the probabilistic free price promotion across a range of
probabilities and with a higher priced-product for which the prices and discounts are less likely
considered “peanuts”. Previous research (see e.g., Prelec and Loewenstein 1991; Weber and
Chapman 2005) has shown that for small stake gains at at least medium probabilities (p > 10%)
to win, people become less risk averse than for large stake gains. Furthermore, for sufficiently
small gains of less than $1, Markowitz (1952) posited that people might even become risk
6 We are assuming independence of observations for the chi-square test but, in actuality, we were not able to track and thus, ensure that each of our purchase observations was made by a unique customer.
13
seeking7. Thus, if we found that for choices where the sure discount was greater than $1 we
continue to observe an attraction to the probabilistic free price promotion (i.e. significantly
more than 50% choose it), the findings can be less likely considered an artifact of the “peanuts”
effect.
In addition, given the promotional sign on the vending machine, we might have
attracted some consumers that originally didn’t intend to purchase a candy. Similarly, some of
the higher sales volume for probabilistic free price promotion-candy in Experiment 1 could
have been due to individual customers purchasing more than one candy due to the “windfall” of
getting a candy for free (i.e. making additional unplanned purchases on top of their planned
purchase rather than the probabilistic free price promotion attracting more of the planned
purchases than the sure price promotion). Thus, we attempted to replicate our findings in a more
controlled setting where we could limit the quantity eligible for discount to one item by
customer and ensure that customers learned about the promotions only once they were at the
checkout counter. For this purpose, we conducted our experiment at a local video rental store
where a DVD rental cost $4.50.
Procedure
Three hundred and twenty-five customers in a local video rental store were informed at
checkout by experimenters disguised as staff that the store had a special price promotion valid
for one DVD movie per customer. Customers were told that they could choose between two
types of price promotions: a sure promotion and a probabilistic promotion, and that if they
chose the probabilistic promotion they would have to roll a die in order to find out if they had to
pay $0 (discounted probabilistic price) or $4.50 (regular price).
Using either a 6-sided or 10-sided die, we manipulated the probabilities of winning
between customers on five different levels: 10%, 33%, 50%, 67%, and 90%, with the expected
discounts $0.45, $1.50, $2.25, $3, and $4.05, respectively (see table 1). The conditions were run
one at a time, one hour each, with a 30-minutes break between conditions. By design, the
experimenters knew which condition they were running at any given point in time but they were
not aware of any hypotheses. The experiment was conducted over several days. Each day
included all the conditions in a randomized order.
7 As Weber and Chapman (2005) report, it is not clear whether people actually become risk seeking. Further, risk seeking is not a necessary requirement of the “peanuts effect” (Prelec and Loewenstein 1991).
14
Results and Discussion
The percentages of customers choosing the probabilistic price promotion rather than the
sure price promotion are presented in figure 4, and the chi-square test results for the difference
from an equal split in table 1. As can be seen, contrary to what standard rational fundamentals
and the uncertainty and certainty effects would predict the probabilistic free price promotion
attracted significantly more customers than the sure price promotion at all but one discount
level: all they way up to and including p = 67% (customers’ choice between the two promotions
at the p = 90% level was not significantly different from an equal split). First, these results
replicate the findings from Experiment 1 for a more expensive product and over a wider range
of probabilities with expected discounts greater than $1 (i.e. for p > 10%). Thus, we conclude
that our findings are less likely an artifact of the “peanuts effect” (Prelec and Loewenstein
1991).
------------------------------
Insert figure 4 about here
-------------------------------
Second, we observed a general decrease in the attraction to the probabilistic price
promotion relative to the sure price promotion as the probabilities of winning and the expected
discounts increased (nominal logistic regression parameter estimate for probability level p as
continuous variable B = -1.1, SE = .43, χ2 = 6.48, p = .01). This downward sloping-trend
counters the zero price effect, transaction cost, and novelty effects as sole drivers of the
attraction to the probabilistic free price promotion, as each of those explanations would require
the attraction to remain constant across probability levels.
------------------------------
Insert table 1 about here
-------------------------------
Third, the fact that we don’t see a sharp decline in the attraction of the probabilistic free
price promotion and that we don’t observe any probability level p at which people significantly
prefer the sure price promotion over the probabilistic free price promotion, suggests that
15
individuals’ preferences are largely affected by a diminishing sensitivity to the prices and less
so by decision weights (compare results in table 1 and figure 4 to figure 2).
The following two experiments further examine possible causes underlying the apparent
boost to people’s risk seeking in purchases with probabilistic free price promotions.
EXPERIMENT 3: ZERO AS A SPECIAL PRICE AND TRANSACTION COST
Experiment 3 was designed to test if customers’ attraction to the probabilistic free price
promotion was boosted at all by positive affective utility associated with a free offering or by an
aversion to transaction cost. Following Shampanier and colleagues’ (2007) experimental design,
we set out to test this possibility by comparing the attraction to the probabilistic price promotion
across conditions in which the best possible outcome of the probabilistic price promotion either
involved a chance to get something for free (discounted probabilistic price = $0) or a chance to
pay a small but relatively insignificant amount (discounted probabilistic price > $0). If the
attraction to the probabilistic price promotion is driven solely by the affective utility associated
with a zero price or lower transaction cost due to a chance to not having to take out one’s wallet
and pay, the attraction should be significantly lessened or eliminated once the best possible
outcome of the probabilistic price promotion does not offer a chance of getting the product for
free but requires to pay a small price.
Procedure
The experiment was conducted at the same local video rental store and with a similar
procedure as in experiment 2. That is, customers were informed at checkout by experimenters
disguised as staff that the store had a special promotion valid for one DVD movie per customer
(regular price = $4.50) and that they could choose between two types of promotions: a sure
promotion that guaranteed a discounted sure price of $4 (i.e. 11% or $0.50 off the regular price)
and a probabilistic price promotion. The probabilistic price promotion was presented as one of
the following, depending on the condition8:
1) 11% chance to pay a discounted price of $0 and
89% chance to pay the regular price of $4.50,
8 Due to rounding, the expected values of the probabilistic price promotions are not exactly $0.50. They are $0.495 in condition 1, $0.494 in condition 2, and $0.495 in condition 3.
16
2) 12% chance to pay a discounted price of $0.38 and
88% chance to pay the regular price of $4.50, or
3) 13% chance to pay a discounted price of $0.69 and
87% chance to pay the regular price of $4.50.
That is, we manipulated the chance of winning the probabilistic price promotion between
customers on three different levels (p = 11%, 12%, and 13%, respectively) while keeping the
expected value of the discounts at $0.50 across all three levels (unlike in Experiment 2 where
the expected value of the discount increases as p increases) and across both the probabilistic and
sure price promotion options.
The three conditions were run one at a time, one hour each, with a 30-minutes break
between conditions. The experiment was conducted over the course of one day with 163
customers. The order of the conditions was randomized and the probabilistic price promotion
was carried out by having customers “pull” the handle of a digital slot machine on a laptop.
Results and Discussion
Independent of whether the probabilistic price promotion offered a chance to get the
DVD for free or not, customers significantly preferred the probabilistic price promotion over
the sure price promotion: 73% (p = 11% free condition 1: χ2(1, N = 55) = 11.364, p < .001),
75% (p = 12% non-free condition 2: χ2(1, N = 55) = 13.255, p < .001), and 77% (p = 13% non-
free condition 3: χ2(1, N = 53) = 15.868, p < .001). More importantly, we compared the
percentage of customers choosing the probabilistic price promotion over the sure price
promotion across the three conditions. A nominal logistic regression revealed no significant
difference between the three conditions (χ2(2, N = 163) = .313, p = .856, R2 = .002).
One possible explanation of our findings is that the two discounted probabilistic non-
zero prices ($0.38 and $0.69) were perceived as zero prices. However, given that the zero price
effect was shown for the difference between $0 and $0.01 (Shampanier et al. 2007), this
explanation does not seem likely. Rather, we interpret our findings to suggest that the
preference for the probabilistic free price promotion is substantial and not dependent on the
attraction of a zero price or an aversion to transaction cost.
Figure 5 displays predictions based on only diminishing sensitivity α = .88 (Tversky
and Kahneman, 1992) as well as diminishing sensitivity α = .88 and Prelec’s (1998) probability
weighting function π(p) = exp [-β * (-ln p)γ], with β = 1 and γ = .65. Focusing on the preference
ratios depicted in Figure 5A, a surprising observation to make again is that the slope of our
17
findings may be better explained by diminishing sensitivity to prices without weighted
probabilities.
------------------------------
Insert figure 5 about here
-------------------------------
EXPERIMENT 4: REPLICATION AND NOVELTY
Experiment 4 conceptually replicates experiment 2 with several extensions. First, it
examines the generalizability of the attraction of the probabilistic free price promotion to a
more expensive product, a Rotring pen sold at a regular, full price of $10. Second, it tests a
more fine-grained set of probabilities of winning the probabilistic free price promotion (13 p-
levels from 5% to 95%) to further support the shape of the attraction to the probabilistic price
promotion-curve observed in experiment 2. Third, it contrasts individuals’ choices between the
probabilistic free and sure price promotion with their choices between risky monetary gain
gambles and sure monetary gains of equal expected surplus. Forth, this experiment was run in
the laboratory as within-subject design, with one of participants’ decisions carried out for real,
to assess whether the attraction to the probabilistic free price promotion received at all a boost
from being novel to some individuals. Work by Berlyne (e.g., Berlyne 1970; Berlyne and
Parham 1968) suggests that novelty as an arousal inducing stimulus and its hedonic value
decrease in the face of prolonged repetition of exposure to the novel stimulus and its preference
judgment. In fact, most recent work by Dijksterhuis and Smith (2002) shows that affective
adaptation even happens with subliminal exposure. Thus, while a probabilistic free price
promotion may have been novel to participants at the beginning of the series of preference
judgments, we would expect novelty and its resulting attraction to the probabilistic free price
promotion to decline over the duration of the experiment due to affective adaptation9.
Procedure
9 Given the work by Berlyne (e.g., Berlyne 1970; Berlyne and Parham 1968) as well as Dijksterhuis and Smith (2002) it is reasonable to argue that our participants would experience affective adaption even without each decision being played out for real before the onset of the next trial. That is, for affective adaption to happen it is not necessary for participants to experience winning or losing with the probabilistic free price promotion before they make the next decision.
18
The computer-based experiment was part of a one hour-long experimental session
consisting of several studies. The payment for participation in the session was $10. According
to the recruiting flyer and consent form, participants expected to leave the session with an
average compensation of $12-$18 in cash and/or in kind and knew they could withdraw from
participation at any point during the experimental session.
The experiment started with a screening question asking participants whether they were
interested in the possibility to purchase either a Rotring pen worth $10 [pictures of the pen in
different colors were displayed on the screen] or a $10 gift certificate for Amazon.com [a
picture of the gift certificate was displayed on the screen] for real with their own money. Only
participants who indicated to be interested proceeded to the experiment. Eighty-two students
participated in this experiment.
The instructions of the experiment explained that participants would face 52 decisions,
and that at the end of the experiment, one of the 52 decisions would be randomly selected and
their choice for that decision carried out for real. Participants were presented with 52 choices
each between a risky option and a sure option (of equal expected value) in terms of either a
price promotion on a purchase of a $10 Rotring pen, a price promotion on a purchase of a $10
gift certificate for Amazon.com, monetary gains of up to $10, or monetary losses of up to $10.
For each of our four stimuli (pen, gift certificate, monetary gain, monetary loss) we varied the
probabilities of “winning” the risky option on 13 levels (i.e. p = 5%, 10%, 20%, 30%, 33%,
40%, 50%, 60%, 67%, 70%, 80%, 90%, 95%). For example, for the p = 60% level price
promotions domain, participants were offered a choice between a probabilistic free price
promotion with a 60% chance of paying $0 [(1-p) = 40% chance of paying the regular price of
$10] and a sure price promotion that required to pay $4 [i.e. 60% off the regular price of $10].
For the 60% level monetary gain domain, participants were offered a choice between a gamble
for a monetary gain with a 60% chance of getting $10 [(1-p) = 40% chance of getting $0] and a
sure monetary gain of $6. The expected surplus / discounts in these two choice sets were the
same, $6. Figure 6 displays prospect theory’s predictions for the monetary gain domain
(assuming diminishing sensitivity α = .88 and probability weighting with π(p) = exp [-1 * (-ln
p).65] applied to all gains). As can be seen, prospect theory predicts that the participants prefer
the probabilistic monetary gain over the sure monetary gain for small probabilities, their
preference however is expected to decline quickly, and for p > 24.54%, we expect a preference
reversal with a preference for the sure monetary gain over the probabilistic monetary gain for
medium and large probabilities. Thus, for most probabilities we expect to find lower risk
19
seeking for monetary gains than for purchases with a price promotion (compare figures 6 and
2).
------------------------------
Insert figure 6 about here
-------------------------------
The 52 decisions were split into 4 blocks of 13 by stimuli. The blocks were randomized
in order, as well as the 13 decisions within each block. In addition, we counterbalanced between
subjects whether the risky option was displayed to the left or right side of the sure option. The
entire experiment had a 4 (stimuli) x 13 (probabilities) within-subject randomized-block design.
In the following, we focus on only 26 decisions: the 13 decisions about the purchase of the
Rotring pen and the 13 decisions about monetary gains. For a full account including all four
within-subject conditions, see the Supplementary Materials & Methods.
Results
Figure 7 displays the percentage of participants choosing the risky option over the sure
option (i.e. their risk seeking) on each of the 13 probability levels for the two domains (Rotring
pen with price promotion as well as monetary gain). As can be seen, for each of the 13
probability levels, despite equivalent expected surplus, participants were more risk seeking in
the price promotion domain than in the monetary gain domain. In addition, the observed risk
seeking for the monetary gains followed to some extend the predicted pattern in figure 6 (for
winning probability p > 20%, participants no longer preferred the probabilistic monetary gain to
the sure monetary gain).
------------------------------
Insert figure 7 about here
-------------------------------
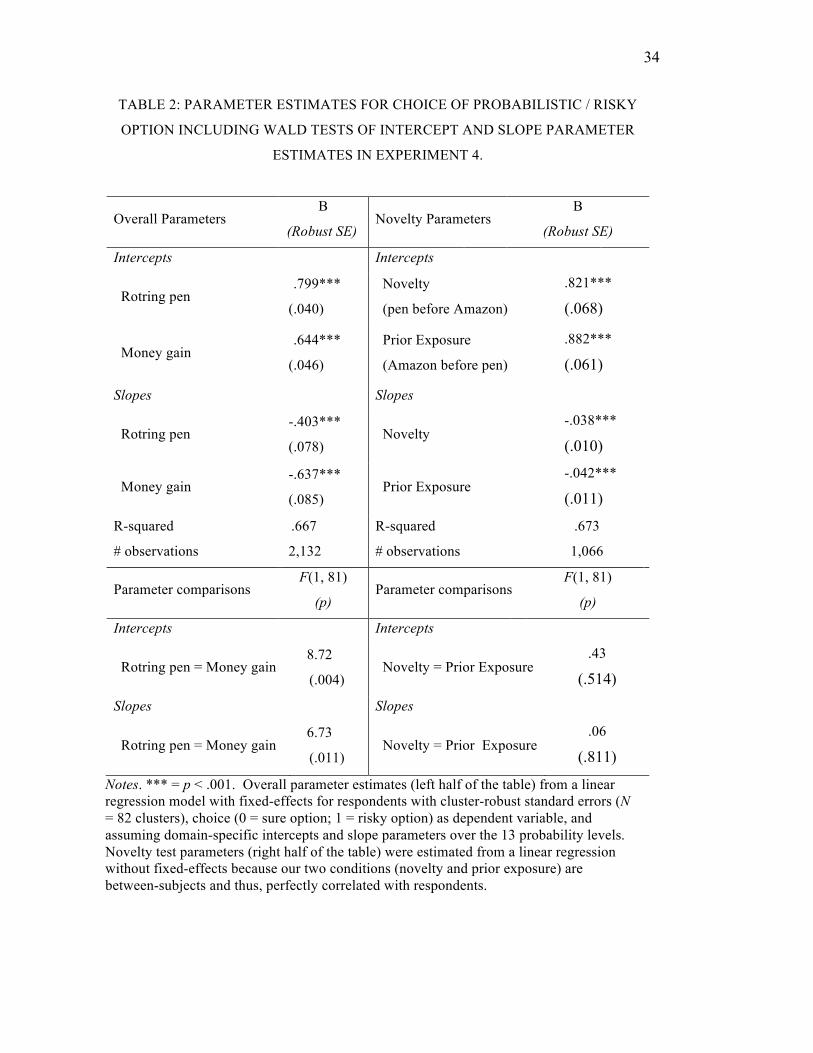
Table 2, left half shows the parameter estimates from a linear regression model with
fixed-effects for respondents (i.e. a dummy variable for each participant, excluding one) and
cluster-robust standard errors, choice (0 = sure option; 1 = risky option) as dependent variable,
and assuming domain-specific intercepts and slope parameters over the 13 probability levels.
20
The regression model constant was excluded. To further support our observation from figure 7
that participants’ risk seeking behaviors differed by domain (Rotring pen purchase with price
promotion and monetary gain), we performed pairwise Wald tests comparing the two intercept
and slope parameter estimates to each other (see left half in table 2). The results revealed that
the intercept and slope parameter estimates for the Rotring pen and monetary gain were
significantly different from each other, suggesting that participants’ risk seeking behavior was
indeed higher for the purchase with a price promotion-domain than for the monetary gain-
domain despite equivalence in expected surplus. Further, same as in experiment 2, all the way
up to the winning probability p = 67% the preference for the probabilistic price promotion over
the sure price promotion was significantly different from an equal 50:50 split (all ps < .05; for
winning probabilities p ≥ 70% no significant difference from equal 50:50 split, all ps > .3).
------------------------------
Insert table 2 about here
-------------------------------
Finally, we can examine whether the attraction to the probabilistic free price promotion
for the Rotring pen was boosted by novelty. For that we can take advantage of the fact that
individuals made 2 (blocks: Rotring pen and Amazon.com gift certificate) x 13 (probabilities)
repeated choices in the price promotions domain and examine participants’ risk seeking for the
Rotring pen purchase when its block came before (i.e. novelty, N = 494) or after (i.e. previous
exposure: N = 572) having encountered the probabilistic price promotion-block for the
Amazon.com gift certificate. As can be seen in figure 8 and the right half of table 2, we did not
find support for the novelty (aka adaption) hypothesis. For the most part, it seems that
participants’ were equally or less likely to choose the probabilistic free price promotion for the
Rotring pen when this was their first as opposed to second probabilistic free price promotion
block-encounter. That is, the attraction to the probabilistic free price promotion, if at all,
increased with more exposure (see non-significant difference of intercept and slope parameters
in pairwise Wald tests in right half of table 2).
------------------------------
Insert figure 8 about here
-------------------------------
21
Discussion
Together, the results of experiment 4 replicate the findings from experiment 2 with a
more fine-grained set of probabilities of winning the probabilistic free price promotion and a
more expensive product: individuals generally prefer a probabilistic free price promotion over
an equal expected value sure price promotion across a wide range probabilities.
The downward slopping trend suggests that the effect can’t be solely due to the zero
price effect, transaction cost considerations, or novelty. Additionally, the comparison of
participants’ choices in the first versus their second free price promotion block-encounter
further demonstrates that novelty is likely not the decisive factor for the observed attraction to
the probabilistic free price promotion: participants’ attraction does not decrease over the course
of the within-subject design with its multiple trials.
The direct comparison of participants’ choices in the monetary gain domain and the
price promotion domain in figure 7 shows that participants were significantly more risk seeking
(i.e. more likely to chose the risky option) in the context of price promotions than in the context
of monetary gains. Participants’ observed behavior for monetary gains largely followed
prospect theory’s predicted pattern (compare dashed lines in figures 7 and 6). Similarly, the
behavior observed in the price promotion domain can be sufficiently explained by individuals’
diminishing sensitivity to the prices with or without weighted probabilities (compare solid line
in figure 7 to solid and dashed lines in figure 2).
EXPERIMENT 5: SEPARATE EVALUATION SETTING
Experiments 1 – 4, the main focus of this paper, revealed that when consumers face a
choice (joint evaluation setting) between a sure price promotion and a probabilistic free price
promotion of equal expected discount for the same product, they overwhelmingly choose the
probabilistic price promotion (risky option).
In what follows, we expand our focus and present two hypothetical experiments with
substantially more expensive products (hotel rooms sold at a regular, full price of $200 per
night) in which we examine the effectiveness of the two types of promotions in separate
evaluation settings. That is, we examine their effectiveness in an indirect choice paradigm with
two different products (adopted from Gneezy et al. 2006) where one product is promoted and
another product is not. We do this to broaden the generalizability of our findings and examine
if, when a company wants to temporarily promote one of their products over others (e.g.,

22
Procter & Gamble deciding to promote their Pantene shampoos but not their Herbal Essences
shampoos), offering a probabilistic free price promotion versus a sure price promotion makes a
difference in terms of market shares. Specifically, we test whether the probabilistic free price
promotion is likely to attract more consumers (increase traffic; experiment 5a) and encourage
greater spending (basket size; experiment 5b) than a sure price promotion – two measures of
great importance for marketers.
The findings from experiments 1 – 4 support the conclusion that when comparing sure
and probabilistic free price promotions people focus on the magnitude of the prices. In addition,
because in these joint evaluation settings we offered the two types of promotions for the same
product, the product itself became irrelevant (non discriminatory), making prices and discounts
particularly salient. In the new, separate evaluation setting in Experiments 5a and 5b, because
we now also make the product become a discriminatory attribute, the impact of prices and
discounts relative to the product may be reduced. However, as long as prices and discounts
continue to be discriminatory, we would continue to expect an attention to prices and thus,
based on our previous theoretical reasoning with diminishing sensitivity (see Behavioral
Fundamentals section) higher demand for the probabilistic free price promotion than the sure
price promotion.
In addition, previous research has shown that joint versus separate evaluation settings
change the way people evaluate options (Hsee, Loewenstein, Blount & Bazerman 1991). The
underlying evaluability hypothesis posits that attributes that are relatively difficult compared to
relatively easy to evaluate independently have a lesser impact in separate than in joint
evaluation settings; while easy-to-evaluate attributes remain equally impactful. Our separate
evaluation setting in Experiments 5a and 5b removes the comparison price promotion (e.g., a
probabilistic free price promotion-product is now compared to a non-promotion-product rather
than to another sure price promotion-product). Given that prices and discounts are considered to
be relatively easy-to-evaluate attributes, they therefore continue to be salient attributes. Thus,
again, we would continue to expect to find the probabilistic free price promotion to attract more
demand than the sure price promotion.
Procedure
23
Four hundred (experiment 5a) and five hundred (experiment 5b) participants in the
United States were recruited through Amazon’s Mechanical Turk (MTurk10) in exchange for 30
cents to complete a short vacation study on Qualtrics.
Participants were randomly assigned to one of five between-subject conditions, in
which they were asked to imagine they were going on a 7-days vacation to Spain and were
debating between a culture vacation in the city of Barcelona and a beach vacation in a coastal
resort approximately 100 miles south of Barcelona. They were told that they went on
Kayak.com to compare hotel prices and have found one four star hotel in Barcelona and one
four star hotel in the beach resort, both offered at a regular, full price of $200 per night, that
they would consider staying at. They were then presented with regular or discounted prices per
night for those two hotels and asked to indicate in experiment 5a, which vacation (Barcelona
city hotel or beach resort hotel) they would choose and in experiment 5b, how many of the
seven days, if any at all, they would book at each place. That is, in each condition participants
needed to make a decision between the Barcelona city hotel and the beach resort hotel.
The price per night for the beach resort hotel was kept at the regular, full price of $200
across all conditions, while the price of the Barcelona city hotel was varied across conditions to
either be $200 (control condition) or discounted such that the expected discount was $20. There
were three discounted price conditions for the Barcelona city hotel: a sure price promotion
condition with a discounted price of $180, a probabilistically free price promotion condition
with a 10% chance of not paying anything and 90% chance of paying the regular, full price of
$200, and a probabilistically non-free price promotion condition with a 20% chance of paying a
discounted price of $100 and 80% chance of paying the regular, full price of $200. Finally, we
added an exploratory fifth condition in which we told participants that the Barcelona city hotel
offered a choice between a sure price promotion (with a discounted price of $180) and a 10%
probabilistic free price promotion (with a 10% chance of paying $0 and 90% chance of paying
the regular, full price of $200; choice condition). In this exploratory condition, in experiment
5b, if participants indicated they wanted to spend one or more days at the Barcelona city hotel,
on the next page they were asked to choose between the sure and probabilistic free price
promotion for the Barcelona city hotel11.
10 For an examination of the demographic makeup of MTurk participants and the quality of the data obtained with that sample see e.g., Buhrmester, Kwang, and Gosling 2011; Paolacci, Chandler, and Ipeirotis 2010. 11 That is, unlike in the other conditions, in this condition participants had to engage in a two-step decision making-process. This second step was not existent in Experiment 5a.
24
Participants were randomly assigned to one of the five conditions. Upon indicating how
they would want to spend their 7-days vacation, participants in both experiments were asked to
indicate how much, in general, they liked beach vacations and city vacations (on 9-point scales
each), their gender, age, ethnicity, and highest finished degree. The survey ended with an
attention question that we planned to use to exclude participants if wrongly answered (for all
questions see Supplementary Materials & Methods).
In what follows we present and discuss our findings excluding the exploratory fifth
condition. For a full account of the data and results see Supplementary Materials & Methods.
Experiment 5a – Results
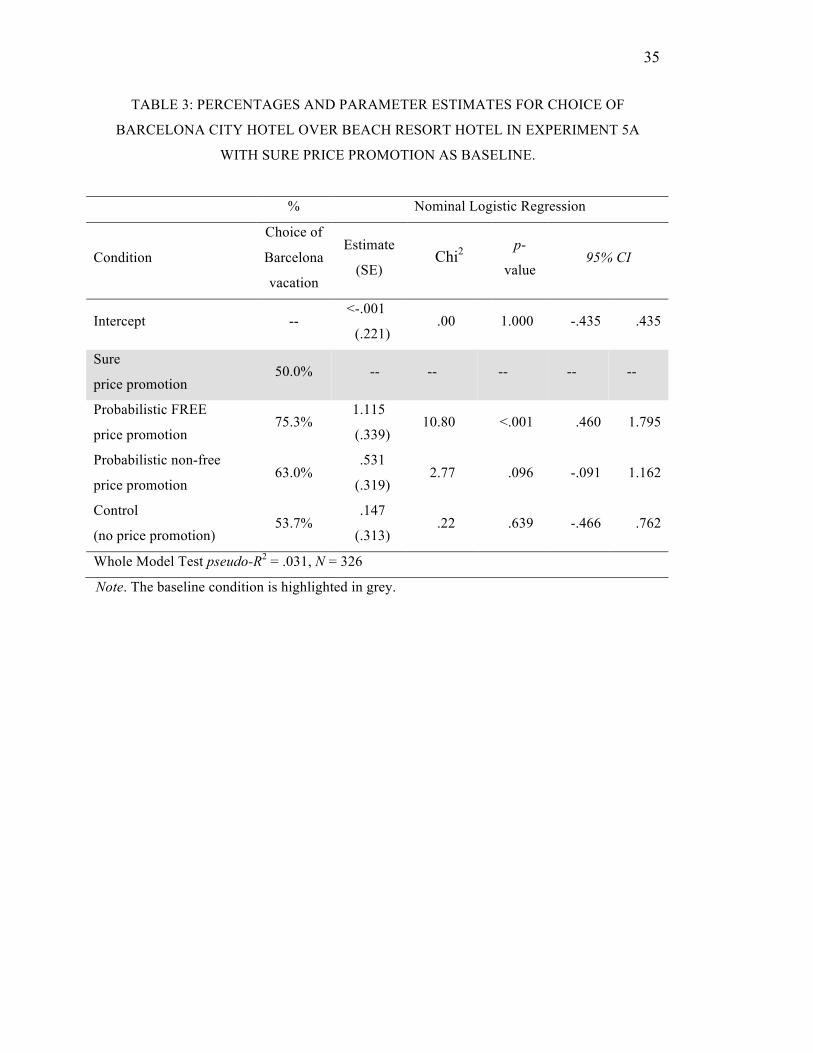
Table 3 shows the parameter estimates from a nominal logistic regression model with
choice (0 = beach resort vacation; 1 = Barcelona city vacation; N = 326) as dependent variable,
the sure price promotion condition as baseline and the remaining three conditions as
independent variables (dummy coded with 1 = condition, 0 = not this condition). As can be
seen, significantly more participants choose the Barcelona city vacation over the beach resort
vacation when the Barcelona city hotel was offered with a probabilistic free price promotion
(75.3%) than when it was offered with a sure price promotion (50.0%). Interestingly, no
promotion for the Barcelona city hotel (control: 53.7%) was not less successful than offering a
sure promotion (50.0%).
------------------------------
Insert table 3 about here
-------------------------------
The difference between the two probabilistic price promotions (non-free: 63.0% vs. free
price: 75.3%) was only marginally significant (χ2(1, N = 162) = 2.908, p = .088), same as the
difference between the probabilistic non-free price promotion (63.0%) and the sure price
promotion (50.0%, see table 3). Figure 9 displays predictions based on only diminishing
sensitivity α = .88 (Tversky and Kahneman, 1992) as well as diminishing sensitivity α = .88 and
Prelec’s (1998) probability weighting function π(p) = exp [-β * (-ln p)γ], with β = 1 and γ = .65.
As in experiment 3, a suprising observation to make is that our findings seem best explained by
diminishing sensitivity to prices without weighted probabilities.

25
------------------------------
Insert figure 9 about here
-------------------------------
Finally, an ANOVA found no significant effect of our conditions on how much
participants liked a city vacation over a beach vacation (M =.01, SD = 2.71, F(3, 322) = 1.622, p
= .184; for means and standard deviations by condition see Table S5 in the Supplementary
Materials & Methods).
Experiment 5b – Results
An overall ANOVA revealed a significant difference of condition on number of days
booked at the Barcelona city hotel: F(3, 405) = 7.515, p < .001. Table 4 shows the parameter
estimates from a linear regression model with number of days booked at the Barcelona city
hotel as dependent variable, the sure price promotion condition as baseline and the remaining
three conditions as independent variables (dummy coded with 1 = condition, 0 = not this
condition). As can be seen, participants (N = 409) booked significantly more days at the
Barcelona city hotel when it was offered with a probabilistic free price promotion (M = 4.53
days, SD = 1.97) than when it was offered with a sure price promotion (M = 3.83 days, SD =
1.83, t(405) = 2.731, p = .007), a probabilistic non-free price promotion (M = 3.97 days, SD =
1.84, t(405) = 2.197, p = .029), or no price promotion (M = 3.34 days, SD = 1.54, t(405) =
4.715, p < .001). The difference between the probabilistic non-free price promotion (M = 3.97
days) and the sure price promotion (M = 3.83 days, t(405) = 0.555, p = .579) was not
significantly different. Finally, an ANOVA found no significant effect of our conditions on how
much participants liked a city vacation over a beach vacation (M = -.19, SD = 2.84, F(3, 405) =
.831, p = .478; for means and standard deviations by condition see Table S5 in the
Supplementary Materials & Methods).
------------------------------
Insert table 4 about here
-------------------------------
26
Discussion
Together, the results of experiment 5a and 5b suggest that even for fairly expensive
products and in a separate valuation setting, the probabilistic free price promotion can be
superior to a sure price promotion of equal expected discount. The findings are particularly
powerful as they show that the probabilistic free price promotion in comparison to the sure
price promotion may not only encourage more people to make a planned purchase (i.e. increase
the number of customers) but also the average customer to spend more money (i.e. increase the
average basket size per customer)12.
GENERAL DISCUSSION
What type of price promotion is more attractive to customers: a probabilistic price
promotion that offers a chance p to get one’s selected products for free, and a chance (1-p) to
pay the regular, full price or a certain price promotion of equal expected discount? Across four
incentive compatible experiments (experiments 1 – 4 : three in the field and one in the lab) we
considered consumers’ choices between sure and probabilistic free price promotions (joint
valuation setting) and demonstrated that consumers consistently, over a range of probabilities
(5% – 95%), products (candy, DVD rental, Rotring pen), expected discounts, and regular prices
($0.75, $4.50, and $10) preferred the probabilistic free price promotion to the sure price
promotion. In addition, extending our findings from the joint valuation settings, experiments 5a
and b showed in hypothetical, separate valuation settings with even more expensive products
(hotel rooms; regular price = $200), that the probabilistic free price promotion can also increase
demand for a product and do so significantly better than the sure price promotion in two ways:
by attracting more consumers (i.e. traffic) and by increasing the average demand of consumers
(i.e. their basket size). Together our experiments demonstrate that a probabilistic free price
promotion can be a powerful promotions-tool to attract more purchases.
From a theoretical perspective, our findings extend previous research on psychological
pricing by showing that they cannot be explained by the uncertainty or certainty effect. In
addition, our results don’t seem to be driven by an attraction to zero prices, transaction cost
aversion or novelty. Instead, our findings can be best explained by the assumption that
12 Note, in this separate valuation-setting, the inferiority of the sure price promotion to the probabilistic free price promotion could also be in part due to the sure discount undermining perceptions of quality, which free offers are believed less likely to do (see e.g., Chandran and Morwitz 2006; Darke and Chung 2005).
27
individuals behave in a Weber-Fechnerian way: they display diminishing sensitivity (α < 1) to
the prices.
LIMITATIONS AND FUTURE RESEARCH
Several of our findings are worth further examination. First we did not find any
evidence for the uncertainty effect (Gneezy, List, and Wu 2006; Newman and Mochon 2012;
Simonsohn 2009), which would have favored the sure price promotion. One of the fundamental
differences we found was that in those uncertainty effect studies where participants were asked
to choose between a sure versus a probabilistic option, the (un)certainty was in windfall (i.e.
there was no cost involved for participants) rewards. For example, in one of Gneezy et al.’s
(2006; section IV) choice task conditions participants were asked to choose between a sure
monetary reward (100 shekels) and a lottery that would payout one of two possible products of
differing values (a 50% chance at a 200 shekel gift certificate and a 50% chance at a 400 shekel
gift certificate for a books store). Seventy four percent of their participants choose the sure 100
shekels, while only 43% of participants did so when the alternative was a sure 200 shekel gift
certificate. By contrast, in our setting, the (un)certainty was in the prices that consumers paid in
exchange for a good.
Note also that in Dhar and colleagues’ (1995, 1999) research, which we presented in the
section “Previous Consumer Behavior Research on Probabilistic Promotions,” participants were
asked to choose between a sure versus a probabilistic option where the (un)certainty was in the
percent discounts that consumers would receive when making a payment. By contrast, in our
setting the (un)certainty was in the absolute prices that consumers would pay. Dhar et al. (1995,
1999) did not find any difference in the attraction of the sure versus risky option. Given the
differences between our findings, the uncertainty effect findings by Genezy et al. (2006) and the
findings by Dhar et al. (1995, 1999), one avenue for future research could be to examine to
what extent the type of focal attribute (e.g., reward, absolute price, or % discount) and context
(e.g., whether there is a purchase transaction and as such a cost to the consumer) influences
consumers’ decision-making process and, ultimately, preferences (i.e. they become risk averse,
risk seeking, or risk neutral).
The zero price effect is another factor that we found no evidence as being a
fundamental driver of the attraction to the probabilistic free price promotion. One possibility is
that the excessive attraction to the zero price reported in Shampanier and colleagues’ (2007)
was not apparent in our probabilistic setup because the zero price represents only one of two

28
possible price outcomes, and therefore the zero price effect does not apply. In the original work
on the zero price effect, the authors argued that when there is a zero price option that does not
have any downside (i.e. no cost), individuals experience a positive affective reaction, which acts
as a decision-making cue (i.e. the cause of the zero price effect is the affective component). In
the probabilistic free price promotion, however, there is a downside or cost: a chance to pay the
regular price . In addition, choosing between a non-free offer and a free offer arguably requires
less cognitive resources than choosing between a non-free sure offer and a risky offer of two
possible outcomes: one free (discounted probabilistic price of $0) and one non-free (regular
price of >$0). This aspect is critical because in their zero price paper (see Experiment 6)
Shampanier and colleagues (2007) showed that making more cognitive and deliberate
evaluations of alternatives eliminates the zero price effect due to a lower weight on affective
evaluations. Future work could validate this distinction.
An additional research opportunity may stem from our surprising findings in
experiments 2,3, and 5, which suggest that diminishing sensitivity without probability
weighting predicts the observed pattern of preferences for probabilistic free price promotions
better than diminishing sensitivity with probability weighting. Future research may want to
examine if and why individuals don't appear to weight probabilities in probabilistic price
promotions as they have been shown to do in simple monetary gambles.
Finally, it remains an open question how robust the attraction of the probabilistic price
promotion is to different types of framing. For example, in three pricing experiments, Yang and
colleagues (2013) found that participants’ willingness to pay for a risky “product,” for example
a gift certificate for a Barnes and Noble bookstore that has a 50% chance to have a $50 value
and a 50% chance to have a $100 value, is substantially reduced when it is labeled instead as a
gamble, lottery, raffle, or coin flip with two outcomes. The authors posit that this is due to an
aversion to bad deals, which causes buyers to shift their focus of attention on risk and the worst
possible outcome. In our experiments we did not present the risky option as a gamble but as a
price promotion. In addition, our consumers engaged in a choice task typical for purchase
situations rather than a pricing task. Future research may want to examine to what extent the
bad deal aversion also applies to choice tasks and thus, may reduce the attraction of the
probabilistic free price promotion over the sure price promotion when the former is framed in
terms of a gamble. The question of such potential boundary conditions is of great practical
importance for marketers.
29
REFERENCES
Ailawadi, K. L., K. Gedenk, T. Langer, Y. Ma, S. A. Neslin. 2014. Consumer response to
uncertain promotions: An empirical analysis of conditional rebates. International Journal of
Research in Marketing 31(1), 94–106,
Bar-Hillel, M., D. Budescu. 1995. The Elusive Wishful Thinking Effect. Think. Reasoning 1(1)
71–103.
Berlyne, D. E. 1970. Novelty, Complexity, and Hedonic Value. Perception & Psychophysics.
8(5A) 279–286.
Berlyne, D. E., L. C. C. Parham. 1968. Determinants of Subjective Novelty. Perception &
Psychophysics. 3 415–423.
Buhrmester, M., Kwang, T., Gosling, S. D. 2011. Amazon’s Mechanical Turk: A new source of
inexpensive, yet high-quality data? Perspect. Psych. Sci. 6(1) 3–5.
Chandran, S., V. Morwitz. 2006. The Price of ‘Free’-dom: Consumer Sensitivity to Promotions
with Negative Contextual Influences. C. Pechmann, L. Price eds. Advances in Consumer
Research Volume 33. Association for Consumer Research, Duluth, MN, 250.
Darke, P. R., C. M. Y. Chung. 2005. Effects of pricing and promotion on consumer perception:
it depends on how you frame it. J Retailing 81(1) 35–47.
Dhar, S. K., C. Gonzalez-Vallejo, D. Soman. 1995. Brand Promotions as a Lottery. Market.
Lett. 6(3) 221–233.
Dhar, S. K., C. Gonzalez-Vallejo, D. Soman. 1999. Modeling the Effects of Advertised Price
Claims: Tensile Versus Precise Claims? Market. Sci. 18(2) 154–177.
Dijksterhuis, A., P. K. Smith. 2002. Affective Habituation: Subliminal Exposure to Extreme
Stimuli Decreases Their Extremity. Emotion. 2(3) 203–214.
30
Gneezy, U., J. A. List, G. Wu. 2006. The Uncertainty Effect: When a Risky Prospect is Valued
Less than its Worst Possible Outcome. Q J Econ 121(4): 1283-1309.
Goldsmith, K., O. Amir. 2010. Can Uncertainty Improve Promotions? J. Marketing Res. 47(6)
1070–1077.
Han, S., S. Gupta, D. R. Lehmann. 2001. Consumer price sensitivity and price thresholds. J
Retailing. 77(4) 435–456.
Hsee, C. K., G. F. Loewenstein, S. Blount, M. H. Bazerman. 1991. Preference reversals
between joint and seperate evaluations of options: A review and theoretical analysis. Psych
Bulletin. 125 576 – 590.
IBISWorld (2013). Lotteries and Native American Casinos Market Research Report, NAICS
71329, June 2013.
Kahneman, D., A. Tversky. 1979. Prospect Theory: An Analysis of Decision under Risk.
Econometrica 47(2) 263–291.
Markowitz, H. 1952. The utility of wealth. J Political Econ. 60(2) 151–158.
Newman, G.E., D. Mochon. 2012. Why are lotteries valued less? Multiple tests of a direct risk-
aversion mechanism. Judgm. Decis. Mak. 7(1), 19–24.
Nunes, J. C., C. W. Park. 2003. Incommensurate Resources: Not Just More Of The Same. J.
Marketing Res. 40(4) 26–38.
Palmeira, M. O. 2011. The zero-comparison effect. J. Consumer Res. 38(1), 16–26.
Paolacci, G., Chandler, J., and Ipeirotis, P. G. 2010. Running experiments on Amazon
Mechanical Turk. Judgm. Decis. Mak. 5(5) 411–419.
Prelec, D. 1998. The probability weighting function. Econometrica. 66(3) 497–527.
31
Prelec, D., G. Loewenstein. 1991. Decision making over time and under uncertainty: A
common approach. Manage. Sci. 37(7) 770–786.
Rabin, M. 2000. Risk Aversion and Expected-Utility Theory: A Calibration Theorem.
Econometrica 68(5) 1281–1292.
Reed, K. 2007. Jordan's Shoppers Sitting Pretty If Sox Win. The Boston Globe, October 23.
http://boston.com/sports/baseball/redsox/articles/2007/10/23/jordans_shoppers_sit-
ting_pretty_if_sox_win/.
Sanders, R. 2008. Patriots Win Could Mean Free TV's at Local Store. WBZTV.COM, January
30. http://wbztv.com/sports/New.England.Patriots.2.641683.html.
Seybert, N., R. Bloomfield. 2009. Contagion of Wishful Thinking in Markets. Manage. Sci.
55(5) 738–751.
Shampanier, K., N. Mazar, D. Ariely. 2007. Zero as a Special Price: The True Value of Free
Products. Market Sci. 26(6) 742–757.
Simonsohn, U. 2009. Direct risk aversion: Evidence from risky prospects valued below their
worst outcome. Psych. Sci. 20(6), 686–692.
Stigler, G. 1965. Essays in the history of economics. University of Chicago Press, Chicago, IL.
Thaler, R. 1980. Toward a Positive Theory of Consumer Choice. J. Econ. Behav. Organ. 1(1)
39–60.
Trope, Y., B. Gervey, N. Liberman. 1997. Wishful Thinking From a Pragmatic Hypothesis-
Testing Perspective. M. S. Myslobodsky eds. The Mythomanias: The Nature of Deception and
Self-Deception. Lawrence Erlbaum, Mahway, NJ, 105–131.
Tversky, A., D. Kahneman. 1981. The Framing of Decisions and the Psychology of Choice.
Science. 211(4481) 453–458.
32
Tversky, A., D. Kahneman. 1992. Advances in Prospect Theory: Cumulative Representation of
Uncertainty. J. Risk Uncertainty 5(4) 297–323.
Weber, B. J., G. B. Chapman. 2005. Playing for peanuts: Why is risk seeking more common for
low-stakes gambles? Organ. Behav. Hum. Dec. 97(1), 31–46.
Yang Y., J. Vosgerau, G. Loewenstein. 2013. Framing Influences Willingness to Pay but Not
Willingness to Accept. J. Marketing Res. 50(6), 725–738.

33
TABLE 1: CUSTOMERS’ CHOICES BETWEEN THE PROBABILISTIC FREE AND SURE
PRICE PROMOTIONS IN THE FIVE BETWEEN-SUBJECTS CONDITIONS IN
EXPERIMENT 2.
Condition
Probabilistic
free price
promotion
prices
Sure price
promotion
price
% of customers
choosing the
probabilistic
free price
promotion
Chi-square
(df, N)
p-value
10%
10%: $0
90%: $4.50
$4.05
(10% off $4.50)
76% 19.059
(1, 68)
<.001
33%
33%: $0
67%: $4.50
$3
(33% off $4.50)
68% 8.067
(1, 60)
.005
50%
50%: $0
50%: $4.50
$2.25
(50% off $4.50)
68% 8.727
(1, 66)
.003
67%
67%: $0
33%: $4.50
$1.50
(67% off $4.50)
66% 6.452
(1, 62)
.011
90%
90%: $0
10%: $4.50
$0.45
(90% off $4.50)
55% 0.710
(1, 69)
.399
Notes. The test results indicate the probability that the percent of customers choosing the probabilistic free price promotion is different from the 50% chance level.
34
TABLE 2: PARAMETER ESTIMATES FOR CHOICE OF PROBABILISTIC / RISKY
OPTION INCLUDING WALD TESTS OF INTERCEPT AND SLOPE PARAMETER
ESTIMATES IN EXPERIMENT 4.
Overall Parameters B
(Robust SE) Novelty Parameters
B
(Robust SE)
Intercepts Intercepts
Rotring pen .799***
(.040)
Novelty
(pen before Amazon)
.821***
(.068)
Money gain .644***
(.046)
Prior Exposure
(Amazon before pen)
.882***
(.061)
Slopes Slopes
Rotring pen -.403***
(.078) Novelty
-.038***
(.010)
Money gain -.637***
(.085) Prior Exposure
-.042***
(.011)
R-squared .667 R-squared .673
# observations 2,132 # observations 1,066
Parameter comparisons F(1, 81)
(p) Parameter comparisons
F(1, 81)
(p)
Intercepts Intercepts
Rotring pen = Money gain 8.72
(.004) Novelty = Prior Exposure
.43
(.514)
Slopes Slopes
Rotring pen = Money gain 6.73
(.011) Novelty = Prior Exposure
.06
(.811)
Notes. *** = p < .001. Overall parameter estimates (left half of the table) from a linear regression model with fixed-effects for respondents with cluster-robust standard errors (N = 82 clusters), choice (0 = sure option; 1 = risky option) as dependent variable, and assuming domain-specific intercepts and slope parameters over the 13 probability levels. Novelty test parameters (right half of the table) were estimated from a linear regression without fixed-effects because our two conditions (novelty and prior exposure) are between-subjects and thus, perfectly correlated with respondents.
35
TABLE 3: PERCENTAGES AND PARAMETER ESTIMATES FOR CHOICE OF
BARCELONA CITY HOTEL OVER BEACH RESORT HOTEL IN EXPERIMENT 5A
WITH SURE PRICE PROMOTION AS BASELINE.
% Nominal Logistic Regression
Condition
Choice of
Barcelona
vacation
Estimate
(SE) Chi2
p-
value 95% CI
Intercept -- <-.001
(.221) .00 1.000 -.435 .435
Sure
price promotion 50.0% -- -- -- -- --
Probabilistic FREE
price promotion 75.3%
1.115
(.339) 10.80 <.001 .460 1.795
Probabilistic non-free
price promotion 63.0%
.531
(.319) 2.77 .096 -.091 1.162
Control
(no price promotion) 53.7%
.147
(.313) .22 .639 -.466 .762
Whole Model Test pseudo-R2 = .031, N = 326
Note. The baseline condition is highlighted in grey.
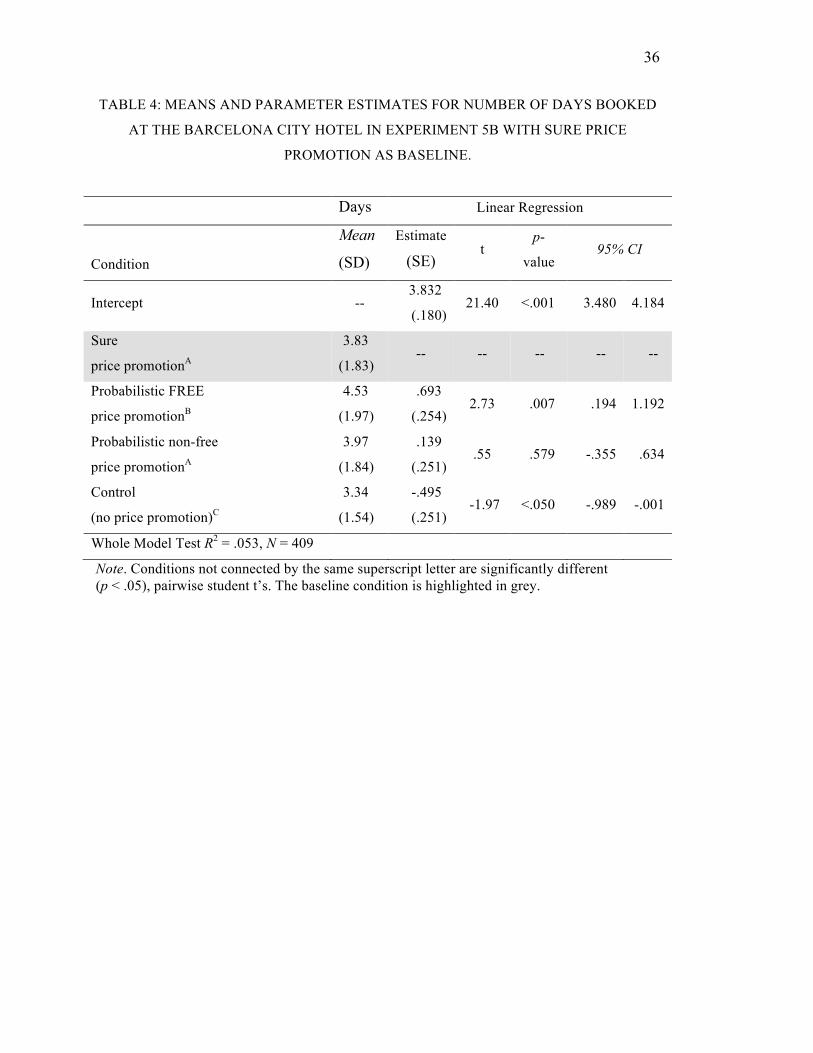
36
TABLE 4: MEANS AND PARAMETER ESTIMATES FOR NUMBER OF DAYS BOOKED
AT THE BARCELONA CITY HOTEL IN EXPERIMENT 5B WITH SURE PRICE
PROMOTION AS BASELINE.
Days Linear Regression
Condition
Mean
(SD)
Estimate
(SE) t
p-
value 95% CI
Intercept -- 3.832
(.180) 21.40 <.001 3.480 4.184
Sure
price promotionA
3.83
(1.83) -- -- -- -- --
Probabilistic FREE
price promotionB
4.53
(1.97)
.693
(.254) 2.73 .007 .194 1.192
Probabilistic non-free
price promotionA
3.97
(1.84)
.139
(.251) .55 .579 -.355 .634
Control
(no price promotion)C
3.34
(1.54)
-.495
(.251) -1.97 <.050 -.989 -.001
Whole Model Test R2 = .053, N = 409
Note. Conditions not connected by the same superscript letter are significantly different (p < .05), pairwise student t’s. The baseline condition is highlighted in grey.
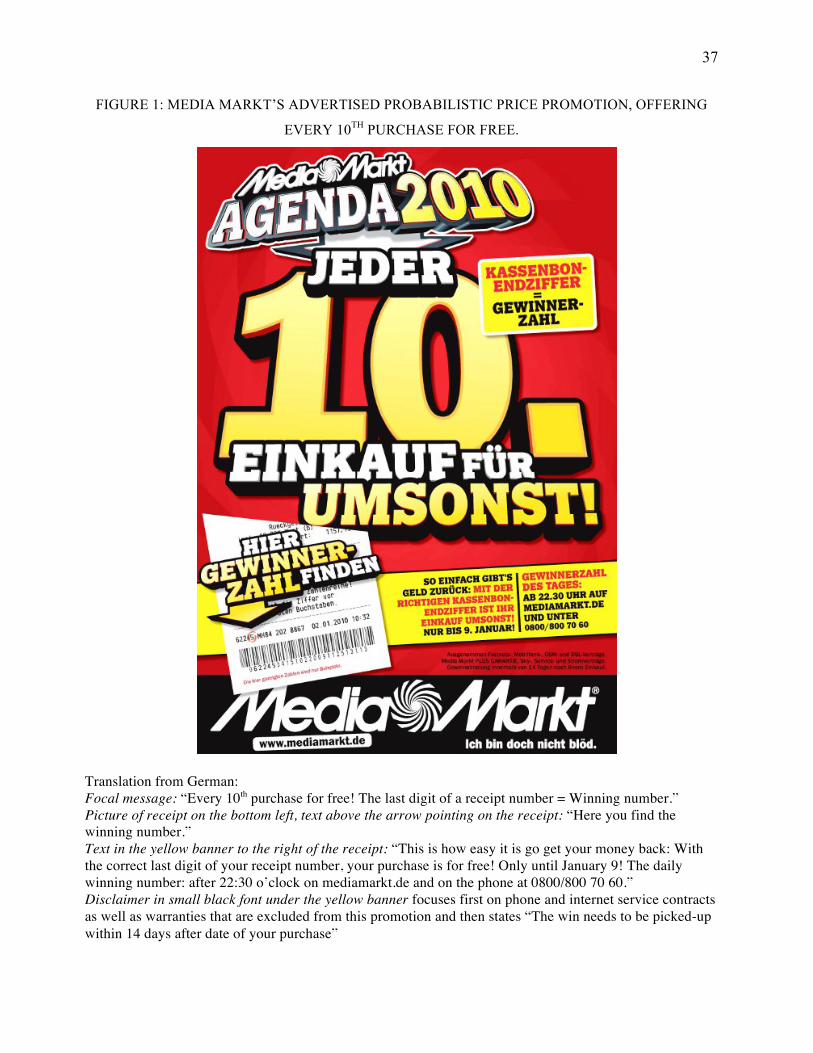
37
FIGURE 1: MEDIA MARKT’S ADVERTISED PROBABILISTIC PRICE PROMOTION, OFFERING
EVERY 10TH PURCHASE FOR FREE.
Translation from German: Focal message: “Every 10th purchase for free! The last digit of a receipt number = Winning number.” Picture of receipt on the bottom left, text above the arrow pointing on the receipt: “Here you find the winning number.” Text in the yellow banner to the right of the receipt: “This is how easy it is go get your money back: With the correct last digit of your receipt number, your purchase is for free! Only until January 9! The daily winning number: after 22:30 o’clock on mediamarkt.de and on the phone at 0800/800 70 60.” Disclaimer in small black font under the yellow banner focuses first on phone and internet service contracts as well as warranties that are excluded from this promotion and then states “The win needs to be picked-up within 14 days after date of your purchase”
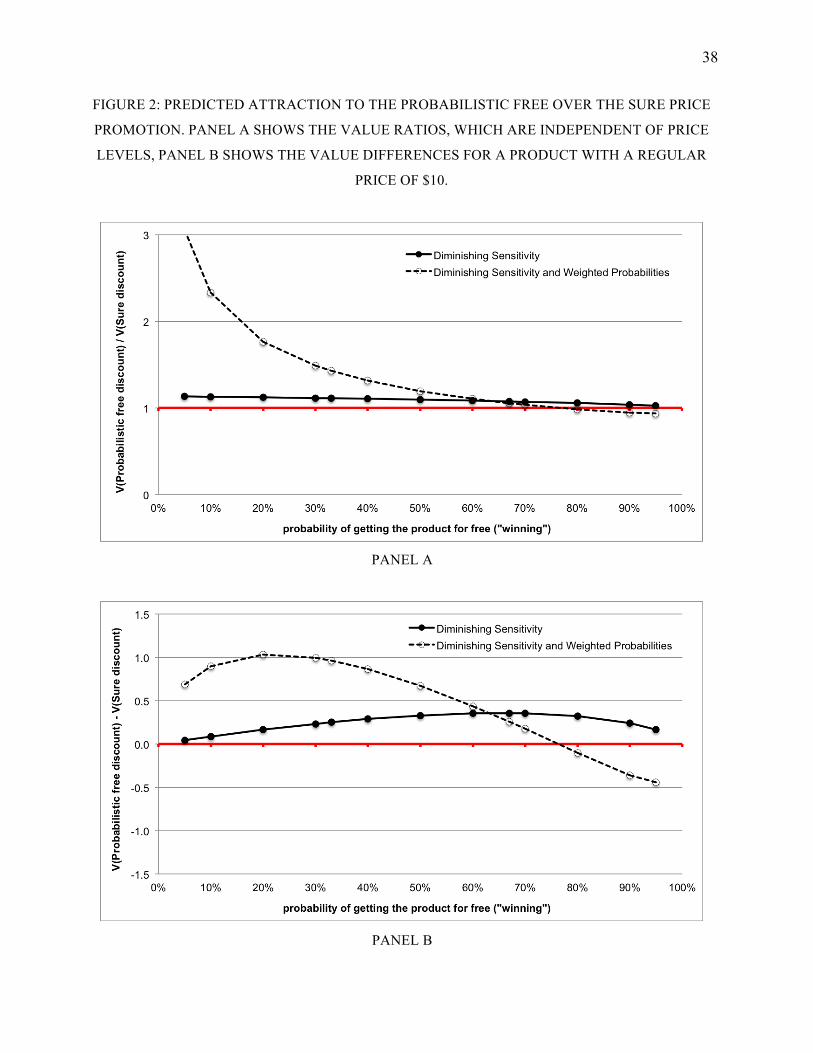
38
FIGURE 2: PREDICTED ATTRACTION TO THE PROBABILISTIC FREE OVER THE SURE PRICE
PROMOTION. PANEL A SHOWS THE VALUE RATIOS, WHICH ARE INDEPENDENT OF PRICE
LEVELS, PANEL B SHOWS THE VALUE DIFFERENCES FOR A PRODUCT WITH A REGULAR
PRICE OF $10.
PANEL A
PANEL B
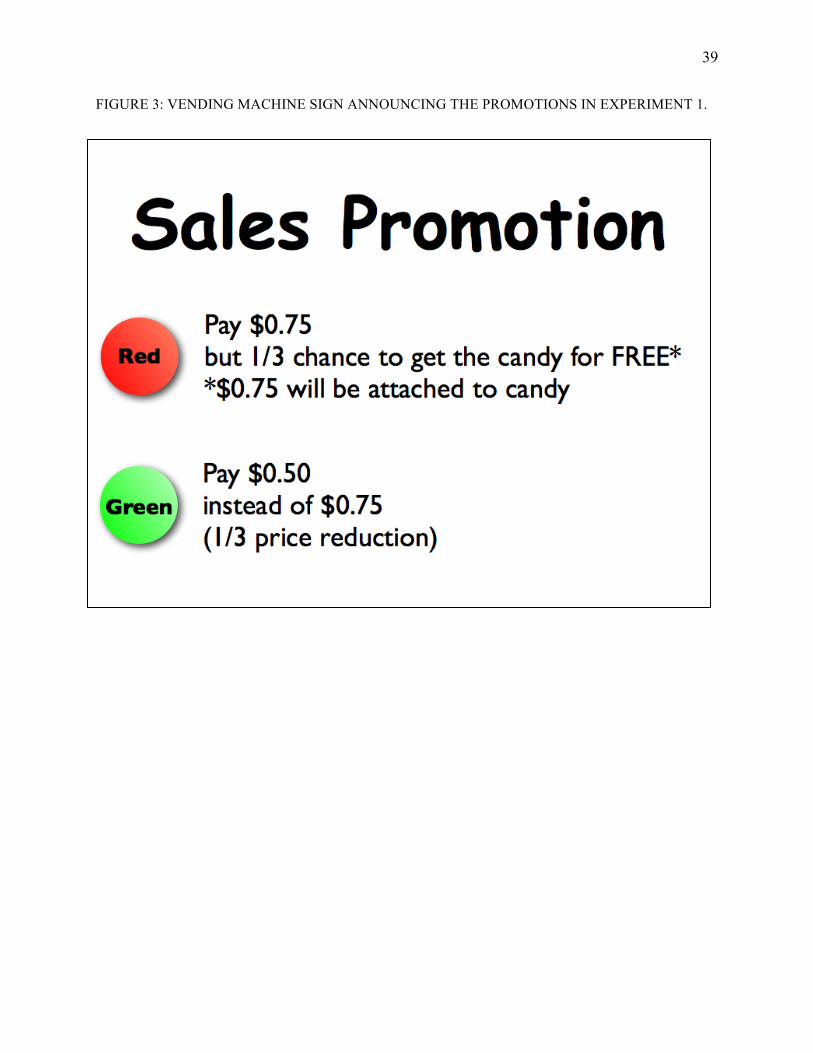
39
FIGURE 3: VENDING MACHINE SIGN ANNOUNCING THE PROMOTIONS IN EXPERIMENT 1.
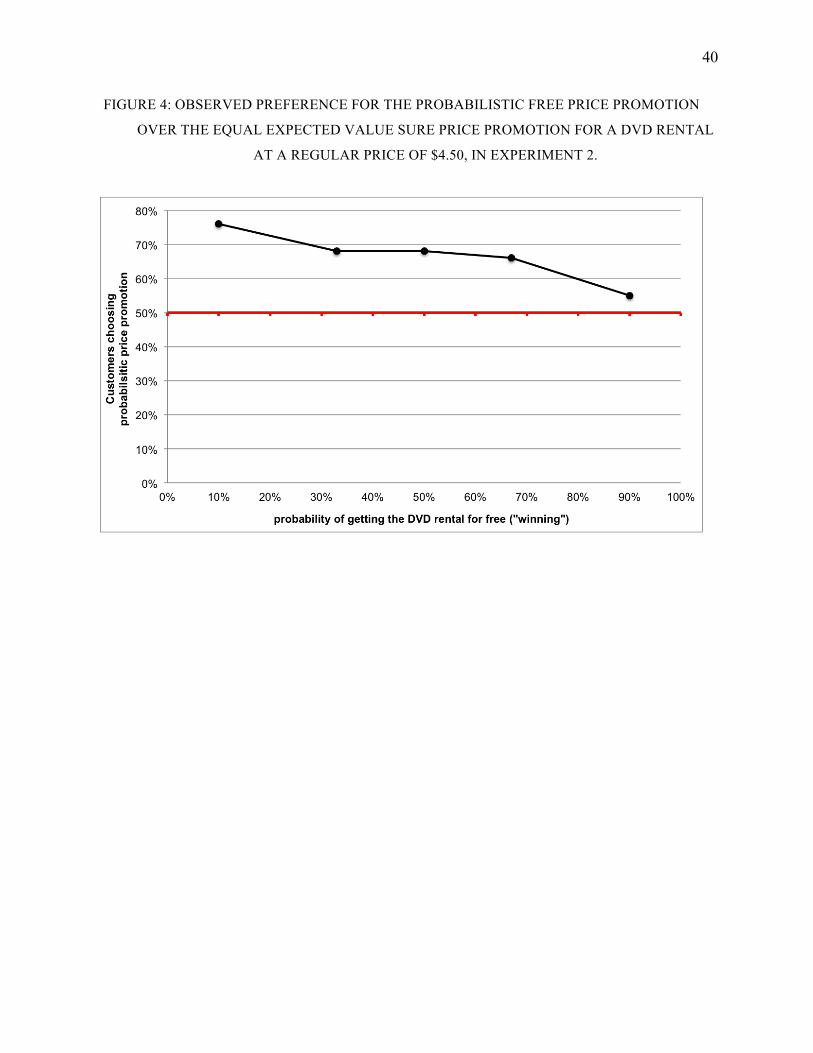
40
FIGURE 4: OBSERVED PREFERENCE FOR THE PROBABILISTIC FREE PRICE PROMOTION
OVER THE EQUAL EXPECTED VALUE SURE PRICE PROMOTION FOR A DVD RENTAL
AT A REGULAR PRICE OF $4.50, IN EXPERIMENT 2.
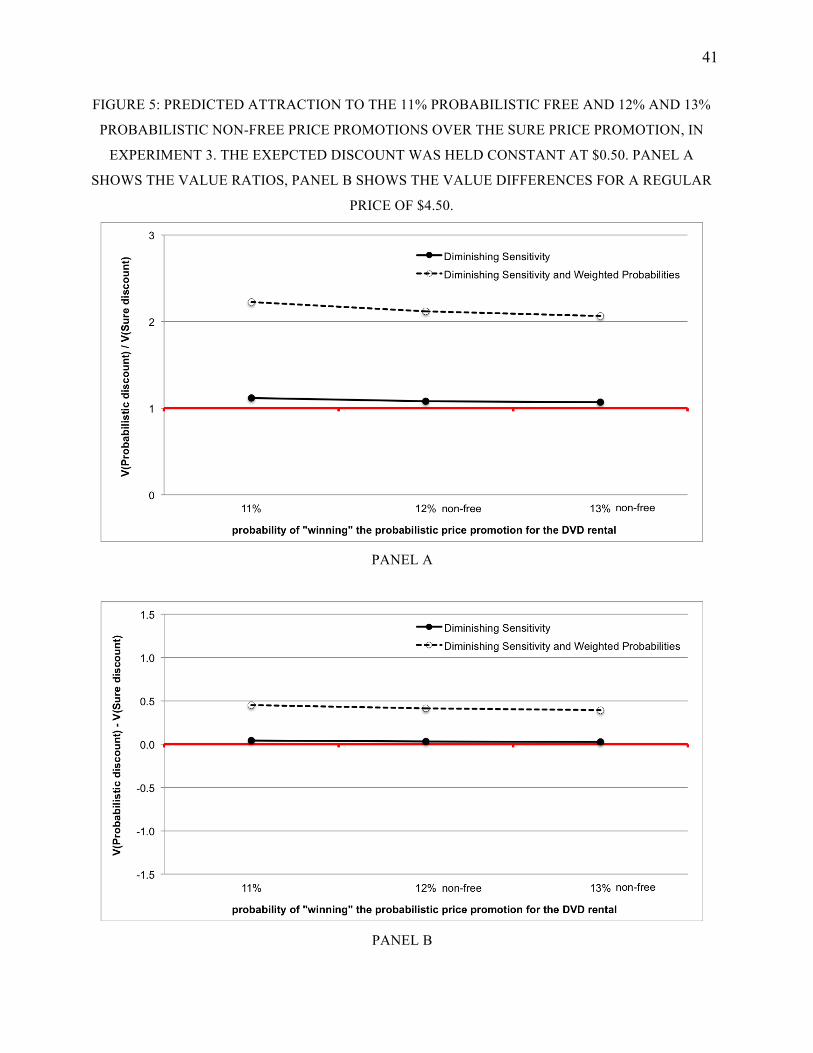
41
FIGURE 5: PREDICTED ATTRACTION TO THE 11% PROBABILISTIC FREE AND 12% AND 13%
PROBABILISTIC NON-FREE PRICE PROMOTIONS OVER THE SURE PRICE PROMOTION, IN
EXPERIMENT 3. THE EXEPCTED DISCOUNT WAS HELD CONSTANT AT $0.50. PANEL A
SHOWS THE VALUE RATIOS, PANEL B SHOWS THE VALUE DIFFERENCES FOR A REGULAR
PRICE OF $4.50.
PANEL A
PANEL B

42
FIGURE 6: PROSPECT THEORY’S PREDICTED ATTRACTION TO THE PROBABILISTIC
MONETARY GAIN OVER THE SURE MONETARY GAIN, IN EXPERIMENT 4. PANEL A SHOWS
THE VALUE RATIOS, PANEL B THE VALUE DIFFERENCES.
PANEL A
PANEL B
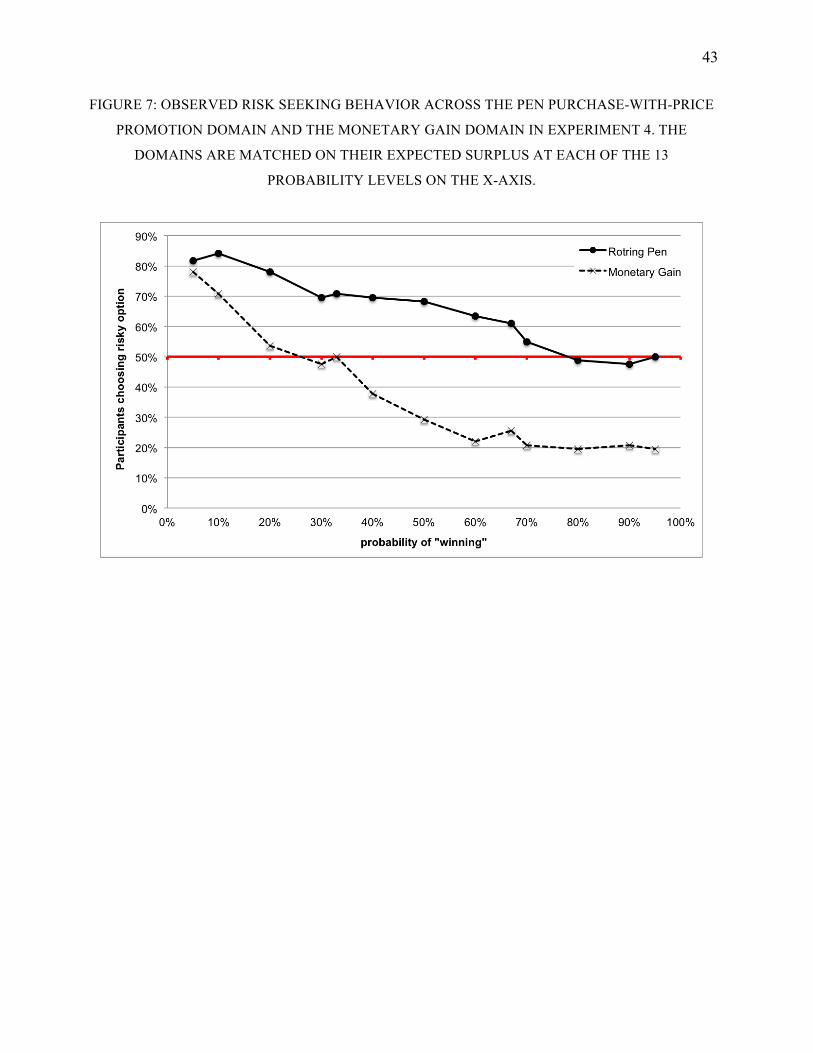
43
FIGURE 7: OBSERVED RISK SEEKING BEHAVIOR ACROSS THE PEN PURCHASE-WITH-PRICE
PROMOTION DOMAIN AND THE MONETARY GAIN DOMAIN IN EXPERIMENT 4. THE
DOMAINS ARE MATCHED ON THEIR EXPECTED SURPLUS AT EACH OF THE 13
PROBABILITY LEVELS ON THE X-AXIS.
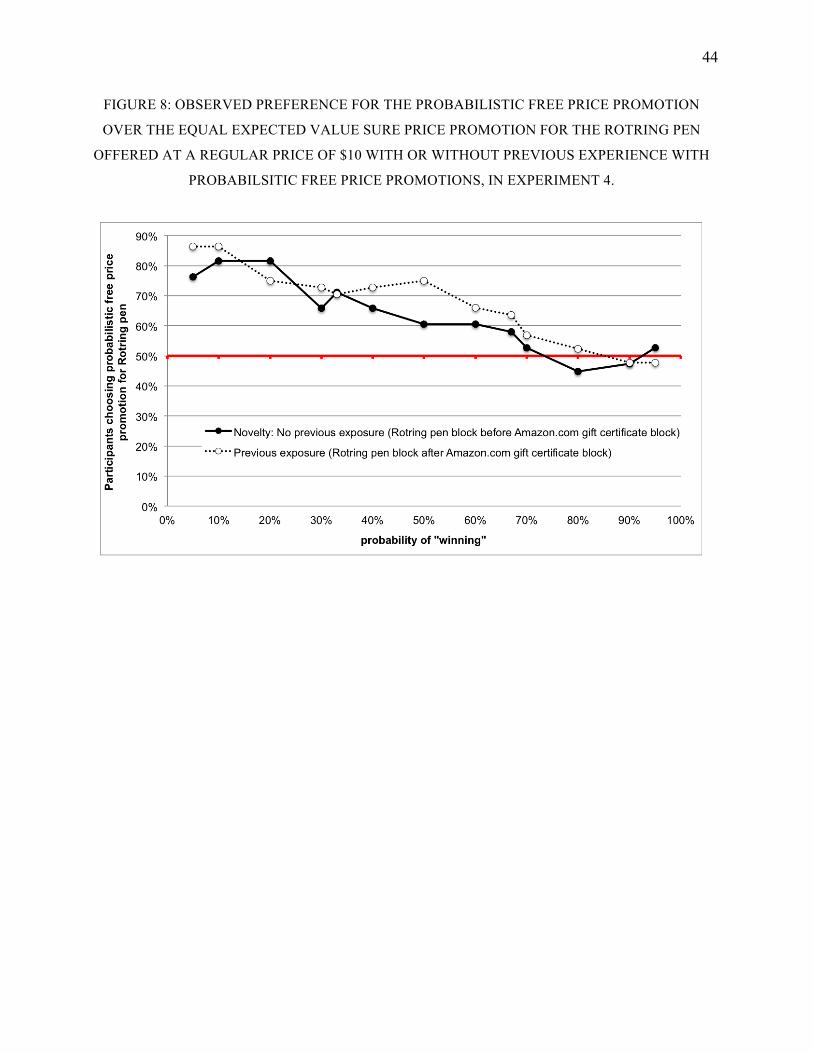
44
FIGURE 8: OBSERVED PREFERENCE FOR THE PROBABILISTIC FREE PRICE PROMOTION
OVER THE EQUAL EXPECTED VALUE SURE PRICE PROMOTION FOR THE ROTRING PEN
OFFERED AT A REGULAR PRICE OF $10 WITH OR WITHOUT PREVIOUS EXPERIENCE WITH
PROBABILSITIC FREE PRICE PROMOTIONS, IN EXPERIMENT 4.
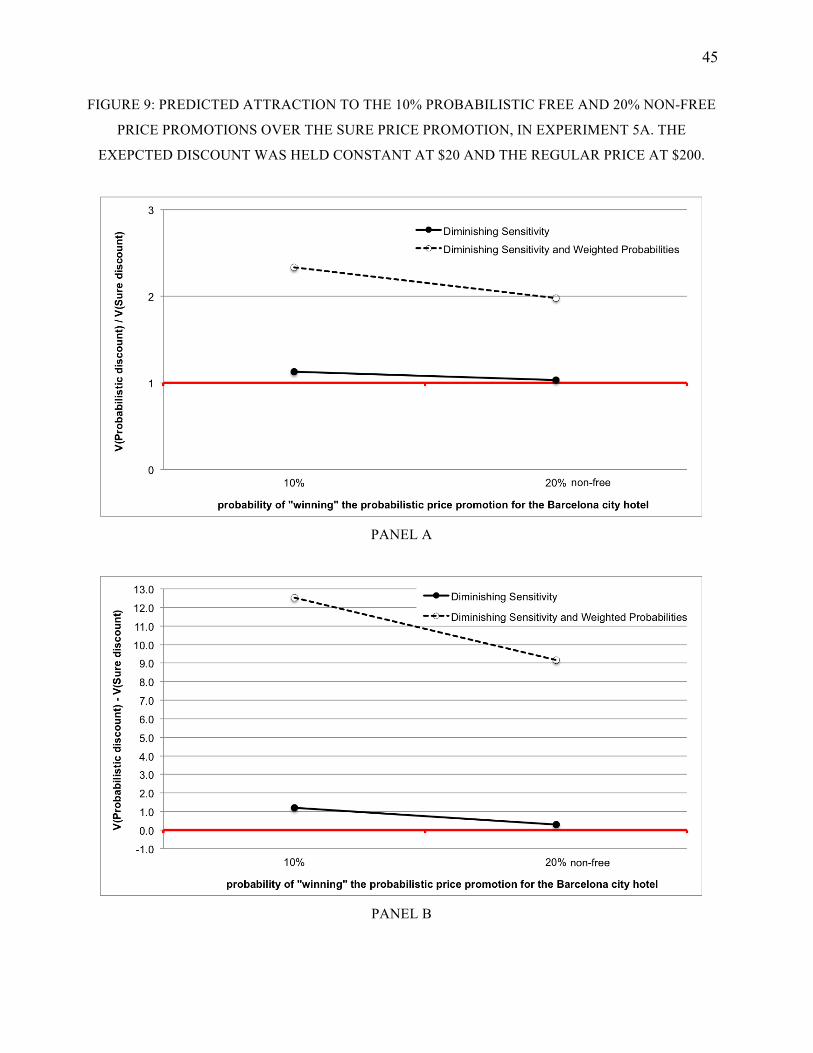
45
FIGURE 9: PREDICTED ATTRACTION TO THE 10% PROBABILISTIC FREE AND 20% NON-FREE
PRICE PROMOTIONS OVER THE SURE PRICE PROMOTION, IN EXPERIMENT 5A. THE
EXEPCTED DISCOUNT WAS HELD CONSTANT AT $20 AND THE REGULAR PRICE AT $200.
PANEL A
PANEL B

46
Supplementary Materials & Methods
EXPERIMENT 1: VENDING MACHINE
Figure S1 shows the type of vending machine that we used in this experiment. Customers could pay
with $1 bills or coins. Every two to four days the vending machine was fully restocked such that 33% of the
candies in the probabilistic discount slots had three quarters wrapped around them and were randomly
distributed within their respective slots. The restocking was done at night out of sight of potential observers.
The experimenter knew about the hypotheses of the experiment but could not influence customers’ choice
because she was not present when customers made their choices.
------------------------------
Insert figure S1 about here
-------------------------------
EXPERIMENT 4: REPLICATION AND NOVELTY
Individuals were told by the experimenter that the next experiment offered the possibility to
purchase a Rotring pen worth $10 or a $10 gift certificate for Amazon.com – pictures of both products
(three color versions of the pen) were presented on the computer screen in front of them. In addition, the
experimenter physically presented all three pen versions and one Amazon.com gift certificate first to the
entire group and then had them circulating among individuals for closer inspection. Individuals were asked
to only proceed to participate in the experiment if they were willing to purchase these products for the
regular, full price of $10 for real, with their own money.
The experimenter knew about the hypotheses of the experiment but could not influence
participants’ choices because she was not interacting with the respondents as they were making their
decisions. The experiment was conducted in a laboratory that did not use deception with respect to payouts.
Thus, while we did not have a question at the end to verify whether people had understood the terms of the
experiment, we assume our participants did expect that they might end up purchasing one of those two
products for $10. Thus, we believe that when our participants encountered prices lower than the regular
price of $10 they perceived those lower prices as discounts (price promotions).
The purchase of a $10 gift certificate for Amazon.com was added to the set of stimuli for
exploratory purposes. We wanted to see how consumers would behave toward a product that came very
47
close to money (similar to money, the gift certificate can be used to purchase an abundance of different
types of products albeit confined to the Amazon.com web site). That is, we were wondering whether in the
case where the two goods that are being exchanged (money for a gift certificate for Amazon.com) are
almost of the same currency, participants’ perceptions of the price promotions would be more similar to
their perceptions of monetary gains. In addition, we added monetary losses to make the experiment’s
expected payoff less extreme.
Table S1 presents the options displayed to participants for a 60% chance of “winning/losing” for
each of our four stimuli: purchase of a Rotring pen, purchase of an Amazon.com gift certificate as well as
monetary gain and monetary loss. Figure S2 displays the observed risk seeking behaviors across all four
stimuli. Table S2 shows the parameter estimates from the fixed-effects linear regression model with cluster-
robust standard errors and pairwise Wald tests when including the Amazon.com gift certificate. As can be
seen, participants’ level of risk seeking for the purchase of the Amazon.com gift certificate was between the
levels of risk seeking that they displayed for the other two discount/surplus domains: it was lower than for
the Rotring pen but higher than for the monetary gain. Future research might want to explore this
phenomenon and try to understand how people experience and code monetary gift certificates in
comparison to other products and money.
------------------------------
Insert table S1 about here
-------------------------------
------------------------------
Insert figure S2 about here
-------------------------------
------------------------------
Insert table S2 about here
-------------------------------
48
EXPERIMENT 5
Table S3 shows the survey flow, questions, and scales for both experiments 5a and 5b. The
experiments were conducted online, in a double-blind manner: the online-interface randomly assigned
participants from Amazon’s Mechanical Turk (MTurk) to a condition.
------------------------------
Insert table S3 about here
-------------------------------
Experiment 5a – Results
Four hundred and nine participants answered all survey questions (for mean age and distribution of
gender, ethnicity and education, see Table S4). We excluded three participants that did not pass the final,
attention question Q8 (correct answer was “all of the above”), leaving 406 participants for analysis over
five conditions. If we include the choice condition in the nominal logistic regression model mentioned in
the main text with the sure price promotion as baseline (χ2(4, N = 406) = 15.971, p = .003, pseudo R2 =
.03), the parameter estimate reveals that participants were significantly more likely to choose the Barcelona
city hotel over the beach resort hotel, when the hotel in Barcelona was offered with a choice between the
probabilistic free and sure price promotion (choice condition: 70.0%; B = .847, SE = .329, χ2(1, N = 162) =
6.63, p < .01, 95% CI: .209 / 1.502) than when it was offered with the sure promotion (50.0%). There was
no significant difference (χ2(1, N = 161) = .572, p = .450) between the success rate of the choice condition
(70.0%) and the probabilistic free price promotion (75.3%). An ANOVA found no significant effect of our
conditions on how much participants liked a city vacation over a beach vacation (M = .06, SD = 2.75, F(4,
401) = 1.284, p = .276; for details, see Table S5).
------------------------------
Insert table S4 about here
-------------------------------
49
Experiment 5b – Results
Five hundred and fifteen participants answered all survey questions (for mean age and distribution
of gender, ethnicity and education, see Table S4). We excluded four participants that did not pass the final,
attention question Q8 (correct answer was “all of the above”), leaving 511 participants for analysis over
five conditions. If we include the choice condition in the linear regression model mentioned in the main text
with the sure price promotion as baseline (overall ANOVA: F(4, 506) = 5.205, p < .001, R2 = .040), the
parameter estimate for the choice condition is not significantly different (B = .208, SE = .265, t = .78, p =
.43; 95% CI: -.314 / .729) from the sure price promotion condition. That is, there is no significant
difference between the number of days that participants booked at the Barcelona city hotel when the hotel
was offered with a choice between the probabilistic free price and the sure price promotion (M = 4.04 days,
SD = 2.22) and when it was offered with a sure price promotion (M = 3.83 days, SD = 1.83). The choice
condition was marginally significantly inferior to the probabilistic free price promotion (M = 4.53 days, SD
= 1.97, t(506) = -1.826, p = .07). Overall, 46 (9%) participants did not want to book any day at the
Barcelona city hotel. The percent of participants forgoing the Barcelona city hotel did not vary by
conditions (nominal logistic regression: χ2(4, N = 511) = 3.924, p = .42, R2 = .013).
Of the 102 participants in the choice condition, 89 participants wanted to book one or more nights
at the Barcelona city hotel. Surprisingly, of those participants, 49% (44 participants) choose the sure price
promotion and 51% (45 participants) choose the probabilistic free price promotion. This equal split is
different from our other joint-valuation findings in experiments 1-4, where people consistently and
significantly preferred the probabilistic free price promotion over the sure price promotion. We can only
speculate that one reason for this difference might lie in demand effects due to the hypothetical nature of
the joint-valuation scenario. The hypothetical nature might have made it more apparent to participants that
they should be indifferent between both type of promotions due to the same expected discount values.
Another potentially more important reason may be the set up that differed from that in our experiments 1-4,
and this difference might have triggered an entirely different decision making process. Unlike in our other
experiments participants here saw the possibility of two types of price promotions for the Barcelona city
hotel versus no price promotion for the beach hotel, and then first had to decide how many days they
wanted to spend at the Barcelona city hotel. Only after that decision did they have to choose the type of
price promotion (sure or probabilistic) that they’d like to apply to the number of days at the Barcelona city
hotel. Thus, the first decision-making step might have resulted in participants equating the two types of
promotions of the Barcelona city hotel. Future research may want to examine to what extent the number of
decision-making steps, their order, and their hypothetical versus consequential nature affect individuals’
responses.
50
An ANOVA found no significant effect of our conditions on how much participants liked a city
vacation over a beach vacation (M = -.15, SD = 2.92, F(4, 506) = .681, p = .61; for details, see Table S5).
------------------------------
Insert table S5 about here
-------------------------------
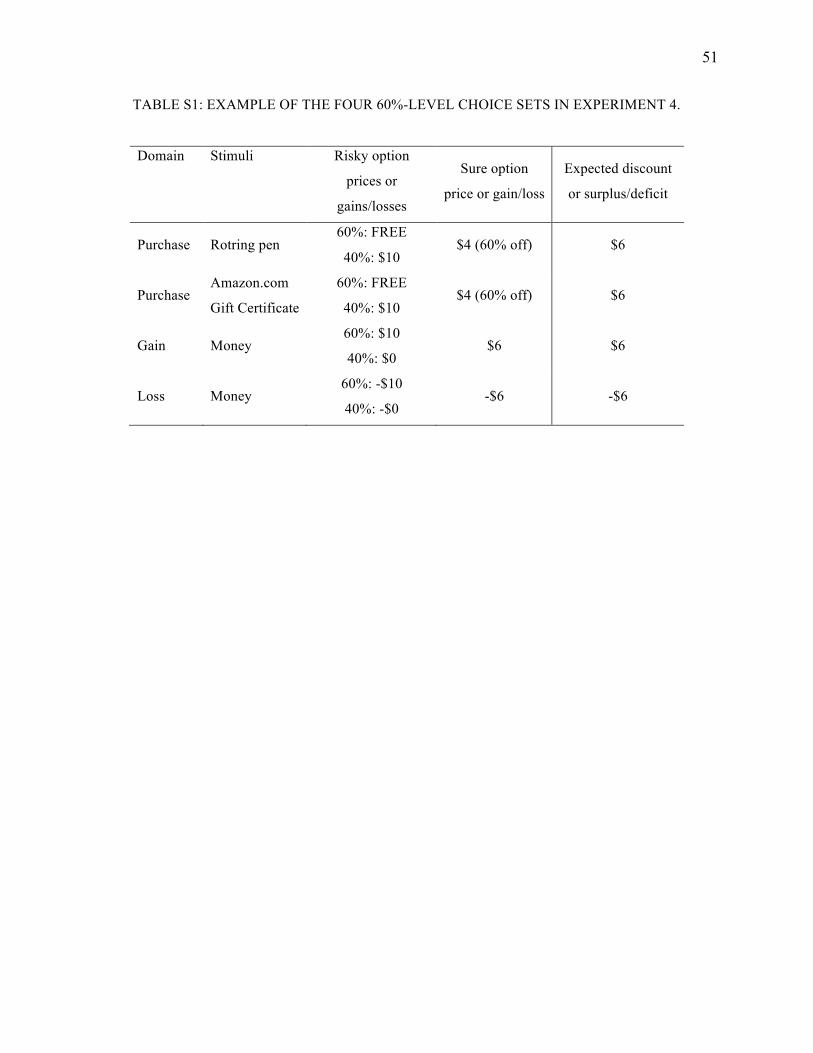
51
TABLE S1: EXAMPLE OF THE FOUR 60%-LEVEL CHOICE SETS IN EXPERIMENT 4.
Domain Stimuli Risky option
prices or
gains/losses
Sure option
price or gain/loss
Expected discount
or surplus/deficit
Purchase Rotring pen 60%: FREE
40%: $10 $4 (60% off) $6
Purchase Amazon.com
Gift Certificate
60%: FREE
40%: $10 $4 (60% off) $6
Gain Money 60%: $10
40%: $0 $6 $6
Loss Money 60%: -$10
40%: -$0 -$6 -$6

52
TABLE S2: PARAMETER ESTIMATES FOR CHOICE OF PROBABILISTIC / RISKY OPTION
INCLUDING WALD TESTS OF INTERCEPT AND SLOPE PARAMETER ESTIMATES IN
EXPERIMENT 4.
Parameter Estimate SE
Intercepts Rotring pen .793*** .042
Amazon.com .753*** .047
Money gain .639*** .046
Slopes Rotring pen -.403*** .078
Amazon.com -.559*** .093
Money gain -.637*** .085
R-squared .658
# observations 3,198
Parameter comparisons F(1, 81) p
Intercepts Rotring pen = Money gain 8.83 .004
Amazon.com = Money gain 4.42 .039
Rotring pen = Amazon.com 0.91 .342
Slopes Rotring pen = Money gain 6.82 .011
Amazon.com = Money gain 0.62 .432
Rotring pen = Amazon.com 4.23 .043
Notes. *** = p < .001. Overall parameter estimates from a linear regression model with fixed-effects for respondents with cluster-robust standard errors (N = 82 clusters), choice (0 = sure option; 1 = risky option) as dependent variable, and assuming domain-specific intercepts and slope parameters over the 13 probability levels.
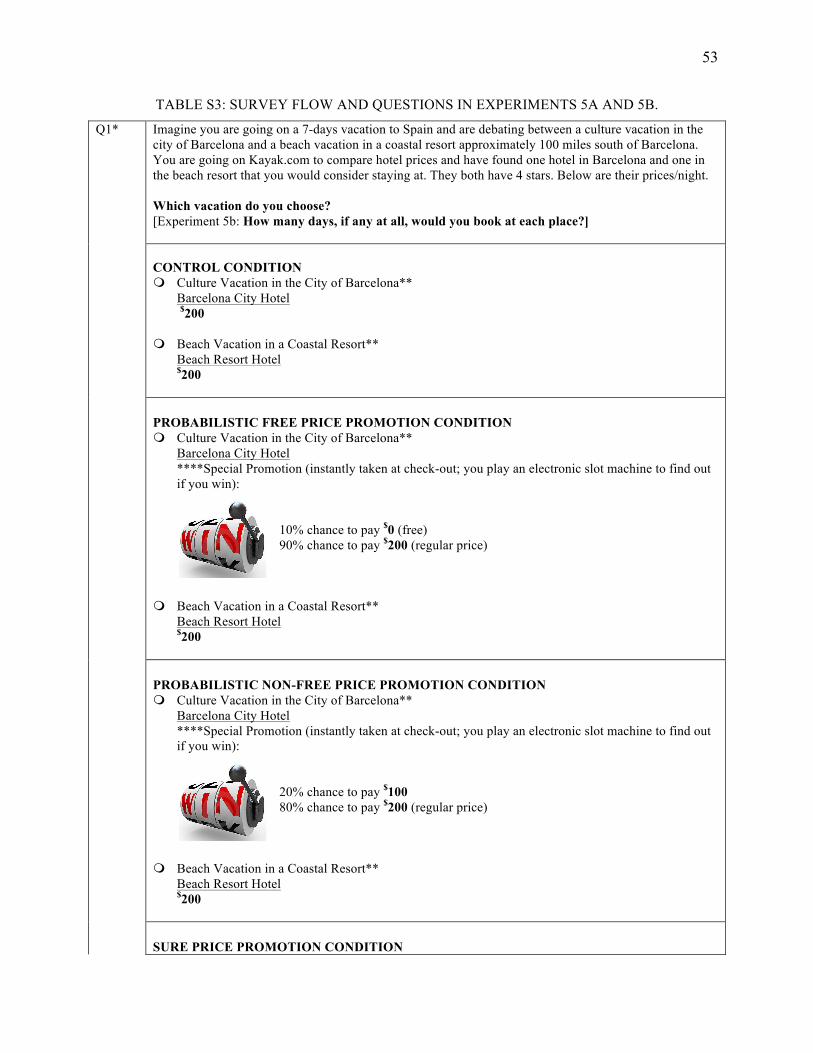
53
TABLE S3: SURVEY FLOW AND QUESTIONS IN EXPERIMENTS 5A AND 5B.
Q1* Imagine you are going on a 7-days vacation to Spain and are debating between a culture vacation in the city of Barcelona and a beach vacation in a coastal resort approximately 100 miles south of Barcelona. You are going on Kayak.com to compare hotel prices and have found one hotel in Barcelona and one in the beach resort that you would consider staying at. They both have 4 stars. Below are their prices/night. Which vacation do you choose? [Experiment 5b: How many days, if any at all, would you book at each place?]
CONTROL CONDITION m Culture Vacation in the City of Barcelona**
Barcelona City Hotel $200
m Beach Vacation in a Coastal Resort**
Beach Resort Hotel $200
PROBABILISTIC FREE PRICE PROMOTION CONDITION m Culture Vacation in the City of Barcelona**
Barcelona City Hotel ****Special Promotion (instantly taken at check-out; you play an electronic slot machine to find out if you win):
10% chance to pay $0 (free) 90% chance to pay $200 (regular price)
m Beach Vacation in a Coastal Resort**
Beach Resort Hotel $200
PROBABILISTIC NON-FREE PRICE PROMOTION CONDITION m Culture Vacation in the City of Barcelona**
Barcelona City Hotel ****Special Promotion (instantly taken at check-out; you play an electronic slot machine to find out if you win):
20% chance to pay $100 80% chance to pay $200 (regular price)
m Beach Vacation in a Coastal Resort**
Beach Resort Hotel $200
SURE PRICE PROMOTION CONDITION
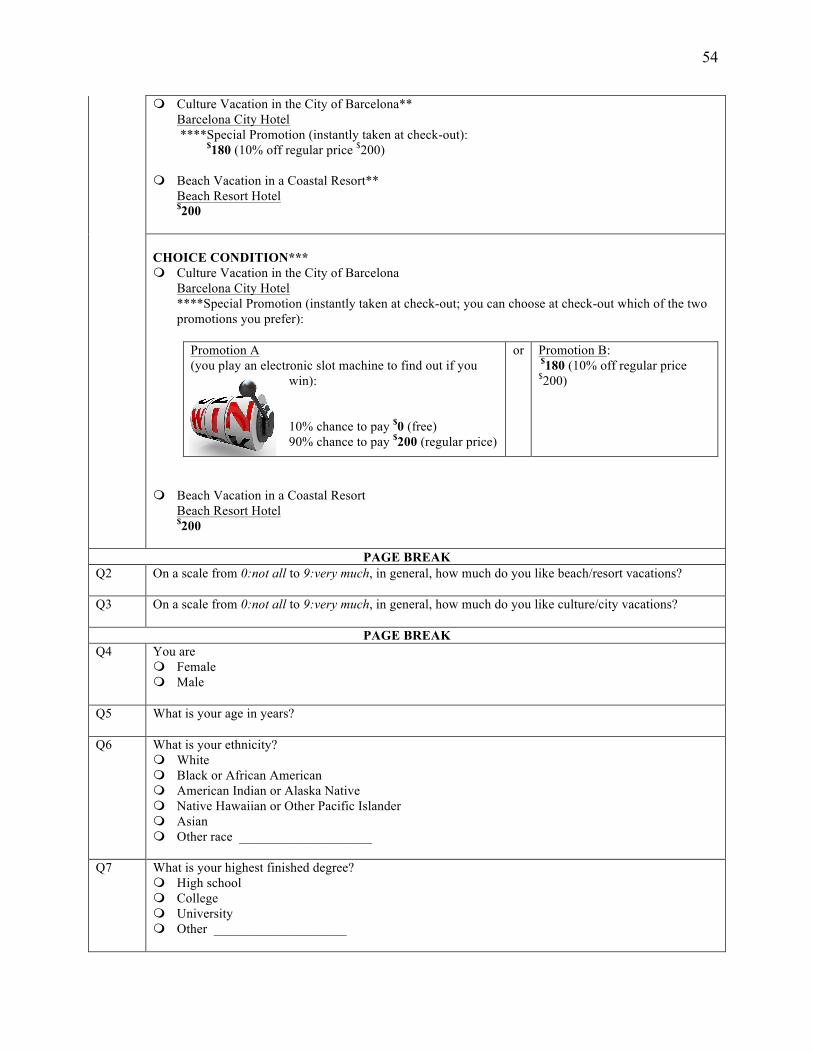
54
m Culture Vacation in the City of Barcelona** Barcelona City Hotel ****Special Promotion (instantly taken at check-out): $180 (10% off regular price $200)
m Beach Vacation in a Coastal Resort**
Beach Resort Hotel $200
CHOICE CONDITION*** m Culture Vacation in the City of Barcelona
Barcelona City Hotel ****Special Promotion (instantly taken at check-out; you can choose at check-out which of the two promotions you prefer):
Promotion A (you play an electronic slot machine to find out if you
win): 10% chance to pay $0 (free) 90% chance to pay $200 (regular price)
or Promotion B: $180 (10% off regular price $200)
m Beach Vacation in a Coastal Resort
Beach Resort Hotel $200
PAGE BREAK
Q2 On a scale from 0:not all to 9:very much, in general, how much do you like beach/resort vacations?
Q3 On a scale from 0:not all to 9:very much, in general, how much do you like culture/city vacations?
PAGE BREAK Q4 You are
m Female m Male
Q5 What is your age in years?
Q6 What is your ethnicity?
m White m Black or African American m American Indian or Alaska Native m Native Hawaiian or Other Pacific Islander m Asian m Other race ____________________
Q7 What is your highest finished degree?
m High school m College m University m Other ____________________
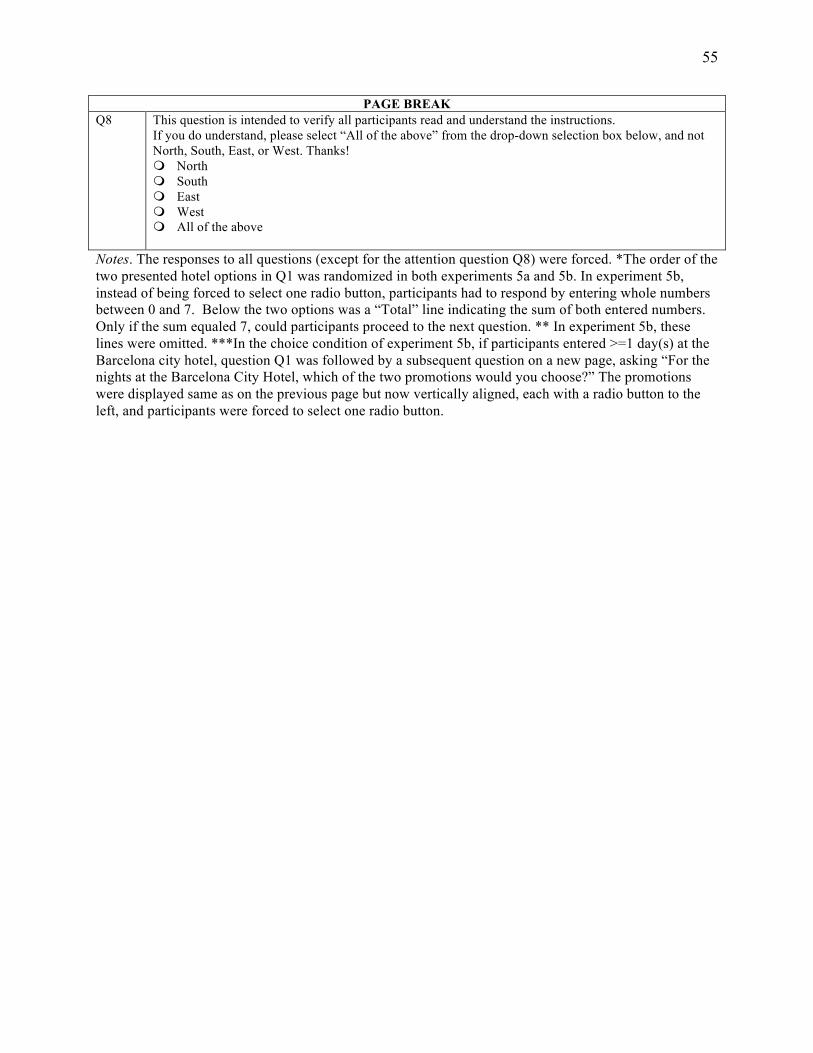
55
PAGE BREAK Q8 This question is intended to verify all participants read and understand the instructions.
If you do understand, please select “All of the above” from the drop-down selection box below, and not North, South, East, or West. Thanks! m North m South m East m West m All of the above
Notes. The responses to all questions (except for the attention question Q8) were forced. *The order of the two presented hotel options in Q1 was randomized in both experiments 5a and 5b. In experiment 5b, instead of being forced to select one radio button, participants had to respond by entering whole numbers between 0 and 7. Below the two options was a “Total” line indicating the sum of both entered numbers. Only if the sum equaled 7, could participants proceed to the next question. ** In experiment 5b, these lines were omitted. ***In the choice condition of experiment 5b, if participants entered >=1 day(s) at the Barcelona city hotel, question Q1 was followed by a subsequent question on a new page, asking “For the nights at the Barcelona City Hotel, which of the two promotions would you choose?” The promotions were displayed same as on the previous page but now vertically aligned, each with a radio button to the left, and participants were forced to select one radio button.

56
TABLE S4: DEMOGRAPHICS OF MTURK PARTICIPANTS (BEFORE EXCLUSIONS) IN
EXPERIMENTS 5A AND 5B.
Attribute Levels Experiment 5a Experiment 5b
Age M
SD 29.61
9.23
29.23
9.86
Gender # Females 156 (38%) 178 (35%)
# Males 253 (62%) 337 (65%)
Ethnicity # White 328 (80%) 400 (78%)
# Black or African American 25 (6%) 34 (7%)
# American Indian 1 (< 1%) 5 (1%)
# Native Hawaiian or Other Pacific Islander 1 (< 1%) 0 (0%)
# Asian 44 (11%) 56 (11%)
# Other race 10 (2%) 20 (4%)
Highest Finished Degree # High School 130 (32%) 210 (41%)
# College 178 (44%) 195 (38%)
# University 92 (22%) 100 (19%)
# Other 9 (2%) 10 (2%)
# Observations 409 515

57
TABLE S5: LIKING OF CITY VACATIONS OVER BEACH VACATIONS IN EXPERIMENTS 5A
AND 5B.
Experiment 5a
F(4, 401) = 1.284, p = .276
Condition N = 406 M SD
Sure price promotion 82 -.44 2.6
Probabilistic FREE Price Promotion 81 .37 2.61
Probabilistic non-free price promotion 81 .28 3.12
Control (no price promotion) 82 -.16 2.43
Choice 80 .24 2.93
Experiment 5b
F(4, 506) = .681, p = .606
Condition N = 511 M SD
Sure price promotion 101 -.21 2.71
Probabilistic FREE Price Promotion 100 .07 3.03
Probabilistic non-free price promotion 104 -.08 3.08
Control (no price promotion) 104 -.53 2.49
Choice 102 .01 3.24

58
FIGURE S1: THE TYPE OF VENDING MACHINE USED IN EXPERIMENT 1.
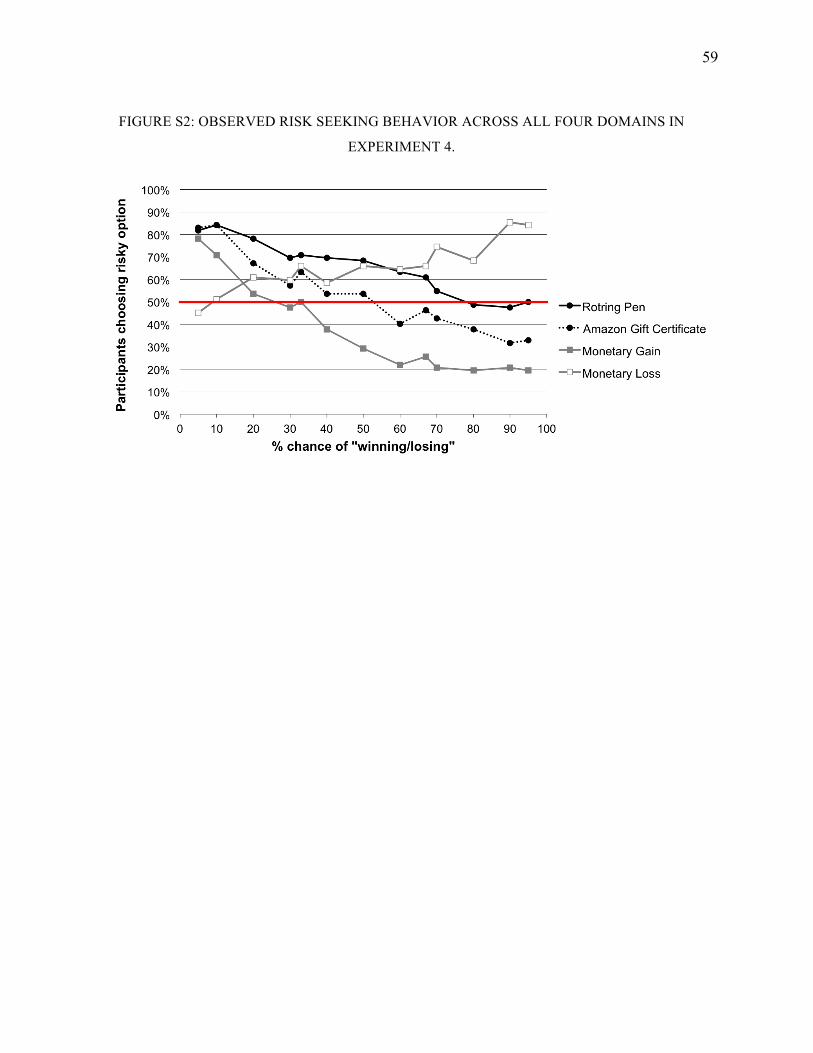
59
FIGURE S2: OBSERVED RISK SEEKING BEHAVIOR ACROSS ALL FOUR DOMAINS IN
EXPERIMENT 4.