when are assets complementary? star scientists, strategic alliances, and innovation in the...
TRANSCRIPT
Strategic Management JournalStrat. Mgmt. J., 32: 895–909 (2011)
Published online EarlyView in Wiley Online Library (wileyonlinelibrary.com) DOI: 10.1002/smj.916
Received 18 September 2008; Final revision received 9 December 2010
RESEARCH NOTES AND COMMENTARIES
WHEN ARE ASSETS COMPLEMENTARY? STARSCIENTISTS, STRATEGIC ALLIANCES, ANDINNOVATION IN THE PHARMACEUTICAL INDUSTRY
ANDREW M. HESS1 and FRANK T. ROTHAERMEL2*1 McIntire School of Commerce, University of Virginia, Charlottesville, Virginia, U.S.A.2 College of Management, Georgia Institute of Technology, Atlanta, Georgia, U.S.A.
To answer the question of when are assets complementary, we investigate specific resourcecombinations along the value chain, focusing on two mechanisms that are central to combiningresources for innovation in the pharmaceutical industry: recruitment and retention of starscientists, and 2) engagement in strategic alliances. We propose that resource combinationsthat focus on the same parts of the value chain are substitutes due to knowledge redundancies.Conversely, we hypothesize that resource combinations that link different parts of the valuechain are complements due to integration of nonredundant knowledge. To test these hypotheses,we empirically track the innovative performance of 108 global pharmaceutical firms over threedecades (1974–2003). Copyright 2011 John Wiley & Sons, Ltd.
INTRODUCTION
A growing body of research considers the questionof where a firm draws its boundaries (Parmigianiand Mitchell, 2009; Williamson, 1991). Recently,researchers have advanced a nuanced approach tomore accurately depict the complexity and veloc-ity of today’s business environment (Parmigiani,2007). This stream of research illustrates that it isoften the case that organizations choose to simul-taneously or concurrently make, buy, or ally toattain like inputs (Parmigiani and Mitchell, 2009;
Keywords: complementary assets; star scientists; strategicalliances; innovation; pharmaceutical industry*Correspondence to: Frank T. Rothaermel, College of Manage-ment, Georgia Institute of Technology, Atlanta, GA 30308-1149,U.S.A. E-mail: [email protected]
Rothaermel, Hitt, and Jobe, 2006). This litera-ture discusses concurrent sourcing as an alternativeto the traditional dichotomy of make versus buyboundary decisions. If indeed organizations areusing concurrent sourcing (referred to as taperedintegration or dual distribution of inputs in theoriginal literature, see Harrigan, 1986), the ques-tion remains whether it is efficacious for them tobe doing so. More specifically, within the realm ofinnovation, are organizations facilitating or ham-pering their innovating efforts by leveraging dif-ferent sources of knowledge concurrently?
We attempt to answer the question of when com-binations of value chain activities are substitutiveor complementary by investigating the effect ofspecific activity combinations on a firm’s inno-vative performance. Specifically, we focus herein
Copyright 2011 John Wiley & Sons, Ltd.

896 A. M. Hess and F. T. Rothaermel
on the interactions between two mechanisms thatare central to innovation in the pharmaceuticalindustry: the recruitment and retention of star sci-entists, and 2) engagement in strategic alliances.These two different mechanisms are representa-tive of activities firms use to access knowledgeand build new capabilities (Cockburn and Hen-derson, 2001; Ettlie and Pavlou, 2006; Gulati,1998; Helfat, 1997; Helfat and Peteraf, 2003).Although some of these mechanisms have beenstudied in isolation (Gardner, 2005; Rothaermel,2001; Zucker and Darby, 1997), there is a dearthof research regarding the contingency effects ofthese mechanisms on innovative performance.
We posit that strategic alliances and intellectualhuman capital are used to access and combine dif-ferent types of knowledge along the value chain.While an upstream- downstream lens has beenapplied to strategic alliances (Baum, Calabrese,and Silverman, 2000; Koza and Lewin, 1998;Rothaermel and Deeds, 2004), we suggest that itcan also be useful to better understand a firm’sintellectual human capital. Our analysis of thedegree to which the human capital is used to accessupstream knowledge is based on a noted bifur-cation of star versus non-star scientists (Rothaer-mel and Hess, 2007; Zucker and Darby, 1996).The importance of applying these categorizationsis reflective of the knowledge that is needed tofacilitate innovation at different points along thevalue chain. We propose that resource combina-tions that focus on the same value chain activitiesprovide redundant knowledge and, thus, are substi-tutes. Conversely, we hypothesize that the resourcecombinations that link different value chain activ-ities are complements, because they bring togetherdifferent types of knowledge needed to completethe innovation process. To test these hypotheses,we empirically track the innovative performance of108 global pharmaceutical firms over three decades(1974–2003).
THEORY AND HYPOTHESES
In high-velocity industries, the source of newknowledge is often external to incumbent firms(Powell, Koput, and Smith-Doerr, 1996). Theincreasing complexity and multidisciplinary natureof the innovation process forces pharmaceuticalfirms to concurrently access external knowledge tosupport both upstream and downstream value chain
activities (Arora and Gambardella, 1990; Rothaer-mel and Hess, 2007). In these types of environ-ments, a firm’s innovative performance appearsto be affected by its ability to create and man-age connections with other organizations. Priorresearch investigating this connectivity has pri-marily focused on the role strategic alliances playin developing an organization’s ability to accesssources of external knowledge (Ettlie and Pavlou,2006; Gulati, 1999; Hagedoorn, 1993; Rothaermeland Deeds, 2004).
It is important to note, however, that a firm’sconnectivity is also related to the firm’s scope ofcollaborations—both formal (strategic alliances)and informal (interpersonal) relationships. Analy-sis of an organization’s connectivity to the externalenvironment requires knowledge not only of itsstrategic alliances but also of its intellectual humancapital, which fosters, as indicated by the CEOof Centocor (a biotechnology firm): ‘. . .dozens ofhandshake deals and informal collaborations, aswell as probably hundreds of collaborations by ourcompany’s scientists with colleagues elsewhere’(Powell et al., 1996: 120). Within high-velocityindustries, prior research has identified both strate-gic alliances and intellectual human capital asantecedents to innovation (Rothaermel and Hess,2007). Given this importance, it is critical thatwe further explore the interactions between theseactivities, because they are used simultaneously asfirms pursue innovation.
Strategic alliances
Strategic alliances are a well-established means bywhich firms gain access to the external knowl-edge environment (Arora and Gambardella, 1990;Gulati, 1998; Rothaermel, 2001). In their con-ceptual treatment, Koza and Lewin (1998) estab-lished that firms enter into different types ofalliances depending on the type of knowledge thatthey are seeking to acquire. Firms can enter intoupstream alliances for the purpose of exploringfor new opportunities, while downstream alliancesare undertaken to exploit an existing capability(Rothaermel et al., 2004). This functional view isbased on the position of an alliance along the valuechain. Upstream alliances tend to be primarilyfocused on generating new basic knowledge, whiledownstream alliances are often focused on generat-ing knowledge that is more applied in nature (i.e.,focused on leveraging production and marketing
Copyright 2011 John Wiley & Sons, Ltd. Strat. Mgmt. J., 32: 895–909 (2011)DOI: 10.1002/smj
Research Notes and Commentaries 897
activities, see Grant and Baden-Fuller, 2004; Lavieand Rosenkopf, 2006).
Firms conduct upstream research alliances todiscover something new, allowing the partners toshare and acquire tacit knowledge. These typesof alliances are usually undertaken with universi-ties and other research institutions and are oftencharacterized by high uncertainty and frequentfailure (Rothaermel et al., 2004). On the otherhand, firms that conduct downstream alliances toleverage complementary assets combine explicitknowledge (Teece, 1992). Downstream alliancesgenerally join the drug development efforts ofnew ventures with larger, more well-establishedfirms that provide manufacturing capabilities, reg-ulatory know-how, market knowledge and access(Rothaermel et al., 2004). Several empirical stud-ies, across different types of firms, industries, andtime frames, provide robust support for the viabil-ity of applying an upstream-downstream lens tostrategic alliances (Lavie and Rosenkopf, 2006;Park, Chen, and Gallagher, 2002; Rothaermel,2001; Rothaermel and Deeds, 2004). Followingthis line of research, we dichotomize a firm’sstrategic alliances into upstream and downstreamto reflect their intent to leverage different types ofknowledge along the value chain.
Star scientists
In the pharmaceutical industry, star scientists pro-vide critical connectivity to universities and othersources of upstream knowledge (Arora and Gam-bardella, 1990). Star scientists are importantboundary spanners, because a difference in codingschemes exists, specifically between large publicfirms and academic institutions and other high-tech start-ups. This mismatch creates the possi-bility of communication difficulties (Allen andCohen, 1969). It can be alleviated, however, bythe use of individuals ‘who are capable of trans-lating between two coding schemes either throughpersonal contact or knowledge of the literature, andwho can act as bridges linking the organization toother organizations and workers in the field’ (Allenand Cohen, 1969: 13). The variations in codingschemes between different knowledge communi-ties is of concern because without boundary span-ners that function as translators, the firm wouldpotentially be unable to assimilate tacit informa-tion into codified knowledge that can lead to futureinnovation.
Further, in high-velocity knowledge environ-ments, boundary spanners are not only able tokeep the pulse of shifts in technology, but in manycases may actually hold key knowledge them-selves. Prior research has identified the spread ofbiotechnology through the scientific community asone case in point. Specifically, Zucker, Darby, andBrewer (1998: 291) suggest that for at least 10 to15 years the repository for key knowledge associ-ated with biotechnology was with a ‘small initialgroup of discoverers, their coworkers, and otherswho learned the knowledge from working at thebench-science level with those possessing the req-uisite know-how.’
We suggest that star scientists provide an incum-bent firm with access to upstream knowledge notonly through their own research but also by beingpart of a broader scientific community. In sup-port for this notion, Furukawa and Goto (2006)found that the stars in science were responsiblefor a disproportional large number of publica-tions in scientific journals, and were thus engag-ing in the creation of new (upstream) knowledge.Our own data illustrate a similar trend. We findthat the top one percent of authors (employed byone of the pharmaeutical companies in our sam-ple) account for almost 40 percent of all publi-cations (with at least one coauthor affiliated witha pharmaceutical company). Engaging star scien-tists in the open literature in turn lays a criticalfoundation for subsequent innovation (Hendersonand Cockburn, 1994), because it builds and main-tains a firm’s absorptive capacity, understood asthe firm’s ability to recognize, value, and exploitnew external knowledge (Cohen and Levinthal,1990).
Contingency effects: star scientists andstrategic alliances
Two resource combinations are complementarywhen the marginal return to one resource increasesin the presence of the other (Milgrom and Roberts,1995). While there is potential for synergiesbetween sets of resources, there is also a potentialfor a substitutive relationship, if doing more of anactivity to leverage a specific resource reduces themarginal benefit of another (Arora and Ceccagnoli,2006; Cassiman and Veugelers, 2006).
Our central argument is that the complemen-tary or substitutive relationship between bundles
Copyright 2011 John Wiley & Sons, Ltd. Strat. Mgmt. J., 32: 895–909 (2011)DOI: 10.1002/smj
898 A. M. Hess and F. T. Rothaermel
of resources is a function of the types of knowl-edge being combined. We suggest that activitiesthat link different segments of the value chain arecomplementary, while those that focus on the samevalue chain activity are substitutive. It is importantto note that our focus is on understanding the rela-tionship between the different upstream and down-stream value chain activities of an organization.The contingency effects we stipulate occur after afirm has established a threshold of minimum activ-ity in each category.1 The two contingency effectswe are focusing on are combining 1) star scien-tists and upstream alliances, and 2) star scientistsand downstream alliances in a firm’s pursuit ofinnovation.
Although there are clearly some important dif-ferences between star scientists engaging in knowl-edge creation and dissemination and firms pur-suing upstream research alliances, there is alsosome element of equifinality present with respectto the type of knowledge generated in each activ-ity. This implies that investments in different inno-vation activities can lead to similar outcomes.Although an equifinality argument is necessaryfor a substitutive relationship to occur, it is notsufficient. More specifically, for a substitutiverelationship to occur, using one activity mustalso marginally decrease the benefit of usinganother. In the case of pharmaceutical firms, this isexactly what we suggest happens when upstreamalliances and star scientists are simultaneouslyemployed for the purpose of gaining access to tacitknowledge.
The premise of this argument stems from thepotential diseconomies of scope associated withusing different governance mechanisms. Specif-ically, given the high velocity of the knowl-edge environments in which they operate, access
1 It is theoretically possible that a firm sources all of its knowl-edge internally through combining internal exploration by starscientists with internal exploitation by staff scientists. Alter-natively, it is theoretically possible that a firm sources all ofits knowledge externally through combining upstream allianceswith downstream alliances. Although these are theoretically pos-sible combinations, they tend to be not probable, because thevast majority of firms, across many different industries, havemoved to an open innovation system, combining internal andexternal R&D (Chesbrough, 2003). Specifically, in our sampleof global pharmaceutical companies, 75 of the 108 (69%) ofthe sample firms have followed a system of open innovation bysimultaneously employing at least one star scientist and one staffscientist, combined with the pursuit of at least one upstream andone downstream alliance during a single year. This figure jumpsto 99 percent of the firms when the window is increased to athree-year time period.
to external communities of practice is critical(Arora and Gambardella, 1990). Over time, firmswithin these communities of practice developrelationship-specific knowledge that cannot be eas-ily replicated with other firms outside the spe-cific community (Brown and Duguid, 2001; Kogutand Zander, 1992). Such firm-specific research anddevelopment (R&D) activities have been empir-ically demonstrated in the petroleum industry(Helfat, 1994a; Helfat, 1994b). Further, early deci-sions affect outcomes in the distant future dueto time compression diseconomies (Dierickx andCool, 1989). Given this, the longer a firm par-ticipates in a community of practice, the moresocial capital, trust, tacit knowledge, and bar-gaining power it will accumulate with the othermembers of the community (Brown and Duguid,2001; Reed and DeFillippi, 1990). These mech-anisms indicate that marginal transaction costsdiminish with the level of involvement a phar-maceutical firm has with a given community ofpractice.
The key point for our argument is that forpharmaceutical firms, the members of the com-munities of practice tend to be different, depend-ing on whether they relate to the firm’s networkof alliance partners (primarily small biotechnol-ogy firms) or the networks of individual scien-tists (Gambardella, 1992). Over time, firms tend todevelop a competence to facilitate communicationwith and participation within a specific commu-nity. For example, Merck prefers to leverage theirown star scientists when exploring for new ther-apeutic areas, whereas Lilly tends to rely moreon upstream alliances (Galambos and Sturchio,1998).
It is important to note that our arguments hererelate solely to the R&D process in the pharmaceu-tical industry. Specifically, in other industries inwhich this process is not as clearly structured, starscientists may serve a complementary role in theinnovation process by suggesting potential alliancetargets and helping to facilitate the knowledge-sharing process between partners. Nonetheless, wesuggest that within the pharmaceutical industry,the transaction costs of participating in multiplecommunities of practice at the same stage in theknowledge conversion process will outweigh thesepotential benefits.
Hypothesis 1: Different upstream activities aresubstitutes, such that the interaction between
Copyright 2011 John Wiley & Sons, Ltd. Strat. Mgmt. J., 32: 895–909 (2011)DOI: 10.1002/smj
Research Notes and Commentaries 899
star scientists and upstream alliances is neg-ative and thus decreases a firm’s innovativeperformance at the margin.2
Successful innovation requires that a firm com-bines upstream and downstream value chain activ-ities (Teece, 1986). By combining these activities,firms are not only able to capture greater eco-nomic rents, but also to enhance the potential foruncovering synergies within the innovation pro-cess. Specifically, we suggest that firms that areable to integrate upstream knowledge generated bystar scientists with downstream alliances are ableto elicit complementarities. This resource combi-nation allows firms to leverage distinctly differentparts of knowledge to complete the innovation pro-cess. In downstream alliances, drug discovery andearly-stage development is completed by the newventure, before the drug is ‘handed-off’ to the phar-maceutical company for large-scale manufacturing,pre- and clinical trials, regulatory management bythe Food and Drug Administration, and finally dis-tribution and sales (Pisano and Mang, 1993). Thus,combining star scientists and downstream alliancesconstitutes a matching of complementary assetsbecause it links different types of knowledge tocomplete the value chain.
We further hypothesize that the value in com-bining upstream and downstream activities willoutweigh the costs associated with using dif-ferent mechanisms as outlined above. Supportfor this can be found in the research examin-ing the importance of organizations simultane-ously pursuing disparate innovative activities (e.g.,Tushman and O’Reilly, 1996). Such research hashighlighted the importance of being ambidextrous,or being able to balance the exploration andexploitation of knowledge. Although we do not
2 In a more technical fashion, if we define star scientists asStarUpstream and upstream alliances as AllUpstream based on theirposition on innovation value chain, and innovative performanceas π , it follows that
π(StarUpstream, AllUpstream
) − π(StarUpstream, AllUpstream
)
< π(StarUpstream, AllUpstream
) − π(StarUpstream, AllUpstream
),
where prime indicates that a firm does not engage in that specificactivity. The formula states that the innovative performance offirms that engage in upstream research through star scientistsand upstream alliances simultaneously is lower than for firmsthat engage in upstream research through either star scientistsor upstream alliances, holding all else constant (Milgrom andRoberts, 1995).
suggest that there is a precise matching betweenthe constructs of upstream/downstream and explo-ration/exploitation, the locus on knowledge (i.e.,upstream or downstream) is often reflective ofthe motivation of the accessing organization (i.e.,exploration or exploitation). Within the settingof our study, star scientists are embedded inthe greater scientific community. These relation-ships are often premised on the exploration fornew projects with the highest potential (Stephan,1996). Likewise, pharmaceutical firms tend touse their downstream connections for the pur-pose of exploiting or commercializing knowledgethat is held within the firm (Rothaermel, 2001).Thus, pursuing these mechanisms simultaneouslyis likely to be reflective of an organization that isattempting to pursue an ambidextrous innovationstrategy.
Hypothesis 2: Upstream and downstream activ-ities are complements, such that the interac-tion between star scientists and downstreamalliances is positive and thus increases a firm’sinnovative performance at the margin.3
METHODOLOGY
Research setting
The global pharmaceutical industry is our researchsetting. We tracked annual data for 108 incumbentfirms over 30 years, beginning in 1974 until theend of 2003. An incumbent pharmaceutical firm isone that was founded prior to the emergence ofbiotechnology, which commenced with the 1973breakthrough publication on r-DNA (Cohen et al.,
3 In a more technical fashion: If we define star scientists asStarUpstream and downstream alliances as AllDownstream basedon their position on innovation value chain, and innovativeperformance as π , it follows that
π(StarUpstream, AllDownstream
) − π(StarUpstream, AllDownstream
)
> π(StarUpstream, AllDownstream t
) − π(StarUpstream, AllDownstream
),
where prime indicates that a firm does not engage in that specificactivity. The formula states that the innovative performance offirms that combine upstream research through star scientists withdownstream alliances is higher than for firms that engage inupstream research through either star scientists or downstreamresearch through downstream alliances alone, holding all elseconstant (Milgrom and Roberts, 1995).
Copyright 2011 John Wiley & Sons, Ltd. Strat. Mgmt. J., 32: 895–909 (2011)DOI: 10.1002/smj
900 A. M. Hess and F. T. Rothaermel
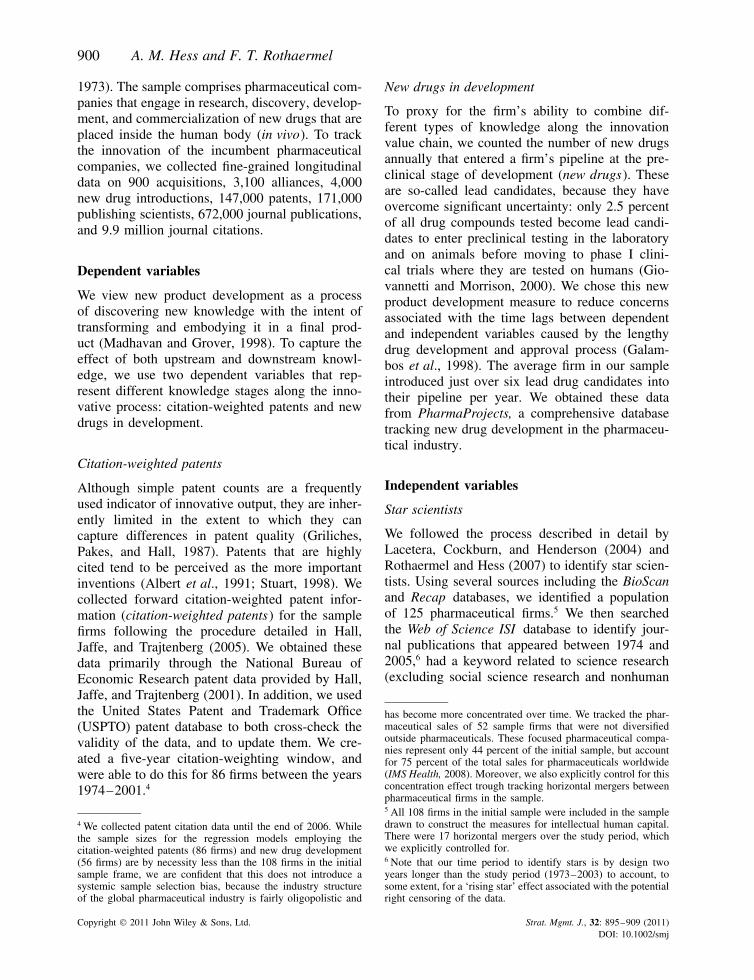
1973). The sample comprises pharmaceutical com-panies that engage in research, discovery, develop-ment, and commercialization of new drugs that areplaced inside the human body (in vivo). To trackthe innovation of the incumbent pharmaceuticalcompanies, we collected fine-grained longitudinaldata on 900 acquisitions, 3,100 alliances, 4,000new drug introductions, 147,000 patents, 171,000publishing scientists, 672,000 journal publications,and 9.9 million journal citations.
Dependent variables
We view new product development as a processof discovering new knowledge with the intent oftransforming and embodying it in a final prod-uct (Madhavan and Grover, 1998). To capture theeffect of both upstream and downstream knowl-edge, we use two dependent variables that rep-resent different knowledge stages along the inno-vative process: citation-weighted patents and newdrugs in development.
Citation-weighted patents
Although simple patent counts are a frequentlyused indicator of innovative output, they are inher-ently limited in the extent to which they cancapture differences in patent quality (Griliches,Pakes, and Hall, 1987). Patents that are highlycited tend to be perceived as the more importantinventions (Albert et al., 1991; Stuart, 1998). Wecollected forward citation-weighted patent infor-mation (citation-weighted patents) for the samplefirms following the procedure detailed in Hall,Jaffe, and Trajtenberg (2005). We obtained thesedata primarily through the National Bureau ofEconomic Research patent data provided by Hall,Jaffe, and Trajtenberg (2001). In addition, we usedthe United States Patent and Trademark Office(USPTO) patent database to both cross-check thevalidity of the data, and to update them. We cre-ated a five-year citation-weighting window, andwere able to do this for 86 firms between the years1974–2001.4
4 We collected patent citation data until the end of 2006. Whilethe sample sizes for the regression models employing thecitation-weighted patents (86 firms) and new drug development(56 firms) are by necessity less than the 108 firms in the initialsample frame, we are confident that this does not introduce asystemic sample selection bias, because the industry structureof the global pharmaceutical industry is fairly oligopolistic and
New drugs in development
To proxy for the firm’s ability to combine dif-ferent types of knowledge along the innovationvalue chain, we counted the number of new drugsannually that entered a firm’s pipeline at the pre-clinical stage of development (new drugs). Theseare so-called lead candidates, because they haveovercome significant uncertainty: only 2.5 percentof all drug compounds tested become lead candi-dates to enter preclinical testing in the laboratoryand on animals before moving to phase I clini-cal trials where they are tested on humans (Gio-vannetti and Morrison, 2000). We chose this newproduct development measure to reduce concernsassociated with the time lags between dependentand independent variables caused by the lengthydrug development and approval process (Galam-bos et al., 1998). The average firm in our sampleintroduced just over six lead drug candidates intotheir pipeline per year. We obtained these datafrom PharmaProjects, a comprehensive databasetracking new drug development in the pharmaceu-tical industry.
Independent variables
Star scientists
We followed the process described in detail byLacetera, Cockburn, and Henderson (2004) andRothaermel and Hess (2007) to identify star scien-tists. Using several sources including the BioScanand Recap databases, we identified a populationof 125 pharmaceutical firms.5 We then searchedthe Web of Science ISI database to identify jour-nal publications that appeared between 1974 and2005,6 had a keyword related to science research(excluding social science research and nonhuman
has become more concentrated over time. We tracked the phar-maceutical sales of 52 sample firms that were not diversifiedoutside pharmaceuticals. These focused pharmaceutical compa-nies represent only 44 percent of the initial sample, but accountfor 75 percent of the total sales for pharmaceuticals worldwide(IMS Health, 2008). Moreover, we also explicitly control for thisconcentration effect trough tracking horizontal mergers betweenpharmaceutical firms in the sample.5 All 108 firms in the initial sample were included in the sampledrawn to construct the measures for intellectual human capital.There were 17 horizontal mergers over the study period, whichwe explicitly controlled for.6 Note that our time period to identify stars is by design twoyears longer than the study period (1973–2003) to account, tosome extent, for a ‘rising star’ effect associated with the potentialright censoring of the data.
Copyright 2011 John Wiley & Sons, Ltd. Strat. Mgmt. J., 32: 895–909 (2011)DOI: 10.1002/smj
Research Notes and Commentaries 901
focused research, e.g., agricultural), and could beunambiguously connected with one of the pharma-ceutical firms in the sample. From the populationof over 672,000 publications, we collected the fol-lowing information: author’s name, author’s affili-ation(s), journal name, article title, keywords, pub-lication year, and number of times cited. We thencompiled a list of authors with an aggregate num-ber of publications and times cited for each year.This query yielded the records of over 171,000authors who on average published 3.9 papers andthat were cited 66.3 times. We then tied back eachauthor to the pharmaceutical firms in our samplebased on the authors’ affiliations as indicated inthe journal article(s).
We followed Rothaermel and Hess (2007) byidentifying star scientists as researchers who hadboth published and been cited at a rate of threestandard deviations above the mean.7 To qualifyfor this elite group of star scientists, an individualmust have published more than 28 papers duringthe study period and had to be cited at least 861times. Based on this intersection, we identified1,071 star scientists. These individuals representonly 0.63 percent of the total population of scien-tists in this sample, but produced 12.2 percent ofall publications and garnered 22.1 percent of allcitations. This made star scientists 19 times moreproductive in terms of research output and 35 timesmore impactful in terms of influencing other sci-entists’ research. The average pharmaceutical firmemployed about 23 star scientists (and 211 non-starscientists) in a given year. We explicitly control fornon-star scientists (non-star scientists).
Strategic alliances
To document the alliances that the pharmaceu-tical firms had entered with different partners,we tracked each firm’s alliances with universi-ties, research institutions, and biotechnology firms(Powell et al., 1996). To obtain the most accu-rate alliance data as possible, we used variousissues of the BioScan industry directory and the
7 In addition to examining stars at three standard deviations (sd)above the mean for both publications and citations, additionalsensitivity analysis indicates that our results are robust to equat-ing stardom with two and four sd above the mean, but not one sd.
Recap database.8 The average sample firm enteredapproximately one alliance per year.
We content analyzed each alliance descriptionto decompose a firm’s total strategic alliancesinto upstream and downstream agreements. Fol-lowing a well-established coding procedure inprior research (Koza and Lewin, 1998; Lavieand Rosenkopf, 2006; Park et al., 2002; Rothaer-mel, 2001), we coded grants, research and R&Dalliances as upstream alliances, because they focuson the basic research oriented upstream knowl-edge discovery activities of the value chain. Weidentified manufacturing, licensing, development,and supply alliances as downstream alliances,because they focus on the downstream knowledge-leveraging activities of the value chain. Accord-ingly, we identified 2,041 upstream alliances and1,061 downstream alliances.9
To control for differential strengths of alliancesties, we collected information for each allianceto determine whether it was based on an equityexchange, which is considered to be a strongertie (Gulati, 1995). While non-equity alliances arecontract-based cooperative agreements to exchangeknowledge and resources, equity alliances arebased on taking an equity stake in a partner,exchanging equity, or setting up a third organi-zation as a joint venture. We calculated a variableequal to the percentage of total alliances that areequity agreements (% equity alliances). About 12percent of all alliances were equity based.
Additional control variables
We include a detailed set of additional controlvariables to account for potential heterogeneityat the drug, firm, network, and industry level.These controls are well established and validated
8 BioScan and Recap are fairly consistent in their reporting.We found their intersource reliability to be greater than 0.90when documenting alliances. BioScan and Recap appear to bethe two most comprehensive publicly available data sourcesdocumenting alliance activity in the global biopharmaceuticalindustry, and they have been used frequently in prior research,although not together, but in isolation (e.g., Shan, Walker, andKogut, 1994; Lane and Lubatkin, 1998; Powell et al., 1996).9 Research assistants that were blind to each other and thetheory to be tested coded the alliance data. In addition, in anattempt to ensure the accuracy of this coding, two additionalresearch assistants independently coded each 100 randomlyselected alliance agreements. The interrater reliability was 98percent, and thus well above the recommended threshold of 70percent (Cohen et al. 2003).
Copyright 2011 John Wiley & Sons, Ltd. Strat. Mgmt. J., 32: 895–909 (2011)DOI: 10.1002/smj
902 A. M. Hess and F. T. Rothaermel
by prior research, and include: a pharmaceuti-cal family tree to control for horizontal merger(merged firm); whether a firm’s strategy is focusedsolely on drug development (e.g., Merck) or adiversified product line (e.g., Johnson and John-son) (diversified ); nationality (US, EU, or Japan);financial performance (net income); total patentpropensity (total patents), R&D expense (R&Dexpense); acquisitions focused on research anddevelopment (R&D acquisitions); the percentageof new products focused on cancer treatments (%cancer drugs); and temporal effects (year dum-mies). We collected financial data from a numberof sources including Compustat and annual finan-cial reports. All financial data are inflation adjustedin constant 2000 U.S. dollars.
Estimation procedure
The dependent variables (citation-weighted patentsand new drug indications) are count variables,and thus take on only nonnegative integer val-ues. A negative binomial estimation provides abetter fit for count data than the more restric-tive Poisson model.10 Negative binomial regres-sion accounts for an omitted variable bias, whilesimultaneously estimating heterogeneity (Cameronand Trivedi, 1986; Hausman, Hall, and Griliches,1984). Moreover, based on econometric theory, theuse of either a fixed- or a random-effects specifi-cation permits one to reduce the threat for unob-served heterogeneity (Greene, 2003). We applied aHausman (1978) specification test, and its resultsrevealed that there was not a systematic variationbetween the random- and fixed-effects estimations.Taken together, we applied the following random-effects negative binomial model:11
P(nit/ε) = e−λit−1 exp(ε)λinit−1/nit − 1!,
10 In an attempt to address the concern of endogeneity, wealso applied a conditional fixed-effects Poisson estimation. Theresults were robust.11 To assess how sensitive our results are to the reported random-effects specification, we additionally applied a conditional fixed-effects estimation. While the hypothesized results remainedrobust, in Model 1c (citation-weighted patents) there was areversion in the findings, such that the coefficient for starscientists became negative and significant (p < 0.05) and thesquared-star coefficient was positive and significant (p < 0.05).This result clearly does not fit with the rest of the estimations andwe hypothesize may be a function of the fact that the citation-weighted panel has a reduced number of time periods without acorresponding reduction in sample size. Thus, fixed effects maybe picking up more random error in these models.
where n is a nonnegative integer count variablecapturing each pharmaceutical firm’s innovativeoutput. Accordingly, P(nit/ε) indicates the prob-ability that pharmaceutical firm i develops theexpected number n of these outputs in year t .12
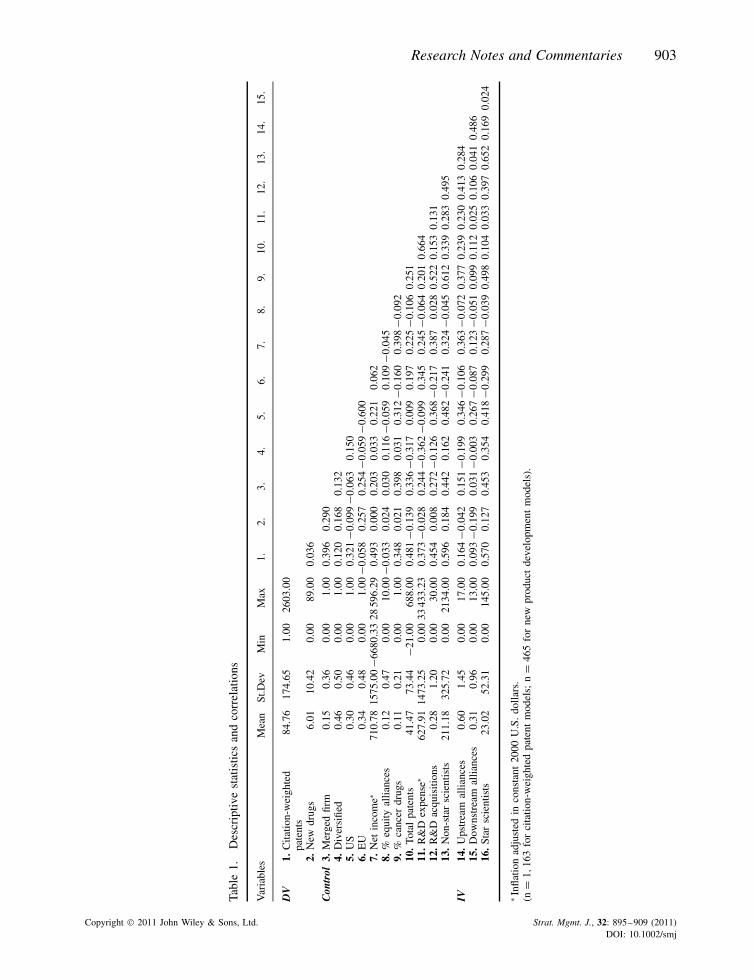
As illustrated in Table 1, all of the bivariate cor-relations are below the recommended 0.70 thresh-old. To assess the threat of multicolinearity, wecalculated the variance inflation factors (VIFs) foreach coefficient. The maximum estimated VIF forwas 5.8, well below the recommended ceiling of10 (for a discussion of these issues see Cohenet al., 2003). In an attempt to compensate for apotential simultaneity bias and to allow for poten-tial claims of causality, we lagged the financialmeasures (net income, revenues, and R&D expen-ditures) as well as alliances and acquisitions byone year (Gulati, 1999; Hall, Griliches, and Haus-man, 1986; Stuart, 1998). We did not lag ourmeasures of star scientists because of the closetemporal link between the date at which an articlewas published (this was the basis for our mea-sure of star scientists) and the innovative outputassociated with the publication (Murray, 2002).Moreover, we submit that through the applicationof the Hausman-specification test and the result-ing random-effects specification, in combinationwith an extensive set of control variables and vari-ous robustness tests, we have attempted to addressthe issue of endogeneity (Hamilton and Nicker-son, 2003). As detailed below, we also conducteda split-sample regression to assess the robustnessof our interaction results.
RESULTS
Tables 2–3 present the regression results using thetwo different dependent variables. In each case,we first estimated a baseline model including thecontrol variables and direct effects only. Next, weadded the interaction effects. With the exceptionof Model 1b, each subsequent model represents asignificant improvement over the respective base-line models at p < 0.05, or smaller. Models 1aand 2a each contain all the controls, Models 1band 2b additionally contain all direct effects as
12 The results are robust to applying a zero-inflated Poissonestimation.
Copyright 2011 John Wiley & Sons, Ltd. Strat. Mgmt. J., 32: 895–909 (2011)DOI: 10.1002/smj
Research Notes and Commentaries 903
Tabl
e1.
Des
crip
tive
stat
istic
san
dco
rrel
atio
ns
Var
iabl
esM
ean
St.D
evM
inM
ax1.
2.3.
4.5.
6.7.
8.9.
10.
11.
12.
13.
14.
15.
DV
1.C
itatio
n-w
eigh
ted
pate
nts
84.7
617
4.65
1.00
2603
.00
2.N
ewdr
ugs
6.01
10.4
20.
0089
.00
0.03
6
Con
trol
3.M
erge
dfir
m0.
150.
360.
001.
000.
396
0.29
04.
Div
ersi
fied
0.46
0.50
0.00
1.00
0.12
00.
168
0.13
25.
US
0.30
0.46
0.00
1.00
0.32
1−0
.099
−0.0
630.
150
6.E
U0.
340.
480.
001.
00−0
.058
0.25
70.
254
−0.0
59−0
.600
7.N
etin
com
e∗71
0.78
1575
.00
−668
0.33
2859
6.29
0.49
30.
000
0.20
30.
033
0.22
10.
062
8.%
equi
tyal
lianc
es0.
120.
470.
0010
.00
−0.0
330.
024
0.03
00.
116
−0.0
590.
109
−0.0
459.
%ca
ncer
drug
s0.
110.
210.
001.
000.
348
0.02
10.
398
0.03
10.
312
−0.1
600.
398
−0.0
9210
.To
tal
pate
nts
41.4
773
.44
−21.
0068
8.00
0.48
1−0
.139
0.33
6−0
.317
0.00
90.
197
0.22
5−0
.106
0.25
111
.R
&D
expe
nse∗
627.
9114
73.2
50.
0033
433.
230.
373
−0.0
280.
244
−0.3
62−0
.099
0.34
50.
245
−0.0
640.
201
0.66
412
.R
&D
acqu
isiti
ons
0.28
1.20
0.00
30.0
00.
454
0.00
80.
272
−0.1
260.
368
−0.2
170.
387
0.02
80.
522
0.15
30.
131
13.
Non
-sta
rsc
ient
ists
211.
1832
5.72
0.00
2134
.00
0.59
60.
184
0.44
20.
162
0.48
2−0
.241
0.32
4−0
.045
0.61
20.
339
0.28
30.
495
IV14
.U
pstr
eam
allia
nces
0.60
1.45
0.00
17.0
00.
164
−0.0
420.
151
−0.1
990.
346
−0.1
060.
363
−0.0
720.
377
0.23
90.
230
0.41
30.
284
15.
Dow
nstr
eam
allia
nces
0.31
0.96
0.00
13.0
00.
093
−0.1
990.
031
−0.0
030.
267
−0.0
870.
123
−0.0
510.
099
0.11
20.
025
0.10
60.
041
0.48
616
.St
arsc
ient
ists
23.0
252
.31
0.00
145.
000.
570
0.12
70.
453
0.35
40.
418
−0.2
990.
287
−0.0
390.
498
0.10
40.
033
0.39
70.
652
0.16
90.
024
∗In
flatio
nad
just
edin
cons
tant
2000
U.S
.do
llars
.(n
=1,
163
for
cita
tion-
wei
ghte
dpa
tent
mod
els;
n=
465
for
new
prod
uct
deve
lopm
ent
mod
els)
.
Copyright 2011 John Wiley & Sons, Ltd. Strat. Mgmt. J., 32: 895–909 (2011)DOI: 10.1002/smj
904 A. M. Hess and F. T. Rothaermel
Table 2. Regression results for random-effect negative binomial estimation: citation-weighted patents
Forward citation-weighted patents
Model 1a Model 1b Model 1c
beta s.e. beta s.e. beta s.e.
Year effects Included Included IncludedConstant −1.2168 (0.5770) −1.2052 (0.5772) −1.1763 (0.5768)Merged firm 0.0837 (0.0696) 0.0719 (0.0703) 0.0794 (0.0692)Diversified 0.0930 (0.0947) 0.0819 (0.0967) 0.0711 (0.0969)US firm 0.2549∗ (0.1277) 0.2517∗ (0.1289) 0.2452 (0.1285)EU firm 0.1122 (0.1298) 0.1173 (0.1313) 0.1026 (0.1313)Net income −0.0171 (0.0400) −0.0231 (0.0404) −0.0194 (0.0404)% equity alliances 0.0268 (0.0159) 0.0265∗ (0.0159) 0.0257 (0.0159)Total patents 0.2055∗∗∗ (0.0245) 0.2092∗∗∗ (0.0249) 0.2099∗∗∗ (0.0250)R&D expense 0.1369∗∗∗ (0.0241) 0.1377∗∗∗ (0.0243) 0.1421∗∗∗ (0.0241)R&D acquisitions −0.0002 (0.0168) −0.0004 (0.0172) −0.0058 (0.0174)Non-star scientists 0.1503∗∗∗ (0.0336) 0.1462∗∗∗ (0.0363) 0.1490∗∗∗ (0.0368)
Upstream alliances 0.0131 (0.0161) 0.0098 (0.0337) 0.0171 (0.0327)Upstream alliances2 0.0014 (0.0241) 0.0138 (0.0226)Downstream alliances 0.0057 (0.0145) 0.0506∗ (0.0290) 0.0492∗ (0.0292)Downstream alliances2 −0.0430∗ (0.0248) −0.0444∗ (0.0246)Star scientists −0.0221 (0.0234) 0.0128 (0.0350) 0.0272 (0.0363)Star scientists2 −0.0322∗ (0.0187) −0.0143 (0.0201)
Star scientists ×upstream alliances
−0.0159∗∗ (0.0062)
Star scientists ×downstream alliances
0.0029 (0.0060)
Log likelihood −4606.01 −4490.13 −4486.66Chi square 503.1∗∗∗ 503.8∗∗∗ 513.9∗∗∗
Improvement over base(1c2)
0.70 10.80∗
n = 1, 163∗ p < 0.05; ∗∗ p < 0.01; ∗∗∗ p < 0.001; Huber-White robust standard errors in parentheses.
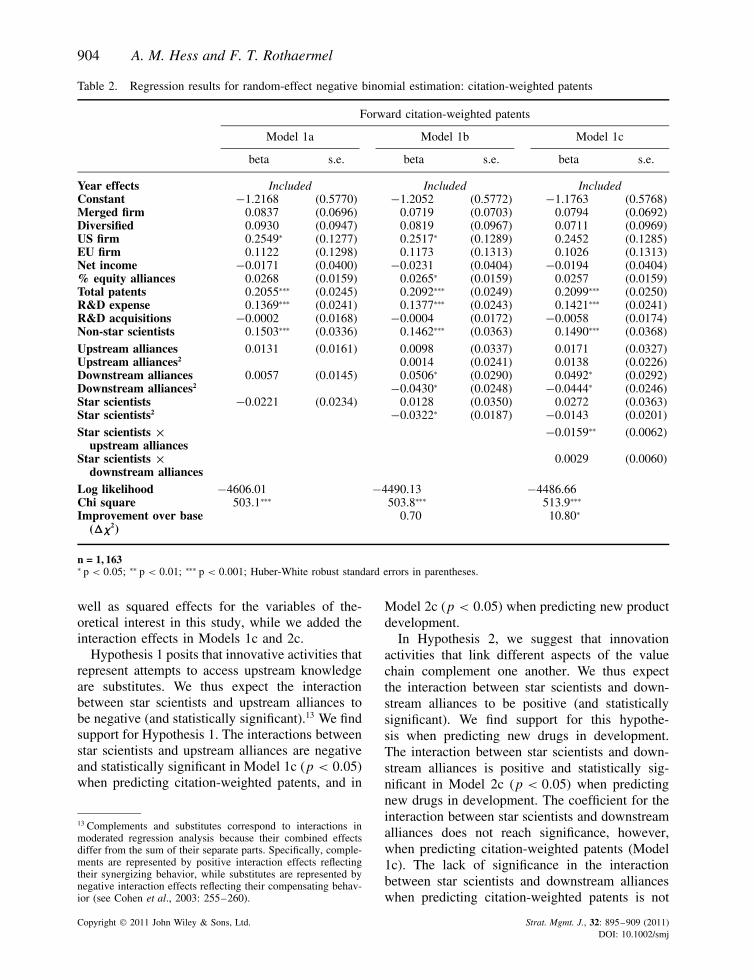
well as squared effects for the variables of the-oretical interest in this study, while we added theinteraction effects in Models 1c and 2c.
Hypothesis 1 posits that innovative activities thatrepresent attempts to access upstream knowledgeare substitutes. We thus expect the interactionbetween star scientists and upstream alliances tobe negative (and statistically significant).13 We findsupport for Hypothesis 1. The interactions betweenstar scientists and upstream alliances are negativeand statistically significant in Model 1c (p < 0.05)when predicting citation-weighted patents, and in
13 Complements and substitutes correspond to interactions inmoderated regression analysis because their combined effectsdiffer from the sum of their separate parts. Specifically, comple-ments are represented by positive interaction effects reflectingtheir synergizing behavior, while substitutes are represented bynegative interaction effects reflecting their compensating behav-ior (see Cohen et al., 2003: 255–260).
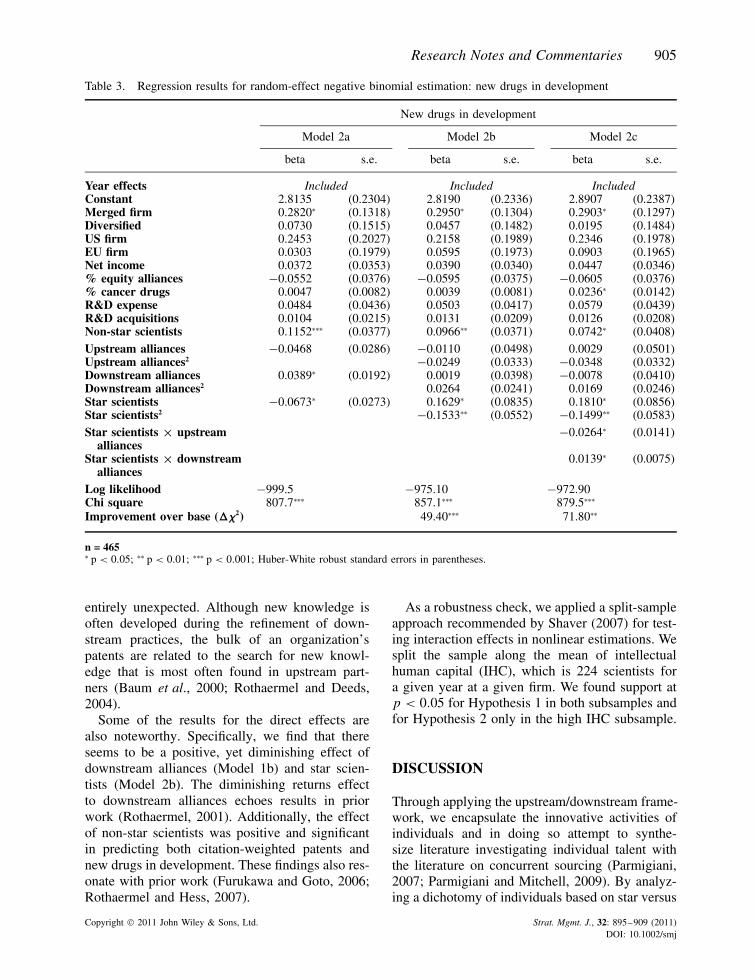
Model 2c (p < 0.05) when predicting new productdevelopment.
In Hypothesis 2, we suggest that innovationactivities that link different aspects of the valuechain complement one another. We thus expectthe interaction between star scientists and down-stream alliances to be positive (and statisticallysignificant). We find support for this hypothe-sis when predicting new drugs in development.The interaction between star scientists and down-stream alliances is positive and statistically sig-nificant in Model 2c (p < 0.05) when predictingnew drugs in development. The coefficient for theinteraction between star scientists and downstreamalliances does not reach significance, however,when predicting citation-weighted patents (Model1c). The lack of significance in the interactionbetween star scientists and downstream allianceswhen predicting citation-weighted patents is not
Copyright 2011 John Wiley & Sons, Ltd. Strat. Mgmt. J., 32: 895–909 (2011)DOI: 10.1002/smj
Research Notes and Commentaries 905
Table 3. Regression results for random-effect negative binomial estimation: new drugs in development
New drugs in development
Model 2a Model 2b Model 2c
beta s.e. beta s.e. beta s.e.
Year effects Included Included IncludedConstant 2.8135 (0.2304) 2.8190 (0.2336) 2.8907 (0.2387)Merged firm 0.2820∗ (0.1318) 0.2950∗ (0.1304) 0.2903∗ (0.1297)Diversified 0.0730 (0.1515) 0.0457 (0.1482) 0.0195 (0.1484)US firm 0.2453 (0.2027) 0.2158 (0.1989) 0.2346 (0.1978)EU firm 0.0303 (0.1979) 0.0595 (0.1973) 0.0903 (0.1965)Net income 0.0372 (0.0353) 0.0390 (0.0340) 0.0447 (0.0346)% equity alliances −0.0552 (0.0376) −0.0595 (0.0375) −0.0605 (0.0376)% cancer drugs 0.0047 (0.0082) 0.0039 (0.0081) 0.0236∗ (0.0142)R&D expense 0.0484 (0.0436) 0.0503 (0.0417) 0.0579 (0.0439)R&D acquisitions 0.0104 (0.0215) 0.0131 (0.0209) 0.0126 (0.0208)Non-star scientists 0.1152∗∗∗ (0.0377) 0.0966∗∗ (0.0371) 0.0742∗ (0.0408)
Upstream alliances −0.0468 (0.0286) −0.0110 (0.0498) 0.0029 (0.0501)Upstream alliances2 −0.0249 (0.0333) −0.0348 (0.0332)Downstream alliances 0.0389∗ (0.0192) 0.0019 (0.0398) −0.0078 (0.0410)Downstream alliances2 0.0264 (0.0241) 0.0169 (0.0246)Star scientists −0.0673∗ (0.0273) 0.1629∗ (0.0835) 0.1810∗ (0.0856)Star scientists2 −0.1533∗∗ (0.0552) −0.1499∗∗ (0.0583)
Star scientists × upstreamalliances
−0.0264∗ (0.0141)
Star scientists × downstreamalliances
0.0139∗ (0.0075)
Log likelihood −999.5 −975.10 −972.90Chi square 807.7∗∗∗ 857.1∗∗∗ 879.5∗∗∗
Improvement over base (1c2) 49.40∗∗∗ 71.80∗∗
n = 465∗ p < 0.05; ∗∗ p < 0.01; ∗∗∗ p < 0.001; Huber-White robust standard errors in parentheses.
entirely unexpected. Although new knowledge isoften developed during the refinement of down-stream practices, the bulk of an organization’spatents are related to the search for new knowl-edge that is most often found in upstream part-ners (Baum et al., 2000; Rothaermel and Deeds,2004).
Some of the results for the direct effects arealso noteworthy. Specifically, we find that thereseems to be a positive, yet diminishing effect ofdownstream alliances (Model 1b) and star scien-tists (Model 2b). The diminishing returns effectto downstream alliances echoes results in priorwork (Rothaermel, 2001). Additionally, the effectof non-star scientists was positive and significantin predicting both citation-weighted patents andnew drugs in development. These findings also res-onate with prior work (Furukawa and Goto, 2006;Rothaermel and Hess, 2007).
As a robustness check, we applied a split-sampleapproach recommended by Shaver (2007) for test-ing interaction effects in nonlinear estimations. Wesplit the sample along the mean of intellectualhuman capital (IHC), which is 224 scientists fora given year at a given firm. We found support atp < 0.05 for Hypothesis 1 in both subsamples andfor Hypothesis 2 only in the high IHC subsample.
DISCUSSION
Through applying the upstream/downstream frame-work, we encapsulate the innovative activities ofindividuals and in doing so attempt to synthe-size literature investigating individual talent withthe literature on concurrent sourcing (Parmigiani,2007; Parmigiani and Mitchell, 2009). By analyz-ing a dichotomy of individuals based on star versus
Copyright 2011 John Wiley & Sons, Ltd. Strat. Mgmt. J., 32: 895–909 (2011)DOI: 10.1002/smj
906 A. M. Hess and F. T. Rothaermel
average employees within the value chain frame-work, we demonstrate that pursuing certain activ-ities concurrently can result in improved innova-tive performance, despite their inherent differencesand unique managerial challenges. As hypothe-sized, the benefits of completing the knowledgevalue chain outweigh the costs associated withbeing able to develop the disparate competen-cies associated with both alliances and humanresource management. Pursuing the various stagesof the value chain simultaneously provides thebasis for unique resource combinations that can bethe source of superior performance. Our empiricalfinding validates Peteraf’s (1993: 187) theoreticalinsight offered in her treatise on the resource-basedview: ‘. . . a brilliant, Nobel prize winning scien-tist may be a unique resource, but unless he hasfirm-specific ties, his perfect mobility makes himan unlikely source of sustainable advantage.’ Thisimplies that any performance effects of star scien-tists on firm innovation are contingent upon thestars’ connections to other firm-specific resources(Groysberg, Lee, and Nanda, 2008).
As a corollary to this, we find that the pursuit ofredundant mechanisms simultaneously (e.g., bothactivities represent upstream activities), results ina marginal decrease in innovative performance.This substitutability may be reflective of an orga-nization that is overly focused on either upstreamor downstream activities, which is indeed a com-monly observed phenomenon (Levinthal andMarch, 1993). Repeated failure, for example, tendsto drive organizations toward extensive explo-ration for upstream knowledge (failure trap). Thedynamic of failure turns organizations into ‘fren-zies of experimentation, change, and innovation’(Levinthal and March, 1993: 105). Firms thatengage in such activities at the expense of thedownstream portion of the value chain incur thesubstantial costs of experimentation without reap-ing the commensurate benefits thereof (March,1991). These firms, for example, may pursuetoo many distinctly different scientific avenueswithout developing the competences required toexploit any new knowledge gained, and thus failto transform it into commercially viable products,processes, or services, negating any capabilitydevelopment effect (Helfat and Raubitschek,2000).
As this study represents an initial attempt tounderstand the relationship between different inno-vative activities, one limitation is related to the
research setting. We suggest that the pharmaceuti-cal industry represents an interesting and appropri-ate setting for investigating the knowledge acquisi-tion and assimilation associated with upstream anddownstream activities. Given the idiosyncrasiesassociated with the pharmaceutical industry interms of the importance of scientific knowledgeand new product development, however, futurestudies are needed to enhance the external validityof our findings. Our split-sample analysis detailedabove also highlights the importance of under-standing the differences between the behaviors ofdifferent types of firms. Specifically, our findingregarding the substitutive relationship between starscientists and upstream alliances may be a func-tion of the research setting. The knowledge-drivennature of the pharmaceutical industry is such thatorganizations expend significant resources on thedevelopment of their alliance management capabil-ity and human resources. These expenditures arelikely to augment the potential transaction costsassociated with using multiple activities simulta-neously. That is, in other industries, star scien-tists may help organizations choose their upstreamalliance partners, thus acting in a complementaryrather than substitutive manner. This is what onewould expect based on the congruence hypothesis(Burnes and Stalker, 1961).
In conclusion, we submit that this study extendsour understanding of the importance of consider-ing not only the heterogeneity of a firm’s intel-lectual human capital but also the relationshipbetween key innovative activities along the knowl-edge value chain.
ACKNOWLEDGEMENTS
We gratefully acknowledge the helpful commentsand suggestions from Associate Editor ConstanceHelfat, the anonymous SMJ reviewers, HarryBarkema, Marco Ceccagnoli, Annamaria Conti,Shmuel Ellis, Steven Floyd, Alfonso Gambardella,Ener Hakan, Ha Hoang, Matthew Higgins,Christoph Lechner, Dan Levinthal, Luis Mar-tins, Anne Miner, Gunter Muller-Stewens, JacksonNickerson, Elaine Romanelli, Henry Sauermann,Wendy Smith, Maxim Sytch, Masako Ueda, Gian-mario Verona, John Walsh, and from the sem-inar participants at Bocconi University, Boston
Copyright 2011 John Wiley & Sons, Ltd. Strat. Mgmt. J., 32: 895–909 (2011)DOI: 10.1002/smj
Research Notes and Commentaries 907
College, Georgia Institute of Technology, Pur-due University, Vanderbilt University, the Uni-versity of St. Gallen, the University of Virginia,and the INSITE Collaborative at the Universityof Wisconsin-Madison. This paper was presentedat the 2008 Israel Strategy Conference, where itreceived the Conference Best Paper Award. Wethank Paul Harrison of the U.S. Patent and Trade-mark Office for generously giving his time andexpertise. We thank Mark Edwards of DeloitteRecap LLC (www.recap.com) and IMS Healthfor making their various databases available tous. We thank Lois Gast for effective managementof this manuscript, and Deborah Gray for expertcopyediting.
Hess is a Kauffman Dissertation Fellow, andgratefully acknowledges financial support for thisresearch. Rothaermel gratefully acknowledges sup-port for this research from the National Sci-ence Foundation (NSF SES 0545544) and theSloan Foundation (Industry Studies Fellowship).Rothaermel is an Affiliate of the Sloan Biotechnol-ogy Industry Center at the University of Maryland.None of the positions taken in this paper should beconstrued as representative of the sponsoring orga-nizations, they are entirely the authors’ as are allremaining errors and omissions.
REFERENCES
Albert MB, Avery D, Narin F, McAllister P. 1991.Direct validation of citation counts as indicators ofindustrially important patents. Research Policy 20(3):251–259.
Allen T, Cohen SI. 1969. Information flow in R&Dlaboratories. Administrative Science Quarterly 14:12–19.
Arora A, Ceccagnoli M. 2006. Patent protection, comple-mentary assets, and firms’ incentives for technologylicensing. Management Science 52(2): 293–318.
Arora A, Gambardella A. 1990. Complementarity andexternal linkages: the strategies of the large firms inbiotechnology. Journal of Industrial Economics 38:361–379.
Baum JAC, Calabrese T, Silverman BS. 2000. Don’tgo it alone: alliance network composition andstartups’ performance in Canadian biotechnology.Strategic Management Journal , March Special Issue21: 267–294.
Brown JS, Duguid P. 2001. Knowledge and organization:a social-practice perspective. Organization Science12(2): 198–213.
Burnes T, Stalker G. 1961. The Management of Innova-tion . Tavistock: London, UK.
Cameron AC, Trivedi PK. 1986. Econometric modelsbased on count data: comparisons and applications
of some estimators and tests. Journal of AppliedEconometrics 1(1): 29–53.
Cassiman B, Veugelers R. 2006. In search of comple-mentarity in innovation strategy: internal R&D andexternal knowledge acquisition. Management Science52(1): 68–82.
Chesbrough HW. 2003. Open Innovation: The NewImperative for Creating and Profiting from TechnologyHarvard Business School Press: Boston, MA.
Cockburn IM, Henderson RM. 2001. Scale and scope indrug development: unpacking the advantages of size inpharmaceutical research. Journal of Health Economics20(6): 1033–1057.
Cohen J, Cohen P, West SG, Aiken LS. 2003. AppliedMultiple Regression Correlation Analysis for theBehavioral Sciences (3rd edn). Erlbaum: Mahwah, NJ.
Cohen SN, Chang ACY, Boyer HW, Helling RB. 1973.Construction of biologically functional bacterialplasmids in vitro. Proceedings of the NationalAcademy of Sciences 70(11): 3240–3244.
Cohen WM, Levinthal DA. 1990. Absorptive capacity:a new perspective on learning and innovation.Administrative Science Quarterly 35: 128–152.
Dierickx I, Cool K. 1989. Asset stock accumulation andsustainability of competitive advantage. ManagementScience 35(12): 1504–1513.
Ettlie JE, Pavlou PA. 2006. Technology-based newproduct development partnerships. Decision Sciences37(2): 117–147.
Furukawa R, Goto A. 2006. The role of corporatescientists in innovation. Research Policy 35(1):24–36.
Galambos L, Sturchio J. 1998. Pharmaceutical firms andthe transition to biotechnology: a study in strategicinnovation. Business History Review 72: 250–278.
Gambardella A. 1992. Competitive advantage from in-house scientific research: the US pharmaceuticalindustry in the 1980s. Research Policy 21(5):391–407.
Gardner T. 2005. Interfirm competition for humanresources: evidence from the software industry.Academy of Management Journal 48(2): 237–256.
Giovannetti G, Morrison S. 2000. Convergence: Thebiotechnology Industry Report . Ernst & Young: PaloAlto, CA.
Grant R, Baden-Fuller C. 2004. A knowledge accessingtheory of strategic alliances. Journal of ManagementStudies 41(1): 61–84.
Greene WH. 2003. Econometric Analysis . Prentice Hall:Upper Saddle River, NJ.
Griliches Z, Pakes A, Hall BH. 1987. The value ofpatents as indicators of inventive activity. In EconomicPolicy and Technological Performance, Dasgupta P,Stoneman P (eds). Cambridge University Press:Cambridge, UK: 97–124.
Groysberg B, Lee L, Nanda A. 2008. Can they take itwith them? The portability of star knowledge workers’performance. Management Science 54(7): 1213–1230.
Gulati R. 1995. Does familiarity breed trust? Theimplications of repeated ties for contractual choicein alliances Academy of Management Journal 38:85–112.
Copyright 2011 John Wiley & Sons, Ltd. Strat. Mgmt. J., 32: 895–909 (2011)DOI: 10.1002/smj
908 A. M. Hess and F. T. Rothaermel
Gulati R. 1998. Alliances and networks. StrategicManagement Journal , April Special Issue 19:293–317.
Gulati R. 1999. Network location and learning: theinfluence of network resources and firm capabilitieson alliance formation. Strategic Management Journal20(5): 397–420.
Hagedoorn J. 1993. Understanding the rationale ofstrategic technology partnering: interorganizationalmodes of cooperation and sectoral differences.Strategic Management Journal 14(95): 371–385.
Hall BH, Griliches Z, Hausman JA. 1986. Patents andR&D: is there a lag? International Economic Review27(2): 265–283.
Hall BH, Jaffe A, Trajtenberg M. 2001. The NBERpatent citations data file: lessons, insights, andmethodological tools. Working paper no. 8498.National Bureau of Economic Research: Cambridge,MA.
Hall BH, Jaffe A, Trajtenberg M. 2005. Market value andpatent citations. RAND Journal of Economics 36(1):16–38.
Hamilton BH, Nickerson JA. 2003. Correcting forendogeneity in strategic management research.Strategic Organization 1(1): 51–78.
Harrigan K. 1986. Matching vertical integration strategiesto competitive conditions. Strategic ManagementJournal 7(6): 535–555.
Hausman JA. 1978. Specification tests in econometrics.Econometrica 46(6): 1251–1271.
Hausman J, Hall BH, Griliches Z. 1984. Econometricmodels for count data with an application tothe patents-R&D relationship. Econometrica 52(4):909–938.
Helfat CE. 1994a. Evolutionary trajectories in petroleumfirm R&D. Management Science 40(12): 1720–1747.
Helfat CE. 1994b. Firm specificity in corporate appliedR&D. Organization Science 5: 173–173.
Helfat CE. 1997. Know-how and asset complementarityand dynamic capability accumulation: the case ofR&D. Strategic Management Journal 18(5): 339–360.
Helfat CE, Peteraf MA. 2003. The dynamic resource-based view: capability lifecycles. Strategic Manage-ment Journal , October Special Issue 24: 997–1010.
Helfat CE, Raubitschek RS. 2000. Product sequencing:co-evolution of knowledge, capabilities and products.Strategic Management Journal, October–NovemberSpecial Issue 21: 961–979.
Henderson RM, Cockburn IM. 1994. Measuring com-petence? Exploring firm effects in pharmaceuticalresearch. Strategic Management Journal , Winter Spe-cial Issue 15: 63–84.
IMS-Health. 2008. Global Pharmaceutical Sales 2000–2007. Available at: http://www.imshealth.com/deployedfiles/imshealth/Global/Content/StaticFile/Top Line Data/GlobalSales.pdf (15 September 2008).
Kogut B, Zander U. 1992. Knowledge of the firm,combinative capabilities and the replication oftechnology. Organization Science 3(3): 383–397.
Koza MP, Lewin AY. 1998. The co-evolution of strategicalliances. Organization Science 9(3): 255–264.
Lacetera N, Cockburn IM, Henderson RM. 2004. Dofirms change capabilities by hiring new people? Astudy of the adoption of science-based drug discovery.In Business Strategy over the Industry Lifecycle:Advances in Strategic Management, Baum JAC,McGahan AM (eds). Elsevier: Oxford, UK; 133–159.
Lane PJ, Lubatkin MH. 1998. Relative absorptivecapacity and interorganizational learning. StrategicManagement Journal 19(5): 461–477.
Lavie D, Rosenkopf L. 2006. Balancing explorationand exploitation in alliance formation. Academy ofManagement Journal 49(6): 797–818.
Levinthal DA, March JG. 1993. The myopia of learning.Strategic Management Journal , Winter Special Issue14: 95–112.
Madhavan R, Grover R. 1998. From embedded knowl-edge to embodied knowledge: new product develop-ment as knowledge management. Journal of Marketing62(4): 1–12.
March JG. 1991. Exploration and exploitation inorganizational learning. Organization Science 2(1):71–87.
Milgrom P, Roberts J. 1995. Complementarities andfit strategy, structure, and organizational change inmanufacturing. Journal of Accounting and Economics19(2–3): 179–208.
Murray F. 2002. Innovation as co-evolution of scientificand technological networks: exploring tissue engineer-ing. Research Policy 31: 1389–1403.
Park SH, Chen R, Gallagher S. 2002. Firm resources asmoderators of the relationship between market growthand strategic alliances in semiconductor start-ups.Academy of Management Journal 45(3): 527–545.
Parmigiani A. 2007. Why do firms both make and buy?An investigation of concurrent sourcing. StrategicManagement Journal 28(3): 285–311.
Parmigiani A, Mitchell W. 2009. Complementarity,capabilities, and the boundaries of the firm: the impactof within-firm and interfirm expertise on concurrentsourcing of complementary components. StrategicManagement Journal 30(10): 1065–1091.
Peteraf MA. 1993. The cornerstones of competitiveadvantage: a resource-based view. Strategic Manage-ment Journal 14(3): 179–191.
Pisano G, Mang P. 1993. Collaborative product develop-ment and the market for know–how: strategies andstructures in the biotechnology industry. In Researchon Technological Innovation, Management and Pol-icy. Rosenbloom R, Burgelman R (eds). JAI. Press:Greenwich, CT; 109–136.
Powell WW, Koput KW, Smith-Doerr L. 1996. Interor-ganizational collaboration and the locus of innovation:networks of learning in biotechnology. AdministrativeScience Quarterly 41(1): 116–145.
Reed R, DeFillippi RJ. 1990. Causal ambiguity, barriersto imitation, and sustainable competitive advantage.Academy of Management Review 15: 88–102.
Rothaermel FT. 2001. Incumbent’s advantage throughexploiting complementary assets via interfirm cooper-ation. Strategic Management Journal , June–July Spe-cial Issue 22: 687–699.
Copyright 2011 John Wiley & Sons, Ltd. Strat. Mgmt. J., 32: 895–909 (2011)DOI: 10.1002/smj
Research Notes and Commentaries 909
Rothaermel FT, Deeds DL. 2004. Exploration andexploitation alliances in biotechnology: a systemof new product development Strategic ManagementJournal 25(3): 201–221.
Rothaermel FT, Hess AM. 2007. Building dynamiccapabilities: innovation driven by individual, firm,and network level effects. Organization Science 18(6):898–921.
Rothaermel FT, Hitt MA, Jobe LA. 2006. Balancingvertical integration and strategic outsourcing: effectson product portfolio, product success, and firmperformance. Strategic Management Journal 27(11):1033–1056.
Shan W, Walker G, Kogut B. 1994. Interfirm cooperationand startup innovation in the biotechnology industry.Strategic Management Journal 15(5): 387–394.
Shaver J. 2007. Interpreting empirical results in strategyand management research. Research Methodology inStrategy and Management 4: 273–293.
Stephan P. 1996. The economics of science. Journal ofEconomic Literature 34(3): 1199–1235.
Stuart T. 1998. Network positions and propensities tocollaborate: an investigation of strategic alliance for-mation in a high-technology industry. AdministrativeScience Quarterly 43(3): 668–698.
Teece DJ. 1986. Profiting from technological innovation:implications for integration, collaboration, licensingand public policy. Research Policy 15(6): 285–305.
Teece D. 1992. Competition, cooperation, and innovation:organizational arrangements for regimes of rapidtechnological progress. Journal of Economic Behaviorand Organization 18(1): 1–25.
Tushman M, O’Reilly CA. 1996. Ambidextrous orga-nizations: managing evolutionary and revolutionarychange. California Management Review 38(4): 8–30.
Williamson O. 1991. Comparative economic organiza-tion: the analysis of discrete structural alternatives.Administrative Science Quarterly 36(2): 269–296.
Zucker LG, Darby MR. 1996. Costly information: firmtransformation, exit, or persistent failure. AmericanBehavioral Scientist 39(8): 959–974.
Zucker LG, Darby MR. 1997. Individual action and thedemand for institutions: star scientists and institutionaltransformation. American Behavioral Scientist 40(4):502–513.
Zucker LG, Darby MR, Brewer MB. 1998. Intellectualhuman capital and the birth of U.S. biotechnol-ogy enterprises. American Economic Review 88(1):290–306.
Copyright 2011 John Wiley & Sons, Ltd. Strat. Mgmt. J., 32: 895–909 (2011)DOI: 10.1002/smj