what we eat in america, nhanes dietary data: what … · what we eat in america, nhanes dietary...
TRANSCRIPT

What We Eat in America, NHANES Dietary Data: What To Know and How to Use It
2012 Workshop for National Conference on Health Statistics Washington, DC August 6, 2012

Dietary Data: What To Know and How to Use It
Dietary Data Collection and Products Alanna Moshfegh
Data Preparation Steps for Dietary Analysis Randy LaComb
Dietary Data Analysis Using SAS Joe Goldman

Dietary Data Collection and Products
Alanna J. Moshfegh Food Surveys Research Group
Beltsville Human Nutrition Research Center Agricultural Research Service US Department of Agriculture

National dietary data collection . . .
Partnership between USDA and DHHS

National Health and Nutrition Examination Survey
Objective: Assess health and nutritional status of children and adults in the U.S.
Annual national sample 5,000 persons Data released publicly in 2-year cycles

Dietary Interview Component of NHANES
5,000 individuals each year
Sample:
2 days of dietary intake data
Dietary Collection:
Method: USDA’s Automated Multiple Pass Method used since 2002
National Survey: What We Eat in America, NHANES
Partnership: Department of Health & Human Services US Department of Agriculture

Dietary Component USDA Automated Multiple Pass Method—24-hour
dietary recall instrument Interview administration
Day 1: in-person Day 2: telephone Bilingual dietary interviewers
Sample: all ages
Day 1: 100% sample Day 2: 100% sample

Dietary Interview Features
In-Person Interview—Day 1
interview at MEC on exam day
2D and 3D food models
appointment set for telephone interview
food measurement aids provided for use during telephone interview

NHANES Mobile Exam Center
OP96S041

Dietary Interview Features
Telephone Interview—Day 2 interview 3-10 days post-exam
2D and limited 3D food models - USDA Food Model Booklet - measuring cups and spoons - ruler - two household spoons

USDA Food Model Booklet

USDA Automated Multiple-Pass Method
Quick List Step 1
... listing of all foods and beverages
Forgotten Foods Step 2
... Probes for forgotten food items
Time & Occasion Step 3
... Ask for each food
Detail Cycle Step 4
... Standardized probes and questions for each food
Final Probe Step 5
... A final probe for anything else

. . .
Step 1: Quick List

Step 2: Forgotten Foods List
Other categories include: Alcoholic beverages Sweets Savory snacks Fruits and vegetables and cheese Breads and rolls Anything else
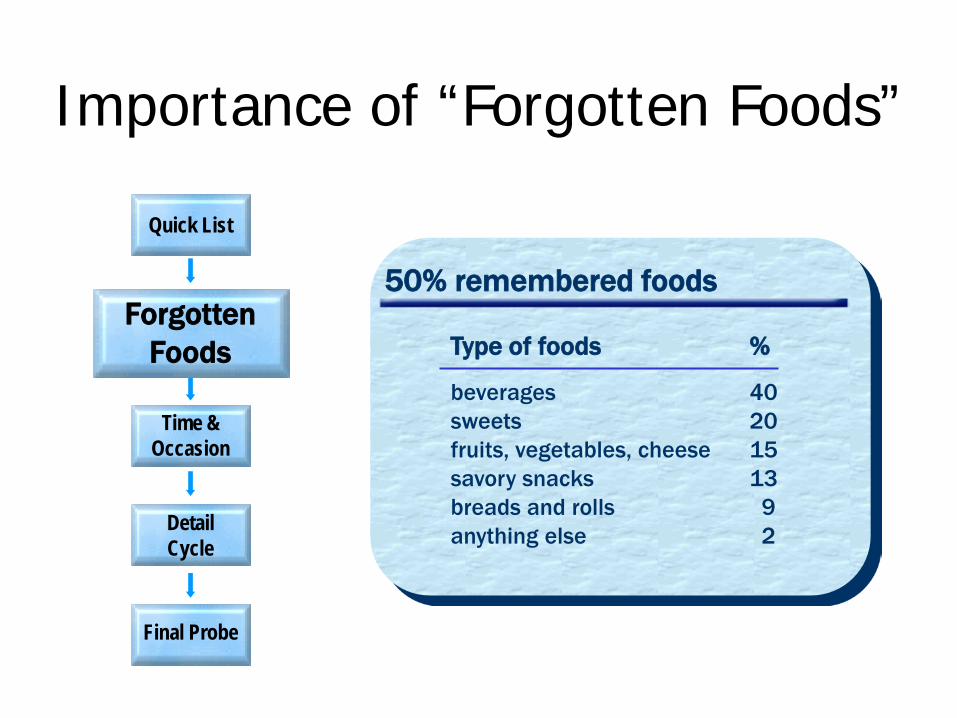
Type of foods % beverages 40 sweets 20 fruits, vegetables, cheese 15 savory snacks 13 breads and rolls 9 anything else 2
Forgotten Foods
Importance of “Forgotten Foods”
50% remembered foods
Quick List
Time & Occasion
Detail Cycle
Final Probe

Step 3: Time and Occasion
time entered here

Step 3: Time and Occasion

Step 3: Time and Occasion
occasion entered here

Step 4: Detail Cycle
Four Tasks to be completed:
• collect description of each food
• amount consumed
• addition(s) for each food
• review 24-hr day

Percent of Foods Reported by Probes
< 6 6-10 11-15 16+
Number of Probes
Source: What We Eat in America, NHANES 2005-2006, all individuals, 2 days
Foods reported/year = ~125,000 Average number of probes/food = 6 Maximum number of probes = 59 54%
35
7 4

Step 5: Final Probe

Validation Study
• Validate AMPM comparing energy intake with total energy expenditure measured by the doubly-labeled water technique
• 524 adults from Washington DC - Baltimore area • 5 cohorts, July 2002 – September 2003 • 14-day study period for each subject • 3 24-hr recalls - - first in person, others by telephone • Numerous other health and physical activity measures
Objective
Study Design

0
500
1000
1500
2000
2500
3000
3500
Females Males
TEE EI (3-day average)
Results of AMPM Validation Study
kcal/d
*
*
* Significant at <5% Source: Moshfegh et al, AJCN 2008:88:324-32
Energy intake was under-reported by: 11% overall <3% for normal weight 16% for over weight
Females Males Females Males Females Males
BMI < 25 BMI > 30 BMI 25 – 29.9
*
*
*
*
(n=94) (127) (114) (79) (54) (56)

How do we interview children?
< 6 years -- proxy respondent 6 - 8 years -- proxy respondent and child
9 - 11 years -- child and proxy-assisted
12 and over -- child

Data Retrieval
eating occasion reported … but with no foods or with some foods
children <12 years

Food and Nutrient Database for Dietary Studies (FNDDS)
Used to code foods and amounts to determine nutrient content of foods
Food descriptions, mainly generic ~ 7,000 food codes Food portions and weights 30,000+ portions in grams Food energy & 64 nutrients based on USDA National
Nutrient Database for Standard Reference, 24
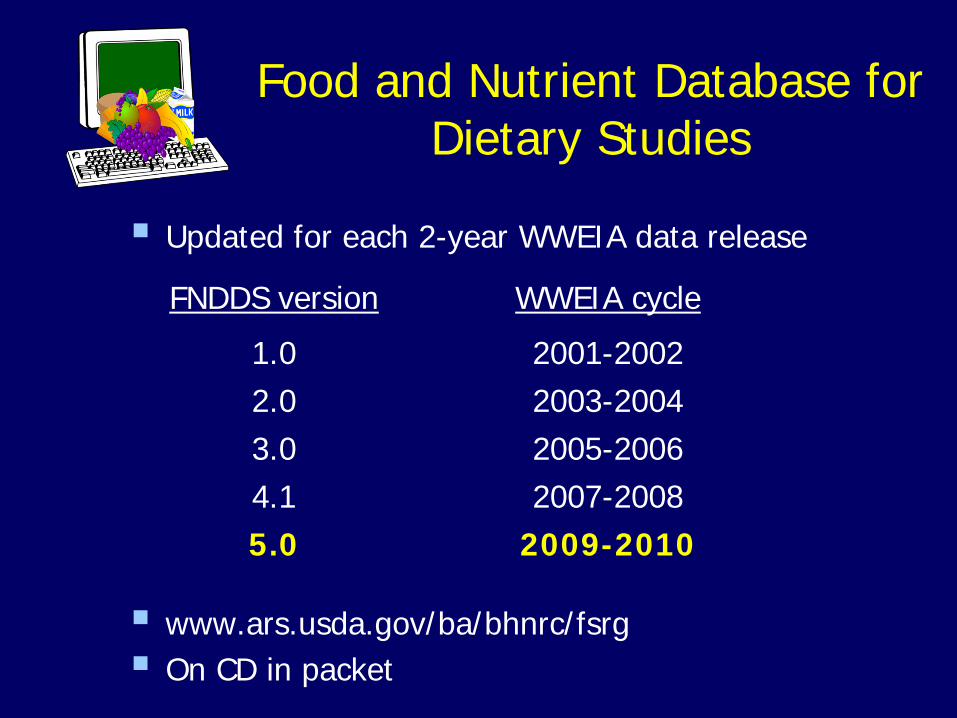
Food and Nutrient Database for Dietary Studies
Updated for each 2-year WWEIA data release www.ars.usda.gov/ba/bhnrc/fsrg On CD in packet
FNDDS version WWEIA cycle
1.0 2001-2002 2.0 2003-2004 3.0 2005-2006 4.1 2007-2008 5.0 2009-2010
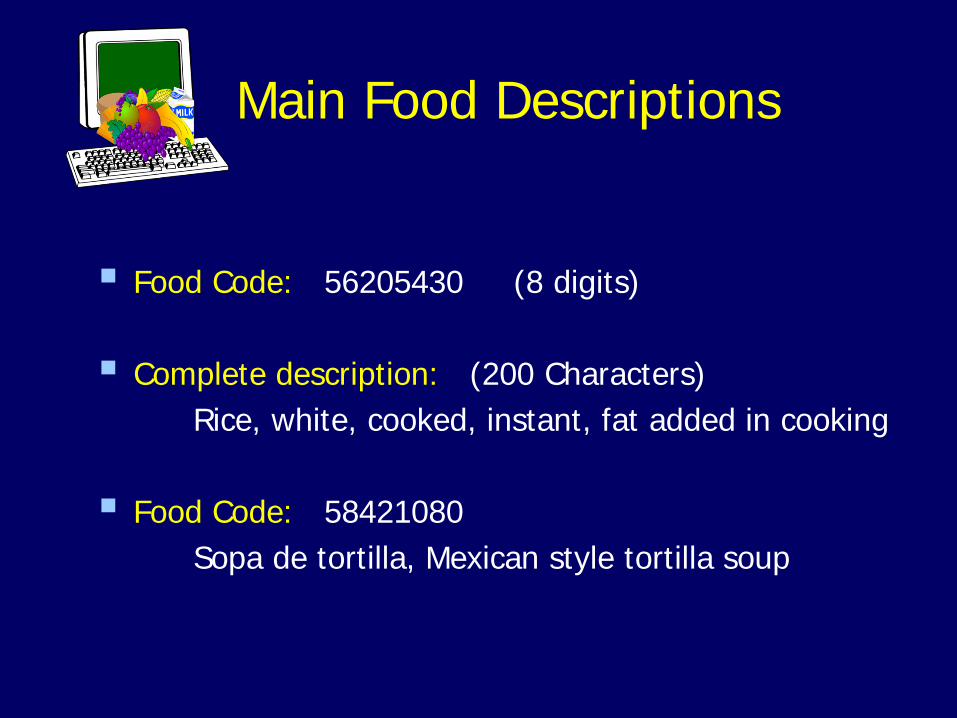
Main Food Descriptions
Food Code: 56205430 (8 digits) Complete description: (200 Characters) Rice, white, cooked, instant, fat added in cooking
Food Code: 58421080 Sopa de tortilla, Mexican style tortilla soup

USDA Food Code - - in IFF DR1IFDCD and DR2IFDCD
8 digit code number is in each food record. Description is not in food record.
Can link to food descriptions in two ways:
FNDDS Food Code Description File DRXFCD_F

Modification Codes
Recipe and nutrients adjusted to represent food eaten Often reflect type of fat used in cooking
2.5% of foods reported
6 digit code, variable DR1MC, DR2MC
Modification Code Description File DRXMCD_F in IFF

Combinations are used for…
Two or more foods eaten as a unit Items added to main food, eaten together Components / ingredients of foods - - home-prepared & non-fast food sandwiches and salads
Unusual mixtures not in FNDDS


Dietary Data for Download
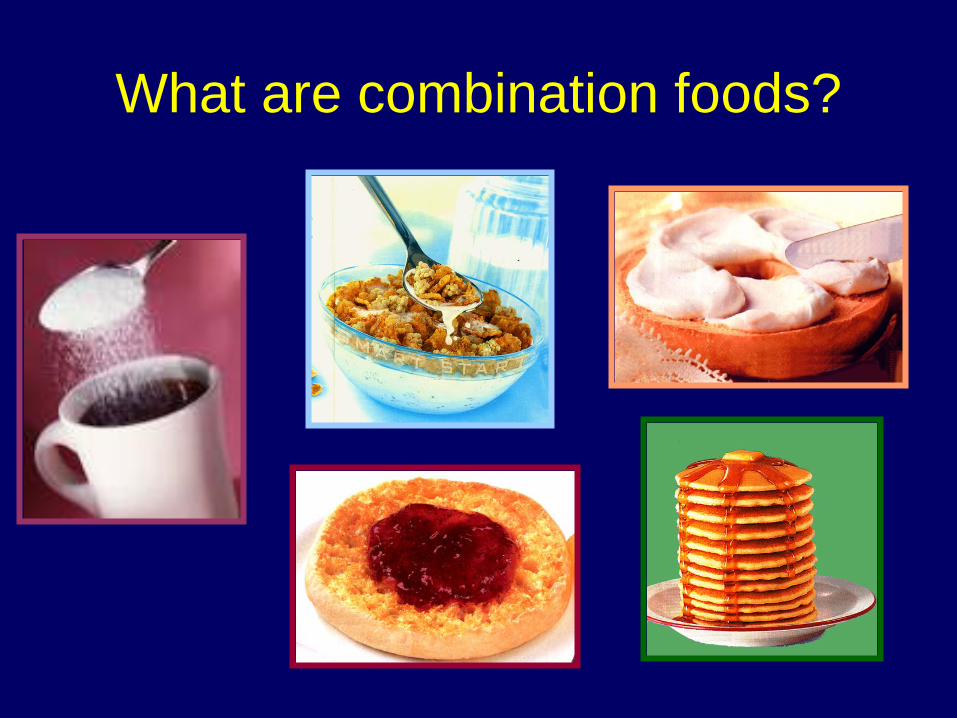
What are combination foods?

Combination: number & type
All line items in a combination have same values for 2 variables: Combination food number - DR1CCMNM: links a group of foods eaten together as a unit Combination food type - DR1CCMTZ: identifies the general type of combination
Number Type
Bagel 1 3
Cream Cheese 1 3 Coffee 2 1 Sugar 2 1

Combination Food Types by Percent use
0: Not in combination food 56% 8: Ice crm/frz yogurt w/ adds <1
1: Beverage w/ additions 8 9: Dried beans/veg w/ adds 3
2: Cereal w/ additions 5 10: Fruit w/ additions <1
3: Bread/baked prod w/ adds 4 11: Tortilla products 3
4: Salad 4 12: Meat, poultry, fish 2
5: Sandwiches 11 13: Lunchables <1
6: Soup <1 14: Chips w/ additions <1
7: Frozen meals <1 90: Other mixtures 3
Table in “Key Points” handout and Survey Documentation

Information Collected
Detailed description and amount of each food and beverage including water consumed during previous 24-hour period
Additions to the food
What foods were eaten in combination
Time each food consumed and name of eating occasion
Was food eaten at home? Source of tap water Day of the week Daily intake usual, more than or less than usual
Frequency of fish & shellfish consumption for 1 yr of age and older
Use and type of salt at table and in preparation
Intakes of energy and 64 nutrients – vitamin D added in 2007-2008


Summary Data Tables


Reports on Usual Intakes Compared to Dietary Reference Intakes


Dietary Data Briefs

www.ars.usda.gov/ba/bhnrc/fsrg
To keep informed about dietary data products, join the FSRG listserv at . . .
Thank you