what matters in corporate governance? - harvard law …€¦ · what matters in corporate...
TRANSCRIPT

What Matters in Corporate Governance?
Lucian BebchukHarvard Law School and NBER
Alma CohenTel-Aviv University Department of Economics, NBER, and Harvard LawSchool Olin Center for Law, Economics, and Business
Allen FerrellHarvard Law School and ECGI
We investigate the relative importance of the twenty-four provisions followed by the In-vestor Responsibility Research Center (IRRC) and included in the Gompers, Ishii, andMetrick governance index (Gompers, Ishii, and Metrick 2003). We put forward an en-trenchment index based on six provisions: staggered boards, limits to shareholder bylawamendments, poison pills, golden parachutes, and supermajority requirements for mergersand charter amendments. We find that increases in the index level are monotonically asso-ciated with economically significant reductions in firm valuation as well as large negativeabnormal returns during the 1990–2003 period. The other eighteen IRRC provisions not inour entrenchment index were uncorrelated with either reduced firm valuation or negativeabnormal returns. (JEL G30, G34, K22)
There is now widespread recognition, as well as growing empirical evidence,that corporate governance arrangements can substantially affect shareholders.But which provisions, among the many provisions firms have and outsideobservers follow, are the ones that play a key role in the link between corporategovernance and firm value? This is the question we investigate in this article.
An analysis that seeks to identify which provisions matter should not lookat provisions in isolation without controlling for other corporate governanceprovisions that might also influence firm value. Thus, it is desirable to look ata universe of provisions together. We focus in this article on the universe of
For those wishing to use the entrenchment index put forward in this paper in their research, data on firms’ entrench-ment index levels is available at http://www.law.harvard.edu/faculty/bebchuk/data.shtml. A list of over seventy-five studies already using the index is available at http://www.law.harvard.edu/faculty/bebchuk/studies.shtml. Forhelpful suggestions and discussions, we are grateful to Bernie Black, Victor Chernozhukov, Martijn Cremers,Ray Fisman, Yaniv Grinstein, Robert Marquez, Andrew Metrick, Guhan Subramanian, Greg Taxin, ManuelTrajtenberg, Yishay Yafeh, Rose Zhao, Michael Weisbach (the editor), an anonymous referee, and conferenceparticipants at the NBER, Washington University, the Oxford Saı̈d Business School, Tel-Aviv University, theBank of Israel, and the ALEA annual meeting. Our work benefited from the financial support of the NathanCummins Foundation; the Guggenheim Foundation; the Harvard Law School John M. Olin Center for Law,Economics, and Business; the Harvard Milton fund; and the Harvard Program on Corporate Governance. Sendcorrespondence to Lucian Bebchuk, Harvard Law School, Cambridge, MA 02138; telephone: (617) 495-3138;fax: (617) 812-0554; E-mail: [email protected].
C© The Author 2008. Published by Oxford University Press on behalf of The Society for Financial Studies. Allrights reserved. For Permissions, please e-mail: [email protected]:10.1093/rfs/hhn099
RFS Advance Access published November 27, 2008

The Review of Financial Studies
provisions that the Investor Responsibility Research Center (IRRC) monitorsfor institutional investors and researchers interested in corporate governance.The IRRC follows twenty-four governance provisions (the IRRC provisions)that appear beneficial to management, and which may or may not be harmfulto shareholders. Prior research has identified a relationship between the IRRCprovisions in the aggregate and firm value. In an influential article, Gompers,Ishii, and Metrick (2003) found that a broad index based on these twenty-fourprovisions, giving each IRRC provision equal weight, was negatively correlatedwith firm value, as measured by Tobin’s Q, as well as stockholder returns duringthe decade of the 1990s. Not surprisingly, a substantial amount of subsequentresearch has utilized this index (the “GIM index”) as a measure of the qualityof firms’ governance provisions.1
There is no a priori reason, of course, to expect that all the twenty-fourIRRC provisions contribute to the documented correlation between the IRRCprovisions in the aggregate and Tobin’s Q, as well as stock returns in the1990s.2 Some provisions might have little relevance, and some provisionsmight even be positively correlated with firm value. Among those provisionsthat are negatively correlated with firm value or stock returns, some might bemore so than others. Furthermore, some provisions might be at least partlythe endogenous product of the allocation of power between shareholders andmanagers set by other provisions. In this article, we look inside the box of theIRRC provisions to identify which of them are responsible for the correlationbetween these provisions in the aggregate and firm value.
We begin our investigation by identifying a hypothesis for testing. In par-ticular, we hypothesize that six provisions among the twenty-four provisionstracked by IRRC play a significant role in driving the documented correlationbetween IRRC provisions and firm valuation. We include in this list of six pro-visions all the provisions among the IRRC provisions that have systematicallydrawn substantial opposition from institutional investors voting on precatoryresolutions. To confirm that focusing on these provisions is plausible, we alsoperformed our own analysis of their consequences, as well as conducting inter-views with six leading M&A practitioners.
Of the six provisions, four set constitutional limits on shareholder vot-ing power, which is the primary power shareholders have. These fourarrangements—staggered boards, limits to shareholder amendments of the by-laws, supermajority requirements for mergers, and supermajority requirementsfor charter amendments—limit the extent to which a majority of shareholders
1 See, for example, Harford, Mansi, and Maxwell (2008); Klock, Mansi, and Maxwell (2005); Amit and Villalonga(2006); John and Litov (2006); Perez-Gonzalez (2006); Cremers, Nair, and Wei (2007); and Dittmar and Mahrt-Smith (2007).
2 This point was recognized by Gompers, Ishii, and Metrick (2003). To focus on examining the general questionwhether there is a connection between corporate governance provisions in the aggregate and firm value, theychose to abstract from assessing the relative significance of provisions by assigning an equal weight to all theIRRC provisions.
2

What Matters in Corporate Governance?
can impose their will on management. Two other provisions are the most well-known and salient measures taken in preparation for a hostile offer: poison pillsand golden parachute arrangements.
We construct an index, which we label the entrenchment index (E index),based on these six provisions. Each company in our database is given a score,from 0 to 6, based on the number of these provisions that the company has in thegiven year or month. We first explore whether these entrenching provisions arecorrelated with lower firm value as measured by Tobin’s Q. We find that, con-trolling for the rest of the IRRC provisions, the entrenching provisions—bothindividually and in the aggregate—are negatively correlated with Tobin’s Q.Increases in our E index are correlated, in a monotonic and economically sig-nificant way, with lower Tobin’s Q values. Moreover, the provisions in the Eindex appear to be largely driving the correlation that the IRRC provisionsin the aggregate have with Tobin’s Q. We find no evidence that the eighteenprovisions not in the E index are negatively correlated, either in the aggregateor individually, with Tobin’s Q.
Of course, documenting that entrenching provisions are negatively correlatedwith lower firm valuation, like the earlier finding that the IRRC provisions inthe aggregate are correlated with lower firm valuation, does not establish thatthe entrenching provisions, or that the IRRC provisions in general, cause lowerfirm valuation. The identified correlation could be at least partly the product ofthe tendency of managers of low-value firms to adopt entrenching provisions.It is worth noting that even if the identified correlation between low Tobin’s Qand high entrenchment were traceable to the tendency of low-Q firms to adopthigh entrenchment levels (for some firms this occurred in the mid-1980s), itwould have still been possible for entrenchment to play a key role in enablingthe low-Q firms to retain their low-Q status. A high entrenchment level mightprotect low-Q firms from being taken over or forced to make changes that wouldraise their Tobin’s Q. Indeed, such an effect is presumably why low-Q firmsmight wish to adopt and retain a high level of entrenchment. Thus, a mere serialcorrelation in firms’ Tobin’s Qs does not indicate that causality runs primarilyfrom low Q to high entrenchment, rather than in the opposite direction.
In any event, to explore this issue, we examine how firm valuation duringthe last five years of our sample period is correlated with firms’ entrenchmentscores as of 1990. We find that, even after controlling for firm valuation in 1990,high entrenchment scores in 1990 are negatively correlated with firm valuationat the end of our sample period. In addition, in firm fixed effects regressionscontrolling for the unobserved time-invariant characteristics of firms, we findthat increases in the E index during our sample period are associated withdecreases in Tobin’s Q. Although more work remains to be done on the questionof causation, both of these findings are consistent with the possibility that theidentified correlation between entrenchment and low Q is not fully the productof the low Q that firms adopting high entrenchment levels had in the firstplace.
3

The Review of Financial Studies
After analyzing the relation between the E index and Tobin’s Q, we ex-plore the extent to which the six provisions in the index are responsible forthe documented correlation between the IRRC provisions and reduced stock-holder returns during the 1990s. We find that the entrenching provisions werecorrelated with a reduction in firms’ stock returns both during the 1990–1999period that Gompers, Ishii, and Metrick (2003) studied and during the longer1990–2003 period that we were able to study using the data we had. A strategyof buying firms with low E index scores and, simultaneously, selling short firmswith high E index scores would have yielded substantial abnormal returns. Toillustrate, during the 1990–2003 period, buying an equally weighted portfolioof firms with a zero E index score and selling short an equally weighted portfo-lio of firms with E index scores of 5 and 6 would have yielded an average annualabnormal return of approximately 7%. In contrast, we do not find evidence thatthe eighteen IRRC provisions not in our E index are correlated with reducedstock returns during the time periods (1990–1999; 1990–2003) we study.
A finding of a correlation between governance and returns during a given pe-riod is subject to different possible interpretations (see, for example, Gompers,Ishii, and Metrick 2003; Cremers, Nair, and John 2008). Our results on returnsdo not enable choosing among these interpretations, and they should not betaken to imply that the identified correlation between the E index and returnsreflect market inefficiency or that it should be expected to continue in the future.But our return results do serve to highlight the significance that the E indexprovisions have among the larger universe of IRRC provisions.
We conclude that the six entrenching provisions in our E index largely drivethe documented negative correlation that the IRRC provisions in the aggregatehave with firm valuation and stockholder returns since 1990. This identificationcan contribute to the literature and to future work in corporate governance inseveral ways. First, our index can be used, and has already been widely used, bywork seeking to examine the association between shareholder rights and variouscorporate decisions and outcomes. To the extent that the eighteen provisions inthe GIM index that are not in the E index represent “noise,” the E index canbe useful by providing a measure of corporate governance quality that is notaffected by the “noise” created by the inclusion of these provisions. Indeed,since the appearance of the discussion paper version of this article (Bebchuk,Cohen, and Ferrell 2004), more than seventy-five papers have already used ourE index in their analysis.3
In addition, our work contributes by identifying a small set of provisionson which future research work, as well as private and public decision makers,may want to focus. Knowing which provisions are responsible for the identifiednegative correlation between the IRRC provisions and firm performance can beuseful for investigating the extent to which governance provisions affect (rather
3 See, for example, Masulis, Wang, and Xie (2007). For a list of the papers using the index, see http://www.law.harvard.edu/faculty/bebchuk/studies.shtml.
4

What Matters in Corporate Governance?
than reflect) value. In addition, to the extent that the identified correlationbetween the provisions in our E index and firm value at least partly reflectsa causal relation going from entrenchment to firm value, these provisions areones that deserve the attention of private and public decision makers seeking toimprove corporate governance. Indeed, even if the correlation were fully drivenby the desire of firm insiders at lower valued firms to protect themselves, itwould be beneficial for researchers and decision makers to know the provisionson which such protection efforts are concentrated.
Finally, although our investigation is limited to the universe of IRRC provi-sions, our findings have significant implications for those investigating othersets of governance provisions. In particular, our findings cast some doubt onthe wisdom of an approach recently followed by shareholder advisory firms.Responding to the demand for measures of the quality of corporate governance,some shareholder advisory firms have developed and marketed indexes basedon a massive number of governance attributes. Institutional Shareholder Ser-vices (ISS), the most influential shareholder advisory firm, has developed agovernance metric based on 61 elements (see Brown and Caylor 2006). Gover-nance Metric International has been even more ambitious, including more thansix hundred provisions in its index. The development and use of these indexeshas put pressure on firms to change their governance arrangements in ways thatwill improve their rankings.
Our results indicate that this “kitchen sink” approach of shareholder advisoryfirms might be misguided. Among a large set of governance provisions, theprovisions of real significance are likely to constitute only a limited and possiblysmall subset. As a result, an index that gives weight to many provisions thatdo not matter, and as a result under-weighs the provisions that do matter, islikely to provide a less accurate measure of governance quality than an indexthat focuses only on the latter. Furthermore, when the governance indexes ofshareholder advisory firms include many provisions, firms seeking to improvetheir index rankings might be induced to make irrelevant or even undesirablechanges and might use their improved rankings to avoid making the few smallchanges that do matter. Thus, institutional investors deciding which firms toinclude in their portfolios and which governance changes to press for wouldlikely be better served if shareholder advisory firms were to use governancemeasures based on a small number of key provisions rather than attempt tocount all the trees in the governance forest.
In a prior work, Cremers and Nair (2005) use an index based on four ofthe provisions in the GIM index and show that it is negatively correlated withTobin’s Q, but they do not attempt to show either that other provisions donot matter or that each of the provisions used in their index matters (and,indeed, our results indicate that neither is the case). In another relevant priorwork, Bebchuk and Cohen (2005) show that, controlling for all other IRRCprovisions, staggered boards are negatively correlated with Tobin’s Q. Thatpaper did not identify which IRRC provisions other than staggered boards are
5

The Review of Financial Studies
negatively correlated with firm value, however, and thus completed only the firststep in the inquiry we pursue fully in this article. Although the literature usingthe GIM index is large, ours is the only effort to provide a full identificationof the IRRC provisions that do and do not matter, with other work largelyaccepting and using our results concerning this identification.
The rest of our analysis is organized as follows. Section 1 provides the neededbackground in terms of theory and institutional detail. Section 2 describes thedata. Section 3 studies the correlation between the E index and firm value.Section 4 studies the correlation between this index and stock returns duringthe 1990–1999 and 1990–2003 periods. Section 5 offers some concludingremarks.
1. The E Index and Its Elements
The definitions of the twenty-four corporate governance provisions tracked bythe IRRC, including the six that we hypothesize matter in terms of increasingentrenchment, are summarized in the Appendix. The great majority of theIRRC provisions, and all the IRRC provisions that we hypothesize matter, arethose that appear to provide incumbents at least nominally with protectionfrom removal or the consequences of removal. We refer to such protection as“entrenchment.”
Entrenchment can have adverse effects on management behavior and incen-tives. As first stressed by Manne (1965), such insulation might harm share-holders by weakening the disciplinary threat of removal and thereby increasingshirking, empire-building, and extraction of private benefits by incumbents. Inaddition, such insulation might have adverse effects on the incidence and con-sequences of control transactions. To be sure, entrenchment can also producebeneficial effects by reducing the extent to which the threat of a takeover distortsinvestments in long-term projects (Stein 1988; Bebchuk and Stole 1993) or byenabling managers to extract higher acquisition premiums in negotiated trans-actions (Stulz 1988). For this reason, the theoretical literature on the variouseffects of entrenchment (see Bebchuk 2002 for a survey) does not establish thatentrenchment would overall necessarily have an adverse effect on firm value,but only that hypothesizing such a relationship is theoretically defensible.
An association between entrenchment and low firm value might also resultfrom the greater incentive that managers of low-value firms have to obtain pro-tection from the risk of removal or its consequences. An incentive on the partof managers of low-value firms to adopt entrenching provisions and entrench-ment in turn reducing firm value are not mutually exclusive. Even if low-valuefirms have a greater tendency to adopt high entrenchment levels, the adoptedentrenchment levels can reinforce or strengthen the correlation between lowvalue and entrenchment. The high level of entrenchment might lead to furtherdeterioration in value or at least prevent the improvement in value that mightotherwise be caused by the threat or realization of a change in control.
6

What Matters in Corporate Governance?
Given the potential significance of entrenchment, we will attempt to identifya hypothesis for testing the identity of the provisions in the IRRC universe thatare most responsible for, or reflective of, managerial entrenchment.
1.1 The provisions garnering significant shareholder oppositionIn forming a hypothesis about which governance provisions are of significance,examining the preferences registered by institutional investors (and other share-holders) in votes on precatory resolutions seems to be an objective and naturalapproach. To be sure, shareholders might be mistaken in their judgment ofwhich provisions deserve attention and opposition. But to the extent that share-holders have focused their attention and opposition on some provisions and notothers, their views can help inform the inquiry as to which IRRC provisionsshould be deemed to be potentially significant.
To this end, we reviewed the data reported by Georgeson Shareholder, theleading proxy solicitation firm, in its ANNUAL CORPORATE GOVERNANCE RE-VIEW concerning the incidence and outcomes of shareholder precatory resolu-tions at the end of our sample period (the end of 2003).4 At this point in time,shareholders’ voting decisions could have been informed by whatever share-holders might have learned during the sample period or earlier. Given that theend of the sample period falls between the 2003 and 2004 proxy seasons, we ex-amined the data gathered by Georgeson Shareholder with respect to shareholdervotes on precatory resolutions during both the 2003 proxy season (GeorgesonShareholder 2003) and the 2004 proxy season (Georgeson Shareholder 2004).
The question we investigated in examining the incidence and outcomes ofshareholder precatory resolutions was which of the twenty-four IRRC provi-sions were opposed by a nontrivial number of precatory resolutions that oftenpassed. An examination of the data indicates that four types of precatory resolu-tions, targeting six IRRC provisions, stood out. Each of these types of precatoryresolutions was submitted a significant number of times (fifteen or more timesduring the 2003–2004 proxy seasons) and passed (obtaining a majority of thevotes cast by shareholders) in a majority of the cases in which it was submit-ted. The four types of precatory resolutions, and the six IRRC provisions theytargeted, were as follows:
• resolutions against classified boards, which passed in 91% of the votes onthem during 2003–2004;
• resolutions against poison pills, which passed in 72% of the votes on themduring 2003–2004;
• resolutions against golden parachutes, which passed in 62% of the voteson them during 2003–2004; and
• resolutions against supermajority provisions, which simultaneously tar-geted supermajority merger requirements, limits on charter amendments,
4 Georgeson Shareholder did not track shareholder votes on precatory resolutions at the beginning of our sampleperiod.
7

The Review of Financial Studies
and limits on bylaw amendments, which passed in 100% of the votes onthem during 2003–2004. (The Georgeson data report one figure for allresolutions against supermajority provisions, reflecting the fact that pre-catory resolutions targeting supermajority provisions generally expresssupport for a general simple-majority standard and opposition to all typesof supermajority voting requirements.)
All the other eighteen IRRC provisions do not come even close to the abovesix IRRC provisions in terms of being the target of a significant number ofopposing resolutions obtaining majority support among shareholders. To begin,out of these eighteen provisions, seventeen were the subject of either no or onlya de minimis number of precatory resolutions (let alone passing resolutions):thirteen provisions were not the target of even a single precatory resolutionduring the 2003 and 2004 proxy seasons;5 and four provisions had only anominal presence in the precatory resolution landscape, with none of themtargeted by more than three precatory resolutions over the entire 2003–2004period.6 Finally, out of the eighteen provisions, only one of them—absenceof cumulative voting—was the target of a significant number of precatoryresolutions, but these resolutions commonly failed to pass. The resolutions,most of which were initiated by the same individual who submitted the sameresolutions at many companies, passed in a mere 7% of the cases in whichvotes on them were held.
1.2 Discussion of the provisions in the E indexHaving identified the subset of IRRC provisions that attracted substantial share-holder opposition, we also undertook our own legal and economic analysis ofthe possible significance of each of these six provisions. In conducting thisanalysis, we were informed and assisted by interviews we conducted with sixhighly prominent M&A practitioners in six major corporate law firms.7 Thepurpose of our analysis was to provide a cross-check to ensure that we were notproceeding to the testing stage with a provision whose inclusion in our indexwould be implausible based on such an analysis.
The six provisions in the E index can be divided into two categories. Fourof them involve constitutional limitations on shareholders’ voting power. Theother two provisions can be regarded as “takeover readiness” provisions that
5 These IRRC provisions are: director indemnification, director indemnification contract, limited director lia-bility, compensation plan, severance agreement, unequal voting rights, blank check preferred stock, fair pricerequirements, cash-out law, director duties, antigreenmail, pension parachute, and silver parachute.
6 These four IRRC provisions were special meeting, written consent, opt-out of state takeover law, and confidentialvoting.
7 These lawyers were Richard Climan, head of the mergers & acquisitions group at Cooley, Godward; DavidKatz, a senior corporate lawyer at Wachtell, Lipton, Rosen & Katz; Eileen Nugent, a co-author of a leadingtreatise on acquisitions and a senior corporate lawyer at Skadden, Arps, Sale, Meagher & Flom; Victor Lewkow,a leading mergers & acquisitions lawyer at Cleary Gottlieb; James Morphy, managing partner of the mergers andacquisitions group at Sullivan & Cromwell; and Charles Nathan, global co-chair of the mergers and acquisitionsdepartment of Latham &Watkins. We are grateful to them for their time and insights.
8

What Matters in Corporate Governance?
boards sometimes put in place. Below we discuss the reasons for viewing theirinclusion in our E index as plausible. Before proceeding, it is worth stressingthat the point of the discussion below is not that the analysis proves that each ofthe provisions must be correlated with lower firm value. Indeed, if that were thecase, there would be little need for empirical testing. Rather, the issue is whetherthere are reasons to view shareholders’ focus on and opposition to these sixprovisions, as evidenced by shareholders’ votes on precatory resolutions, assufficiently plausible to justify inclusion of these six provisions in an E indexof provisions whose significance will then be the subject of empirical testing.
1.2.1 Constitutional limitations on shareholders’ voting power. At bot-tom, shareholders’ most important source of power is their voting power (Clark1986). But shareholders’ voting power can be constrained by constitutional ar-rangements that constrain the ability of a majority of the shareholders to havetheir way.
When the firm has a staggered board, directors are divided into classes,almost always three, with only one class of directors coming up for reelectioneach year. As a result, shareholders cannot replace a majority of the directorsin any given year, no matter how widespread the support among shareholdersfor such a change in control. This makes staggered boards a powerful defenseagainst removal in either a proxy fight or proxy contests. There is evidence thatstaggered boards are a key determinant for whether a target receiving a hostilebid will remain independent (Bebchuk, Coates, and Subramanian 2002, 2003).The lawyers we interviewed were all of the view that staggered boards are akey defense against control challenges.
There is also evidence that, controlling for all the other IRRC provisions,staggered boards are negatively correlated with Tobin’s Q (Bebchuk and Cohen2005). Furthermore, there is evidence that firms’ announcement of a classifiedboard adoption are accompanied with negative abnormal stock returns (Faleye2007) and that firms’ announcements that they are going to dismantle theirstaggered board are accompanied by positive abnormal stock returns (Guo,Kruse, and Nohel 2008). To be sure, some researchers and market participantsmaintain that investors’ concerns about staggered boards are exaggerated oreven unwarranted (Wilcox 2002; Bates, Becher, and Lemmon 2008). But thereis little reason to doubt that the hypothesis that staggered boards play a signifi-cant role in driving the correlation between the IRRC provisions and firm valueis one that would be reasonable to subject to empirical testing.
In addition to the power to vote to remove directors, shareholders have thepower to vote on bylaw amendments, charter amendments, and mergers. Threetypes of IRRC provisions make it more difficult for the majority of shareholdersto have their way on such important issues: limits on bylaw amendments, whichusually take the form of supermajority requirements; supermajority require-ments for mergers; and supermajority provisions for charter amendments. Asnoted earlier, shareholders have registered strong opposition to such provisions.
9

The Review of Financial Studies
One hundred percent of the resolutions opposing such supermajority provisionsduring the 2003 and 2004 proxy season passed, attracting on average 67% ofthe shares cast (Georgeson Shareholder 2003, 2004).
The M&A lawyers we interviewed were all in consensus that limits onbylaw amendments could significantly enhance the effectiveness of a target’sdefenses. A well-known Delaware case, Chesapeake Corp. v. Marc P. Shore,also expressed this view; the court in this case ruled that a supermajorityrequirement of two-thirds of all outstanding shares for a bylaw amendmenthad draconian antitakeover consequences, making it practically impossible fornonmanagement shareholders to remove defensive provisions that managementearlier placed in the bylaws.
As to supermajority requirements for mergers and charter amendments, theseprovisions can provide (and are so viewed by the M&A lawyers we interviewed)“a second line of defense” against a takeover. When such provisions are present,insiders holding a block of shares might be in a position to defeat or impedecharter amendments or mergers even if they lose control of the board. Thus,to the extent that such provisions could enable management and shareholdersaffiliated with them to frustrate the plans of a buyer of a control block, thismight discourage hostile buyers from seeking to acquire such a block in thefirst place.
1.2.2 Takeover readiness provisions. Poison pills (less colorfully knownas shareholder rights plans) are rights that, once issued by the company, pre-clude a hostile bidder as a practical matter from buying shares as long as theincumbents remain in office and refuse to redeem the pill. The legal develop-ments that allowed boards to put in place pills are thus widely regarded to haveconsiderably strengthened the protections against replacement that incumbentshave.
During the period of examination, shareholder resolutions seeking to limitpoison pills constituted a significant fraction of all shareholder resolutions,and these resolutions attracted substantial shareholder support. At the endof the period, resolutions calling for limitations on the use of the poison pillobtained an average of 60% of votes cast with a passage rate of 72% (GeorgesonShareholder 2003, 2004).
It should be noted that boards may adopt poison pills, with no need for ashareholder vote of approval, not only before but also after the emergence of ahostile bid. For this reason, companies without a poison pill in place can stillbe viewed as having a “shadow pill” that could be rolled out in the event of ahostile bid (Coates 2000). Nonetheless, during the period under examination, asubstantial fraction of companies (ranging from 54% to 59% during the period)do have pills in place.
Having a poison pill in place is not costless for the board because institutionalinvestors look unfavorably on poison pills and a board could “get points” withsuch investors by not having a pill. Thus, boards and their advisers maintaininga pill were presumably led to do so by a belief that it would provide them with
10

What Matters in Corporate Governance?
some advantages. The leading M&A lawyers we interviewed noted severalreasons why they and other lawyers often advised clients concerned about ahostile bid to put a pill in place. To begin, having a pill in place provides anabsolute barrier to any attempts by outsiders to obtain through market purchasesa block larger than the one specified by the terms of the pill (usually 10–15%).8
In addition, having the pill in place saves the need to install it in “the heat ofbattle.” This removes one issue from those that the board and its independentdirectors will have to deal with should a hostile bid be made. Furthermore,according to the lawyers we interviewed, there was a widespread perceptionthat maintaining a pill signals to hostile bidders that the board will “not goeasy” if an unsolicited offer is made and that, conversely, not adopting a pill or(even worse) dropping an existing pill could be interpreted as a message thatincumbents are “soft” and “lack resolve.” For all these reasons, incumbentsworried about a hostile bid could have slept somewhat better by putting a pillin place prior to a hostile bid being made.9
Golden parachutes are terms in executive compensation agreements thatprovide executives who are fired or demoted with substantial monetary benefitsin the event of a change in control. Golden parachutes protect incumbents fromthe prospect of replacement by providing management with a soft and sweetlanding in the event of ouster. Thus, a golden parachute provides incumbentswith substantial insulation from the economic costs that they would otherwisebear as a result of losing their control.
To be sure, golden parachutes may also produce benefits for shareholders bymaking incumbents more willing to accept an acquisition and increasing thelikelihood of an acquisition (Lambert and Larker 1985; Bebchuk, Cohen, andWang 2008). However, while this effect might be beneficial, golden parachutesmight also have an adverse effect by increasing slack on the part of managers asa result of being less subject to discipline by the market for corporate control.Whether the latter effect outweighs the former is an empirical question. It is alsopossible that golden parachutes may be negatively correlated with firm valueto the extent that managers of low-value firms who face a higher likelihoodof being acquired are especially likely to seek them (Bebchuk, Cohen, andWang 2008). According to the M&A lawyers we interviewed, they recommendgolden parachutes to any incumbents who attach a significant likelihood oftheir company being acquired.10
8 Incumbents have some protection from attempts to obtain quickly a significant block by the notice requirementsof the Hart-Scott-Rodino Act and the Williams Act. But as John Malone’s surprise move to increase his stakeat News Corp. illustrates, a poison pill (which News Corporation’s management hastily adopted) is sometimesnecessary to block such moves.
9 Some early studies examined how the adoption of a poison pill affected the firm’s stock price (see, for example,Ryngaert 1988). When a firm adopts a poison pill, however, its stock price might be influenced not only bythe expected effect of the poison pill but also by inferences that investors make as to management’s privateinformation about the likelihood of a bid (Coates 2000).
10 To be sure, even when executives do not have a golden parachute in their ex ante compensation contracts, boardscan and often do grant executives “golden good-bye” payments when an acquisition offer is already on the table(Bebchuk and Fried 2004, Ch. 7). But such ex post grants require much more explaining to outsiders.
11

The Review of Financial Studies
We decided to include golden parachutes in the E index based on theirpotential insulating effects for management and the substantial shareholdersupport for limiting their use during the period of our study. At the end of thisperiod, resolutions targeting golden parachutes received on average 51% ofvotes cast with a passage rate of 62% (Georgeson Shareholder 2003, 2004).
It is worth stressing that golden parachutes, as that variable is defined bythe IRRC, are quite different from three other IRRC provisions: severanceagreements, compensation plans, and silver parachutes. Severance contractpayments, as defined by the IRRC, are not conditional on the occurrence of achange in control. Silver parachutes provide benefits to a large number of thefirm’s employees and do not target the firm’s top executives, whose insulationfrom a control contest could matter most in terms of increasing managerialslack. Compensation plans are plans that accelerate benefits, such as optionvesting, but do not by themselves provide additional benefits in the event ofa change in control, in contrast to golden parachutes. These differences mightexplain why shareholder precatory resolutions have targeted golden parachutesrather than any of these three other IRRC provisions.
1.3 Discussion of the other provisionsWe now discuss the eighteen provisions not in the E index. We do not includethem in the index because, as explained in subsection 1.1, none of these provi-sions is the target of frequent and commonly successful shareholder resolutions.As we did in connection with the provisions included in the E index, we alsoconducted our own analysis, based in part on the existing literature and on ourinterviews with prominent practitioners. This analysis was intended to serveas a cross-check, namely, to examine whether there are any provisions which,notwithstanding the described record of shareholder voting, are so clearly im-portant that proceeding to test the hypothesis that the provisions in the E indexare those most likely to matter is a priori implausible.
Our analysis of these eighteen provisions did not reveal a basis for viewingany of them as those that are bound to be significant. Indeed, with respect tomost of these provisions, our analysis suggested reasons to expect them to beinconsequential. For example, some antitakeover statutes, fair price provisions,and business combination statutes constituted takeover protections that wereimportant in the late 1980s but subsequently became largely irrelevant dueto legal developments that provide incumbents with the power to use morepowerful takeover defenses.11
11 As long as incumbents are in office, they can now use a poison pill to prevent a bid and thus have little need for theimpediments provided by most antitakeover statutes. And if the bidder were to succeed in replacing incumbentswith a team that would redeem the pill, these impediments would be irrelevant because they apply only toacquisitions not approved by the board. Our legal analysis of these provisions was echoed in our interviewswith the leading M&A lawyers mentioned earlier. It is worth noting that studies identifying some effects ofantitakeover statutes on firms largely focused on data from an earlier period during most of which such statutesdid plausibly matter because incumbents did not yet have the power to maintain poison pills indefinitely (see,for example, Borokhovich, Kelly and Parrino 1997; Johnson and Rao 1997; Bertrand and Mullainathan 1999;Garvey and Hanka 1999; Bertrand and Mullainathan 2003).
12

What Matters in Corporate Governance?
Another takeover-related provision that we believe to be largely inconse-quential is blank check preferred stock. This provision was included by theIRRC and prior research in the set of studied provisions because blank checkpreferred stock is the currency most often used for the creation of poison pills.However, lawyers are able to, and do, create poison pills without blank checkpreferred stock. Indeed, in the IRRC data, of the companies that did not have ablank check preferred stock in 2002, about 45% nevertheless had a poison pillin place.
Similarly, there is evidence that limits on special meeting and written consentdo not have a statistically significant effect on the outcome of hostile bids(Bebchuk, Coates, and Subramanian 2003). Such limits prevent shareholdersfrom voting between annual meetings and require them to wait until the annualmeeting to conduct any vote, but the practical significance of the requireddelay is limited. Even when shareholders can act by written consent or call aspecial meeting, the rules governing proxy solicitations are likely to imposesome delay before a vote can be conducted. And waiting until the next annualmeeting commonly does not involve substantial delay. Perhaps not surprisingly,limitations on special meeting and written consent are virtually never the subjectof a precatory resolution (Georgeson Shareholder 2003, 2004).
Some of the IRRC provisions are related not to issues of control changesbut rather to issues of liability and indemnification in the event of shareholdersuits. As Black, Cheffins, and Klausner (2006) powerfully argue and document,directors are protected from personal liability by myriad factors. The risk ofliability is negligible even in companies that do not have any of the IRRC pro-visions. Personal liability might arise in some rare cases of egregious bad faithbehavior, but in such cases the three liability and indemnification provisions inthe IRRC set would provide no protection.
Finally, with respect to a few of the provisions not in the E index, an analysiscannot establish unambiguously that they are bound to be insignificant. How-ever, given the absence of a solid basis for expecting these other provisions tobe significant, our approach was to proceed with the hypothesis developed onthe basis of the evidence concerning shareholder voting to test whether the sixprovisions in the E index are those that matter. As will be explained below, inconducting our testing, we remained open to and explored the possibility thatone or more of the provisions not in our E index also play a significant role inproducing the correlation between the IRRC provisions in the aggregate andfirm value.
1.4 The E index and the other provisions indexBased on the above discussion, we construct two indexes. As is standard in theliterature constructing governance indices on the basis of a set of provisions (LaPorta et al. 1998; Gompers, Ishii, and Metrick 2003), each of our indexes givesan equal weight to each of the provisions in the set. Of course, as is generallyrecognized in this literature, some relevant provisions could deserve more
13

The Review of Financial Studies
weight than others, and the appropriate weight of a provision might depend onthe presence or absence of other provisions (that is, interactions could matter),and the standard equal-weight construction is an approach that we, like othersin the literature, use for its simplicity. Our effort focuses on extending theliterature by narrowing the set of relevant provisions while continuing to use thestandard approach for constructing an index on the basis of this relevant set.
Thus, the level of the “entrenchment index” for any given firm is calculatedby giving one point for each of the six components of the index that the firmhas. The “other provisions index” (O index) is based on all the other eighteenprovisions not included in the E index and tracked by the IRRC. This index, likethe E index, counts all the provisions included in it equally, giving one pointfor each one of these provisions a firm has. The conjecture to be tested is thatour E index drives to a substantial degree the correlation identified in earlierresearch between the IRRC provisions, in the aggregate, and firm valuation.
2. Data and Summary Statistics
2.1 Data sourcesOur dataset includes all the companies for which there was information in one ofthe volumes published by the Investor Responsibility Research Center (IRRC).The IRRC volumes include detailed information on the corporate governancearrangements of firms. The IRRC has published six such volumes: September1990; July 1993; July 1995; February 1998; November 1999; and February2002.
Each volume includes information on between 1400 and 1800 firms, withsome variation in the list of included firms from volume to volume. All thefirms in the S&P 500 are covered in each of the IRRC volumes. In addition,a number of firms not included in the S&P 500 but considered important bythe IRRC are also covered. In any given year of publication, the firms in theIRRC volume accounted for more than 90% of the total U.S. stock marketcapitalization.
Because the IRRC did not publish volumes in each year, we assumed, follow-ing Gompers, Ishii, and Metrick (2003), that firms’ governance provisions asreported in a given IRRC volume were in place during the period immediatelyfollowing the publication of the volume until the publication of the subsequentIRRC volume. Using a different “filling” method, however, does not changeour results.
In addition to the IRRC volumes, we also relied on Compustat, CRSP,and ExecuComp. Firm financials were taken from Compustat. Stock returndata were taken from the CRSP monthly datafiles. Insider ownership datawere taken from ExecuComp. The age of firms, following Gompers, Ishii, andMetrick (2003), was estimated based on the date on which pricing informationabout a firm first appeared in CRSP.
14

What Matters in Corporate Governance?
Table 1Incidence of corporate governance provisions
Year
1990 1993 1995 1998 2000 2002
Entrenchment index provisionsStaggered board 59.2% 60.5% 61.8% 59.5% 60.5% 61.9%Limits to amend bylaws 14.5% 16.2% 16.1% 18.2% 20.0% 23.2%Limits to amend charter 3.3% 3.4% 3.1% 3.0% 3.3% 2.5%Supermajority 39.0% 39.5% 38.4% 34.1% 34.1% 32.3%Golden parachutes 53.3% 55.7% 55.2% 56.9% 67.4% 70.2%Poison pill 54.4% 57.6% 56.6% 55.4% 59.9% 59.0%
All other provisionsLimits to special meeting 24.8% 30.0% 32.0% 34.8% 38.3% 50.2%Limits to written consent 24.8% 29.3% 32.1% 33.3% 36.2% 46.4%No cumulative vote 81.6% 83.6% 85.0% 87.8% 89.0% 90.4%No secret ballot 97.1% 90.5% 87.8% 90.4% 89.1% 88.8%Director indemnification 40.8% 39.5% 38.5% 24.5% 23.6% 19.1%Director indemnification contracts 16.6% 15.2% 12.6% 11.2% 9.1% 8.1%Director liability 72.7% 69.2% 65.5% 47.2% 43.1% 33.9%Compensation plans 45.3% 66.1% 72.8% 63.2% 72.6% 74.0%Severance agreements 13.1% 5.5% 10.2% 11.2% 9.2% 6.1%Unequal vote 2.4% 2.0% 1.9% 1.7% 1.5% 1.6%Blank check 76.7% 80.1% 85.9% 88.0% 89.4% 90.8%Fair price 58.0% 59.1% 57.6% 49.4% 48.5% 44.0%Cash-out law 4.1% 3.7% 3.6% 3.1% 2.7% 2.5%Director duties 10.4% 11.1% 10.9% 9.9% 10.2% 10.8%Business combination law 84.1% 87.5% 87.4% 88.4% 89.0% 89.1%Antigreen mail 19.7% 20.8% 20.1% 17.1% 15.8% 15.0%Pension parachutes 4.0% 5.3% 4.0% 2.2% 1.5% 1.0%Silver parachutes 4.1% 4.9% 3.5% 2.4% 2.0% 1.7%
In calculating abnormal returns, we used the three Fama-French benchmarkfactors, which were obtained from Kenneth French’s website. The Carhartmomentum factor was calculated by us using the procedures described inCarhart (1997) using information obtained from CRSP.
We excluded firms with a dual class structure. In these companies the hold-ing of superior voting rights might be sufficient to provide incumbents witha powerful entrenching mechanism that renders other entrenching provisionsrelatively unimportant. We also excluded real estate investment trusts (REITs),i.e., firms with a SIC Code of 6798, as REITs have their own special governancestructure and entrenching devices. While we kept both financial and nonfinan-cial firms in our data, running our regressions on a subset consisting only ofnonfinancial firms (as done by Daines 2001) yields similar results throughout.
2.2 Summary statisticsTable 1 provides summary statistics about the incidence of the twenty-fourIRRC governance provisions, including the six provisions we have chosen toinclude in our E index, during the period covered by our study.12
12 We use, throughout, the definitions of the IRRC provisions used by Gompers, Ishii, and Metrick (2003). Forexample, because the IRRC used in some years the term “secret ballot” and in some years the term “confidentialvoting” to describe essentially the same arrangement, GIM defined a company as having no secret ballot in a
15

The Review of Financial Studies
Table 2Incidence of the entrenchment index
Entrenchment index 1990 1993 1995 1998 2000 2002
0 13.0% 11.0% 11.0% 10.7% 7.9% 7.3%1 18.2% 17.3% 17.6% 19.0% 18.0% 15.4%2 24.3% 25.0% 25.4% 25.9% 24.0% 26.8%3 25.4% 25.7% 25.3% 25.1% 27.6% 27.2%4 14.7% 16.3% 16.7% 15.9% 18.2% 18.3%5 3.7% 4.3% 3.8% 2.8% 3.8% 4.6%6 0.7% 0.4% 0.2% 0.6% 0.5% 0.4%
100.0% 100.0% 100.0% 100.0% 100.0% 100.0%
Of the six provisions in the E index, staggered boards, golden parachutes,and poison pills are the most common, with each present in a majority ofcompanies. The incidence of golden parachutes has been increasing steadily,starting at 53% as of 1990 and reaching approximately 70% in 2002. Theincidence of staggered boards has been stable at around 60%, and the incidenceof poison pills has been relatively stable as well, in the 55–60% range.
The incidence of supermajority provisions has been declining slightly overtime, starting at 39% in 1990 and ending at approximately 32% in 2002. Theincidence of limits to bylaws has been increasing, starting at 14.5% in 1990and reaching approximately 23% by 2002. Of the six provisions, the onlyone that does not have a substantial presence is provisions that limit charteramendments, which has throughout the 1990–2002 period a very low incidencehovering around 3%.
The E index assigns each company one point for each of the six provisionsin the index that the firm has. Accordingly, each firm in each year will have anE index score between 0 and 6. Table 2 provides summary statistics about theincidence of the index levels during the study period. On the whole, there wasa moderate upward trend in the levels of the E index during this period. While55% of the firms had an index level below 3 in 1990, only 49% of the firms werein this range in 2002. Especially significant was the decline in the incidence offirms with a zero entrenchment level, from 13% in 1990 to approximately 7%in 2002.
As for the cross-sectional distribution of firms across entrenchment levels,roughly half of the companies have an entrenchment level of 3 or more, whileroughly half have an entrenchment level below 3. Of the half of the firms withentrenchment levels below 3, a substantial fraction are at two, with firms at thezero and one levels constituting 23–31% of all firms. For the roughly half of
given year when it did not have in that year in the IRRC dataset either the secret ballot variable or the confidentialvoting variable. To give another example, GIM defined a company as having a fair price arrangement in a givenyear when in that year it (1) had the variable for a fair price charter provision, or (2) had the variable indicatingincorporation in a state with a fair price provision, and (3) did not have the variable indicating a charter provisionopting out of the state’s statute. We are grateful to Andrew Metrick for providing us with the GIM set of definitionsof the 24 IRRC provisions.
16
What Matters in Corporate Governance?
the firms with entrenchment levels of 3 or more, a substantial fraction are atthree, with firms in the four to six range constituting 19–23% of all firms.
A relatively small fraction of firms are at the extremes. Given that one of theprovisions is present in only about 3% of firms, it is not surprising that only afew firms reach the maximum level of six, with its incidence never exceeding0.7% of the sample. Given the small number of observations with E index scoresof 6, firms in index level 6 are grouped together with firms in index group 5 inthe course of conducting the statistical analysis. This group of companies withindex scores of 5 and 6, the very worst companies in terms of their entrenchmentscores, constitutes approximately 3.5–5% of all firms throughout the period.At the other end of the spectrum, the group of companies that are the “best”in terms of entrenchment is firms with a 0 entrenchment level. These firmsconstitute roughly 7–13% of all firms during the 1990–2002 period.
The correlation between the E index and the GIM index is 0.74, while thecorrelation between the O index and the GIM index is 0.89. The E index andthe O index, however, have a correlation of only 0.36 with each other. Becausethe E index and the O index are both significant elements of the GIM index,and because the O index contributes three times more provisions to the GIMindex than the E index, it is not surprising that both subindexes are substantiallycorrelated with the GIM index, and that the O index has a higher correlation.Note that, because the O index contributes many provisions to the GIM indexand has a correlation of only 0.36 with the E index, the E index and the GIMindex fall significantly short of being perfectly correlated. If the provisions inthe E index are indeed those that matter for correlation with firm value, thenthe addition of the other provision index to the E index to form the GIM indexis adding a significant amount of “noise.”
Turning to the correlation of the six entrenching provisions, the correlationtends to be relatively low. Nine out of the fifteen correlations are less than0.1. The highest correlation of 0.31 is that between poison pills and goldenparachutes, our two “takeover readiness” provisions. The second highest cor-relation, at 0.24, is that between limits on ability of shareholders to amend thecorporate bylaws and limits on shareholders’ ability to amend the corporatecharter. The relatively low correlation among the entrenching provisions sug-gests that each entrenching provision is potentially a candidate for inclusion inthe E index as a stand-alone element, rather than merely on the basis of beinghighly correlated with some other entrenching provision.
There are no significant differences between firms in and out of the S&P 500in terms of their entrenchment scores (respectively 2.58 and 2.46), and thereare likewise no noteworthy entrenchment score differences between young andold firms (2.30, 2.35, and 2.82 for, respectively, the 1990s, 1980s, and pre-1980). It is worth noting, however, that entrenchment levels are different infirms that are very large in size. In 2002, out of the fifteen companies with amarket cap exceeding $100 billion, only one had an E level index exceedingthree. This is not surprising. With no hostile bid or proxy fight ever directed
17

The Review of Financial Studies
Table 3Incidence of other provisions index
Average AverageIndex E index: E index:of other year yearprovisions 1990 1993 1995 1998 2000 2002 1990 2002
1 0.15% 0.00% 0.00% 0.00% 0.06% 0.00% 1.50 1.112 1.41% 0.68% 0.66% 0.71% 0.52% 0.55% 0.89 1.413 3.72% 3.68% 2.41% 3.12% 2.14% 1.64% 1.42 1.614 7.58% 6.38% 5.41% 10.88% 8.31% 7.71% 1.67 2.105 14.94% 12.91% 13.38% 17.82% 17.85% 15.79% 1.75 2.246 19.03% 17.87% 17.98% 17.24% 18.23% 21.86% 2.09 2.727 16.36% 16.97% 16.81% 16.53% 19.92% 22.16% 2.36 2.908 15.24% 17.49% 19.52% 14.88% 14.99% 13.60% 2.52 2.869 10.26% 12.01% 11.77% 9.59% 9.28% 8.50% 2.78 3.3310 7.21% 6.76% 6.94% 5.71% 5.78% 5.04% 3.01 3.4411 3.35% 4.28% 4.24% 2.71% 2.14% 2.37% 3.04 3.3812 0.45% 0.75% 0.66% 0.65% 0.65% 0.49% 2.17 3.4013 0.30% 0.23% 0.22% 0.18% 0.13% 0.30% 2.25 1.11
Average 2.24 2.49Total 100.00% 100.00% 100.00% 100.00% 100.00% 100.00%
at a company of this size, the managements of these very large firms have noneed for entrenching provisions in order to be secure.
Table 3 provides the distribution of the O index for the IRRC publicationyears. As Table 3 indicates, the highest level of the O index actually reachedby firms is 13, and the lowest level of the O index that firms actually have is 1.Approximately 40–45% of firms have an O index score of 6 or less, with theremaining firms having an O index score of 7 or more. There are very few firmsat the extremes, with only roughly 1% of firms having an O index score of 1 or2 and another 1% of firms having an O index score of 12 or 13. The correlationbetween the O index and the E index ranges from 0.3 to 0.35 throughout the1990–2002 period. Thus, to the extent that the provisions in the E index matterbut those in the O index do not, including the latter in the governance measurecould contribute a significant amount of noise.
3. Entrenchment and Firm Value
In studying the association between the E index and firm value, we use Tobin’sQ as the measure of firm value. In doing so, we follow Gompers, Ishii, andMetrick (2003), as well as earlier work on the association between corporatearrangements and firm value (see, for example, Demsetz and Lehn 1985; Morck,Shleifer, and Vishny 1988; McConnell and Servaes 1990; Lang and Stulz 1994;Daines 2001; La Porta et al. 2002).
We use the definition of Tobin’s Q that was used by Kaplan and Zingales(1997) and subsequently also by Gompers, Ishii, and Metrick (2003). Accordingto this specification, Q is equal to the market value of assets divided by thebook value of assets, where the market value of assets is computed as the bookvalue of assets plus the market value of common stock less the sum of bookvalue of common stock and balance sheet deferred taxes. This measure (and
18
What Matters in Corporate Governance?
simpler ones that drop deferred taxes) has been increasingly used in light ofthe complexities involved in the more sophisticated measures of Q and theevidence of very high correlation between this proxy and more sophisticatedmeasures (see, for example, Chung and Pruitt 1994).
Our dependent variable in most regressions is the log of industry-adjustedTobin’s Q, where industry-adjusted Tobin’s Q is a firm’s Q minus the medianQ in the firm’s industry in the observation year. We defined a firm’s industryby the firm’s two-digit primary SIC Code. Using the Fama-French (1997)classification of forty-eight industry groups, rather than two-digit SIC Codes,yields similar results. Using industry-adjusted Tobin’s Q as the dependentvariable also produces similar results.
As independent variables, we use throughout standard financial controls.These controls include the assets of the firm (in logs), the age of the firm (in logs)(Shin and Stulz 2000), and whether the firm is incorporated in Delaware—allvariables used by Gompers, Ishii, and Metrick (2003). We also use additionalcontrols that the literature has used in Q regressions—the level of insider owner-ship, return on assets, capital expenditures on assets, research and developmentexpenditures, and leverage. (Using only the controls used by Gompers, Ishii,and Metrick 2003 produces similar results throughout.) Moreover, we use dum-mies for firms’ two-digit SIC Codes. In all of the regressions, in addition tothe standard financial and ownership controls, we controlled for firms’ O indexscores in order to control for the IRRC provisions not included in the E index.In our Q regressions, we focus on the period 1992–2002, because our insideownership data (from ExecuComp) did not cover 1990, 1991, and 2003.
3.1 The E index and the O index3.1.1 A first look. Table 4 presents the results of pooled OLS regressionsfor the 1992–2002 period. The pooled OLS regressions in Table 4 used White(1980) robust standard errors to account for potential heteroskedasticity. In thefirst column of Table 4, we used as an independent variable, in addition tothe financial variables and O index discussed above, firms’ E index scores. Ascolumn 1 indicates, the coefficient on the E index is negative (with a value of−0.044) and statistically significant at the 1% level. The coefficient of the Oindex is also significant at the 1% level, but it is positive (with a value of 0.01).
In the second column, in order to avoid the imposition of linearity on theE index, we used dummy variables to stand for the different levels that theindex can take. As the results indicate, the coefficient for any level of the indexabove 0 is negative, with all being significant at the 1% level (except for theEntrenchment Index 4 dummy which is significant at the 5% level). Moreover,the magnitude of the coefficient is monotonically increasing in the level of theE index.
To avoid imposition of linearity on the O index, we also ran unreportedregressions using the log of the O index as a control, and obtained similar
19

The Review of Financial Studies
Table 4The entrenchment index and firm value
Variable (1) (2) (3) (4)
Entrenchment Index E −0.044∗∗∗ −0.020∗∗∗0.004 0.007
Entrenchment Index 1 −0.092∗∗∗ −0.056∗∗0.023 0.022
Entrenchment Index 2 −0.146∗∗∗ −0.065∗∗∗0.022 0.025
Entrenchment Index 3 −0.155∗∗∗ −0.077∗∗∗0.022 0.029
Entrenchment Index 4 −0.206∗∗ −0.104∗∗∗0.023 0.031
Entrenchment Index 5–6 −0.282∗∗∗ −0.107∗∗∗0.027 0.040
Other Provisions Index 0.010∗∗∗ 0.010∗∗∗ 0.002 0.0020.003 0.003 0.006 0.006
Log(Assets) 0.015∗∗∗ 0.015∗∗∗ −0.119∗∗∗ −0.118∗∗∗0.004 0.004 0.014 0.014
Log(Company Age) −0.048∗∗∗ −0.047∗∗∗ −0.026 −0.0260.008 0.008 0.031 0.031
Delaware Incorporation −0.03∗∗∗ −0.028∗∗∗ 0.004 0.0080.01 0.01 0.04 0.04
Insider Ownership 0.001 0.001 0.005∗∗∗ 0.005∗∗0.001 0.001 0.002 0.002
Insider Ownership Square −0.00003 −0.0003 −0.0001∗ −0.0001∗0 0 0 0
ROA 0.008 0.008 0.019 0.0190.009 0.009 0.015 0.015
CAPEX/Assets 0.994∗∗∗ 1.00∗∗∗ 0.868∗∗∗ 0.869∗∗∗0.089 0.09 0.120 0.120
Leverage −0.544∗∗∗ −0.553∗∗∗ −0.426∗∗∗ −0.427∗∗∗0.046 0.046 0.047 0.047
R&D per Sales 0.002∗∗ 0.001∗ −0.001∗∗ −0.001∗∗0.001 0.001 0.001 0.001
Year fixed effects Yes Yes Yes YesFirm fixed effects No No Yes YesNumber of observations 8015 8015 8015 8015R_squared 0.096 0.098 0.704 0.804
This table reports pooled OLS regressions of log(industry-adjusted Tobin’s Q) on various controls and twospecifications of the entrenchment index. Tobin’s Q is the ratio of the market value of assets to the book value ofassets, where the market value of assets is computed as book value of assets plus the market value of commonstock less the sum of book value of common stock and balance sheet deferred taxes. Industry-adjusted Tobin’sQ is equal to Tobin’s Q minus the median Tobin’s Q in the industry, where industry is defined by two-digit SICCode. Entrenchment index i (i = 1, 2, 3, 4, and 5–6) is equal to 1 if the firm has an entrenchment level i and 0otherwise. The other provisions index is equal to the GIM index (Gompers, Ishii, and Metrick 2003) minus theentrenchment index. Insider Ownership is equal to the fraction of shares held by officers and directors. ROA isthe ratio of net income to assets. CAPEX/assets is the ratio of capital expenditures to assets. R&D per Sales is theratio of research and development expenditures to total sales. Leverage is the ratio of long-term debt plus debtdue in one year to assets. Year dummies and a dummy for missing R&D data are included in all regressions, buttheir coefficients (as well as the constant) are omitted. Columns 1 and 2 provide OLS estimates, which are White(1980) robust, and columns 3 and 4 provide the results of regressions with fixed firm effects. Robust standardserrors appear below the coefficient estimate. Significance levels are indicated by ∗, ∗∗, and ∗∗∗ for 10%, 5%, and1%, respectively.
results to those reported in Table 4. In unreported regressions, we also ranregressions using industry-adjusted Q as the dependent variable instead of itslog, and obtained similar results. Finally, we ran median regressions and, again,obtained similar results.
20

What Matters in Corporate Governance?
3.1.2 Controlling for unobserved firm characteristics. We next ran regres-sions using firm fixed effects in order to control for unobserved firm hetero-geneity that remains constant over the time period we study. The fixed effectsregressions, reported in columns 3 and 4 of Table 4, examine the effect on firmvalue of changes that firms made, during the 1990–2003 period, in the num-ber of entrenching provisions (whether to increase or decrease the number ofentrenching provisions). As Table 1 indicates, there was meaningful variationin the incidence of some entrenching provisions over the 1990–2003 period,such as golden parachutes and limits on shareholders’ ability to amend bylaws,that would result in changes in firms’ entrenchment scores. Other entrenchingprovisions, and in particular staggered boards, were rarely changed by firmsduring the period of study, and are therefore unlikely to constitute a significantsource for changes in firms’ entrenchment scores.
As columns 3 and 4 indicate, in the firm fixed effects regressions, the co-efficient values for the E index (column 3) and the coefficient values for thedummy variables for the different levels of the E index above 0 (column 4)remain negative, economically meaningfully, and statistically significant at the1% level (except for the coefficient value on having an entrenchment level of1 where the statistical significance is 5%). The magnitudes of the coefficientvalues also continue to increase monotonically in the level of the E index. Thecoefficient value on the O index remains positive, but is no longer statisticallysignificant.
3.1.3 Annual regressions. For a final robustness check, we also ran annualregressions. In all regressions, we used the E index and the O index as theindependent governance variables. We first ran a set of annual regressionssimilar to the baseline regressions in column 1 of Table 4, with OLS regressionsemploying the log of industry-adjusted Q as the dependent variable. We thenalso ran a set of median regressions with log of industry-adjusted Q as thedependent variable, as well as a set of OLS regressions with industry-adjustedQ as the dependent variable. We calculated the Fama-McBeth coefficients foreach set of annual regressions.
Table 5 displays the results of these three sets of annual regressions, dis-playing only the coefficients of the E index and of the O index. The coefficientof the E index is negative in all of the individual annual regressions. Of thethirty-three estimated negative annual coefficient values on the E index (threesets of annual regressions per year times eleven years), twenty-seven were sta-tistically significant. Of the six negative coefficient values without significance,three occurred in one year (1992). The Fama-McBeth coefficient value on theE index is negative at the 1% level for each one of the three sets of annualregressions.
As for the O index, the coefficient on the O index in the annual regressionsis positive in a substantial majority of the annual regressions, and occasion-ally positive with statistical significance. It is never negative and statistically
21

The
Review
ofFinancialStudies
Table 5The entrenchment index and firm value: annual regressions
(1) (2) (3)Log (industry-adjusted Q) Log (industry-adjusted Q) Industry-adjusted Q
Mean regressions Median regressions Mean regressions
Entrenchment Other provisions Entrenchment Other provisions Entrenchment Other provisionsYear index index index index index index
1992 −0.011 0.003 −0.009 −0.001 −0.028 −0.0020.009 0.006 0.016 0.011 0.021 0.014
1993 −0.018∗ −0.003 −0.022∗∗ −0.007 −0.058∗∗ −0.0110.011 0.007 0.010 0.006 0.027 0.016
1994 −0.018∗∗ 0.004 −0.037∗∗∗ 0.001 −0.052∗∗ 0.0100.009 0.006 0.010 0.007 0.020 0.014
1995 −0.016 0.0013 −0.023 −0.005 −0.067∗∗ 0.0080.011 0.008 0.015 0.011 0.032 0.026
1996 −0.024∗∗ 0.011 −0.025∗ −0.002 −0.074∗∗ 0.0290.01 0.007 0.015 0.011 0.029 0.025
1997 −0.014∗ 0.005 −0.029∗ 0.017 −0.058∗∗ 0.0170.008 0.007 0.016 0.011 0.027 0.022
1998 −0.064∗∗∗ 0.022∗∗ −0.058∗∗∗ 0.000 −0.209∗∗∗ 0.066∗∗0.014 0.009 0.021 0.014 0.053 0.033
1999 −0.068∗∗∗ 0.005 −0.065∗∗∗ 0.003 −0.327∗∗∗ 0.0150.015 0.01 0.016 0.011 0.077 0.054
2000 −0.03∗∗ 0.003 −0.066∗∗∗ −0.003 −0.089∗∗ −0.0100.013 0.009 0.020 0.014 0.041 0.028
2001 −0.017∗ 0.006 −0.024∗ 0.006 −0.044 0.0160.01 0.007 0.014 0.010 0.027 0.019
2002 −0.05∗∗∗ 0.013∗ −0.057∗∗∗ 0.000 −0.119∗∗∗ 0.0200.013 0.007 0.014 0.009 0.028 0.015
Fama-McBeth −0.03∗∗∗ 0.006∗∗∗ −0.038∗∗∗ 0.001∗∗∗ −0.102∗∗∗ 0.014∗∗∗0.006 0.002 0.006 0.002 0.027 0.006
This table reports mean and median annual OLS regressions of log of industry-adjusted Q and industry-adjusted Q on the entrenchment index and various controls. Thedata, as in the previous table, consist of 8015 observations. Industry-adjusted Tobin’s Q is defined in the same way as in Table 4. The independent variables are the same asin the regressions reported in Table 4, but the table reports only the coefficients of the E index and the O index. Fama-McBeth coefficients are calculated and reported inthe last row. Columns 1 and 3 provide OLS estimates that are White (1980) robust, and column 2 provides the results of median regressions. Robust standards errors appearimmediately below the coefficient estimate. Levels of significance are indicated by ∗, ∗∗, and ∗∗∗ for 10%, 5%, and 1%, respectively.
22

What Matters in Corporate Governance?
Table 6The entrenchment index provisions and firm value
Staggered Golden Limits to Limits to Poisonboard parachutes amend bylaws amend charter Supermajority pill
Coefficient in a −0.035∗∗∗ −0.024∗∗ −0.079∗∗∗ −0.048∗∗∗ −0.079∗∗∗ −0.061∗∗∗regression with (i) the 0.011 0.012 0.022 0.01 0.0101 0.011provision and (ii) theGIM index minus theprovision
Coefficient in a −0.051∗∗∗ −0.037∗∗∗ −0.047∗∗∗ −0.044∗∗∗ −0.045∗∗∗ −0.042∗∗∗regression with (i) the 0.005 0.005 0.004 0.004 0.005 0.005provision, (ii) theentrenchment indexminus the provision, and(iii) the index of all otherprovision
Coefficient in a −0.026∗∗ −0.025∗∗ −0.067∗∗∗ −0.044∗∗∗ −0.07∗∗∗ −0.046∗∗∗regression with (i) the 0.011 0.012 0.021 0.01 0.011 0.011provision, (ii) dummiesfor each of the other fiveprovisions in theentrenchment index, and(iii) the index of all otherprovision
Coefficient in a −0.030∗∗∗ −0.026∗∗ −0.068∗∗∗ −0.043∗∗∗ −0.071∗∗∗ −0.048∗∗∗regression with (i) the 0.011 0.012 0.022 0.01 0.011 0.011provision and (ii)dummies for each of theother twenty-three IRRCprovision
This table reports the results of twenty-four pooled OLS regressions of log(industry-adjusted Tobin’s Q) onprovisions in the entrenchment index and various controls. Each table consists of 8015 observations. Eachcolumn displays the results of four different regressions investigating a given provision, and it displays only thecoefficient of the provision of interest in these four regressions. The independent variables other than governanceprovisions are the same as in the regressions of Table 4. OLS estimates are White (1980) robust. Robust standardserrors appear immediately below the coefficient estimate. Levels of significance are indicated by ∗, ∗∗, and ∗∗∗for 10%, 5%, and 1%, respectively.
significant in any of the annual regressions. The Fama-McBeth coefficient valueon the O index is positive at the 1% level in each one of the three sets of annualregressions, albeit with a coefficient with a small magnitude.
3.2 Individual provisions: looking inside the two indexesThe analysis in Section 3.1 indicates that the six entrenching provisions wehave identified are, in the aggregate, highly correlated with lower firm valua-tion. There is still the possibility, however, that one or more of the individualentrenching provisions are not contributing to this negative effect on firm val-uation. To explore this possibility, we ran several sets of regressions whoseresults are displayed in Table 6.
In the first set of six regressions, we ran a regression for each of the sixprovisions in the E index in which the independent corporate governance vari-ables were (i) one of the six entrenching provisions and (ii) the GIM indexminus the entrenching provision in (i). That is, each of the regressions has oneof the entrenching provisions as an independent variable while controlling for
23
The Review of Financial Studies
all the other IRRC provisions. The financial controls used earlier (see Table 4regressions) are also used as independent variables.13
The results of these six regressions, one for each of the entrenching pro-visions, are displayed in row one of Table 6. In each of the regressions, thecoefficient of the entrenching provision under investigation is negative and sta-tistically significant. Five entrenching provisions have statistically significantnegative coefficient values at the 1% level, while the other one has statisticalsignificance at the 5% level.
It is worth cautioning that not too much should be read into the differencesin the levels of statistical significance and coefficient estimates of the variousentrenching provisions due to the problem of co-linearity. Each entrenchingprovision is positively correlated with the GIM index minus that entrench-ing provision. Accordingly, it might well be that any particular entrenchingprovision’s coefficient is underestimated. The one conclusion that can be com-fortably drawn from the results displayed in row one of Table 6 is that eachof the entrenching provisions contributes to the negative correlation betweenTobin’s Q and the IRRC provisions in the aggregate.
For a robustness check, we then proceeded to run three additional sets ofregressions. In particular, we ran for each entrenching provision i the followingtypes of regressions:
(1) a regression in which the independent corporate governance variables inaddition to entrenching provision i are (a) a variable equal to the E indexminus provision i and (b) the O index;
(2) a regression in which the independent corporate governance variables inaddition to entrenching provision i are (a) dummy variables for each ofthe five other entrenching provisions and (b) the O index;
(3) a regression in which the independent corporate governance variables inaddition to entrenching provision i are dummy variables for each of theother twenty-three IRRC provisions.
Rows 2, 3, and 4 of Table 6 display the results of the regressions of types (1),(2), and (3), respectively. For each one of the six entrenching provisions, thecoefficient in each of the three types of regressions was negative and statisticallysignificant at 1% or 5%. Thus, none of our robustness tests provide any evidencethat is inconsistent with the view that each of the six entrenching provisionscontributes to the negative correlation that the IRRC provisions in the aggregatehave with Tobin’s Q.
We now turn to the eighteen provisions in the O index. The results reportedearlier indicate that, in the aggregate, these eighteen provisions are not neg-atively correlated with firm valuation. This finding does not imply, however,
13 We display only the coefficients of the entrenching provision being investigated in each regression. In all theregressions, the coefficient of the GIM index minus the provision under investigation is negative and significant,and the coefficients of the financial controls are similar to those obtained in earlier regressions.
24

What Matters in Corporate Governance?
that none of the eighteen provisions contained in this index is harmful for firmvaluation. It might be that one or more provisions have adverse effects, but thiseffect does not show up in our regressions because it is diluted or counteractedby the effects of the provisions contained in the O index. Indeed, the results ofour article highlight the importance of looking inside the “box” of a broad indexto try to identify the effects of particular corporate governance provisions.
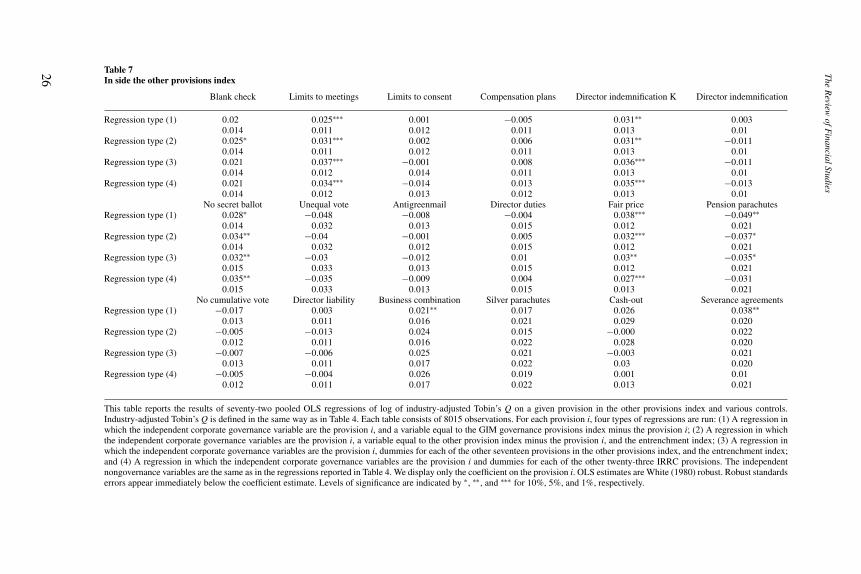
Accordingly, we carried out a preliminary investigation to look inside theO index. We ran four sets of eighteen regressions (for seventy-two regressionsoverall) whose results are displayed in Table 7. In particular, for each provisioni in the O index, we ran the following four types of regressions:
(1) a regression in which the independent corporate governance variableswere provision i and a variable equal to the GIM index minus provision i;
(2) a regression in which the independent corporate governance variableswere provision i, a variable equal to the O index minus provision i, andthe E index;
(3) a regression in which the independent corporate governance variableswere provision i, dummies for each of the other seventeen provisions inthe O index, and the E index; and
(4) a regression in which the independent corporate governance variableswere provision i and dummies for each of the other twenty-three IRRCprovisions.
Rows 1, 2, 3, and 4 of Table 7 display the results of the regressions oftype (1), (2), (3), and (4), respectively (only the coefficient of the provisionunder investigation in any given regression is displayed). The standard financialcontrols used in earlier regressions were also used in these regressions (seeregressions in Table 4). Of the eighteen IRRC provisions in the O index,seventeen of them do not have a coefficient that is negative and statisticallysignificant in any of the types of regressions used. Indeed, a fair number ofthem are positive with statistical significance.
With respect to one provision in the O index, pension parachutes, its co-efficient is not statistically significant in regression type (4), negative andsignificant at the 10% level in regression types (2) and (3), and negative andsignificant at the 5% level in regression type (1). The results with respect tothe negative effect of pension parachutes on firm valuation are thus mixed, andweaker than the results for each of the entrenching provisions. It is worth notingthat pension parachutes are present in only 1% of firms as of 2002 (and reacheda maximum of 5.3% of firms in 1993). Despite the mixed results and low in-cidence, the exact correlation between pension parachutes on firm valuation isan issue worth further exploration in future research.
It is important to note that, because of the problem of colinearity, we donot rule out the possibility that some of the eighteen provisions in the O indexare negatively correlated with firm value. We merely note that, using the samemethod that produced strong and unambiguous results regarding the negative
25
The
Review
ofFinancialStudies
Table 7In side the other provisions index
Blank check Limits to meetings Limits to consent Compensation plans Director indemnification K Director indemnification
Regression type (1) 0.02 0.025∗∗∗ 0.001 −0.005 0.031∗∗ 0.0030.014 0.011 0.012 0.011 0.013 0.01
Regression type (2) 0.025∗ 0.031∗∗∗ 0.002 0.006 0.031∗∗ −0.0110.014 0.011 0.012 0.011 0.013 0.01
Regression type (3) 0.021 0.037∗∗∗ −0.001 0.008 0.036∗∗∗ −0.0110.014 0.012 0.014 0.011 0.013 0.01
Regression type (4) 0.021 0.034∗∗∗ −0.014 0.013 0.035∗∗∗ −0.0130.014 0.012 0.013 0.012 0.013 0.01
No secret ballot Unequal vote Antigreenmail Director duties Fair price Pension parachutesRegression type (1) 0.028∗ −0.048 −0.008 −0.004 0.038∗∗∗ −0.049∗∗
0.014 0.032 0.013 0.015 0.012 0.021Regression type (2) 0.034∗∗ −0.04 −0.001 0.005 0.032∗∗∗ −0.037∗
0.014 0.032 0.012 0.015 0.012 0.021Regression type (3) 0.032∗∗ −0.03 −0.012 0.01 0.03∗∗ −0.035∗
0.015 0.033 0.013 0.015 0.012 0.021Regression type (4) 0.035∗∗ −0.035 −0.009 0.004 0.027∗∗∗ −0.031
0.015 0.033 0.013 0.015 0.013 0.021No cumulative vote Director liability Business combination Silver parachutes Cash-out Severance agreements
Regression type (1) −0.017 0.003 0.021∗∗ 0.017 0.026 0.038∗∗0.013 0.011 0.016 0.021 0.029 0.020
Regression type (2) −0.005 −0.013 0.024 0.015 −0.000 0.0220.012 0.011 0.016 0.022 0.028 0.020
Regression type (3) −0.007 −0.006 0.025 0.021 −0.003 0.0210.013 0.011 0.017 0.022 0.03 0.020
Regression type (4) −0.005 −0.004 0.026 0.019 0.001 0.010.012 0.011 0.017 0.022 0.013 0.021
This table reports the results of seventy-two pooled OLS regressions of log of industry-adjusted Tobin’s Q on a given provision in the other provisions index and various controls.Industry-adjusted Tobin’s Q is defined in the same way as in Table 4. Each table consists of 8015 observations. For each provision i, four types of regressions are run: (1) A regression inwhich the independent corporate governance variable are the provision i, and a variable equal to the GIM governance provisions index minus the provision i; (2) A regression in whichthe independent corporate governance variables are the provision i, a variable equal to the other provision index minus the provision i, and the entrenchment index; (3) A regression inwhich the independent corporate governance variables are the provision i, dummies for each of the other seventeen provisions in the other provisions index, and the entrenchment index;and (4) A regression in which the independent corporate governance variables are the provision i and dummies for each of the other twenty-three IRRC provisions. The independentnongovernance variables are the same as in the regressions reported in Table 4. We display only the coefficient on the provision i. OLS estimates are White (1980) robust. Robust standardserrors appear immediately below the coefficient estimate. Levels of significance are indicated by ∗, ∗∗, and ∗∗∗ for 10%, 5%, and 1%, respectively.
26

What Matters in Corporate Governance?
correlation between each of the entrenching provisions and Tobin’s Q, we donot obtain similar results with respect to any of the elements of the O index.
3.3 Exploring the issue of simultaneityThe findings reported so far have established that the E index and the individualprovisions that collectively constitute the E index are inversely correlated, witheconomic and statistical significance, with firm valuation. Of course, thesefindings, by themselves, do not establish that having a higher E index score isthe cause of lower firm valuation. It is possible that the correlation is the result oflower valued firms adopting entrenching provisions either because low-valuefirms might be more concerned with hostile takeovers or, alternatively, badmanagement will tend both to reduce firm valuation and to adopt entrenchingprovisions.14 This issue of simultaneity is often raised with respect to studiesthat find a correlation between various aspects of firm ownership and structureand firm valuation, and it is notoriously difficult to resolve.15
This section explores this issue of simultaneity. In doing so, we are assisted bythe fact that there was a meaningful amount of stability in firms’ E index scoresover the 1990–2002 period. In our data, a firm with a high entrenchment scoreas of 1990 is likely to have a high entrenchment score in 2002. With respect tosome of the entrenching provisions, it is necessary to first obtain shareholderapproval before they can be adopted, which made it difficult for firms that did notalready have these entrenching provisions as of 1990 to adopt them afterward.The most notable example of this phenomenon is staggered boards (Bebchukand Cohen 2005). With respect to other entrenching provisions that did notrequire a shareholder vote—poison pills and golden parachutes—managementcould unilaterally adopt these provisions. This makes the presence of thesetwo provisions at a particular point in time more likely to be the result of anendogenous firm decision at that point than the other entrenching provisions.Even so, there are some costs to management for suddenly adopting one of theseprovisions given possibly negative public, institutional investor, and marketreaction. It is easier to retain a pre-existing poison pill or golden parachute thanto suddenly adopt one.
We examine whether a firm’s entrenchment score in 1990, the beginningof our sample period, had a negative correlation with firm valuation in the1998–2002 period, the years at the end of our sample period. While a firm’s1990 entrenchment score is correlated with the firm’s entrenchment score dur-ing the 1998–2002 period for the reasons described above, the firm’s 1990
14 It is worth noting that the bad management causation story for the documented correlation is hardly a ringingendorsement of entrenching provisions and the managers adopting them.
15 Part of the problem is that good instruments are difficult to identify in this area. Bhagat and Bolton (2008) use thepercentage of stock owned by a firm’s directors as an instrument for governance, reasoning that stock ownershipcan be viewed as a substitute form of governance and that director percentage stock ownership was found notto be related to performance in one study. Although this approach is interesting, it is not clear that directors’ownership percentage should be viewed as a substitute form of governance if it has no effect on performance.
27

The Review of Financial Studies
Table 8The entrenchment index and firm value 1998–2002
Variable (1) (2) (3) (4)
Entrenchment Index E 90 −0.024∗∗∗ −0.017∗∗∗0.005 0.005
Entrenchment Index 1 90 −0.045 −0.0360.031 0.03
Entrenchment Index 2 90 −0.073∗∗ −0.075∗∗∗0.029 0.027
Entrenchment Index 3 90 −0.071∗∗ −0.054∗∗0.029 0.028
Entrenchment Index 4 90 −0.122∗∗∗ −0.092∗∗∗0.03 0.028
Entrenchment Index 5–6 90 −0.105∗∗∗ −0.078∗∗0.039 0.036
Other Provisions Index 0.002 0.002 0.002 0.0020.004 0.004 0.004 0.004
Log(Industry-Adjusted Q) 90 0.289∗∗∗ 0.291∗∗∗0.025 0.025
Log(Assets) 0.049∗∗∗ 0.049 0.045∗∗∗ 0.044∗∗∗0.005 0.005 0.005 0.005
Log(Company Age) −0.036∗∗ −0.032∗ −0.016 −0.010.017 0.017 0.018 0.017
Delaware Incorporation −0.021 −0.02 −0.017 −0.0150.015 0.015 0.014 0.014
Insider Ownership −0.004∗ 0.005∗ −0.003 −0.0030.003 0.003 0.002 0.002
Insider Ownership Square 0 0 0 00 0 0 0
ROA 2.859∗∗∗ 2.859∗∗∗ 2.457∗∗∗ 2.456∗∗∗0.134 0.134 0.147 0.147
CAPEX/Assets 0.173∗∗∗ 0.729∗∗∗ 0.847∗∗∗ 0.87∗∗∗0.167 0.031 0.16 0.162
Leverage −0.403∗∗∗ −0.405∗∗∗ −0.31∗∗∗ 0.312∗∗∗0.058 0.058 0.059 0.059
R&D per Sales 1.218∗∗∗ 1.28∗∗∗ 0.909∗∗∗ 0.934∗∗∗0.242 0.242 0.242 0.242
Year fixed effects Yes Yes Yes YesNumber of observations 2173 2173 2157 2157R_squared 0.4833 0.4840 0.5219 0.5230
This table reports pooled OLS regressions of log(industry-adjusted Tobin’s Q) for 1998–2002 on various controlsand two specifications of the entrenchment index. The calculation of industry-adjusted Tobin’s Q is described inTable 4. In addition to the controls used earlier in the Table 4 regressions, columns 1 and 3 control for firms’ 1990entrenchment index scores, while columns 2 and 4 control for the different levels of firms’ 1990 entrenchmentindex scores. Moreover, columns 3 and 4 control for the log of firms’ industry-adjusted Tobin’s Q as of 1990.Year dummies and a dummy for missing R&D data are included in all regressions, but their coefficients (aswell as the constant) are omitted. White (1980) robust standards errors appear below the coefficient estimate.Significance levels are indicated by ∗, ∗∗, and ∗∗∗ for 10%, 5%, and 1%, respectively.
entrenchment score cannot itself be the result of low-firm valuation duringthe 1998–2002 period. Column 1 of Table 8 presents the results of running aregression where the dependent variable is the log of industry-adjusted Tobin’sQ and the independent variables are firms’ E index scores as of 1990 and firms’other provisions scores in the 1998–2002 period. Column 2 presents the resultswhen dummy variables are used for the different levels of firms’ E index scoresas of 1990. Both regressions control for the full set of firm characteristics usedin earlier regressions.
28

What Matters in Corporate Governance?
As the results in column 1 indicate, a firm’s E index score as of 1990 isnegatively correlated, with economic and statistical significance (at the 1%level), with lower firm valuation during the 1998–2002 period. The resultswhen dummies are used for the different levels of the E index tell the samestory. Four out of the five dummy variables are negatively correlated, eitherat the 1% or 5% level, with lower firm valuation. Only the dummy variablerepresenting the lowest entrenchment score, while having a negative coefficient,is not statistically significant.
It might be suggested, however, that poor management at or prior to 1990was responsible both for the existence of entrenching provisions in 1990 andfor the firm’s low valuation in the 1998–2002 period. Of course, the likelihoodof this explaining the documented correlation is weakened by the fact thatmanagerial turnover is common over a twelve-year period. Nevertheless, giventhis possibility, we controlled for the log of firms’ industry-adjusted Tobin’s Qas of 1990 in the regressions we report in columns 3 and 4 of Table 8. Lowfirm valuation as of 1990 helps control for poor management as of 1990. Asbefore, entrenching provisions are negatively correlated, with economic andstatistical significance (at the 1% level), with lower firm valuation. And, asbefore, four out of the five dummy variables representing the different levels ofthe E index are negatively correlated, either at the 1% or 5% level, with lowerfirm valuation. Only the dummy variable representing the lowest entrenchmentscore, while negative, is not statistically significant.16
We conclude that, although low-Q firms tended to have high E levels at theend of our sample period, the negative correlation between Tobin’s Q and E atthe end of our sample period was not all due to the correlation in the beginningof the period; while high E firms began the period already with lower Q, their Qfurther declined over time. This is consistent with the possibility that having ahigher entrenchment score at least partly brings about (and not merely reflects)lower firm valuation. We should also remind the reader that, as stressed earlier,even if it turned out that the low Q of high E firms at the end of the periodwas all due to their low Q already in the beginning of the period, that wouldnot imply that entrenchment does not have an effect on firm value; it still couldbe the case that a high entrenchment level is necessary (and indeed chosen) inorder to sustain a low Q level over time without being taken over. In any event,although our evidence is consistent with an effect of entrenchment on value, itdoes not establish the direction of causation. The issue of simultaneity is onethat clearly calls for further examination.17
16 We did not extend our analysis to Tobin’s Q and E levels prior to 1990 due to lack of data about entrenchmentlevels prior to 1990. Lehn, Patro, and Zhao (2006) suggest that low Q levels in the early 1980s could not havereflected relatively high entrenchment levels because, based on a subset of firms for which they collected data,the average level of E was low during 1981–1985 data. But even though the average level of E in their 1981–1985sample was low, there was a significant variation among firms in E levels.
17 Another question with respect to the association between the E index and Tobin’s Q that is worthwhile answeringconcerns identifying how the identified association between E and Tobin’s Q varies among different subsets of the
29

The Review of Financial Studies
4. Entrenchment and Stock Returns
We next examine the relationship between a firm’s E index score and the firm’sabnormal stock returns. Much attention has therefore been paid to the findingsof Gompers, Ishii, and Metrick (2003) that firms with low GIM index scoreswere associated with higher abnormal returns during the 1990s compared tothose of firms with high GIM index scores. We investigate below whether theidentified correlation between returns and the GIM index during the 1990s wasattributable to the provisions in the E index.
At the outset, we should stress that for a provision to be associated witha negative abnormal return during a given time period is neither a necessarycondition nor a sufficient condition, for the provision to be negatively correlatedwith firm value.18 The findings on Tobin’s Q might well be more informativethan stock return results in identifying provisions that might have adverseeffects on shareholders. We also wish to emphasize that the literature hasstill not resolved how to best interpret the Gompers, Ishii, and Metrick (2003)results concerning abnormal returns. Are these results due to the market learningto appreciate the significance of entrenchment (Gompers, Ishii, and Metrick2003), to a correlation between the GIM index and some common risk factormissing from the standard asset pricing model (Cremers, Nair, and John 2008),or to yet some other factor? This and similar questions are ones on which aconsensus is yet to emerge.
For our purposes, which are to identify which IRRC provisions matter, whatis most important is not to explain the abnormal return results of Gompers, Ishii,and Metrick (2003) but to examine whether they are driven by the provisionsin the E index. Our finding that they do reinforces our earlier conclusion that,within the IRRC provisions universe, the provisions in the E index are thosethat matter.
Gompers, Ishii, and Metrick (2003) employed the following methodologyin calculating the abnormal return associated with differences in GIM indexscores. A “Democracy” portfolio was constructed consisting of firms withstrong shareholder rights protections, defined as those firms with GIM indexscores of 5 or less. Likewise, a “Dictatorship” portfolio was constructed con-sisting of firms with weak shareholder rights protections, defined as those firmswith GIM index scores of 14 or more. The firms in the Democracy and Dic-tatorship portfolios roughly correspond to the best and worst 10% of firmsin terms of GIM index scores. Democracy and Dictatorship portfolios wereconstructed both by weighting stock positions by a firm’s market capitalization
economy’s public firms. This question is explored by Cremers, Nair, and Peyer (forthcoming) and Kadyrzhanova(2006).
18 A corporate governance provision that is harmful to shareholders might have no abnormal returns associated withit during a given period if the market accurately assessed the provision’s adverse consequences in the beginningof the period. Conversely, a provision that is in fact beneficial to shareholders might be associated with a negativereturn during a given period if the market viewed it at the end of the period somewhat less positively—althoughstill positively—than in the beginning of the period.
30
What Matters in Corporate Governance?
(value-weighted portfolios), as well as by equally weighting each firm (equal-weighted portfolios).
Gompers, Ishii, and Metrick (2003) found that the monthly abnormal returnfor going long the Democracy portfolio and short the Dictatorship portfolio,value-weighted, was 71 basis points with 1% significance level, and that doingso using equally weighted portfolios yielded a monthly abnormal return of 45basis points with 5% significance.19 Their findings of statistically significantabnormal returns applied only to a trading strategy using Democracy and Dicta-torship portfolios (firms at the extremes of the GIM index) in its long and shortpositions. Expanding their testing to a broader spectrum of firms, includingfirms in the middle of the GIM index distribution, they found no statisticallysignificant abnormal returns resulting from going long firms with low GIMindex scores while shorting firms with high GIM index scores.
Our main findings are as follows. Firms with a low E index score are associ-ated with statistically significant abnormal returns both during the 1990–1999period investigated by Gompers, Ishii, and Metrick (2003) and the longer 1990–2003 time period which our data enable us to study. Moreover, including firmsin our trading strategies that are in the middle of the E index distribution stillgenerates positive monthly abnormal returns with 1% statistical significance,albeit abnormal returns that are smaller than those generated using firms onlywith extreme E index scores. We find that this association between E indexscores and stock returns is not due to the E index being correlated with IRRCprovisions not included in the E index. Finally, we find that the corporate gover-nance provisions not included in the E index have no explanatory power, abovethat already provided by the E index, for returns during the two time periods(1990–1999; 1990–2003) we study.
4.1 The E index and returns for the 1990s4.1.1 Summary statistics. We begin by presenting some basic summarystatistics on the E index and stock returns during the 1990s. Table 9 presentsthe average monthly returns of portfolios of firms, both equally weighted andvalue-weighted, with the same E scores (0, 1, 2, 3, 4, 5–6) for the period ofSeptember 1990–December 1999. Interestingly, the average monthly returndrops monotonically as one moves from having an entrenchment score of 0 toan index score of 5 and 6. The difference between firms with an entrenchmentscore of 0 and firms with an entrenchment score of five or six is quite substantial:1.74% versus 1.26% for equally weighted portfolios and 2.45% versus 1.51%for value-weighted portfolios. Because the returns of value-weighted portfolioscan be substantially affected by the returns of a small number of the largestcompanies, it could be plausibly argued that more attention should be paid
19 We were able to replicate these basic findings with the Fama-French benchmark factors. We found that thevalue-weighted trading strategy generated a monthly abnormal return of 73 basis points at the 1% level, whilethe equally weighted trading strategy generated a monthly abnormal return of 49 basis points at the 5% level.
31

The Review of Financial Studies
Table 9Summary statistics on entrenchment index stock returns
Entrenchment index level Equal-weight Value-weight
Index 5–6 1.26% 1.51%Index 4 1.40% 1.85%Index 3 1.46% 1.93%Index 2 1.59% 2.26%Index 1 1.72% 2.33%Index 0 1.74% 2.45%
This table documents the average monthly return of stocks of portfolios of stocks consisting of the sameentrenchment index scores (0, 1, 2, 3, 4, or 5–6) for the period of September 1990–December 1999. Portfoliosare constructed using equal weights of stocks and weighting positions in stocks by firms’ common stockmarket capitalization. Firms’ entrenchment scores were adjusted when updated information on firms’ corporategovernance provisions became available: July 1993; July 1995; and February 1998.
to results based on equally weighted portfolios. But we follow the literatureby reporting throughout results based on both equally weighted and value-weighted portfolios.
This decline in monthly returns as a firm’s entrenchment score increasesoccurs not only when one moves from firms with very low entrenchment scoresto firms with very high entrenchment scores but also as E index scores increasein the middle of the E index distribution. Moreover, the decline in monthlyreturns as a firm’s entrenchment score increases holds equally true for bothequally weighted and value-weighted portfolios. In both cases, average returnsdecrease monotonically as one moves to portfolios with higher entrenchmentscores.
Obviously, these summary statistics are only suggestive of a possible rela-tionship between the E index and stock returns in the 1990s. To explore thispossibility systematically, it is necessary to control for other factors, such assystematic risk, that might be affecting stock returns for firms with different Eindex scores.
4.1.2 The baseline model: controlling for the Fama-French and Carhartfour factors. To identify the correlation between different levels of the Eindex and stock returns, we investigated the following question: What was theabnormal return associated with taking a long position in the firms with a givenE index score and, at the same time, shorting the firms with a higher E indexscore? To answer this question, we follow the methodology of Gompers, Ishii,and Metrick (2003) of regressing the return of this long-short trading strategyfor month t (call this variable Difft), on the four-factor model of Carhart (1997).In other words, we ran the following regression:
Diff t = a + b1 ∗ MKTRFt + b2 ∗ HMLt + b3 ∗ SMBt
+b4 ∗ Momentumt + et , (1)
where MKTRFt is the month t value-weighted market return minus the risk-freerate, SMBt and HMLt are the Fama-French zero-investment benchmark factor
32

What Matters in Corporate Governance?
mimicking portfolios reflecting, respectively, size and book-to-market stockreturn effects for time t (see Fama and French 1993), and Momentumt reflectsstock return momentum effects for time t (see Carhart 1997). The Fama-Frenchfactors were obtained from Kenneth French’s data library and the Carhartmomentum factor was constructed by us using the procedures described inCarhart (1997). Accordingly, a is construed as the monthly abnormal returnassociated with going long firms with low E index scores and, simultaneously,shorting firms with high E index scores.
Monthly abnormal returns were calculated using both value-weighted port-folios and equally weighted portfolios. These hedging portfolios were updatedas new information became publicly available concerning the corporate gover-nance provisions firms had. September 1990 is the starting date of the sampleperiod as this was the month that the first IRRC volume was published andbecame publicly available. Firm membership in portfolios was adjusted in July1993, July 1995, February 1998, November 1999, and February 2002 as theseare the dates when updated IRRC volumes became publicly available.
Table 10 displays the abnormal return results for the 1990s controlling forthe Carhart (1997) four factors (the baseline model). These results, regardlessof whether one looks at equally weighted or value-weighted E index portfolios,are striking. During the 1990s, going long those firms with the lowest possibleentrenchment score (index score of 0) and shorting the high E index portfolio(index scores of 5 and 6) would have generated a monthly abnormal returnof 61 basis points with 1% significance when equally weighted portfolios areused; and it would have yielded monthly abnormal returns of 116 basis pointswith 1% significance when value-weighted portfolios are used. On an annualcompounded basis, these strategies would have produced an abnormal returnof 7.4% when equally weighted portfolios are used and 14.8% when value-weighted portfolios are used.20
There is another interesting pattern that emerges from the baseline modelresults in Table 10. The abnormal returns are all positive with statistical sig-nificance at the 1% level but progressively decline, whether equally weightedor value-weighted portfolios are used in the trading strategy, as one includesmore and more firms in the middle of the E index distribution. This monotonicdecline in abnormal returns as the trading strategies include more firms in themiddle of the distribution (with the first trading strategy on the far left beinglong index level 0-short index levels 5–6, then long 0-short 4–6, long 0–1-short 4–6, long 0–1-short 3–6, and finally long 0–2, short 3–6) is illustrated inFigure 1.
The same pattern of declining abnormal returns emerges when firms in themiddle of the E index are added to the long and short positions (with the first
20 These figures are based on compounding the monthly return over the year. Without compounding, the annualabnormal returns would be approximately 7.2% for a strategy based on equally weighted portfolios and 13.9%for a strategy based on value-weighted portfolios.
33

The
Review
ofFinancialStudies
Table 10Monthly abnormal returns associated with different trading strategies: the 1990S
Baseline model Industry-adjusted O-bucket-adjusted
Long-short portfolios Equal-weight Value-weight Equal-weight Value-weight Equal-weight Value-weight
Index 0-Index 5–6 0.61∗∗∗ 1.16∗∗∗ 0.60∗∗∗ 1.01∗∗∗ 0.73∗∗∗ 1.16∗∗∗(0.200) (0.284) (0.182) (0.301) (0.269) (0.298)
Index 0-Index 4–5–6 0.42∗∗∗ 0.74∗∗∗ 0.47∗∗∗ 0.82∗∗∗ 0.61∗∗∗ 0.89∗∗∗(0.134) (0.191) (0.116) (0.198) (0.195) (0.210)
Index 0–1-Index 4–5–6 0.41∗∗∗ 0.62∗∗∗ 0.44∗∗∗ 0.62∗∗∗ 0.34∗∗ 0.77∗∗∗(0.138) (0.153) (0.109) (0.154) (0.141) (0.180)
Index 0–1-Index 3–4–5–6 0.32∗∗∗ 0.52∗∗∗ 0.34∗∗∗ 0.57∗∗∗ 0.28∗∗∗ 0.58∗∗∗(0.106) (0.141) (0.088) (0.130) (0.107) (0.161)
Index 0–1–2-Index 3–4–5–6 0.25∗∗∗ 0.47∗∗∗ 0.26∗∗∗ 0.51∗∗∗ 0.23∗∗∗ 0.50∗∗∗(0.079) (0.116) (0.067) (0.108) (0.071) (0.123)
This table documents the monthly abnormal returns, and their associated robust standard errors in parentheses, associated with different trading strategies for the period of September1990–December 1999. The monthly abnormal returns were calculated using three different methods. In the baseline model, abnormal returns were calculated by regressing the returnassociated with a particular trading strategy on the three Fama-French factors (Fama and French 1993)—book-to-market stock effects, firm size stock effects, and market stock effects—anda momentum factor that was calculated using the procedures described in Carhart (1997). The trading strategies analyzed consist of going long a portfolio of stocks with a certainentrenchment index score and, simultaneously, shorting another portfolio of stocks with a higher entrenchment score. These long and short portfolios were adjusted when updatedinformation on firms’ corporate governance provisions became available: July 1993; July 1995; and February 1998. The long and short portfolios of stocks were constructed using equalweightings of each stock (equal-weight) and by weighting the holding of a stock in the portfolio by its common stock market capitalization (value-weight). With industry-adjusted returns,the monthly abnormal returns were calculated by first subtracting from each firm’s monthly stock return the median industry return for the industry in which the firm operates. TheFama-French forty-eight industry classifications (Fama and French 1997) were used in classifying firms across industries. Monthly abnormal returns were then calculated by regressingthe industry-adjusted returns associated with a trading strategy on the four Carhart (1997) factors used in the baseline model. Finally, with the O-bucket-adjusted returns, the long andshort portfolios were constructed by first dividing all stocks into four buckets consisting of firms with O scores of 0–5, 6, 7–8, and 9–13. Then, the return on going long firms with acertain E score and short firms with a certain E score (either equally weighted or value-weighted) within each bucket was calculated with an overall long-short portfolio consisting of anequally weighted position in each of the four long and short positions created for the four O buckets. The O bucket-adjusted returns associated with a particular trading strategy wereregressed, as always, on the four Carhart factors. Levels of significance are indicated by ∗, ∗∗, and ∗∗∗ for 10%, 5%, and 1%, respectively.
34

What Matters in Corporate Governance?
0
25
50
75
Long 0Short 5-6
Long 0Short 4-6
Long 0-1Short 4-6
Long 0-1Short 3-6
Long 0-2Short 3-6
Trading Strategies
Bas
is P
oin
ts
Figure 1Monthly abnormal returns: baseline model, equally weighted portfolios.
020406080
100120140
Long 0Short 5-6
Long 0Short 4-6
Long 0-1Short 4-6
Long 0-1Short 3-6
Long 0-2Short 3-6
Trading Strategies
Bas
is P
oin
ts
Figure 2Monthly abnormal returns: baseline model, value-weighted portfolios.
trading strategy on the far left again being long 0-short 5–6, then long 0-short4–6, long 0–1-short 4–6, long 0–1-short 3–6, and finally long 0–2-short 3–6)when value-weighted portfolios are used (Figure 2).
This monotonic decline in abnormal returns is to be expected if stock returnsare negatively correlated with the degree to which managers are entrenched ascaptured by the E index.
4.1.3 Industry-adjusted returns. There is, of course, always the possibilitythat a firm’s corporate governance provisions merely reflect the industry inwhich the firm happens to operate. That is, it might be that low entrenchmentlevels were more common in industries that happened to perform well in termsof returns during the 1990s, and that the above findings of abnormal returnswere driven by industry association. We therefore control for industry effectson stock returns in the same manner as Gompers, Ishii, and Metrick (2003).
In particular, we classified all the firms in our dataset into one of the forty-eight Fama-French (1997) industry classifications, and then calculated industry-adjusted monthly returns by first subtracting from each firm’s monthly stockreturn the median monthly industry return for the Fama-French industry inwhich the firm operates. Monthly abnormal industry-adjusted returns on atrading strategy were then calculated by regressing the industry-adjusted returns
35

The Review of Financial Studies
associated with this strategy (going long firms with a particular E index scoreand, simultaneously, shorting other firms with a higher E index score) onthe three Fama-French factors (Fama and French 1993) and a momentumfactor (Carhart 1997). The industry-adjusted monthly abnormal returns werecalculated for the same trading strategies analyzed in the baseline model. Theresults are also reported in Table 10.
As Table 10 indicates, all the long-short portfolios continue to generatepositive abnormal returns that are all statistically significant at the 1% level.Also, once again, as one adds firms with index scores in the middle of thedistribution to the long and short portfolios, the industry-adjusted monthlyabnormal returns monotonically decrease. Finally, the industry-adjusted returnestimates are approximately the same as those estimated without adjusting forindustry. In short, the abnormal return results generated using the baselinemodel do not appear to be driven by industry effects.
4.1.4 Controlling for other governance provisions. One potential issuewith the preceding analysis is the fact that the E index is correlated withother corporate governance provisions covered by the IRRC. Recall that thecorrelation between the E index and the O index is about 0.3–0.35 during theperiod of our study. This makes it desirable to examine whether the resultsassociating higher abnormal returns with lower E index scores are due to acorrelation between returns and the O index.
To address this issue, we calculate the results of a new set of trading strategiesthat seek to control for the provisions in the O index. We wish to test whether,within pools of firms that have similar levels of the O index, going long on lowentrenchment companies and short on high entrenchment companies continuesto produce positive abnormal returns.
Specifically, we start by dividing all firms into four buckets based on theirO index score. The four buckets were created so as to contain, to the extentpossible, equal numbers of observations. The four buckets of firms consist offirms with low O index scores (index score of 5 or less); firms with medium-low O index scores (index score of 6); firms with medium-high O index scores(index scores of 7 and 8); and firms with high O index scores (index scores of9 or more). In addition, we used several different divisions of the O index intobuckets and found that using them does not affect the results.
With these O buckets in place, we were able to take into account the Odistribution, as captured by the four buckets, when calculating abnormal returnsassociated with going long firms with low E index scores and short high E indexfirms.21 When considering a trading strategy of going long firms with a givenlow E index score level and short firms with a given high E index score level,we would for each O index bucket create positions (either equally weighted
21 It is impossible to do an exact O index distribution given a lack of sufficient firm observations across theentrenchment index to replicate the O index distribution.
36

What Matters in Corporate Governance?
or value-weighted) consisting of going long all the firms with the given lowentrenchment level and short all the firms with the given high entrenchmentlevel in that O index bucket. We then created an overall long-short portfolioconsisting of an equally weighted position in each of the four long and shortpositions created for the four O index buckets. As before, we then regressedthe return associated with this long-short portfolio on the Carhart (1997) four-factor model, with the intercept term being interpreted as the monthly abnormalreturn associated with this particular trading strategy.
The basic idea behind constructing portfolios in this way is to ensure that,in constructing our long-short portfolios, the firms purchased and shorted aredifferent in their E index scores while still being roughly similar in their O indexscores. The method is analytically similar to the way in which the Fama-Frenchbook-to-market and firm size factors are calculated (see Fama and French 1993)as well as the Carhart momentum factor construction (see Carhart 1997).
The same trading strategies analyzed earlier were used once again. Theresults, which are reported in Table 10, indicate relatively little changes afterwe control for correlation with the O index. The abnormal returns remainpositive and statistically significant at the 1% level, with one exception that ispositive and significant at the 5% level. Moreover, the abnormal return estimatesare of roughly similar magnitudes. For instance, the monthly abnormal returnof going long firms in the bottom half of the distribution and short the tophalf is 23 basis points for equally weighted portfolios and 50 basis points forvalue-weighted portfolios, both with 1% significance. Also, the same patternof decreasing abnormal returns again emerges when looking at the effect ofadding firms in the middle of the E index distribution to the long and shortportfolios.
4.2 The E index and returns for 1990–2003Following the initial finding by Gompers, Ishii, and Metrick (2003) of cor-relation between the GIM index and lower stock returns during the period1990–1999, subsequent work did not find such correlation in a period extendedforward to include the beginning of this decade (Cremers and Nair 2005).The question therefore naturally arises whether the trading strategies analyzedabove, going long firms with low E index scores and shorting firms with higherE index scores, would have yielded abnormal returns in the 1990–2003 period.
Turning to this question, we calculated for the period 1990–2003 the abnor-mal returns for different trading strategies using the Carhart (1997) four factors(the baseline model), the industry-adjusted model, and the O-bucket adjustedmodel. The results are summarized in Table 11.
As Table 11 indicates, all the trading strategies, going long on low entrench-ment firms and short on high entrenchment firms, continue to produce positiveabnormal returns that are large and statistically significant at the 1% level.Furthermore, for both the equally weighted and value-weighted portfolios, ab-normal returns on trading strategies largely continue to decline monotonically
37

The
Review
ofFinancialStudies
Table 11Monthly abnormal returns associated with different trading strategies: 1990–2003
Baseline model Industry-adjusted O-bucket-adjusted
Long-short portfolios Equal-weight Value-weight Equal-weight Value-weight Equal-weight Value-weight
Index 0-Index 5–6 0.60∗∗∗ 0.84∗∗∗ 0.66∗∗∗ 0.94∗∗∗ 0.68∗∗∗ 0.81∗∗∗(0.185) (0.224) (0.156) (0.230) (0.220) (0.246)
Index 0-Index 4–5–6 0.39∗∗∗ 0.57∗∗∗ 0.48∗∗∗ 0.67∗∗∗ 0.50∗∗∗ 0.60∗∗∗(0.145) (0.186) (0.125) (0.185) (0.169) (0.206)
Index 0–1-Index 4–5–6 0.42∗∗∗ 0.52∗∗∗ 0.52∗∗∗ 0.53∗∗∗ 0.35∗∗∗ 0.58∗∗∗(0.133) (0.157) (0.114) (0.151) (0.130) (0.179)
Index 0–1-Index 3–4–5–6 0.37∗∗∗ 0.41∗∗∗ 0.43∗∗∗ 0.46∗∗∗ 0.34∗∗∗ 0.43∗∗∗(0.107) (0.132) (0.090) (0.125) (0.100) (0.144)
Index 0–1–2-Index 3–4–5–6 0.27∗∗∗ 0.37∗∗∗ 0.34∗∗∗ 0.39∗∗∗ 0.24∗∗∗ 0.38∗∗∗(0.085) (0.117) (0.070) (0.110) (0.074) (0.121)
This table documents the monthly abnormal returns, and their associated robust standard errors in parentheses, associated with different trading strategies for the period of September1990–December 2003. The abnormal returns were calculated in the same manner as in Table 10: the baseline model, industry-adjusted returns, and O bucket-adjusted returns. The longand short portfolios were adjusted when updated information on firms’ corporate governance provisions became available: July 1993; July 1995; February 1998; November 1999; andFebruary 2002. The long and short portfolios of stocks were constructed using equal weightings of each stock (equal-weight) and by weighting the holding of a stock in the portfolio byits common stock market capitalization (value-weight). Levels of significance are indicated by ∗, ∗∗, and ∗∗∗ for 10%, 5%, and 1%, respectively.
38

What Matters in Corporate Governance?
as firms in the middle of the E index are added to the long and short portfo-lios. This overall pattern emerges in the baseline model, the industry-adjustedmodel, and the O-bucket-adjusted model.
In terms of the magnitude of the abnormal returns, the results for the period1990–2003 are roughly similar to the results for the period 1990–1999 whenthe trading strategies use equally weighted portfolios. For example, going longE index 0 and short index 5 or 6 would have yielded 61 basis points during1990–1999 and 60 basis points during 1990–2003 using the baseline four-factor model; would have yielded 60 basis points during 1990–1999 and 66basis points during 1990–2003 using the industry-adjusted model; and wouldhave yielded 73 basis points during 1990–1999 and 68 basis points during1990–2003 using the O-bucket-adjusted model. Similarly, when going longfirms with E index scores of 2 or less and shorting the firms with index 3or more, moving from 1990–1999 to 1990–2003 would have increased themonthly abnormal return by 2 basis points (to 27 basis points) under thebaseline model; by 8 basis points (to 34 basis points) under the industry-adjustedmodel; and 1 basis point (to 24 basis points) under the O-bucket-adjustedmodel.
For trading strategies using value-weighted portfolios, the abnormal returnsfor the 1990–2003 period are significantly smaller than the corresponding trad-ing profits for the 1990–1999 period. The trading profits using value-weightedportfolios in the 1990–2003, however, continue to be quite large in magni-tude and, in particular, higher than the abnormal return on the correspondingstrategies using equally weighted portfolios during either the 1990–1999 or the1990–2003 period. For example, during 1990–2003, using value-weightings,going long E index zero firms and shorting index five or six firms would haveyielded a monthly positive abnormal return of 84 basis points under the baselinemodel; 94 basis points under the industry-adjusted model; and 81 basis pointsunder the O-bucket-adjusted model. In contrast, using equal-weightings, goinglong index zero firms and shorting index five or six firms during 1990–1999would have yielded only a monthly positive abnormal return of 61 basis pointsunder the baseline model (or 60 basis points if the period were extended to2003); 60 basis points under the industry-adjusted model (or 66 if the periodwere extended to 2003); and 73 basis points under the O-bucket-adjusted model(or 68 if the period were extended to 2003).
4.3 Stock returns and the O indexWe have found that, even after controlling for the O index, the E index wascorrelated with stock returns during the period we study. There is still thepossibility, however, that the O index was also correlated, controlling for the Eindex level, with stock returns. In other words, it is possible to flip the inquiryand ask whether the O index, the IRRC corporate governance provisions notreflected in the E index, has explanatory power for stock returns.
39

The Review of Financial Studies
Table 12Monthly abnormal returns associated with different trading strategies controlling for entrenchment indexdistribution
1990–1999 1990–2003
Long-short portfolios Equal-weight Value-weight Equal-weight Value-weight
Index 0–5-Index 9–13 0.10 (0.162) 0.13 (0.180) 0.07 (0.133) 0.05 (0.146)Index 0–5-Index 7–8 −0.024 (0.143) 0.08 (0.124) 0.03 (0.124) 0.17 (0.106)Index 0–5-Index 6 −0.10 (0.148) −0.01 (0.155) −0.04 (0.136) −0.05 (0.141)Index 0–6-Index 7–13 0.10 (0.107) 0.02 (0.056) 0.07 (0.096) 0.05 (0.051)
This table documents the monthly abnormal returns, and their associated t-statistics in parentheses, associatedwith trading strategies controlling, as in Tables 10 and 11, for the three Fama-French factors (Fama and French1993) and the Carhart (1997) momentum factor. Portfolios are constructed by first dividing all stocks in the sameother provisions (O) category, 0–5, 6, 7–8, or 9–13, into six entrenchment index categories. The six entrenchmentindex buckets are entrenchment index scores of 0, 1, 2, 3, 4 and 5–6. A portfolio in a certain O index category isthen constructed by calculating the equally weighted return of stocks with the desired O index category acrossthe six entrenchment buckets. Within each bucket, the equally weighted and value-weighted returns of stocks inthe same O category were calculated. The monthly abnormal returns associated with going long and short variousportfolios was calculated for both the period of September 1990–December 1999 period and the longer periodof September 1990–December 2003. The long and short portfolios were adjusted when updated information onfirms’ corporate governance provisions became available: July 1993; July 1995; February 1998; November 1999;and February 2002. Levels of significance are indicated by ∗, ∗∗, and ∗∗∗ for 10%, 5%, and 1%, respectively.
Accordingly, we calculated the abnormal returns associated with firms’ Oindex scores, controlling for the E index distribution as captured by different Eindex buckets. To this end, we created six E index buckets, each consisting of allthe firms in a given level of the index from 0 to 5, with the small number of firmswith E index 6 scores added to the bucket with E index five firms. Followingthe methodology described earlier, we would for each E index bucket createpositions (either equally weighted or value-weighted) consisting of going longall the firms with a given low O index score and short all the firms with a givenhigh O index score in that E level bucket. After doing this, we then createdan overall long-short portfolio consisting of an equally weighted position ineach of the six long and short positions created for the six E index buckets. Asalways, we regressed the return associated with this long-short portfolio on theCarhart (1997) four-factor model, with the intercept term being interpreted asthe monthly abnormal return associated with this particular trading strategy.
We did the calculations both for the 1990–1999 period and for the 1990–2003 period. The long-short portfolios in O index positions were based on thedivision of firms into four O index buckets: firms with O index scores between0 and 5; firms with O index scores of 6; firms with O index scores of 7 or 8;and firms with O index scores of 9 and more. Table 12 contains the results ofthis analysis.
Out of the sixteen trading strategies analyzed, consisting of going long firmswith low O index levels and short firms with high O index levels, none generatedstatistically significant abnormal returns, even at the 10% level. Indeed, manyof the t-statistics indicate p-values in the range of 80%. In addition to the lackof statistical significance, the coefficients are sometimes negative rather thanpositive and always small in magnitude, never exceeding 0.17. These results
40

What Matters in Corporate Governance?
are consistent with the view that the O index has little residual explanatorypower for returns once the E index is taken into account.
5. Concluding Remarks
This article has identified which provisions, among the set of twenty-fourIRRC provisions used in the GIM governance index, are negatively correlatedwith firm performance. We have identified six entrenching provisions that arenegatively correlated with firm valuation, as measured by Tobin’s Q, as well aswith stock returns during the 1990–2003 period. We have also found that theseprovisions fully drive the findings documented by prior research that the IRRCprovisions in the aggregate are correlated with Tobin’s Q, as well as returnsduring the 1990s.
Our results contribute to our understanding of the relationship between gov-ernance and firm value, and provide a basis for future work in several ways.The E index provides a measure that can be used, and is already being usedin a large number of studies, by researchers seeking to use in their tests agovernance measure not influenced by the noise produced by the other IRRCprovisions. The six provisions in the E index are those which researchers, aswell as private and public decision makers, should pay most attention. Andknowing which provisions matter also provides a useful tool in the inquiry intothe cause of the correlation between the IRRC provisions in the aggregate andfirm value.
Pursuing fully this inquiry is an important task for future work. We presentsome evidence that is consistent with the possibility that, in the aggregate,the entrenching provisions bring about or help maintain lower firm valuation.But this evidence does not establish causality and much more work needsto be done. With the key provisions responsible for the correlation with firmvalue now known, it will be possible to examine whether the answers to thesequestions vary among the provisions in the E index. We conjecture that theconstitutional limitations on shareholder power do bring about, and not merelyreflect, lower firm value. In contrast, we conjecture that the correlation thatpoison pills and golden parachutes have with lower firm value at least partlyreflects the greater tendency of managers of firms with lower firm value toadopt takeover readiness provisions.
In constructing the E index, we have followed the standard approach ofgiving each of the provisions an equal weight and not making this weightconditional on the presence (or absence) of other provisions that might interactwith it. An important avenue for future work to explore is the possibility ofimproving the index by exploring the possibility that some of the provisionsin the E index matter more than others and that interactions among them (e.g.,having a combination of a staggered board and a poison pill) are important.
Looking beyond the set of IRRC provisions, our analysis cautions againstthe “kitchen sink” approach of building ever-larger indexes of governance
41

The Review of Financial Studies
measures. Shareholder advisory firms, including industry leader ISS, have putforward indexes of good corporate governance based on a massive number ofprovisions, and the development and use of these indexes has put pressure onfirms to adjust their arrangements in ways that would improve their index scores.As this article highlights, in any large set of governance provisions, many arelikely not to matter or to be an endogenous product of others. Compared with agovernance rating scheme based on the key provisions that matter, a governancerating system based on a much larger set can push firms in directions that arecounter-productive or at least wasteful, and provides a noisier measure ofgovernance quality. In short, adding more provisions to an index is hardlybound to be beneficial; in this area, less can be more. Shareholders and theiradvisers might do well to focus on those corporate governance provisions thatreally matter for firm value.
Appendix: IRRC Definitions of the Twenty-Four Provisions
E index provisionsStaggered board: a board in which directors are divided into separate classes (typically three)
with each class being elected to overlapping terms.Limitation on amending bylaws: a provision limiting shareholders’ ability through majority vote
to amend the corporate bylaws.Limitation on amending the charter: a provision limiting shareholders’ ability through majority
vote to amend the corporate charter.Supermajority to approve a merger: a requirement that requires more than a majority of share-
holders to approve a merger.Golden parachute: a severance agreement that provides benefits to management/board members
in the event of firing, demotion, or resignation following a change in control.Poison pill: a shareholder right that is triggered in the event of an unauthorized change in control
that typically renders the target company financially unattractive or dilutes the voting power of theacquirer.
O index provisionsLimitation on special meeting: a provision limiting shareholders’ ability to act by calling a
special meeting (as opposed to waiting for the regularly scheduled shareholders’ meeting).Limitation on written consent: a provision limiting shareholders’ ability to act via written
consent (as opposed to acting through a vote at the shareholders’ meeting).Elimination of cumulative voting: a provision eliminating shareholders’ ability to apportion
their votes in an election.Secret ballot: a system of voting that ensures management does not look at individual proxy
cards.Director indemnification: a charter or bylaw provision indemnifying the firm’s officers and
directors against certain legal expenses and judgments as a result of their conduct.Director indemnification contract: a contract with individual officers and directors promising
indemnification against certain legal expenses and judgments as a result of their conduct.Limited director liability: a provision that limits the personal liability of its directors.Compensation plan: a plan that accelerates benefits in the event of a change in control.Severance agreement: a contract which ensures executives some income protection in the event
of losing their positions.
42
What Matters in Corporate Governance?
Unequal voting rights: a provision by which voting power changes based on certain conditions.Blank check preferred stock: this is stock that, when authorized, gives the board broad discretion
in establishing the stock’s voting, dividend, and other rights when issued.Fair price requirements: a requirement that a bidder pays all shareholders a “fair price,” typically
the highest price paid by a bidder prior to a tender offer being made.Cash-out law: a provision that enables shareholders to sell to a controlling shareholder, usually
at the highest price recently paid by the controlling shareholder.Director duties: a provision that permits the board to consider nonshareholder interests in
evaluating a possible change in control.Business combination law: a law that limits the ability of an acquirer to conduct certain trans-
actions with the acquired company postacquisition.Antigreenmail provision: a provision that prevents an entity from acquiring a block of stock in
a company and selling it back to the company at an above-market price.Pension parachute: provisions that limit the ability of an acquirer from using surplus money in
a pension plan to fund the acquisition.Silver parachute: a severance agreement that provides benefits to a large number of firm
employees in the event of firing, demotion, or resignation following a change in control.
ReferencesAmit, R., and B. Villalonga. 2006. How Do Family Ownership, Control, and Management Affect Firm Value?Journal of Financial Economics 80:385–417.
Bates, T., D. Becher, and M. Lemmon. 2008. Board Classification and Managerial Entrenchment: Evidence fromthe Market for Corporate Control. Journal of Financial Economics 87:656–77.
Bebchuk, L. 2002. The Case against Board Veto in Corporate Takeovers. University of Chicago Law Review69:973–1035.
Bebchuk, L., and A. Cohen. 2005. The Costs of Entrenched Boards. Journal of Financial Economics 78:409–33.
Bebchuk, L., A. Cohen, and A. Ferrell. 2004. What Matters in Corporate Governance? Discussion Paper No.491, John M. Olin Center for Law, Economics, and Business, Harvard Law School.
Bebchuk, L., J. Coates, and G. Subramanian. 2002. The Powerful Antitakeover Force of Staggered Boards:Theory, Evidence & Policy. Stanford Law Review 54:887–951.
Bebchuk, L., J. Coates, and G. Subramanian. 2003. The Power of Takeover Defenses. Working Paper, HarvardLaw School and NBER.
Bebchuk, L., A. Cohen, and C. Wang. 2008. Golden Parachutes and Corporate Acquisitions. Working Paper,Harvard Law School and NBER.
Bebchuk, L., and J. Fried. 2004. Pay Without Performance: The Unfulfilled Promise of Executive Compensation.Cambridge, MA: Harvard University Press.
Bebchuk, L., and L. Stole. 1993. Do Short-Term Managerial Objectives Lead to Under- or Over-Investment inLong-Term Projects? Journal of Finance 48:719–29.
Bertrand, M., and S. Mullainathan. 1999. Is There Discretion in Wage Setting? Rand Journal of Economics30:535–54.
Bertrand, M., and S. Mullainathan. 2003. Enjoying the Quiet Life? Managerial Behavior Following Anti-takeoverLegislation. Journal of Political Economy 11:1043–75.
Bhagat, S., and B. Bolton. 2008. Corporate Governance and Firm Performance. Journal of Corporate Finance14:257–73.
Black, B., B. Cheffins, and M. Klausner. 2006. Outside Director Liability. Stanford Law Review 58:1055–159.
43

The Review of Financial Studies
Borokhovich, K., B. Kelly, and R. Parrino. 1997. CEO Contracting and Antitakeover Amendments. Journal ofFinance 52:1495–517.
Brown, L., and M. Caylor. 2006. Corporate Governance and Firm Valuation. Journal of Accounting and PublicPolicy 25:409–34.
Clark, R. 1986. Corporate Law. Little, Brown & Company Limited, Printed in the United States of America.
Carhart, M. 1997. On Persistence in Mutual Fund Performance. Journal of Finance 52:57–82.
Chung, K., and S. Pruitt. 1994. A Simple Approximation of Tobin’s Q. Financial Management 23:70–74.
Coates, J. 2000. Takeover Defenses in the Shadow of the Pill: A Critique of the Scientific Evidence. Texas LawReview 79:271–382.
Cremers, M., and V. Nair. 2005. Governance Mechanisms and Equity Prices. Journal of Finance 60:2859–94.
Cremers, M., V. Nair, and K. John. 2008. Takeovers and the Cross-Section of Returns. Review of FinancialStudies. Advance Access published on April 2, 2008. 10.1093/rfs/hhn032.
Cremers, M., V. Nair, and U. Peyer. Forthcoming. Takeover Defenses and Competition. Journal of EmpiricalLegal Studies.
Cremers, M., V. Nair, and C. Wei. 2007. Governance Mechanisms and Bond Prices. Review of Financial Studies20:1359–88.
Daines, R. 2001. Does Delaware Law Improve Firm Value? Journal of Financial Economics 62:559–71.
Demsetz, H., and K. Lehn. 1985. The Structure of Corporate Ownership: Causes and Consequences. Journal ofPolitical Economy 93:1155–77.
Dittmar, A., and J. Mahrt-Smith. 2007. Corporate Governance and the Value of Cash Holdings. Journal ofFinancial Economics 83:599–634.
Faleye, O. 2007. Classified Boards, Firm Value, and Managerial Entrenchment. Journal of Financial Economics83:501–29.
Fama, E., and K. French. 1993. Common Risk Factors in the Returns on Bonds and Stocks. Journal of FinancialEconomics 33:3–53.
Fama, E., and K. French. 1997. Industry Costs of Equity. Journal of Financial Economics 93:153–94.
Garvey, G., and G. Hanka. 1999. Capital Structure and Corporate Control: The Effect of Antitakeover Statuteson Firm Leverage. Journal of Finance 54:519–46.
Georgeson Shareholder. 2003. Annual Corporate Governance Review. http://www.georgeson.com/usa/resources_research.php (accessed November 14, 2008).
Georgeson Shareholder. 2004. Annual Corporate Governance Review. http://www.georgeson.com/usa/resources_research.php (accessed November 14, 2008).
Gompers, P., J. Ishii, and A. Metrick. 2003. Corporate Governance and Equity Prices. Quarterly Journal ofEconomics 118:107–55.
Guo, R., T. Kruse, and T. Nohel. 2008. Undoing the Powerful Anti-Takeover Force of Staggered Boards. Journalof Corporate Finance 14:274–88.
Harford, J., S. Mansi, and W. Maxwell. 2008. Corporate Governance and Firm Cash Holdings. Journal ofFinancial Economics 87:535–55.
Investor Responsibility Research Center (IRRC) (1990, 1993, 1995, 1998, 2000, 2002). Corporate TakeoverDefenses. Washington: D.C.
John, K., and L. Litov. 2006. Corporate Governance and Financing Policy: New Evidence. Working Paper, OlinSchool of Business and Stern School.
44
What Matters in Corporate Governance?
Johnson, M., and R. Rao. 1997. The Impact of Antitakeover Amendments on Corporate Financial Performance.Financial Review 32:659–90.
Kadyrzhanova, D. 2006. Does Governance Pay, or Is Entrenchment the Way? Merger Gains and AntitakeoverProvisions. Working Paper, Columbia University.
Kaplan, S., and L. Zingales. 1997. Do Investment-Cash Flow Sensitivities Provide Useful Measures of FinancingConstraints? Quarterly Journal of Economics 112:169–216.
Klock, M., S. Mansi, and W. Maxwell. 2005. Does Corporate Governance Matter to Bondholders? Journal ofFinancial and Quantitative Analysis 40:693–719.
La Porta, R., F. Lopez-de-Silanes, A. Shleifer, and R. Vishny. 1998. Law and Finance. Journal of PoliticalEconomy 106:1113–55.
La Porta, R., F. Lopez-de-Silanes, A. Shleifer, and R. Vishny. 2002. Investor Protection and Corporate Valuation.Journal of Finance 57:1147–70.
Lambert, R., and D. Larker. 1985. Golden Parachutes, Executive Decision-Making and Shareholder Wealth.Journal of Accounting and Economics 7:179–203.
Lang, L., and R. Stulz. 1994. Tobin’s Q, Corporate Diversification, and Firm Performance. Journal of PoliticalEconomy 102:1248–80.
Lehn, K., S. Patro, and M. Zhao. 2006. Governance Indices and Valuation Multiples: Which Causes Which?Working Paper, University of Pittsburgh and Bentley College.
Manne, H. 1965. Mergers and the Market for Corporate Control. Journal of Political Economy 73:110–20.
Masulis, R.W., C. Wang, and F. Xie. 2007. Corporate Governance and Acquirer Returns. Journal of Finance62:1851–89.
McConnell, J., and H. Servaes. 1990. Additional Evidence on Equity Ownership and Corporate Value. Journalof Financial Economics 27:595–612.
Morck, R., A. Shleifer, and R. Vishny. 1988. Management Ownership and Market Valuation: An EmpiricalAnalysis. Journal of Financial Economics 20:293–315.
Perez-Gonzalez, F. 2006. Inherited Control and Firm Performance. American Economic Review 30:1559–88.
Ryngaert, M. 1988. The Effect of Poison Pill Securities on Shareholder Wealth. Journal of Financial Economics20:377–417.
Shin, H., and R. Stulz. 2000. Firm Value, Risk, and Growth Opportunities. Working Paper No. 7808, NBER.
Stein, J. 1988. Takeover Threats and Managerial Myopia. Journal of Political Economy 96:61–80.
Stulz, R. 1988. Managerial Control of Voting Rights. Journal of Financial Economics 20:25–54.
White, H. 1980. A Heteroskedasticity-Consistent Covariance Matrix Estimator and a Direct Test for Het-eroskedasticity. Econometrica 48:817–38.
Wilcox, J. 2002. Tow Cheers for Staggered Boards. Corporate Governance Advisor 10:1–5.
45