what is raman spectroscopy? - ocean optics · what is raman spectroscopy? ... probes can collect...
TRANSCRIPT


What is Raman Spectroscopy?Collecting Raman signal is like listening to the whisper of a molecule. One in every million incident laser photons scatters from the vibrational energy levels of the molecule, yielding information about the way it stretches and bends. Individually, the spectral lines detected speak to structure and composition, while collectively they can reveal identity.
Raman spectroscopy is being used to characterize materials for authentication, forensics, process and quality control, and is employed as a portable method of rapidly “fingerprinting” materials of interest for first responders - including explosives, narcotics and unknown chemicals.
Ocean Optics has been fueling the Raman revolution for 20 years, offering a diverse family of modular and turnkey systems. Designed for maximum perfor-mance in a compact, cost-effective footprint, our products let you take the power of Raman spectroscopy wherever you need to go.
Advantages of Raman Spectroscopy• No sample preparation needed• Compatible with aqueous samples, unlike FT-IR• Rapid identification of materials via matching to spectral libraries• Non-destructive sampling of liquids, solids, gels and surfaces• Non-invasive measurement through bags, vials and cuvettes
Researchand Science
BiotechnologyAuthentication andAnti-Counterfeit
Defense andSecurity
2
Contact OurSales Specialists
North and South AmericaSales Headquarters
+1 727-733-2447
European Sales Headquarters+31 26-3190500
France Sales Office+33 442-386 588
Germany Sales Office+49 711-341696-0
UK Sales Office+44 1865-811118
Asia Sales Information(All Countries)
+86 21-6295-6600
India, Middle East, Africa Sales Information
+31 26-3190500
Japan and South Korea+82 10-8514-3797
Australia/NZ Sales Information+61 8-8443-8668 (AU)+61 9-273-2080 (NZ)
For more information on how Raman spectroscopy works visit oceanoptics.com/raman
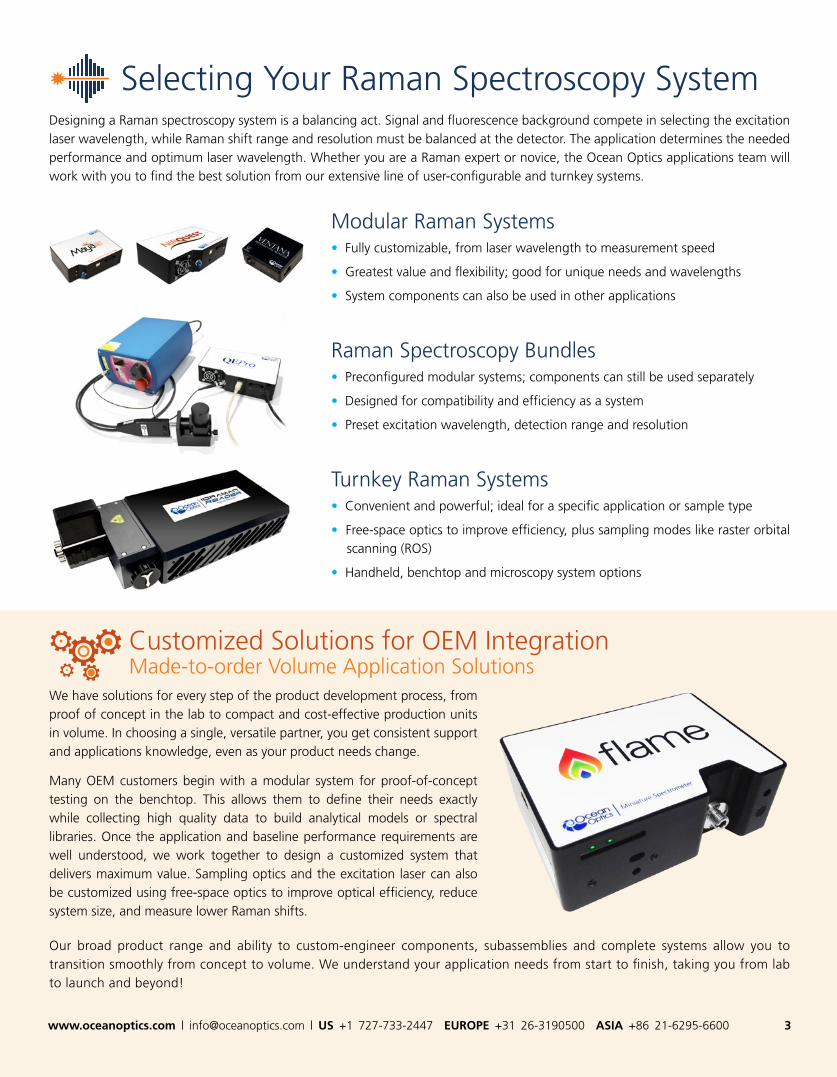
Selecting Your Raman Spectroscopy SystemDesigning a Raman spectroscopy system is a balancing act. Signal and fluorescence background compete in selecting the excitation laser wavelength, while Raman shift range and resolution must be balanced at the detector. The application determines the needed performance and optimum laser wavelength. Whether you are a Raman expert or novice, the Ocean Optics applications team will work with you to find the best solution from our extensive line of user-configurable and turnkey systems.
Modular Raman Systems• Fully customizable, from laser wavelength to measurement speed
• Greatest value and flexibility; good for unique needs and wavelengths
• System components can also be used in other applications
Raman Spectroscopy Bundles• Preconfigured modular systems; components can still be used separately
• Designed for compatibility and efficiency as a system
• Preset excitation wavelength, detection range and resolution
Turnkey Raman Systems• Convenient and powerful; ideal for a specific application or sample type
• Free-space optics to improve efficiency, plus sampling modes like raster orbital scanning (ROS)
• Handheld, benchtop and microscopy system options
www.oceanoptics.com | [email protected] | US +1 727-733-2447 EUROPE +31 26-3190500 ASIA +86 21-6295-6600 3
Customized Solutions for OEM IntegrationMade-to-order Volume Application Solutions
We have solutions for every step of the product development process, from proof of concept in the lab to compact and cost-effective production units in volume. In choosing a single, versatile partner, you get consistent support and applications knowledge, even as your product needs change.
Many OEM customers begin with a modular system for proof-of-concept testing on the benchtop. This allows them to define their needs exactly while collecting high quality data to build analytical models or spectral libraries. Once the application and baseline performance requirements are well understood, we work together to design a customized system that delivers maximum value. Sampling optics and the excitation laser can also be customized using free-space optics to improve optical efficiency, reduce system size, and measure lower Raman shifts.
Our broad product range and ability to custom-engineer components, subassemblies and complete systems allow you to transition smoothly from concept to volume. We understand your application needs from start to finish, taking you from lab to launch and beyond!
4
WA
RN
ING
Spectrometer
Laser
Computer
Raman Probe
Sample Chamber
WA
RN
ING
Modular Systems Flexible and configurable for unique needs
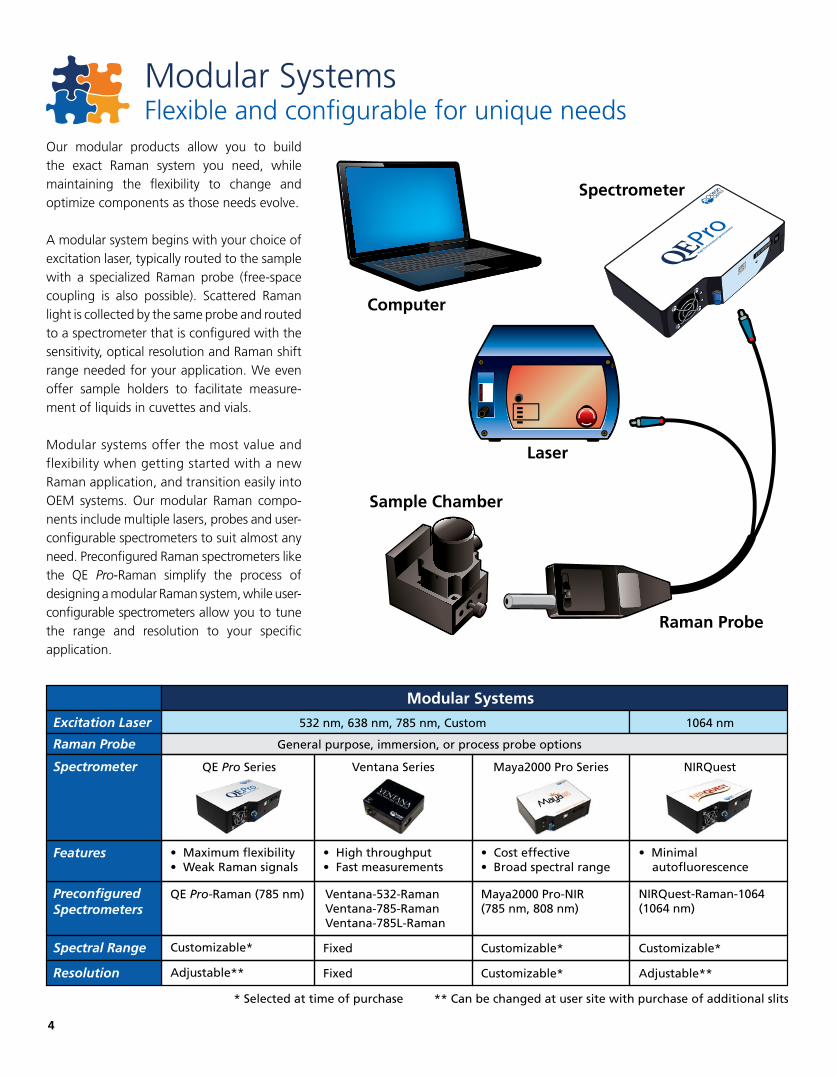
Our modular products allow you to build the exact Raman system you need, while maintaining the flexibility to change and optimize components as those needs evolve.
A modular system begins with your choice of excitation laser, typically routed to the sample with a specialized Raman probe (free-space coupling is also possible). Scattered Raman light is collected by the same probe and routed to a spectrometer that is configured with the sensitivity, optical resolution and Raman shift range needed for your application. We even offer sample holders to facilitate measure-ment of liquids in cuvettes and vials.
Modular systems offer the most value and flexibility when getting started with a new Raman application, and transition easily into OEM systems. Our modular Raman compo-nents include multiple lasers, probes and user- configurable spectrometers to suit almost any need. Preconfigured Raman spectrometers like the QE Pro-Raman simplify the process of designing a modular Raman system, while user- configurable spectrometers allow you to tune the range and resolution to your specific application.
Modular Systems
532 nm, 638 nm, 785 nm, Custom 1064 nm
General purpose, immersion, or process probe options
QE Pro Series Ventana Series
• Maximum flexibility• Weak Raman signals
Ventana-532-RamanVentana-785-RamanVentana-785L-Raman
Maya2000 Pro-NIR(785 nm, 808 nm)
QE Pro-Raman (785 nm)
Excitation Laser
Raman Probe
Spectrometer
Features
PreconfiguredSpectrometers
Customizable* Fixed
• High throughput• Fast measurements
Maya2000 Pro Series
Customizable*
• Cost effective• Broad spectral range
NIRQuest
Customizable*
NIRQuest-Raman-1064(1064 nm)
• Minimal autofluorescence
Spectral Range
Adjustable** Fixed Customizable* Adjustable**
* Selected at time of purchase ** Can be changed at user site with purchase of additional slits
Resolution
www.oceanoptics.com | [email protected] | US +1 727-733-2447 EUROPE +31 26-3190500 ASIA +86 21-6295-6600 5
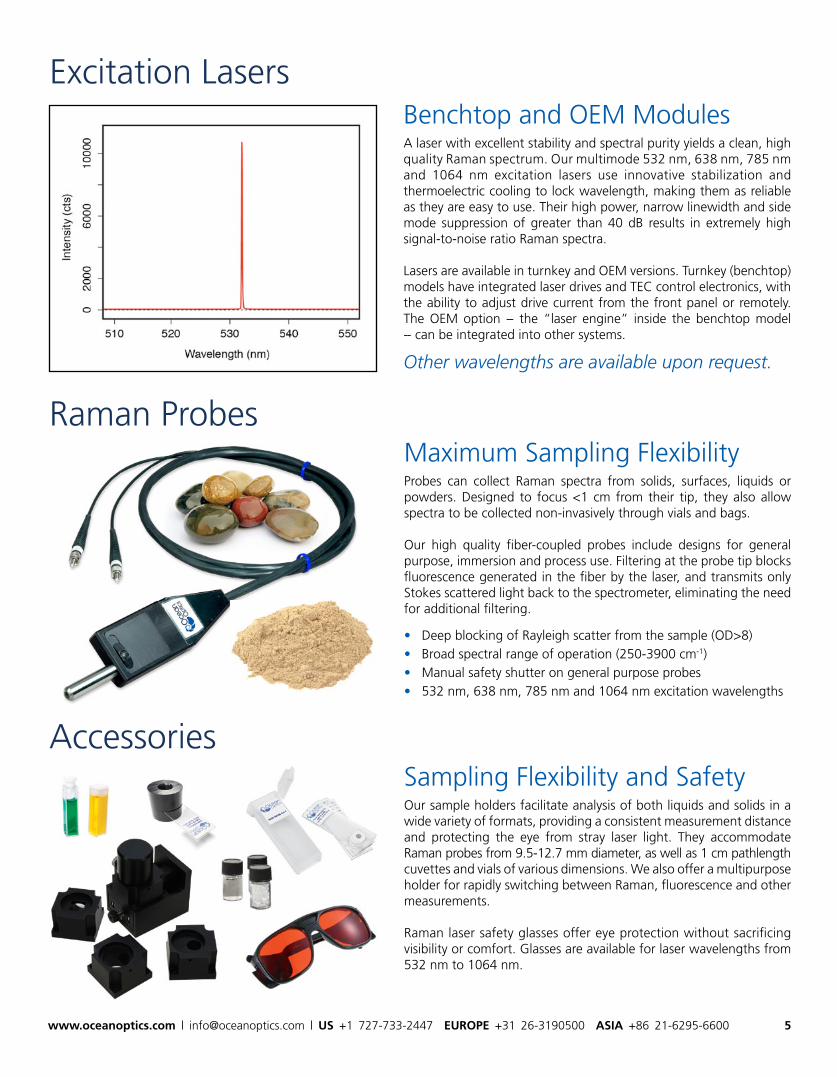
Maximum Sampling FlexibilityProbes can collect Raman spectra from solids, surfaces, liquids or powders. Designed to focus <1 cm from their tip, they also allow spectra to be collected non-invasively through vials and bags.
Our high quality fiber-coupled probes include designs for general purpose, immersion and process use. Filtering at the probe tip blocks fluorescence generated in the fiber by the laser, and transmits only Stokes scattered light back to the spectrometer, eliminating the need for additional filtering.
• Deep blocking of Rayleigh scatter from the sample (OD>8)• Broad spectral range of operation (250-3900 cm-1) • Manual safety shutter on general purpose probes• 532 nm, 638 nm, 785 nm and 1064 nm excitation wavelengths
Sampling Flexibility and SafetyOur sample holders facilitate analysis of both liquids and solids in a wide variety of formats, providing a consistent measurement distance and protecting the eye from stray laser light. They accommodate Raman probes from 9.5-12.7 mm diameter, as well as 1 cm pathlength cuvettes and vials of various dimensions. We also offer a multipurpose holder for rapidly switching between Raman, fluorescence and other measurements.
Raman laser safety glasses offer eye protection without sacrificing visibility or comfort. Glasses are available for laser wavelengths from 532 nm to 1064 nm.
Excitation Lasers
Raman Probes
Accessories
Benchtop and OEM ModulesA laser with excellent stability and spectral purity yields a clean, high quality Raman spectrum. Our multimode 532 nm, 638 nm, 785 nm and 1064 nm excitation lasers use innovative stabilization and thermoelectric cooling to lock wavelength, making them as reliable as they are easy to use. Their high power, narrow linewidth and side mode suppression of greater than 40 dB results in extremely high signal-to-noise ratio Raman spectra.
Lasers are available in turnkey and OEM versions. Turnkey (benchtop) models have integrated laser drives and TEC control electronics, with the ability to adjust drive current from the front panel or remotely. The OEM option -- the “laser engine” inside the benchtop model -- can be integrated into other systems.
Other wavelengths are available upon request.
6
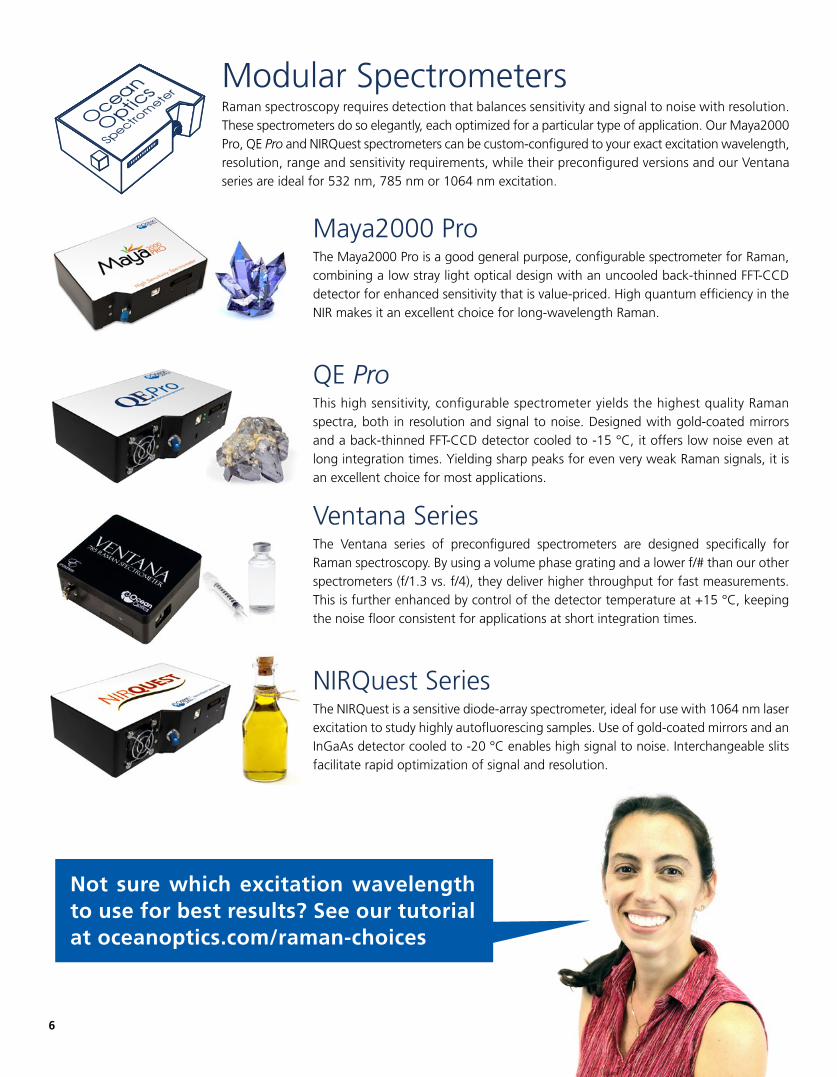
Modular SpectrometersRaman spectroscopy requires detection that balances sensitivity and signal to noise with resolution. These spectrometers do so elegantly, each optimized for a particular type of application. Our Maya2000 Pro, QE Pro and NIRQuest spectrometers can be custom-configured to your exact excitation wavelength, resolution, range and sensitivity requirements, while their preconfigured versions and our Ventana series are ideal for 532 nm, 785 nm or 1064 nm excitation.
Maya2000 ProThe Maya2000 Pro is a good general purpose, configurable spectrometer for Raman, combining a low stray light optical design with an uncooled back-thinned FFT-CCD detector for enhanced sensitivity that is value-priced. High quantum efficiency in the NIR makes it an excellent choice for long-wavelength Raman.
QE ProThis high sensitivity, configurable spectrometer yields the highest quality Raman spectra, both in resolution and signal to noise. Designed with gold-coated mirrors and a back-thinned FFT-CCD detector cooled to -15 °C, it offers low noise even at long integration times. Yielding sharp peaks for even very weak Raman signals, it is an excellent choice for most applications.
Ventana SeriesThe Ventana series of preconfigured spectrometers are designed specifically for Raman spectroscopy. By using a volume phase grating and a lower f/# than our other spectrometers (f/1.3 vs. f/4), they deliver higher throughput for fast measurements. This is further enhanced by control of the detector temperature at +15 °C, keeping the noise floor consistent for applications at short integration times.
NIRQuest SeriesThe NIRQuest is a sensitive diode-array spectrometer, ideal for use with 1064 nm laser excitation to study highly autofluorescing samples. Use of gold-coated mirrors and an InGaAs detector cooled to -20 °C enables high signal to noise. Interchangeable slits facilitate rapid optimization of signal and resolution.
Not sure which excitation wavelength to use for best results? See our tutorial at oceanoptics.com/raman-choices
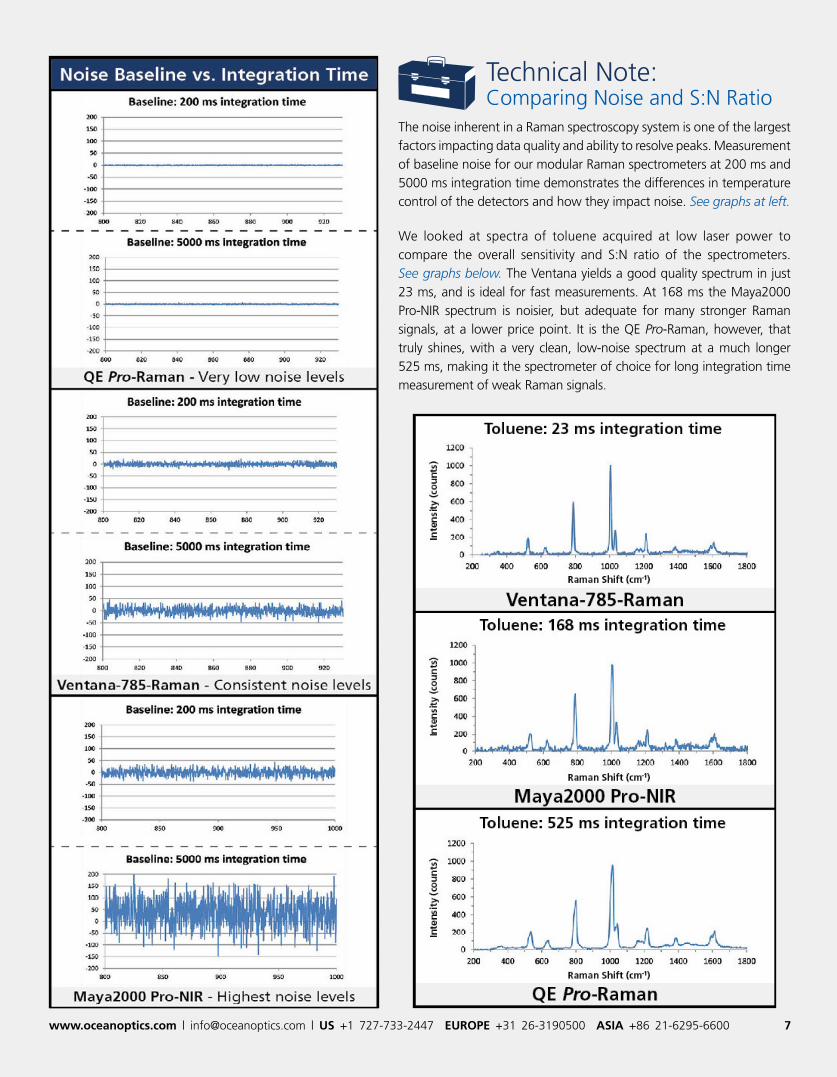
Technical Note:Comparing Noise and S:N Ratio
The noise inherent in a Raman spectroscopy system is one of the largest factors impacting data quality and ability to resolve peaks. Measurement of baseline noise for our modular Raman spectrometers at 200 ms and 5000 ms integration time demonstrates the differences in temperature control of the detectors and how they impact noise. See graphs at left.
We looked at spectra of toluene acquired at low laser power to compare the overall sensitivity and S:N ratio of the spectrometers. See graphs below. The Ventana yields a good quality spectrum in just 23 ms, and is ideal for fast measurements. At 168 ms the Maya2000 Pro-NIR spectrum is noisier, but adequate for many stronger Raman signals, at a lower price point. It is the QE Pro-Raman, however, that truly shines, with a very clean, low-noise spectrum at a much longer 525 ms, making it the spectrometer of choice for long integration time measurement of weak Raman signals.
www.oceanoptics.com | [email protected] | US +1 727-733-2447 EUROPE +31 26-3190500 ASIA +86 21-6295-6600 7
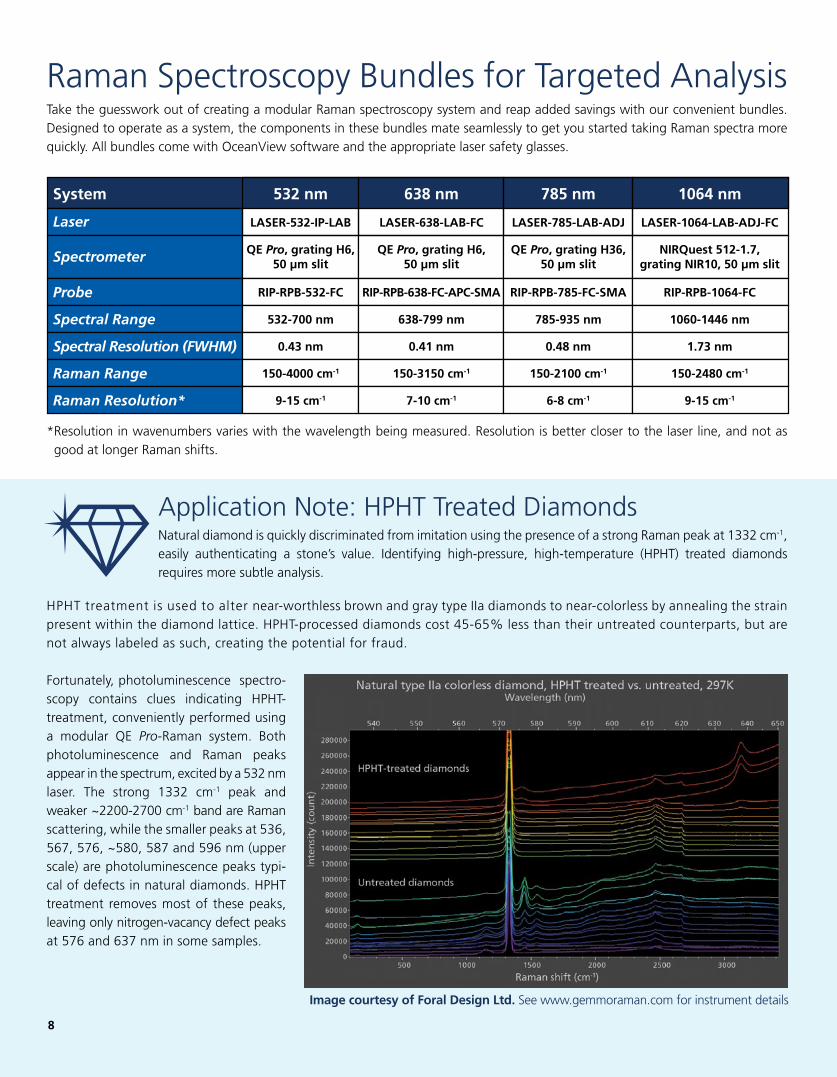
Raman Spectroscopy Bundles for Targeted AnalysisTake the guesswork out of creating a modular Raman spectroscopy system and reap added savings with our convenient bundles. Designed to operate as a system, the components in these bundles mate seamlessly to get you started taking Raman spectra more quickly. All bundles come with OceanView software and the appropriate laser safety glasses.
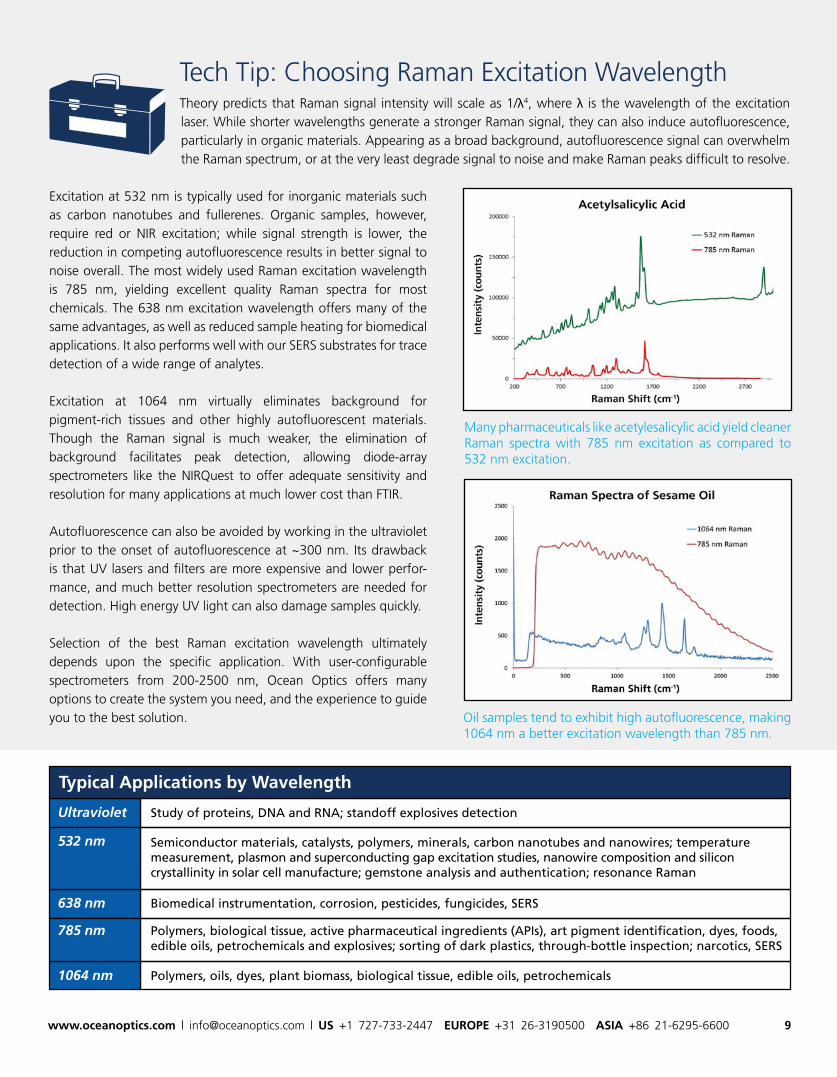
Application Note: HPHT Treated DiamondsNatural diamond is quickly discriminated from imitation using the presence of a strong Raman peak at 1332 cm-1, easily authenticating a stone’s value. Identifying high-pressure, high-temperature (HPHT) treated diamonds requires more subtle analysis.
*Resolution in wavenumbers varies with the wavelength being measured. Resolution is better closer to the laser line, and not as good at longer Raman shifts.
Image courtesy of Foral Design Ltd. See www.gemmoraman.com for instrument details
System 532 nm
Laser
Spectrometer
LASER-532-IP-LAB
QE Pro, grating H6,50 µm slit
Probe RIP-RPB-532-FC
Spectral Range 532-700 nm
Spectral Resolution (FWHM) 0.43 nm
Raman Range 150-4000 cm-1
Raman Resolution* 9-15 cm-1
638 nm
LASER-638-LAB-FC
QE Pro, grating H6,50 µm slit
RIP-RPB-638-FC-APC-SMA
638-799 nm
0.41 nm
150-3150 cm-1
7-10 cm-1
785 nm
LASER-785-LAB-ADJ
QE Pro, grating H36,50 µm slit
RIP-RPB-785-FC-SMA
785-935 nm
0.48 nm
150-2100 cm-1
6-8 cm-1
1064 nm
LASER-1064-LAB-ADJ-FC
NIRQuest 512-1.7,grating NIR10, 50 µm slit
RIP-RPB-1064-FC
1060-1446 nm
1.73 nm
150-2480 cm-1
9-15 cm-1
8
HPHT treatment is used to alter near-worthless brown and gray type IIa diamonds to near-colorless by annealing the strain present within the diamond lattice. HPHT-processed diamonds cost 45-65% less than their untreated counterparts, but are not always labeled as such, creating the potential for fraud.
Fortunately, photoluminescence spectro- scopy contains clues indicating HPHT- treatment, conveniently performed using a modular QE Pro-Raman system. Both photoluminescence and Raman peaks appear in the spectrum, excited by a 532 nm laser. The strong 1332 cm-1 peak and weaker ~2200-2700 cm-1 band are Raman scattering, while the smaller peaks at 536, 567, 576, ~580, 587 and 596 nm (upper scale) are photoluminescence peaks typi-cal of defects in natural diamonds. HPHT treatment removes most of these peaks, leaving only nitrogen-vacancy defect peaks at 576 and 637 nm in some samples.
Tech Tip: Choosing Raman Excitation WavelengthTheory predicts that Raman signal intensity will scale as 1/λ4, where λ is the wavelength of the excitation laser. While shorter wavelengths generate a stronger Raman signal, they can also induce autofluorescence, particularly in organic materials. Appearing as a broad background, autofluorescence signal can overwhelm the Raman spectrum, or at the very least degrade signal to noise and make Raman peaks difficult to resolve.
Excitation at 532 nm is typically used for inorganic materials such as carbon nanotubes and fullerenes. Organic samples, however, require red or NIR excitation; while signal strength is lower, the reduction in competing autofluorescence results in better signal to noise overall. The most widely used Raman excitation wavelength is 785 nm, yielding excellent quality Raman spectra for most chemicals. The 638 nm excitation wavelength offers many of the same advantages, as well as reduced sample heating for biomedical applications. It also performs well with our SERS substrates for trace detection of a wide range of analytes.
Excitation at 1064 nm virtually eliminates background for pigment-rich tissues and other highly autofluorescent materials. Though the Raman signal is much weaker, the elimination of background facilitates peak detection, allowing diode-array spectrometers like the NIRQuest to offer adequate sensitivity and resolution for many applications at much lower cost than FTIR.
Autofluorescence can also be avoided by working in the ultraviolet prior to the onset of autofluorescence at ~300 nm. Its drawback is that UV lasers and filters are more expensive and lower perfor-mance, and much better resolution spectrometers are needed for detection. High energy UV light can also damage samples quickly.
Selection of the best Raman excitation wavelength ultimately depends upon the specific application. With user-configurable spectrometers from 200-2500 nm, Ocean Optics offers many options to create the system you need, and the experience to guide you to the best solution.
www.oceanoptics.com | [email protected] | US +1 727-733-2447 EUROPE +31 26-3190500 ASIA +86 21-6295-6600 9
Many pharmaceuticals like acetylesalicylic acid yield cleaner Raman spectra with 785 nm excitation as compared to 532 nm excitation.
Oil samples tend to exhibit high autofluorescence, making 1064 nm a better excitation wavelength than 785 nm.
Polymers, oils, dyes, plant biomass, biological tissue, edible oils, petrochemicals1064 nm
Biomedical instrumentation, corrosion, pesticides, fungicides, SERS638 nm
Study of proteins, DNA and RNA; standoff explosives detectionUltraviolet
Semiconductor materials, catalysts, polymers, minerals, carbon nanotubes and nanowires; temperaturemeasurement, plasmon and superconducting gap excitation studies, nanowire composition and siliconcrystallinity in solar cell manufacture; gemstone analysis and authentication; resonance Raman
532 nm
Polymers, biological tissue, active pharmaceutical ingredients (APIs), art pigment identification, dyes, foods,edible oils, petrochemicals and explosives; sorting of dark plastics, through-bottle inspection; narcotics, SERS
785 nm
Typical Applications by Wavelength
10
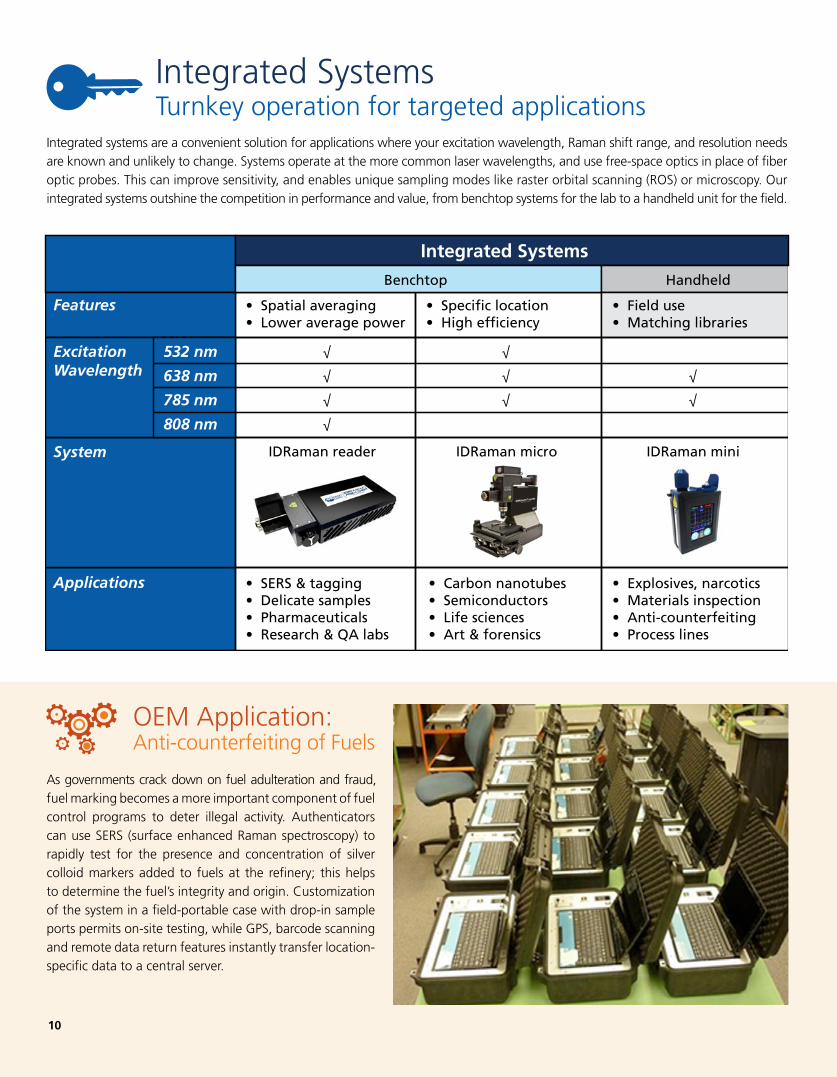
Integrated Systems Turnkey operation for targeted applications
Integrated systems are a convenient solution for applications where your excitation wavelength, Raman shift range, and resolution needs are known and unlikely to change. Systems operate at the more common laser wavelengths, and use free-space optics in place of fiber optic probes. This can improve sensitivity, and enables unique sampling modes like raster orbital scanning (ROS) or microscopy. Our integrated systems outshine the competition in performance and value, from benchtop systems for the lab to a handheld unit for the field.
Integrated Systems
Benchtop Handheld
√ √
√ √
√ √
√
√
√
IDRaman reader
• Spatial averaging• Lower average power
• Specific location• High efficiency
• Field use• Matching libraries
• Carbon nanotubes• Semiconductors• Life sciences• Art & forensics
• Explosives, narcotics• Materials inspection• Anti-counterfeiting• Process lines
• SERS & tagging• Delicate samples• Pharmaceuticals• Research & QA labs
Features
ExcitationWavelength
532 nm
638 nm
785 nm
808 nm
System
Applications
IDRaman micro IDRaman mini
OEM Application:Anti-counterfeiting of Fuels
As governments crack down on fuel adulteration and fraud, fuel marking becomes a more important component of fuel control programs to deter illegal activity. Authenticators can use SERS (surface enhanced Raman spectroscopy) to rapidly test for the presence and concentration of silver colloid markers added to fuels at the refinery; this helps to determine the fuel’s integrity and origin. Customization of the system in a field-portable case with drop-in sample ports permits on-site testing, while GPS, barcode scanning and remote data return features instantly transfer location- specific data to a central server.
www.oceanoptics.com | [email protected] | US +1 727-733-2447 EUROPE +31 26-3190500 ASIA +86 21-6295-6600 11
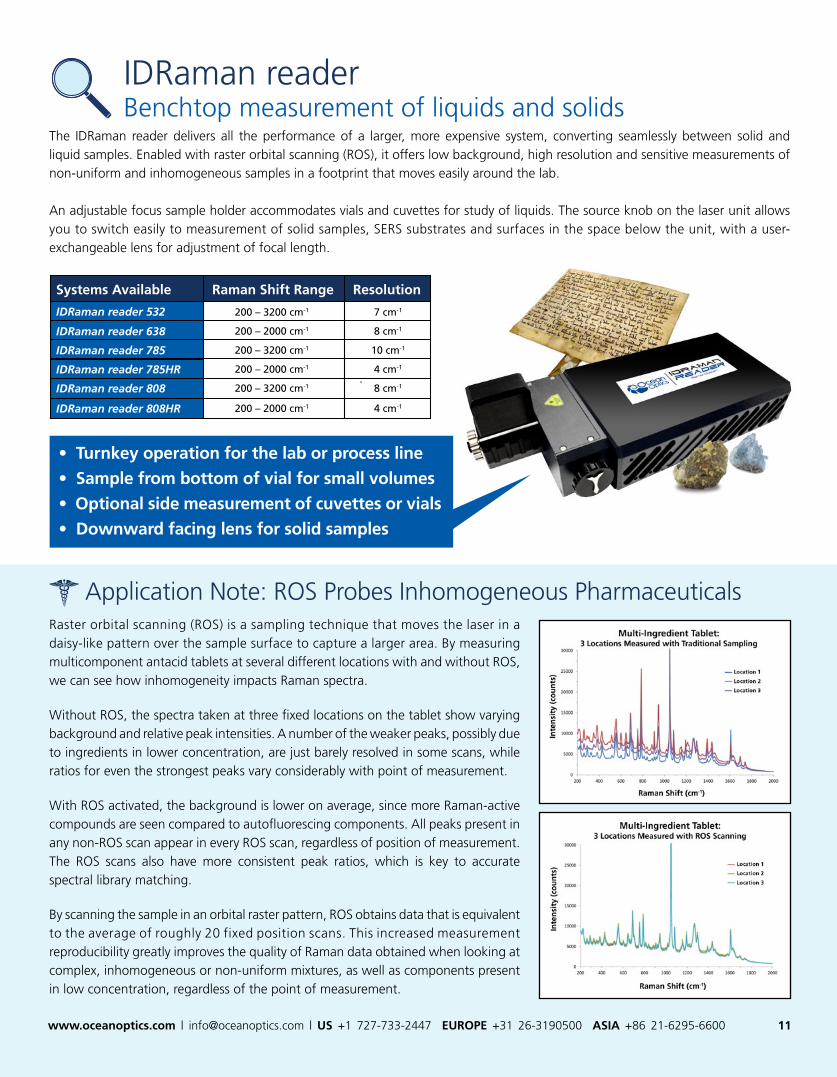
IDRaman readerBenchtop measurement of liquids and solids
The IDRaman reader delivers all the performance of a larger, more expensive system, converting seamlessly between solid and liquid samples. Enabled with raster orbital scanning (ROS), it offers low background, high resolution and sensitive measurements of non-uniform and inhomogeneous samples in a footprint that moves easily around the lab. An adjustable focus sample holder accommodates vials and cuvettes for study of liquids. The source knob on the laser unit allows you to switch easily to measurement of solid samples, SERS substrates and surfaces in the space below the unit, with a user- exchangeable lens for adjustment of focal length.
• Turnkey operation for the lab or process line
• Sample from bottom of vial for small volumes
• Optional side measurement of cuvettes or vials
• Downward facing lens for solid samples
Application Note: ROS Probes Inhomogeneous PharmaceuticalsRaster orbital scanning (ROS) is a sampling technique that moves the laser in a daisy-like pattern over the sample surface to capture a larger area. By measuring multicomponent antacid tablets at several different locations with and without ROS, we can see how inhomogeneity impacts Raman spectra. Without ROS, the spectra taken at three fixed locations on the tablet show varying background and relative peak intensities. A number of the weaker peaks, possibly due to ingredients in lower concentration, are just barely resolved in some scans, while ratios for even the strongest peaks vary considerably with point of measurement.
With ROS activated, the background is lower on average, since more Raman-active compounds are seen compared to autofluorescing components. All peaks present in any non-ROS scan appear in every ROS scan, regardless of position of measurement. The ROS scans also have more consistent peak ratios, which is key to accurate spectral library matching.
By scanning the sample in an orbital raster pattern, ROS obtains data that is equivalent to the average of roughly 20 fixed position scans. This increased measurement reproducibility greatly improves the quality of Raman data obtained when looking at complex, inhomogeneous or non-uniform mixtures, as well as components present in low concentration, regardless of the point of measurement.
Systems Available ResolutionRaman Shift Range
IDRaman reader 532
IDRaman reader 638
7 cm-1200 – 3200 cm-1
8 cm-1200 – 2000 cm-1
IDRaman reader 785 10 cm-1200 – 3200 cm-1
IDRaman reader 785HR 4 cm-1200 – 2000 cm-1
IDRaman reader 808 8 cm-1200 – 3200 cm-1
IDRaman reader 808HR 4 cm-1200 – 2000 cm-1
12
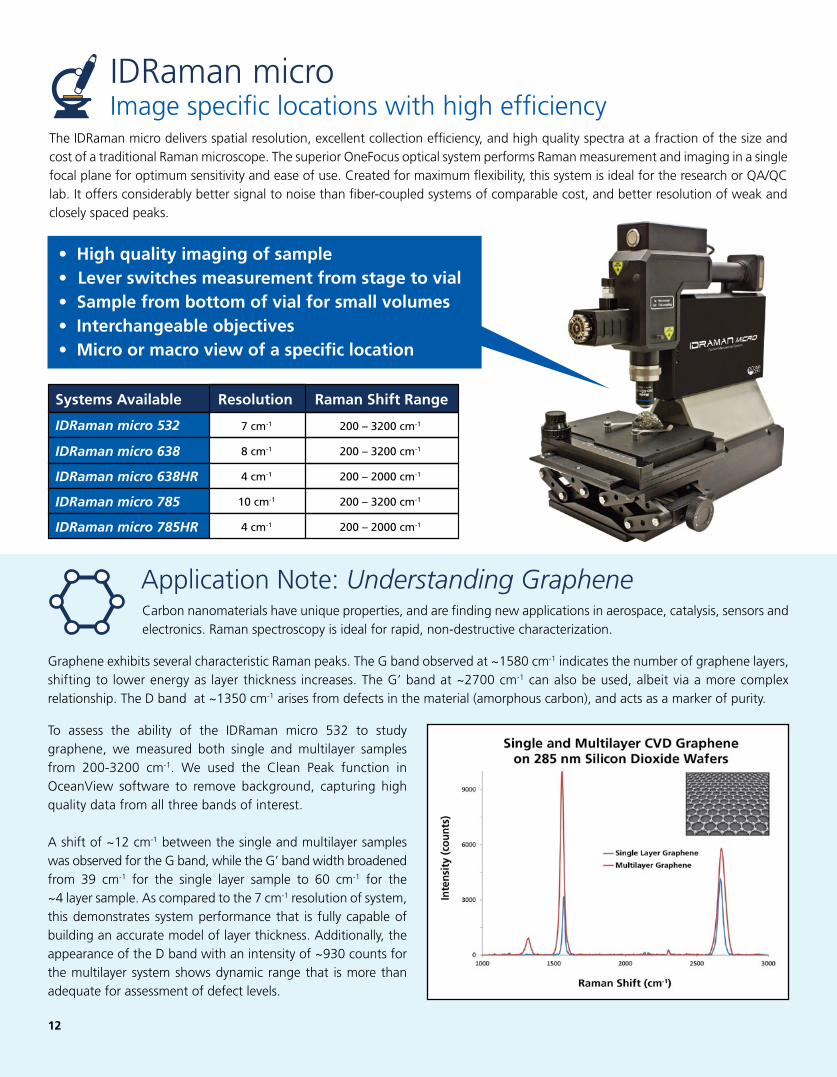
The IDRaman micro delivers spatial resolution, excellent collection efficiency, and high quality spectra at a fraction of the size and cost of a traditional Raman microscope. The superior OneFocus optical system performs Raman measurement and imaging in a single focal plane for optimum sensitivity and ease of use. Created for maximum flexibility, this system is ideal for the research or QA/QC lab. It offers considerably better signal to noise than fiber-coupled systems of comparable cost, and better resolution of weak and closely spaced peaks.
• High quality imaging of sample• Lever switches measurement from stage to vial• Sample from bottom of vial for small volumes• Interchangeable objectives• Micro or macro view of a specific location
IDRaman microImage specific locations with high efficiency
Application Note: Understanding GrapheneCarbon nanomaterials have unique properties, and are finding new applications in aerospace, catalysis, sensors and electronics. Raman spectroscopy is ideal for rapid, non-destructive characterization.
Graphene exhibits several characteristic Raman peaks. The G band observed at ~1580 cm-1 indicates the number of graphene layers, shifting to lower energy as layer thickness increases. The G’ band at ~2700 cm-1 can also be used, albeit via a more complex relationship. The D band at ~1350 cm-1 arises from defects in the material (amorphous carbon), and acts as a marker of purity.
To assess the ability of the IDRaman micro 532 to study graphene, we measured both single and multilayer samples from 200-3200 cm-1. We used the Clean Peak function in OceanView software to remove background, capturing high quality data from all three bands of interest.
A shift of ~12 cm-1 between the single and multilayer samples was observed for the G band, while the G’ band width broadened from 39 cm-1 for the single layer sample to 60 cm-1 for the ~4 layer sample. As compared to the 7 cm-1 resolution of system, this demonstrates system performance that is fully capable of building an accurate model of layer thickness. Additionally, the appearance of the D band with an intensity of ~930 counts for the multilayer system shows dynamic range that is more than adequate for assessment of defect levels.
Systems Available Resolution Raman Shift Range
IDRaman micro 532
IDRaman micro 638
7 cm-1 200 – 3200 cm-1
8 cm-1 200 – 3200 cm-1
IDRaman micro 638HR 4 cm-1 200 – 2000 cm-1
IDRaman micro 785 10 cm-1 200 – 3200 cm-1
IDRaman micro 785HR 4 cm-1 200 – 2000 cm-1
www.oceanoptics.com | [email protected] | US +1 727-733-2447 EUROPE +31 26-3190500 ASIA +86 21-6295-6600 13
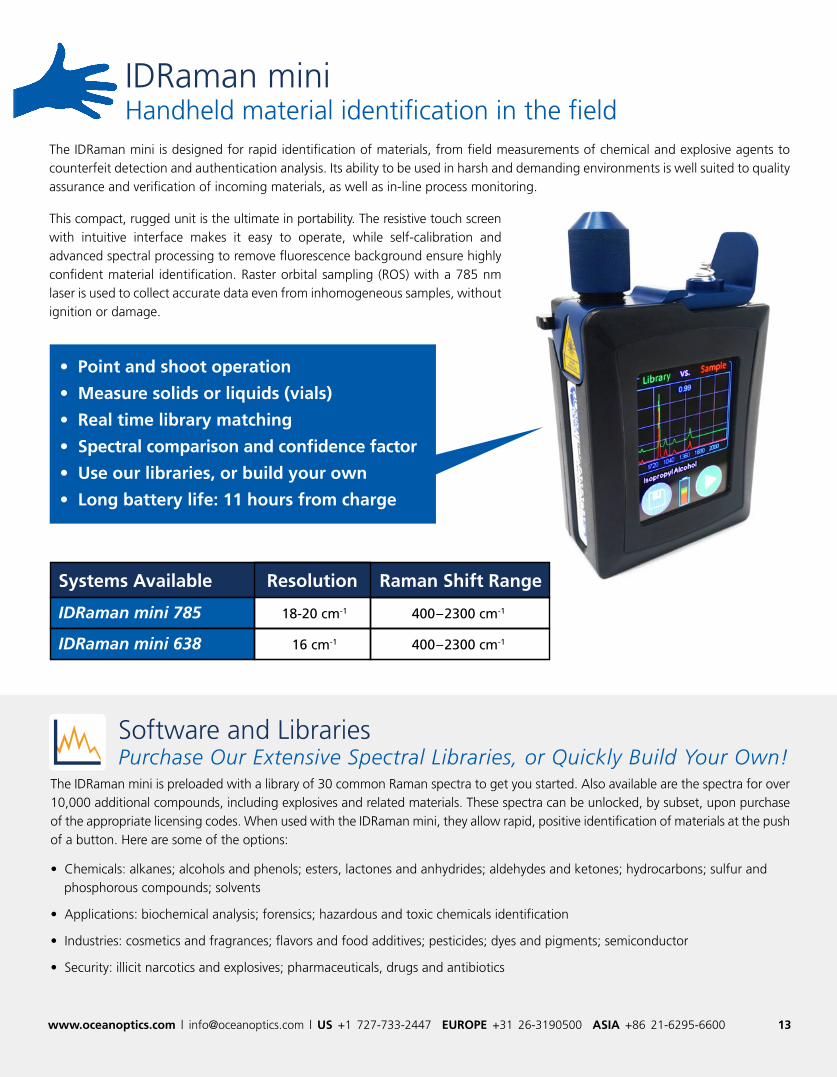
IDRaman miniHandheld material identification in the field
The IDRaman mini is designed for rapid identification of materials, from field measurements of chemical and explosive agents to counterfeit detection and authentication analysis. Its ability to be used in harsh and demanding environments is well suited to quality assurance and verification of incoming materials, as well as in-line process monitoring.
This compact, rugged unit is the ultimate in portability. The resistive touch screen with intuitive interface makes it easy to operate, while self-calibration and advanced spectral processing to remove fluorescence background ensure highly confident material identification. Raster orbital sampling (ROS) with a 785 nm laser is used to collect accurate data even from inhomogeneous samples, without ignition or damage.
Software and LibrariesPurchase Our Extensive Spectral Libraries, or Quickly Build Your Own!
The IDRaman mini is preloaded with a library of 30 common Raman spectra to get you started. Also available are the spectra for over 10,000 additional compounds, including explosives and related materials. These spectra can be unlocked, by subset, upon purchase of the appropriate licensing codes. When used with the IDRaman mini, they allow rapid, positive identification of materials at the push of a button. Here are some of the options:
• Chemicals: alkanes; alcohols and phenols; esters, lactones and anhydrides; aldehydes and ketones; hydrocarbons; sulfur and phosphorous compounds; solvents
• Applications: biochemical analysis; forensics; hazardous and toxic chemicals identification
• Industries: cosmetics and fragrances; flavors and food additives; pesticides; dyes and pigments; semiconductor
• Security: illicit narcotics and explosives; pharmaceuticals, drugs and antibiotics
Systems Available Raman Shift RangeResolution
IDRaman mini 785 400–2300 cm-118-20 cm-1
IDRaman mini 638 400–2300 cm-116 cm-1
• Point and shoot operation
• Measure solids or liquids (vials)
• Real time library matching
• Spectral comparison and confidence factor
• Use our libraries, or build your own
• Long battery life: 11 hours from charge
High-Performance SERS SubstratesIn Surface Enhanced Raman Spectroscopy (SERS), analytes are adsorbed on a three dimensional silver or gold surface prior to analysis, inducing a plasmon resonance effect that boosts the Raman signal intensity by millions of times. Our novel gold-silver nanosponge substrates are especially sensitive, making possible trace level detection of samples such as explosives and pesticides.
Trace Detection Made Affordable Most SERS substrates are fabricated using expensive lithography techniques and are not reusable, making cost a deterrent for mainstream applications. Ocean Optics’ substrates offer better performance than the competition at a fraction of the price, using two proprietary deposition techniques developed in-house. Our nano- particle substrates use inkjet printing to precisely deposit special gold or silver nanoparticle ink on paper, while our nanosponge substrates are based on plasma- phase deposition of a gold-silver alloy onto a unique glass surface.
Dependable Peak RatiosOur SERS substrates offer the same high levels of enhanced sensitivity when used with any of our Raman systems and spectrometers. Though peak intensity varies from substrate to substrate, peak ratio repeatability is very good, typically 5% or less. This allows the substrates to be used both quantitatively and to determine presence versus absence of the analyte.
14
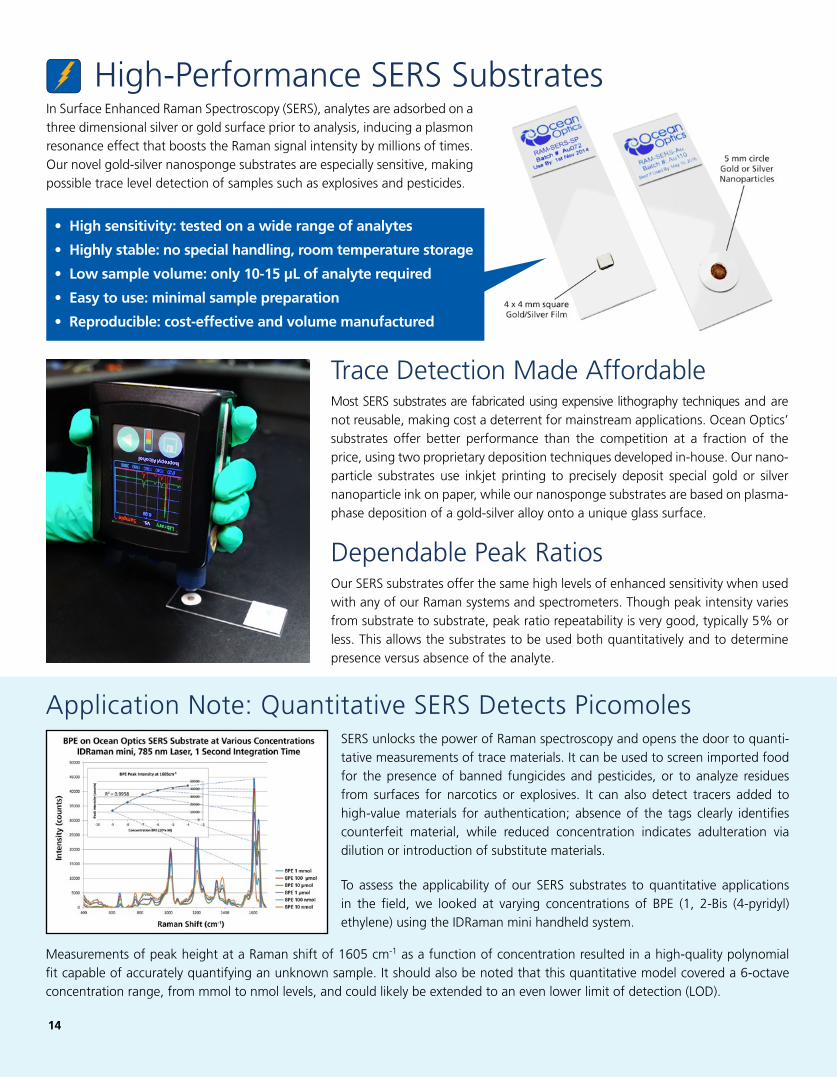
Application Note: Quantitative SERS Detects PicomolesSERS unlocks the power of Raman spectroscopy and opens the door to quanti-tative measurements of trace materials. It can be used to screen imported food for the presence of banned fungicides and pesticides, or to analyze residues from surfaces for narcotics or explosives. It can also detect tracers added to high-value materials for authentication; absence of the tags clearly identifies counterfeit material, while reduced concentration indicates adulteration via dilution or introduction of substitute materials.
To assess the applicability of our SERS substrates to quantitative applications in the field, we looked at varying concentrations of BPE (1, 2-Bis (4-pyridyl)ethylene) using the IDRaman mini handheld system.
Measurements of peak height at a Raman shift of 1605 cm-1 as a function of concentration resulted in a high-quality polynomial fit capable of accurately quantifying an unknown sample. It should also be noted that this quantitative model covered a 6-octave concentration range, from mmol to nmol levels, and could likely be extended to an even lower limit of detection (LOD).
• High sensitivity: tested on a wide range of analytes
• Highly stable: no special handling, room temperature storage
• Low sample volume: only 10-15 µL of analyte required
• Easy to use: minimal sample preparation
• Reproducible: cost-effective and volume manufactured
www.oceanoptics.com | [email protected] | US +1 727-733-2447 EUROPE +31 26-3190500 ASIA +86 21-6295-6600 15
Frequency
ROS
> Spot
< Spot
ROS
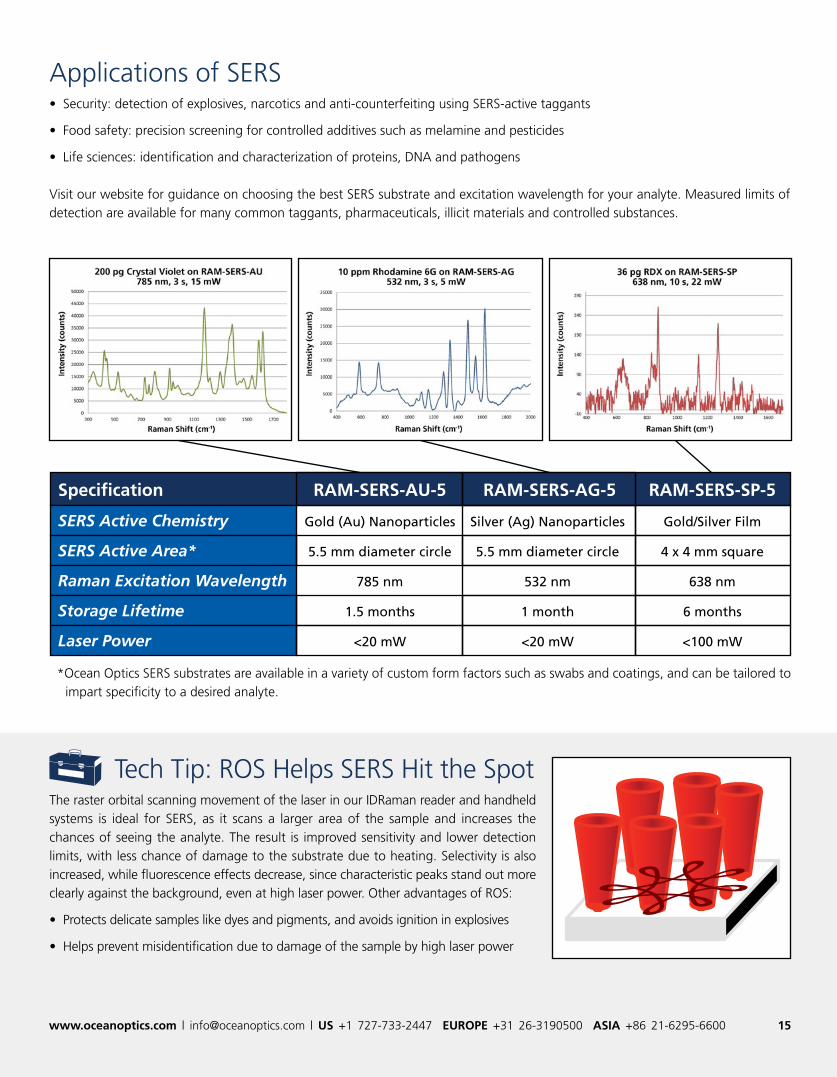
Tech Tip: ROS Helps SERS Hit the SpotThe raster orbital scanning movement of the laser in our IDRaman reader and handheld systems is ideal for SERS, as it scans a larger area of the sample and increases the chances of seeing the analyte. The result is improved sensitivity and lower detection limits, with less chance of damage to the substrate due to heating. Selectivity is also increased, while fluorescence effects decrease, since characteristic peaks stand out more clearly against the background, even at high laser power. Other advantages of ROS:
• Protects delicate samples like dyes and pigments, and avoids ignition in explosives
• Helps prevent misidentification due to damage of the sample by high laser power
Applications of SERS • Security: detection of explosives, narcotics and anti-counterfeiting using SERS-active taggants
• Food safety: precision screening for controlled additives such as melamine and pesticides
• Life sciences: identification and characterization of proteins, DNA and pathogens
Visit our website for guidance on choosing the best SERS substrate and excitation wavelength for your analyte. Measured limits of detection are available for many common taggants, pharmaceuticals, illicit materials and controlled substances.
Specification RAM-SERS-AG-5RAM-SERS-AU-5
SERS Active Chemistry Silver (Ag) NanoparticlesGold (Au) Nanoparticles
SERS Active Area* 5.5 mm diameter circle5.5 mm diameter circle
Raman Excitation Wavelength 532 nm785 nm
Storage Lifetime 1 month1.5 months
Laser Power <20 mW<20 mW
RAM-SERS-SP-5
Gold/Silver Film
4 x 4 mm square
638 nm
6 months
<100 mW
*Ocean Optics SERS substrates are available in a variety of custom form factors such as swabs and coatings, and can be tailored to impart specificity to a desired analyte.
Ocean Optics World HQ
830 Douglas Ave.Dunedin, FL 34698 USAPhone: +1 727 733 2447 Email: [email protected]
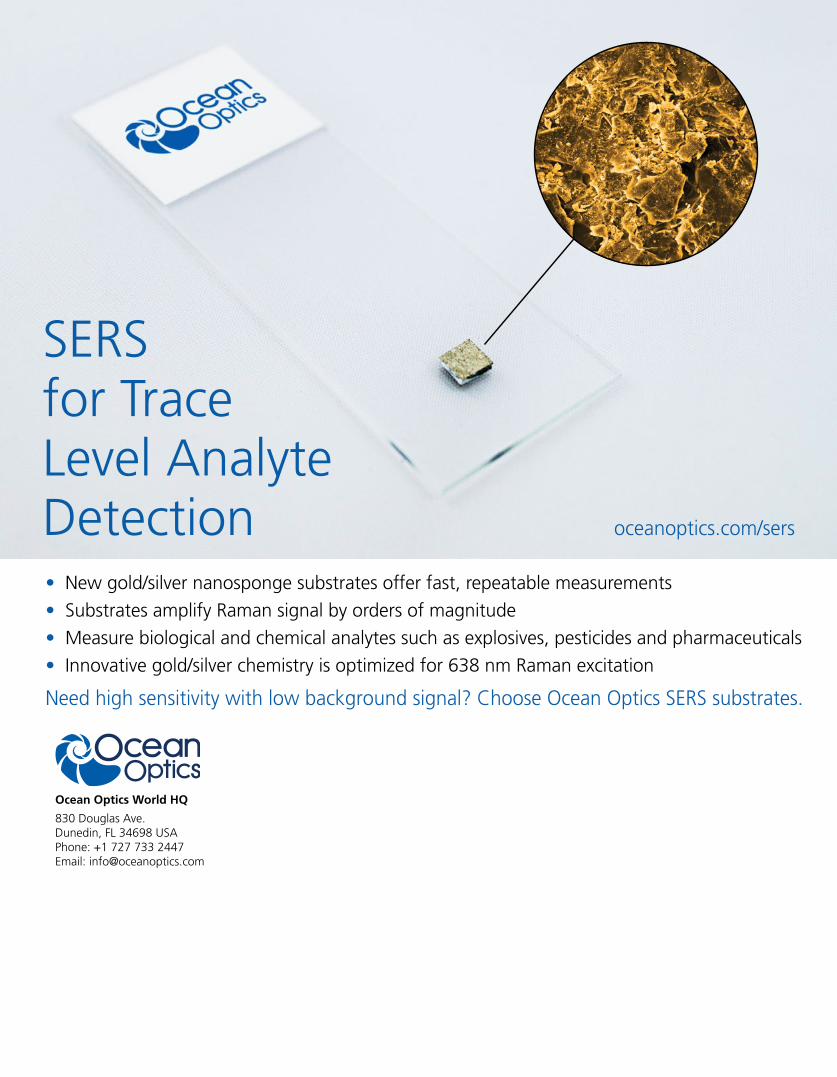
• New gold/silver nanosponge substrates offer fast, repeatable measurements
• Substrates amplify Raman signal by orders of magnitude
• Measure biological and chemical analytes such as explosives, pesticides and pharmaceuticals
• Innovative gold/silver chemistry is optimized for 638 nm Raman excitation
Need high sensitivity with low background signal? Choose Ocean Optics SERS substrates.
SERSfor TraceLevel AnalyteDetection oceanoptics.com/sers