what do patent-based measures tell us about product ... · what do patent-based measures tell us...
TRANSCRIPT
What do patent-based measures tell us about product commercialization?
Stefan Wagner & Simon Wakeman
PDSM 2013
12 November 2013
Bottom alignment of Source and
Notes
Top alignment of flags
(e.g. "example" etc.)
Frame (not to be filled)
Frame (not to be filled)
Frame (not to be filled)
Frame (not to be filled)
We find that relationship between patent-based measures and product development outcomes is more nuanced than suggested by prior literature
INTRODUCTION
− Patent-based measures are widely used by researchers in economics and management to characterize inventions and research capabilities more broadly
− Series of papers has established strong correlation between value of invention and # citations received (Trajtenberg, 1990; Harhoff et al., 1999; Gambardella, Harhoff & Verspagen, 2008)
− Increasingly used to proxy for outcomes beyond simple value with much less support
− Using data from the pharmaceutical industry, we examine relationship between patent-based measures and how fast and how far the underlying product proceeds through the product development process
− We find a nuanced relationship between the patent-based measures and the product development outcomes
1
Bottom alignment of Source and
Notes
Top alignment of flags
(e.g. "example" etc.)
Frame (not to be filled)
Frame (not to be filled)
Frame (not to be filled)
Frame (not to be filled)
Patent-based measures often used as a proxy for innovative output, but – other than citations for patent value – measures have not been validated
REVIEW OF PRIOR LITERATURE
− Early work employing patent data mainly used patent counts as a measure of innovation output (see Griliches, 1990)
− More recent work has constructed more refined indicators from information contained in patent documents
• Value of invention using # citations a focal patent receives (Trajtenberg 1990, Harhoff, Scherer & Vopel, 1999), patent renewals (Pakes & Schankerman, 1984; Pakes, 1986; Schankerman & Pakes, 1986; Lanjouw, Pakes & Putnam, 1998), patenting countries (Putnam, 1996), and opposition (Harhoff, Scherer & Vopel, 2003)
• Nature of inventions using distribution of technology classes (Henderson, Jaffe & Trajtenberg, 1998), patent vs. non-patent references (Trajtenberg, Henderson & Jaffe, 1997), non-patent references (Narin & Noma, 1985)
• Technological overlap (Jaffe, 1986; Mowery, Oxley & Silverman, 1996) and fragmentation of ownership (Ziedonis, 2004)
• Weaknesses in patents/portfolios using EPO’s “X” and “Y” classification of references (Michel & Bettels 2001; Webb et al. 2005; Grimpe & Hussinger, 2008; Czarnitzki, Hussinger & Leten, 2011; Guellec, Martinez & Zuniga, 2012) and existence of patent thickets (von Graevenitz, Wagner, and Harhoff, 2011)
− Research has established a clear correlation between value of an invention and # citations received (Trajtenberg, 1990; Harhoff et al., 1999; Gambardella, Harhoff & Verspagen, 2008)
− Other indicators either have not been validated or validation relies on outcomes internal to patent system
• e.g., relationship between X/Y references & patent grant (Harhoff & Wagner, 2009) and patent opposition (Harhoff & Reitzig, 2004)
2
Bottom alignment of Source and
Notes
Top alignment of flags
(e.g. "example" etc.)
Frame (not to be filled)
Frame (not to be filled)
Frame (not to be filled)
Frame (not to be filled)
Patent-based measures reflect patentability and technological value but not necessarily product development outcomes
RESEARCH QUESTION
− Patent-based measures may reflect patentability and/or technological value (e.g., novelty) but product development also depends on commercial “feasibility” and impact
− Although citations correlated with value, they only explain a small proportion (Gambardella, Harhoff & Verspagen, 2008)
− Correlation between patent counts and product introductions is weak, even in pharmaceutical industry (Graham & Higgins, 2007)
3
What do patent-based measures tell us about product development outcomes (beyond patentability and technological value)?
Bottom alignment of Source and
Notes
Top alignment of flags
(e.g. "example" etc.)
Frame (not to be filled)
Frame (not to be filled)
Frame (not to be filled)
Frame (not to be filled)
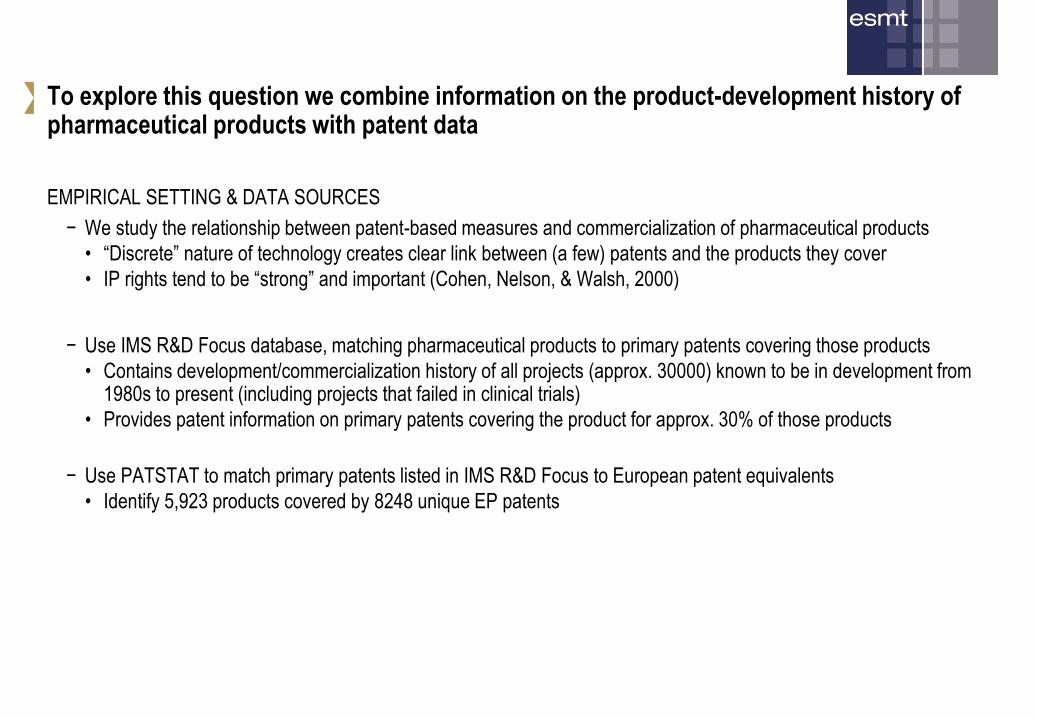
To explore this question we combine information on the product-development history of pharmaceutical products with patent data
EMPIRICAL SETTING & DATA SOURCES
− We study the relationship between patent-based measures and commercialization of pharmaceutical products
• “Discrete” nature of technology creates clear link between (a few) patents and the products they cover
• IP rights tend to be “strong” and important (Cohen, Nelson, & Walsh, 2000)
− Use IMS R&D Focus database, matching pharmaceutical products to primary patents covering those products
• Contains development/commercialization history of all projects (approx. 30000) known to be in development from 1980s to present (including projects that failed in clinical trials)
• Provides patent information on primary patents covering the product for approx. 30% of those products
− Use PATSTAT to match primary patents listed in IMS R&D Focus to European patent equivalents
• Identify 5,923 products covered by 8248 unique EP patents
Bottom alignment of Source and
Notes
Top alignment of flags
(e.g. "example" etc.)
Frame (not to be filled)
Frame (not to be filled)
Frame (not to be filled)
Frame (not to be filled)
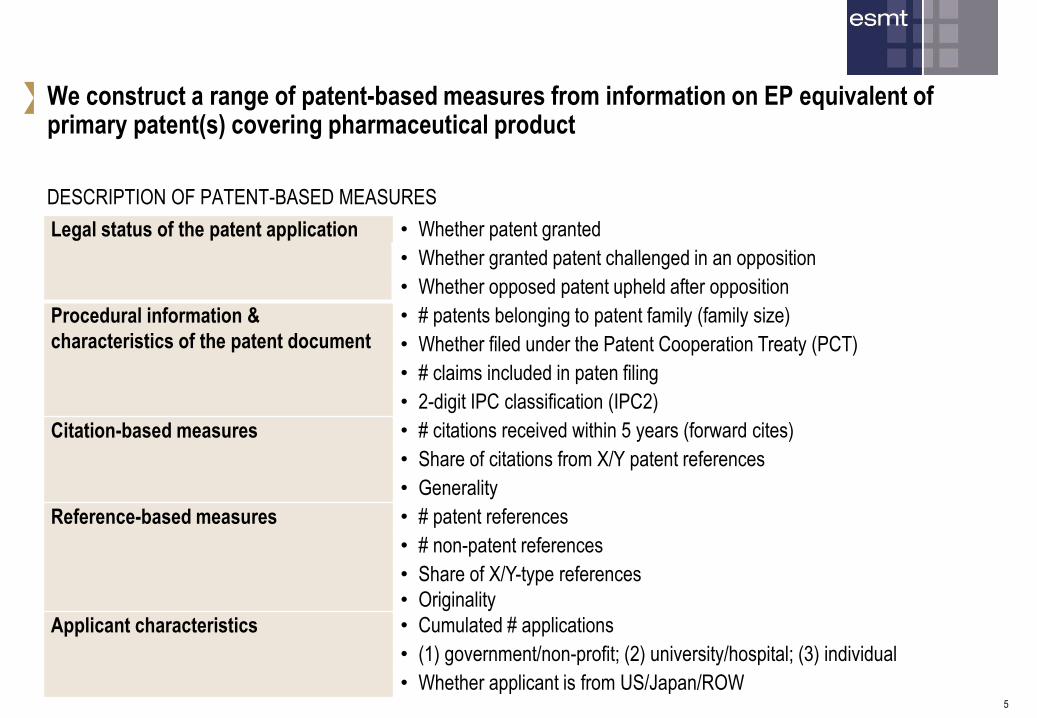
We construct a range of patent-based measures from information on EP equivalent of primary patent(s) covering pharmaceutical product
DESCRIPTION OF PATENT-BASED MEASURES
5
Legal status of the patent application • Whether patent granted
• Whether granted patent challenged in an opposition
• Whether opposed patent upheld after opposition
Procedural information &
characteristics of the patent document
• # patents belonging to patent family (family size)
• Whether filed under the Patent Cooperation Treaty (PCT)
• # claims included in paten filing
• 2-digit IPC classification (IPC2)
Citation-based measures • # citations received within 5 years (forward cites)
• Share of citations from X/Y patent references
• Generality
Reference-based measures • # patent references
• # non-patent references
• Share of X/Y-type references
• Originality
Applicant characteristics • Cumulated # applications
• (1) government/non-profit; (2) university/hospital; (3) individual
• Whether applicant is from US/Japan/ROW
Bottom alignment of Source and
Notes
Top alignment of flags
(e.g. "example" etc.)
Frame (not to be filled)
Frame (not to be filled)
Frame (not to be filled)
Frame (not to be filled)
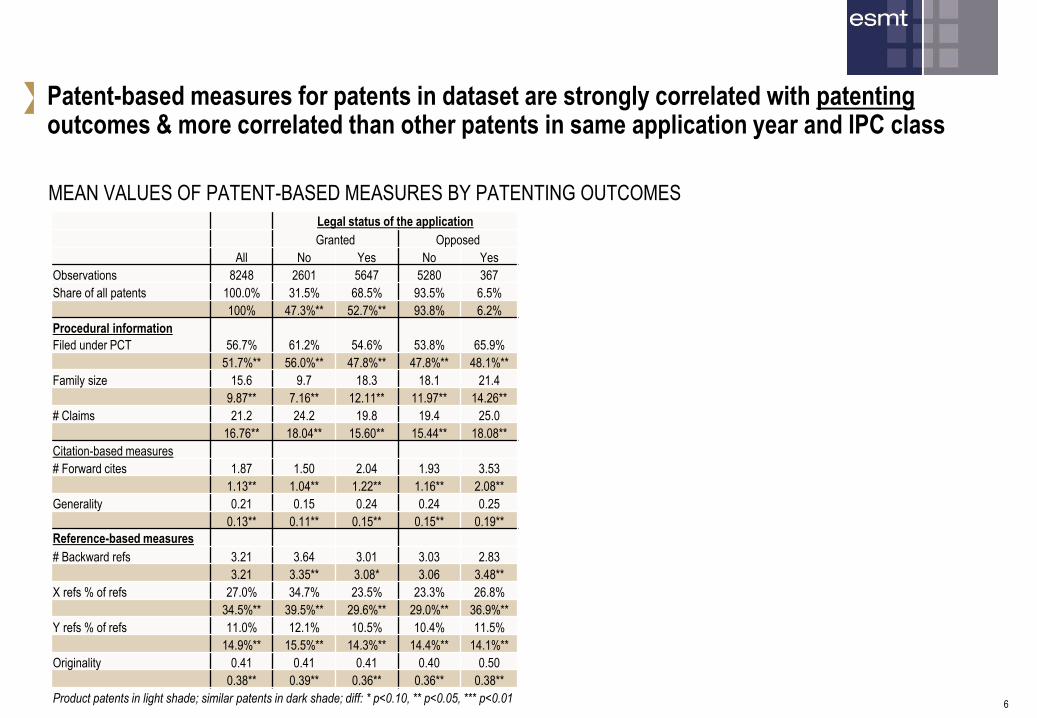
Patent-based measures for patents in dataset are strongly correlated with patenting outcomes & more correlated than other patents in same application year and IPC class
MEAN VALUES OF PATENT-BASED MEASURES BY PATENTING OUTCOMES
6
Legal status of the application
Granted Opposed
All No Yes No Yes
Observations 8248 2601 5647 5280 367
Share of all patents 100.0% 31.5% 68.5% 93.5% 6.5%
100% 47.3%** 52.7%** 93.8% 6.2%
Procedural information
Filed under PCT 56.7% 61.2% 54.6% 53.8% 65.9%
51.7%** 56.0%** 47.8%** 47.8%** 48.1%**
Family size 15.6 9.7 18.3 18.1 21.4
9.87** 7.16** 12.11** 11.97** 14.26**
# Claims 21.2 24.2 19.8 19.4 25.0
16.76** 18.04** 15.60** 15.44** 18.08**
Citation-based measures
# Forward cites 1.87 1.50 2.04 1.93 3.53
1.13** 1.04** 1.22** 1.16** 2.08**
Generality 0.21 0.15 0.24 0.24 0.25
0.13** 0.11** 0.15** 0.15** 0.19**
Reference-based measures
# Backward refs 3.21 3.64 3.01 3.03 2.83
3.21 3.35** 3.08* 3.06 3.48**
X refs % of refs 27.0% 34.7% 23.5% 23.3% 26.8%
34.5%** 39.5%** 29.6%** 29.0%** 36.9%**
Y refs % of refs 11.0% 12.1% 10.5% 10.4% 11.5%
14.9%** 15.5%** 14.3%** 14.4%** 14.1%**
Originality 0.41 0.41 0.41 0.40 0.50
0.38** 0.39** 0.36** 0.36** 0.38**
Product patents in light shade; similar patents in dark shade; diff: * p<0.10, ** p<0.05, *** p<0.01
Bottom alignment of Source and
Notes
Top alignment of flags
(e.g. "example" etc.)
Frame (not to be filled)
Frame (not to be filled)
Frame (not to be filled)
Frame (not to be filled)
patent
expiry
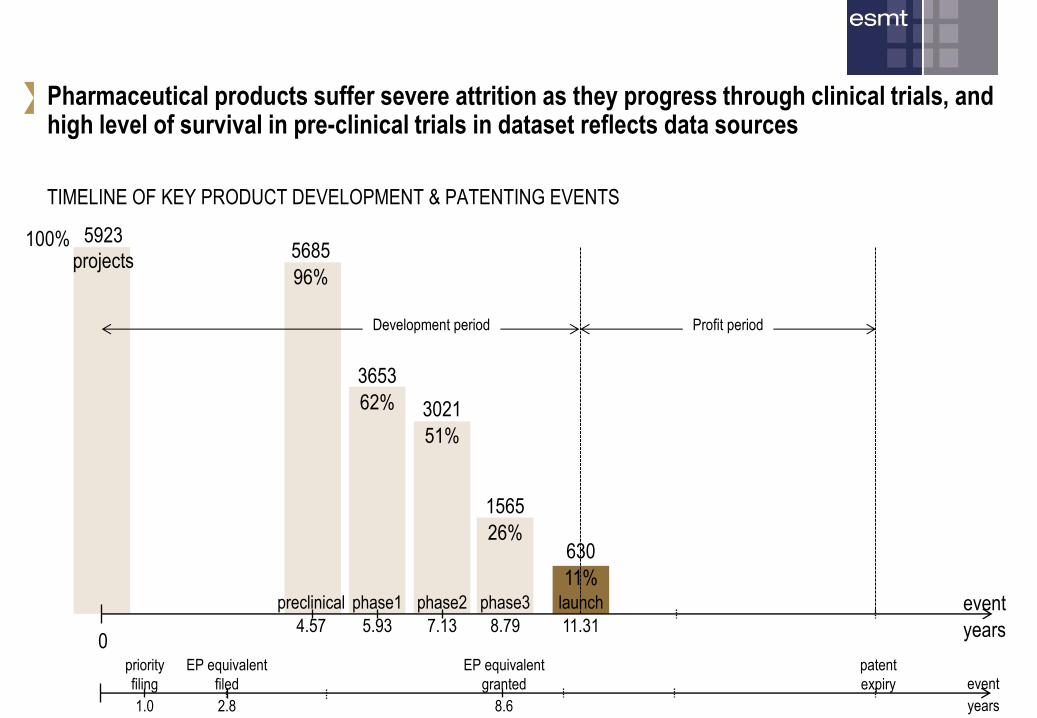
Pharmaceutical products suffer severe attrition as they progress through clinical trials, and high level of survival in pre-clinical trials in dataset reflects data sources
TIMELINE OF KEY PRODUCT DEVELOPMENT & PATENTING EVENTS
630
11% preclinical
4.57
phase1
5.93
phase3
8.79
phase2
7.13 event
years
launch
11.31 0
100% 5685
96%
3653
62% 3021
51%
1565
26%
5923
projects
Profit period Development period
priority
filing
1.0
event
years
EP equivalent
granted
8.6
EP equivalent
filed
2.8
Bottom alignment of Source and
Notes
Top alignment of flags
(e.g. "example" etc.)
Frame (not to be filled)
Frame (not to be filled)
Frame (not to be filled)
Frame (not to be filled)
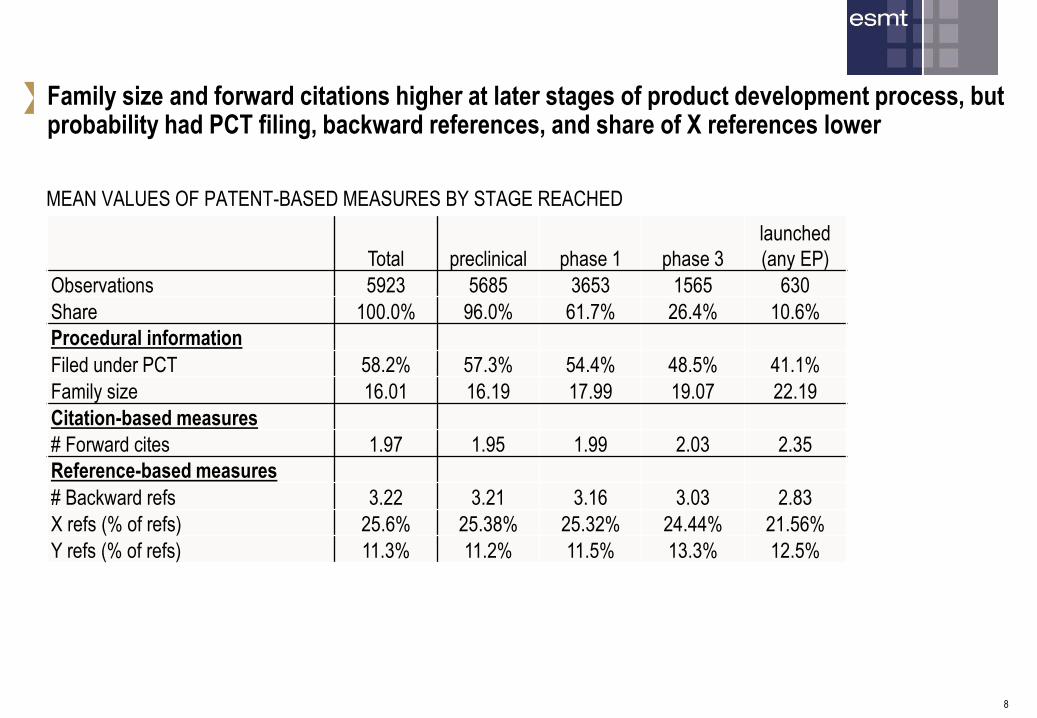
Family size and forward citations higher at later stages of product development process, but probability had PCT filing, backward references, and share of X references lower
Total preclinical phase 1 phase 3
launched
(any EP)
Observations 5923 5685 3653 1565 630
Share 100.0% 96.0% 61.7% 26.4% 10.6%
Procedural information
Filed under PCT 58.2% 57.3% 54.4% 48.5% 41.1%
Family size 16.01 16.19 17.99 19.07 22.19
Citation-based measures
# Forward cites 1.97 1.95 1.99 2.03 2.35
Reference-based measures
# Backward refs 3.22 3.21 3.16 3.03 2.83
X refs (% of refs) 25.6% 25.38% 25.32% 24.44% 21.56%
Y refs (% of refs) 11.3% 11.2% 11.5% 13.3% 12.5%
8
MEAN VALUES OF PATENT-BASED MEASURES BY STAGE REACHED
Bottom alignment of Source and
Notes
Top alignment of flags
(e.g. "example" etc.)
Frame (not to be filled)
Frame (not to be filled)
Frame (not to be filled)
Frame (not to be filled)
9
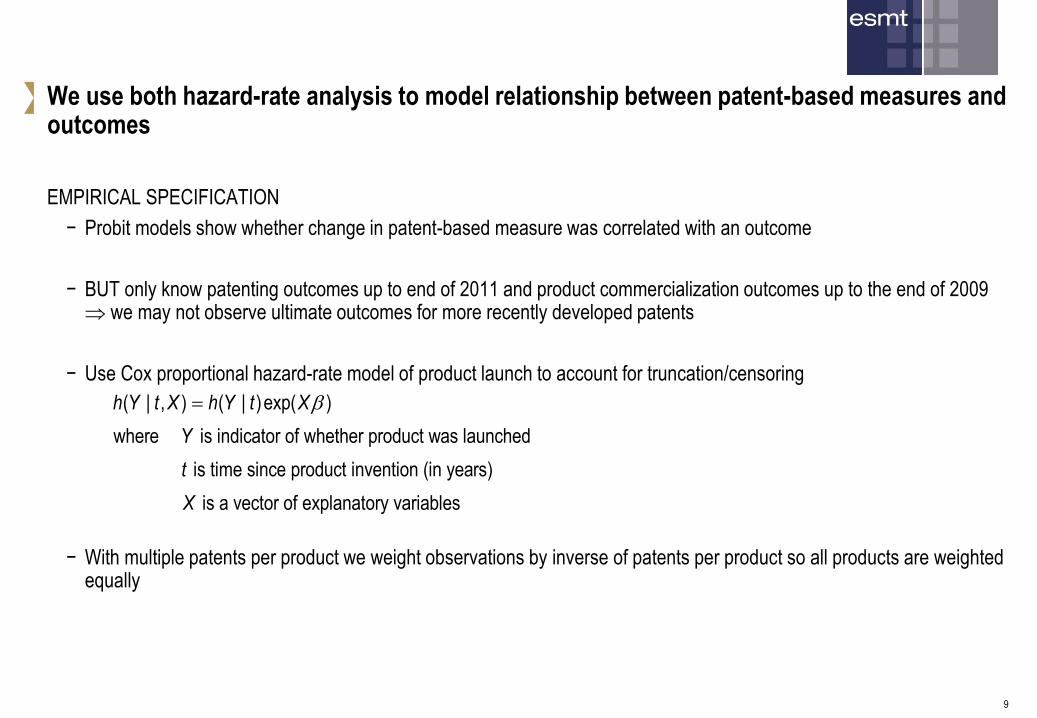
We use both hazard-rate analysis to model relationship between patent-based measures and outcomes
EMPIRICAL SPECIFICATION
− Probit models show whether change in patent-based measure was correlated with an outcome
− BUT only know patenting outcomes up to end of 2011 and product commercialization outcomes up to the end of 2009 we may not observe ultimate outcomes for more recently developed patents
− Use Cox proportional hazard-rate model of product launch to account for truncation/censoring
− With multiple patents per product we weight observations by inverse of patents per product so all products are weighted equally
( | , ) ( | )exp( )
where is indicator of whether product was launched
is time since product invention (in years)
is a vector of explanatory variables
h Y t X h Y t X
Y
t
X
Bottom alignment of Source and
Notes
Top alignment of flags
(e.g. "example" etc.)
Frame (not to be filled)
Frame (not to be filled)
Frame (not to be filled)
Frame (not to be filled)
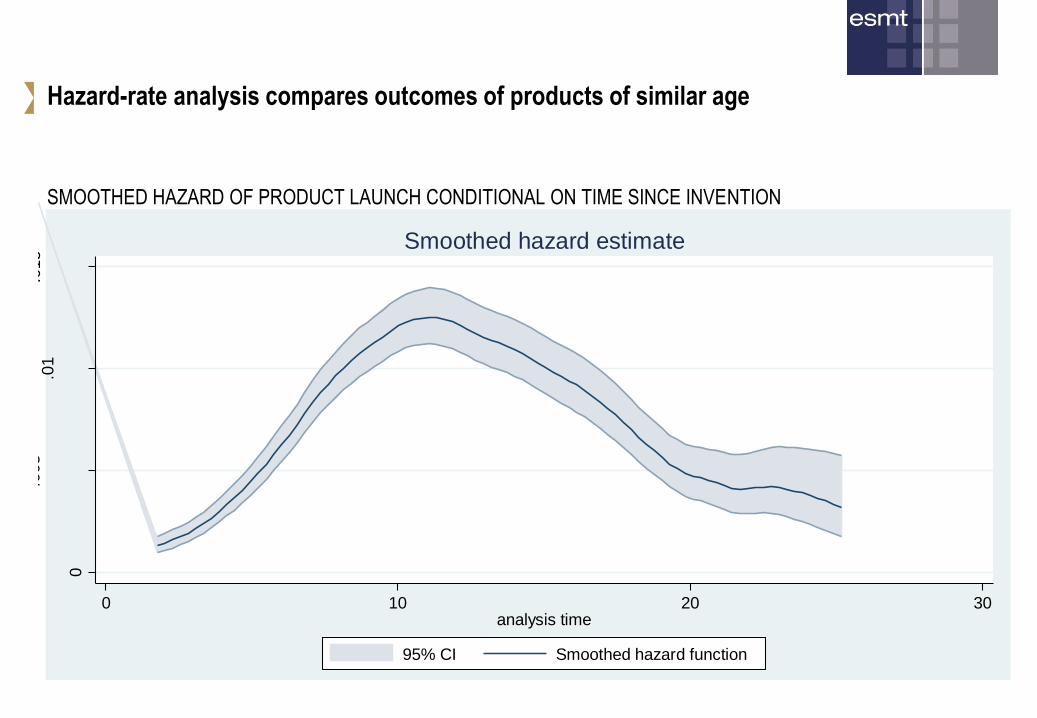
Hazard-rate analysis compares outcomes of products of similar age
SMOOTHED HAZARD OF PRODUCT LAUNCH CONDITIONAL ON TIME SINCE INVENTION
0
.005
.01
.015
0 10 20 30analysis time
95% CI Smoothed hazard function
Smoothed hazard estimate
Bottom alignment of Source and
Notes
Top alignment of flags
(e.g. "example" etc.)
Frame (not to be filled)
Frame (not to be filled)
Frame (not to be filled)
Frame (not to be filled)
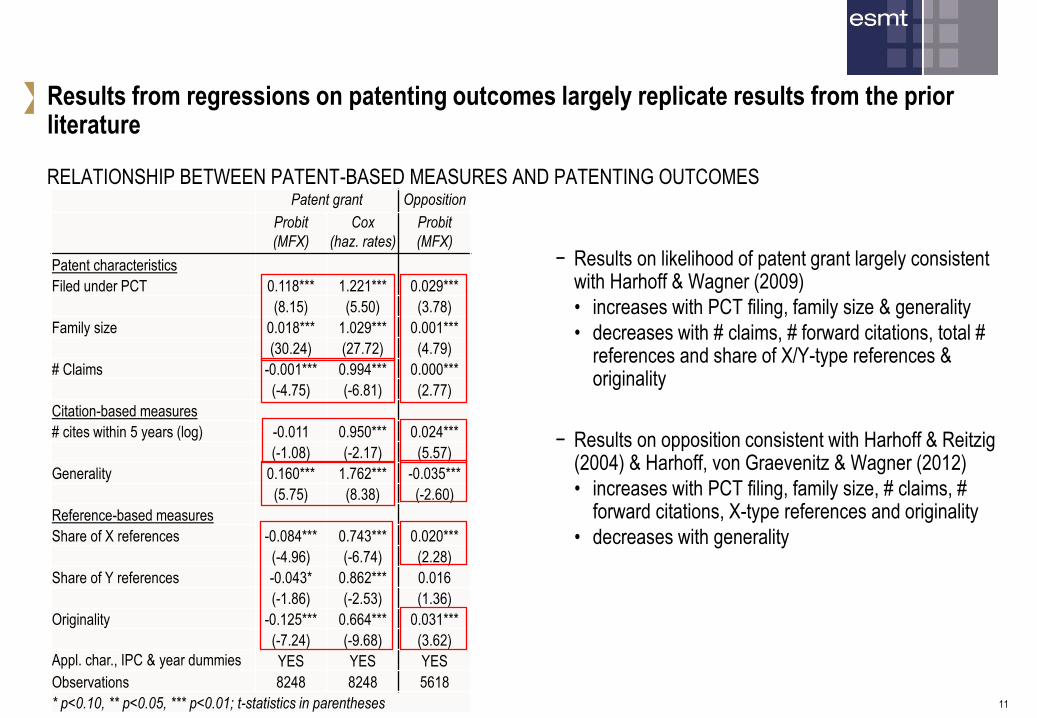
Results from regressions on patenting outcomes largely replicate results from the prior literature
RELATIONSHIP BETWEEN PATENT-BASED MEASURES AND PATENTING OUTCOMES
11
− Results on likelihood of patent grant largely consistent with Harhoff & Wagner (2009)
• increases with PCT filing, family size & generality
• decreases with # claims, # forward citations, total # references and share of X/Y-type references & originality
− Results on opposition consistent with Harhoff & Reitzig (2004) & Harhoff, von Graevenitz & Wagner (2012)
• increases with PCT filing, family size, # claims, # forward citations, X-type references and originality
• decreases with generality
Patent grant Opposition
Probit
(MFX)
Cox
(haz. rates)
Probit
(MFX)
Patent characteristics
Filed under PCT 0.118*** 1.221*** 0.029***
(8.15) (5.50) (3.78)
Family size 0.018*** 1.029*** 0.001***
(30.24) (27.72) (4.79)
# Claims -0.001*** 0.994*** 0.000***
(-4.75) (-6.81) (2.77)
Citation-based measures
# cites within 5 years (log) -0.011 0.950*** 0.024***
(-1.08) (-2.17) (5.57)
Generality 0.160*** 1.762*** -0.035***
(5.75) (8.38) (-2.60)
Reference-based measures
Share of X references -0.084*** 0.743*** 0.020***
(-4.96) (-6.74) (2.28)
Share of Y references -0.043* 0.862*** 0.016
(-1.86) (-2.53) (1.36)
Originality -0.125*** 0.664*** 0.031***
(-7.24) (-9.68) (3.62)
Appl. char., IPC & year dummies YES YES YES
Observations 8248 8248 5618
* p<0.10, ** p<0.05, *** p<0.01; t-statistics in parentheses
Bottom alignment of Source and
Notes
Top alignment of flags
(e.g. "example" etc.)
Frame (not to be filled)
Frame (not to be filled)
Frame (not to be filled)
Frame (not to be filled)
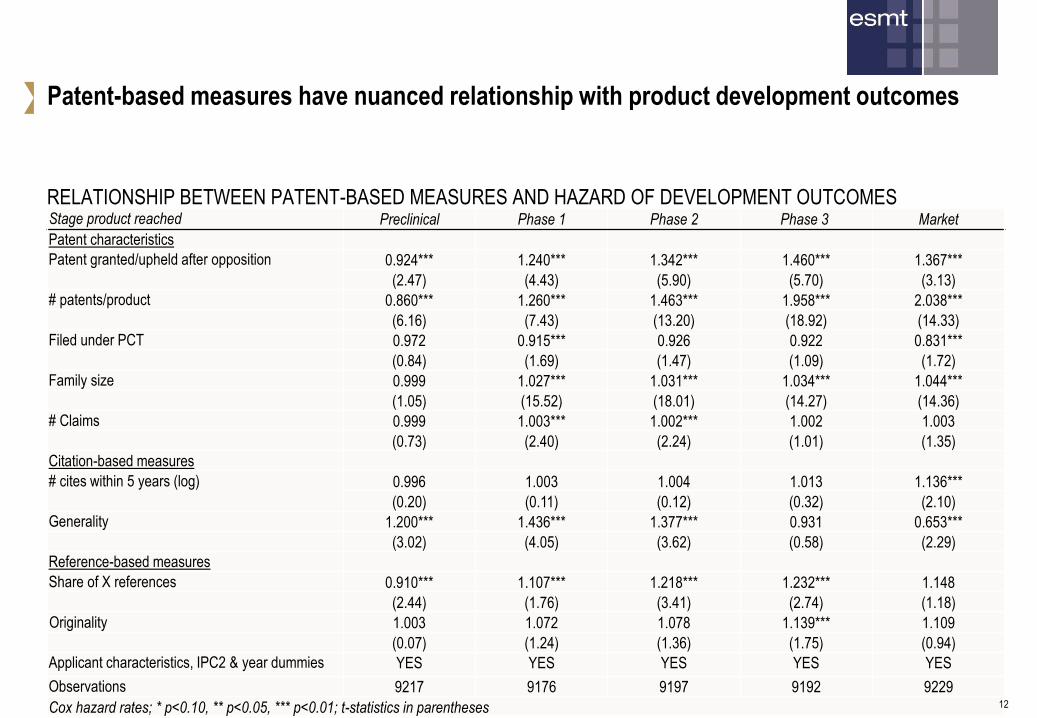
Patent-based measures have nuanced relationship with product development outcomes
Stage product reached Preclinical Phase 1 Phase 2 Phase 3 Market
Patent characteristics
Patent granted/upheld after opposition 0.924*** 1.240*** 1.342*** 1.460*** 1.367***
(2.47) (4.43) (5.90) (5.70) (3.13)
# patents/product 0.860*** 1.260*** 1.463*** 1.958*** 2.038***
(6.16) (7.43) (13.20) (18.92) (14.33)
Filed under PCT 0.972 0.915*** 0.926 0.922 0.831***
(0.84) (1.69) (1.47) (1.09) (1.72)
Family size 0.999 1.027*** 1.031*** 1.034*** 1.044***
(1.05) (15.52) (18.01) (14.27) (14.36)
# Claims 0.999 1.003*** 1.002*** 1.002 1.003
(0.73) (2.40) (2.24) (1.01) (1.35)
Citation-based measures
# cites within 5 years (log) 0.996 1.003 1.004 1.013 1.136***
(0.20) (0.11) (0.12) (0.32) (2.10)
Generality 1.200*** 1.436*** 1.377*** 0.931 0.653***
(3.02) (4.05) (3.62) (0.58) (2.29)
Reference-based measures
Share of X references 0.910*** 1.107*** 1.218*** 1.232*** 1.148
(2.44) (1.76) (3.41) (2.74) (1.18)
Originality 1.003 1.072 1.078 1.139*** 1.109
(0.07) (1.24) (1.36) (1.75) (0.94)
Applicant characteristics, IPC2 & year dummies YES YES YES YES YES
Observations 9217 9176 9197 9192 9229
Cox hazard rates; * p<0.10, ** p<0.05, *** p<0.01; t-statistics in parentheses 12
RELATIONSHIP BETWEEN PATENT-BASED MEASURES AND HAZARD OF DEVELOPMENT OUTCOMES
Bottom alignment of Source and
Notes
Top alignment of flags
(e.g. "example" etc.)
Frame (not to be filled)
Frame (not to be filled)
Frame (not to be filled)
Frame (not to be filled)
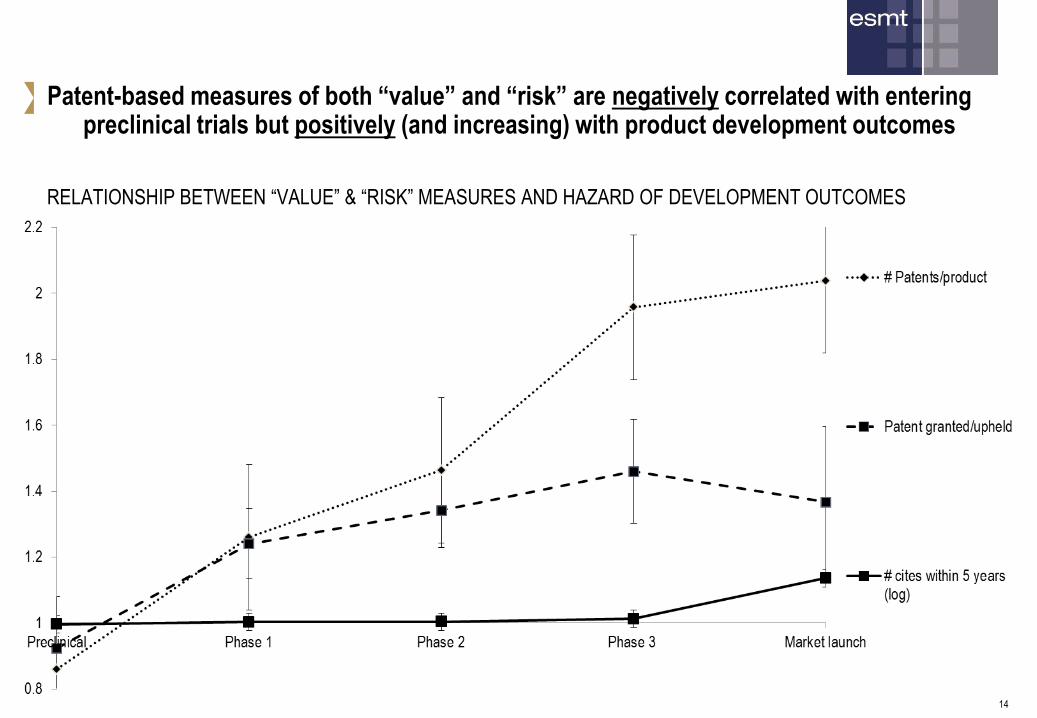
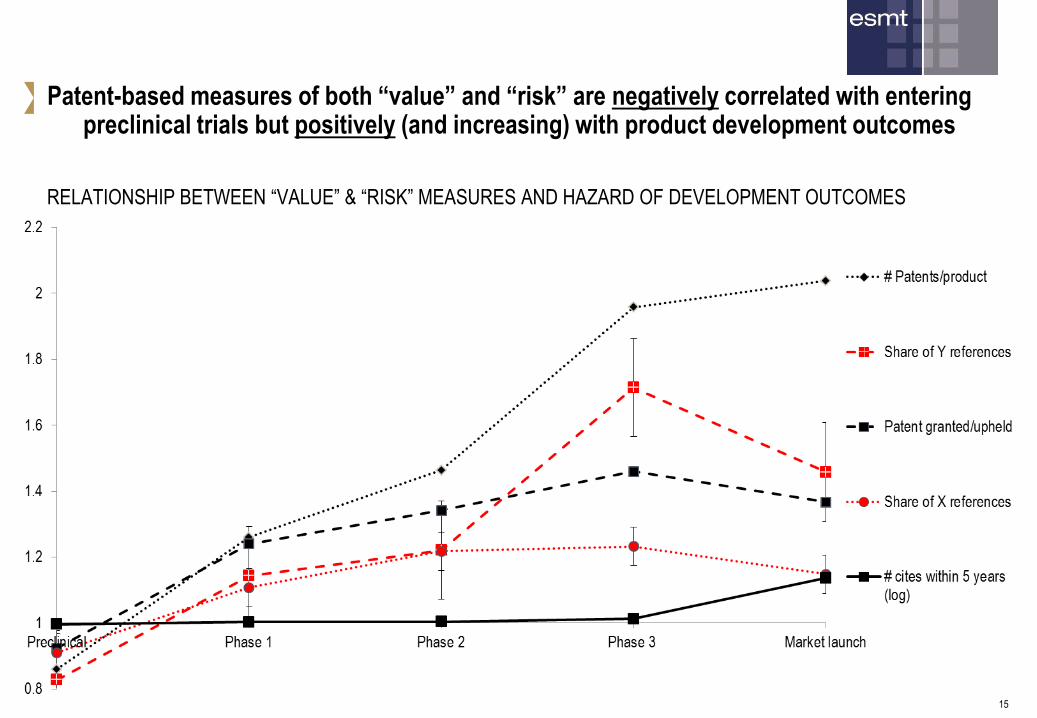
Patent-based measures of both “value” and “risk” are negatively correlated with entering preclinical trials but positively (and increasing) with product development outcomes
RELATIONSHIP BETWEEN “VALUE” & “RISK” MEASURES AND HAZARD OF DEVELOPMENT OUTCOMES
14
Bottom alignment of Source and
Notes
Top alignment of flags
(e.g. "example" etc.)
Frame (not to be filled)
Frame (not to be filled)
Frame (not to be filled)
Frame (not to be filled)
Patent-based measures of both “value” and “risk” are negatively correlated with entering preclinical trials but positively (and increasing) with product development outcomes
RELATIONSHIP BETWEEN “VALUE” & “RISK” MEASURES AND HAZARD OF DEVELOPMENT OUTCOMES
15

Bottom alignment of Source and
Notes
Top alignment of flags
(e.g. "example" etc.)
Frame (not to be filled)
Frame (not to be filled)
Frame (not to be filled)
Frame (not to be filled)
Higher generality positively correlated with entering early-stage trials but negatively correlated with product launch, while originality not correlated with product development
RELATIONSHIP BETWEEN GENERALITY & ORIGINALITY AND HAZARD OF DEVELOPMENT OUTCOMES
16 0.6
0.7
0.8
0.9
1
1.1
1.2
1.3
1.4
1.5
Preclinical Phase 1 Phase 2 Phase 3 Market launch
Generality

Bottom alignment of Source and
Notes
Top alignment of flags
(e.g. "example" etc.)
Frame (not to be filled)
Frame (not to be filled)
Frame (not to be filled)
Frame (not to be filled)
Higher generality positively correlated with entering early-stage trials but negatively correlated with product launch, while originality not correlated with product development
RELATIONSHIP BETWEEN GENERALITY & ORIGINALITY AND HAZARD OF DEVELOPMENT OUTCOMES
17 0.6
0.7
0.8
0.9
1
1.1
1.2
1.3
1.4
1.5
Preclinical Phase 1 Phase 2 Phase 3 Market launch
Originality
Generality
Bottom alignment of Source and
Notes
Top alignment of flags
(e.g. "example" etc.)
Frame (not to be filled)
Frame (not to be filled)
Frame (not to be filled)
Frame (not to be filled)
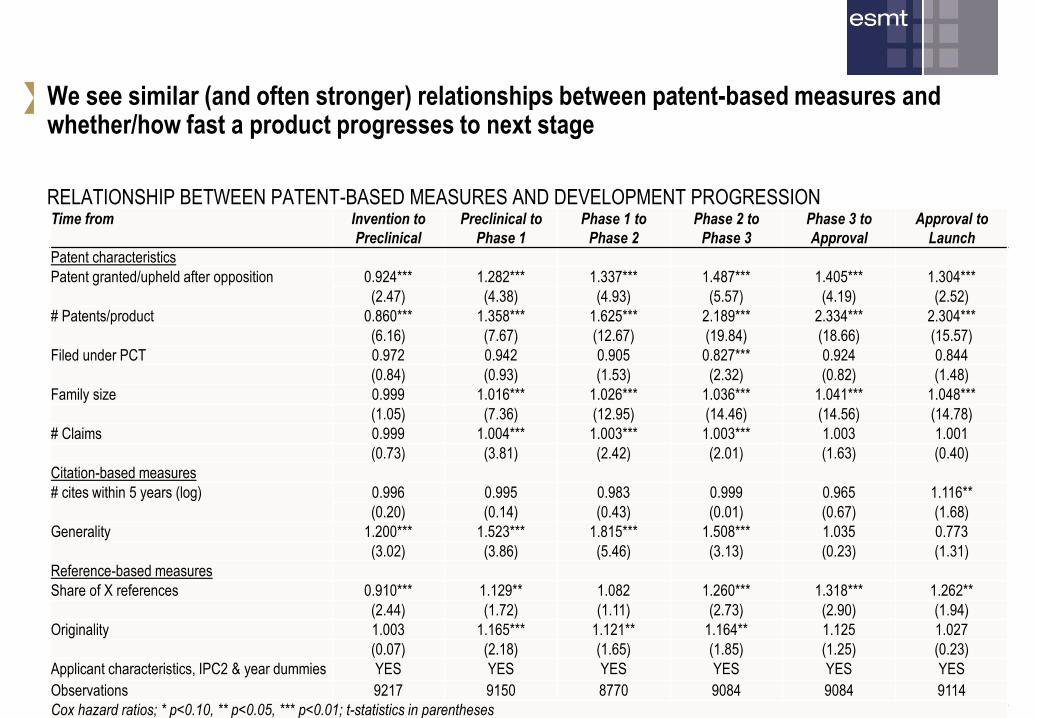
We see similar (and often stronger) relationships between patent-based measures and whether/how fast a product progresses to next stage
RELATIONSHIP BETWEEN PATENT-BASED MEASURES AND DEVELOPMENT PROGRESSION
18
Time from Invention to
Preclinical
Preclinical to
Phase 1
Phase 1 to
Phase 2
Phase 2 to
Phase 3
Phase 3 to
Approval
Approval to
Launch
Patent characteristics
Patent granted/upheld after opposition 0.924*** 1.282*** 1.337*** 1.487*** 1.405*** 1.304***
(2.47) (4.38) (4.93) (5.57) (4.19) (2.52)
# Patents/product 0.860*** 1.358*** 1.625*** 2.189*** 2.334*** 2.304***
(6.16) (7.67) (12.67) (19.84) (18.66) (15.57)
Filed under PCT 0.972 0.942 0.905 0.827*** 0.924 0.844
(0.84) (0.93) (1.53) (2.32) (0.82) (1.48)
Family size 0.999 1.016*** 1.026*** 1.036*** 1.041*** 1.048***
(1.05) (7.36) (12.95) (14.46) (14.56) (14.78)
# Claims 0.999 1.004*** 1.003*** 1.003*** 1.003 1.001
(0.73) (3.81) (2.42) (2.01) (1.63) (0.40)
Citation-based measures
# cites within 5 years (log) 0.996 0.995 0.983 0.999 0.965 1.116**
(0.20) (0.14) (0.43) (0.01) (0.67) (1.68)
Generality 1.200*** 1.523*** 1.815*** 1.508*** 1.035 0.773
(3.02) (3.86) (5.46) (3.13) (0.23) (1.31)
Reference-based measures
Share of X references 0.910*** 1.129** 1.082 1.260*** 1.318*** 1.262**
(2.44) (1.72) (1.11) (2.73) (2.90) (1.94)
Originality 1.003 1.165*** 1.121** 1.164** 1.125 1.027
(0.07) (2.18) (1.65) (1.85) (1.25) (0.23)
Applicant characteristics, IPC2 & year dummies YES YES YES YES YES YES
Observations 9217 9150 8770 9084 9084 9114
Cox hazard ratios; * p<0.10, ** p<0.05, *** p<0.01; t-statistics in parentheses
Bottom alignment of Source and
Notes
Top alignment of flags
(e.g. "example" etc.)
Frame (not to be filled)
Frame (not to be filled)
Frame (not to be filled)
Frame (not to be filled)
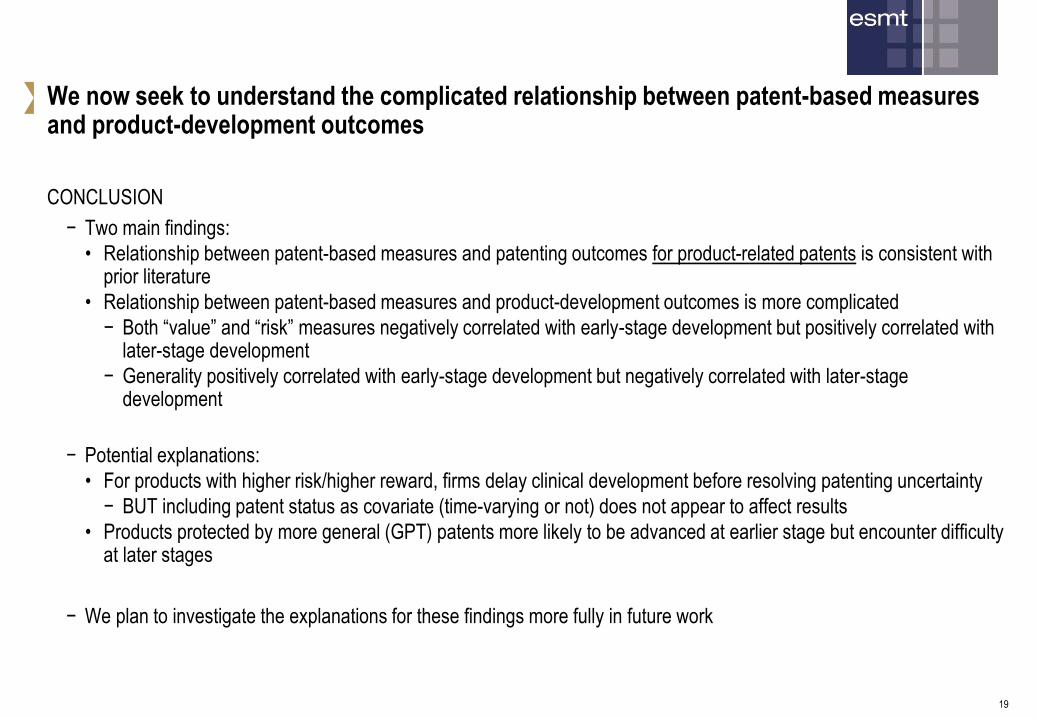
We now seek to understand the complicated relationship between patent-based measures and product-development outcomes
CONCLUSION
− Two main findings:
• Relationship between patent-based measures and patenting outcomes for product-related patents is consistent with prior literature
• Relationship between patent-based measures and product-development outcomes is more complicated
− Both “value” and “risk” measures negatively correlated with early-stage development but positively correlated with later-stage development
− Generality positively correlated with early-stage development but negatively correlated with later-stage development
− Potential explanations:
• For products with higher risk/higher reward, firms delay clinical development before resolving patenting uncertainty
− BUT including patent status as covariate (time-varying or not) does not appear to affect results
• Products protected by more general (GPT) patents more likely to be advanced at earlier stage but encounter difficulty at later stages
− We plan to investigate the explanations for these findings more fully in future work
19